Work-life Balance Practices and the Gender Gap in Job ...ftp.iza.org/dp3582.pdf · Work-Life...
39
IZA DP No. 3582 Work-Life Balance Practices and the Gender Gap in Job Satisfaction in the UK: Evidence from Matched Employer-Employee Data Mohammad Niaz Asadullah Rosa M. Fernández DISCUSSION PAPER SERIES Forschungsinstitut zur Zukunft der Arbeit Institute for the Study of Labor July 2008
Transcript of Work-life Balance Practices and the Gender Gap in Job ...ftp.iza.org/dp3582.pdf · Work-Life...

IZA DP No. 3582
Work-Life Balance Practices and the Gender Gapin Job Satisfaction in the UK: Evidence fromMatched Employer-Employee Data
Mohammad Niaz AsadullahRosa M. Fernández
DI
SC
US
SI
ON
PA
PE
R S
ER
IE
S
Forschungsinstitutzur Zukunft der ArbeitInstitute for the Studyof Labor
July 2008
Work-Life Balance Practices and the
Gender Gap in Job Satisfaction in the UK: Evidence from Matched
Employer-Employee Data
Mohammad Niaz Asadullah University of Reading,
SKOPE, University of Oxford and IZA
Rosa M. Fernández SKOPE, University of Oxford
Discussion Paper No. 3582 July 2008
IZA
P.O. Box 7240 53072 Bonn
Germany
Phone: +49-228-3894-0 Fax: +49-228-3894-180
E-mail: [email protected]
Any opinions expressed here are those of the author(s) and not those of IZA. Research published in this series may include views on policy, but the institute itself takes no institutional policy positions. The Institute for the Study of Labor (IZA) in Bonn is a local and virtual international research center and a place of communication between science, politics and business. IZA is an independent nonprofit organization supported by Deutsche Post World Net. The center is associated with the University of Bonn and offers a stimulating research environment through its international network, workshops and conferences, data service, project support, research visits and doctoral program. IZA engages in (i) original and internationally competitive research in all fields of labor economics, (ii) development of policy concepts, and (iii) dissemination of research results and concepts to the interested public. IZA Discussion Papers often represent preliminary work and are circulated to encourage discussion. Citation of such a paper should account for its provisional character. A revised version may be available directly from the author.

IZA Discussion Paper No. 3582 July 2008
ABSTRACT
Work-Life Balance Practices and the Gender Gap in Job Satisfaction in the UK:
Evidence from Matched Employer-Employee Data*
This paper examines the role of work-life balance practices (WLB) in explaining the “paradox of the contented female worker”. After establishing that females report higher levels of job satisfaction than men in the UK, we test whether firm characteristics such as WLB and gender segregation boost the satisfaction of women proportionately more than that of men, thereby explaining why the former are reportedly happier. The results prove that WLB practices increase the likelihood of reporting higher satisfaction but similarly for both demographic groups thereby reducing the gender gap in job satisfaction only slightly. Still, the results indicate that WLB practices at the forefront of worker welfare policy improve the wellbeing of the workforce. Experiments with firm-fixed effects allowed by the matched dimension of the data reveal that firm effects are relevant but they only explain a half of the gender gap in job satisfaction, suggesting that the other half may be due to individual heterogeneity. JEL Classification: C13, J16, J28, J71 Keywords: job satisfaction, work-life balance practices, gender segregation,
matched employer-employee data Corresponding author: Rosa Fernandez ESRC Centre on SKOPE Department of Economics University of Oxford, OX1 3UQ United Kingdom E-mail: [email protected]
* We would like to thank participants at the Labour Economics Seminar in Oxford, the Monday Seminar at ISER (Essex), the European Association of Labour Economics (EALE) conference in Oslo, the Royal Economic Society conference in Nottingham and especially the LoWER Conference “What Works for Women” for comments and suggestions. The editor and two anonymous referees provided invaluable insights into the earlier version of the paper. This paper benefited from the preliminary release of the WERS 2004 datasets. We thank the WERS Sponsors – the Department of Trade and Industry, the Economic and Social Research Council, the Advisory, Conciliation and Arbitration Service, and the Policy Studies Institute – for allowing early access to the data. They are not responsible for any of the findings or claims made in the paper. The data was downloaded from the UK-Data Archive at the Economic and Social Data Service.

1 Introduction Despite criticism of subjectivity the analysis of job satisfaction is a growing area within labour economics, not least because of the conventional wisdom that (other things equal) a happier worker is a better worker. This paper revisits one of the better known empirical regularities in the field branded the “paradox of the contented female worker”. The paradox refers to the observation that in some countries, notably the US and the UK, females report on average higher levels of job satisfaction than men, despite the fact that females are on average worse-off in the labour market in terms of pay and working conditions (Clark, 1997; Sousa-Poza and Sousa-Poza, 2000). The contribution of this paper is to address the role of firm characteristics, notably the presence of work-life balance (WLB)1 policies and the degree of gender segregation at the workplace, explaining observed differences in reported levels of job satisfaction between males and females in the UK. This choice of firm characteristics responds to our interest in the paradox of the contented female worker. It is common knowledge that women are over-represented in certain occupations (Connolly and Gregory, 2008) and atypical contracts (Petrongolo, 2004). It has also been suggested that the observed gender segregation may be voluntary as women seek non-pecuniary benefits, such as flexible hours (Booth and Van Ours, 2008) due to family responsibilities. If women were to select themselves into jobs that offer WLB policies and this was the main reason why women appear observationally happier (Pezzini, 2005) then removing the impact of these policies from reported satisfaction ought to make males and females more equally satisfied (Bender et al. 2005). In this paper we test whether the presence of WLB practices and gender segregation boost the job satisfaction of females proportionally more that that of men and therefore help explain the observed gender differential in reported job satisfaction in the UK. The already sizeable literature on the determinants of job satisfaction has so far been unable to establish that it is selection into certain jobs that drives the gender gap in job satisfaction. Using the 1986 Social Change and Economic Life Initiative (SCELI) Sloane and Williams (2000) find that at the margin were women to hold men’s jobs, they would
1 The difference between work-life balance practices and family friendly policies is subtle. Public institutions appear to suggest that work-life balance extends beyond family friendly practices. See for example the Chartered Institute for Personnel and Development (cipd.co.uk). In this paper we underwrite this definition.

be as little satisfied as men are, thereby implying that self-selection may be driving the gender gap in job satisfaction. On the other hand, using propensity score matching to define a comparable control group among the males in the British Household Panel Study, Sanz de Galdeano (2001) reached the opposite conclusion, that self-selection is not an important factor in explaining the higher job satisfaction of women. Other studies that use panel data can purge away unobserved individual effects but they have access to limited information on workplace characteristics (Heywood et al. 2002; Ferrer-i-Carbonell, 2005; Booth and Van Ours, 2008). As a result these studies are unable to control for the fact that certain workers (e.g. female) could select into particular jobs conditional upon firm characteristics observed by the workers but not by the researchers. Missing data on firm characteristics therefore remains a possible reason for selection bias. Gender differences in the estimates of a job satisfaction equation may be picking up the effect of firm characteristics such as WLB practices for which data is usually not available. This paper aims at filling in this gap in the literature by looking at the relative impact of relevant firm characteristics across gender groups. Should the gender gap in job satisfaction be caused by some process of selection of workplace, we should observe a weakening of the job satisfaction gap once the sought after firm characteristics have been taken into account. In this process we also revisit the effect of gender segregation of the workplace which may result from workplace selection by females (Bender et al, 2005; Evans, 2002). Understanding what is driving the observed gender gap in job satisfaction the UK is a relevant policy question since this gender gap is not found in other EU countries, which in the context of the common market share a relatively transnational labour force. It is beyond the scope of this paper to ascertain whether job satisfaction is a factor in labour mobility within the EU (Freeman, 1978), but if certain firm policies were found to have an impact on the reported job satisfaction2, changes in these practices at the firm or even the national level could inform policy aimed at improving the wellbeing of the workforce (Hayward et al. 2007). Potentially, differences in these policies could explain cross-country variations in the gender gap in job satisfaction to some extent (Pezzini, 2005). More importantly, there is evidence that wellbeing and satisfaction of workers is on the decline in Britain (Gardner and Oswald 2002; Sousa-Poza and Sousa-Poza, 2003; Green
2 Work-Life Balance practices have been recently found to bring about benefits in terms of productivity and economic performance, see White et al, 2003 and Bloom et al 2006.

and Tsitsianis, 2004) calling for a better understanding of the possibility of improving wellbeing using non-pecuniary factors. The results show that WLB practices improve the reported job satisfaction of male and female workers alike and hence they do not explain the gender gap in job satisfaction completely. These benefits of WLB practices in terms of worker satisfaction extend to intrinsic (autonomy) and extrinsic (pay) dimensions of job satisfaction and they are independent of the composition of the workforce. Policies that encourage the use of these practices to boost wellbeing of the workforce are therefore justified to result in reportedly happier workers. Additional tests carried out to ascertain the role of firm characteristics in explaining the gender gap in job satisfaction suggest that about a half of the remaining gap is explained by firm fixed effects, leaving unobserved individual heterogeneity as the most probable cause for the remaining gap. The remainder of the paper is organized as follows. Section 2 presents the data and the distribution of various dimensions of job satisfaction across firms and their workers. Section 3 explains the methodological steps we take to test our hypothesis. Section 4 reports the main results from our empirical analysis. Section 5 explores reasons for the remaining gender gap in job satisfaction. Some concluding remarks are presented in the last section.
2 Data description We use the UK’s 2004 Workplace Employee Relations Survey (WERS04 henceforth). A matched employer-employee dataset that with the appropriate weighting is representative of establishments and the population working in establishments larger than 5 employees not in sectors A-C and P-Q of the 2003 Standard Industrial Classification3 (Chaplin et al. 2005). This is the last wave of a survey on Industrial Relations carried out periodically in the UK since 1980 (http://www.wers2004.info/). The unit of analysis is the sampled employees in each establishment of which there are on average 12 per establishment. The aim of this paper is to highlight the importance of certain firm policies in explaining the gender gap in job satisfaction observed in the UK. This study is therefore made possible by specific data on management practices collected through the WERS survey.
3 These are respectively Agriculture, Fishing, Mining and Quarrying, Private Households with Employed persons and Extra-territorial Bodies.

The underlying argument is that females select themselves into workplaces that offer WLB benefits and for this reason they report higher levels of job satisfaction than men and appear over-represented in some workplaces. Using WERS allows us to control for the availability of 5 different WLB policies4 as well as for the gender composition of the workplace. These firm characteristics are generally not accounted for in surveys based on individual data and we describe them in more detail below. As a robustness test for the 2004 results we run comparable estimations using the previous cross-sectional survey of WERS carried out in 1998, with the same sampling procedures except that the WERS98 was representative of workplaces larger than 10 employees (Cully et al, 1999). In the absence of a panel element in the data5, we can interpret differences in the estimated gender gap in job satisfaction between the two cross-sections as follows. Consider the impact of WLB practices on gendered job satisfaction in each year: if the take up of these practices was more prevalent in 2004 and these practices were causing proportionally higher satisfaction in women, the expansion of WLB practices over time should result in a reduction in the gender gap in job satisfaction. Should the gender gap remain the same with and without controlling for WLB practices, there would be evidence that satisfaction is driven by possibly unobservable individual rather than observable firm characteristics. The matched employer-employee nature of WERS brings another advantage since it makes it possible to ascertain how important firm effects are in explaining relative job satisfaction across gender. In 2004 the employee survey asks workers to rate their level of satisfaction with respect to seven aspects of their employment: (1) amount of pay you receive; (2) amount of influence over your job; (3) sense of achievement you get from work; (4) scope for using your own initiative; (5) the training you receive; (6) you job security (7) the work itself. Each of these is assigned a rank between 1 and 5, with 1 representing ‘Very satisfied’, although for ease of interpretation the scale will henceforth be inverted so that higher values represent more satisfaction. WERS 1998 overlaps only with the first three dimensions of job satisfaction. In the absence of a question on overall job satisfaction, as available for example in the British Household Panel Study, we would like to focus on 4 These are flexi-time, job-share, working from home, having parental paid and having a nursery in the workplace. 5 Although there is a panel survey of a subsample of the 2004 establishments that were also surveyed in 1998, the panel survey did not interview employees and therefore we have no information on changes in job satisfaction in the panel sub-sample.

dimension (7) satisfaction with the work itself6. However this precludes comparison of the results across cross-sections and it is also conventionally accepted that job satisfaction is a complex concept. Therefore the analysis will also follow dimensions (1) satisfaction with pay and (2) satisfaction with influence over your job (which we call autonomy) in 1998 and 2004. A first look at the distribution of the different dimensions of job satisfaction across gender is presented in Table 1. Satisfaction with the work itself scores the highest of the three in 2004 for males and females. Satisfaction with pay is lowest in both years compared with satisfaction with autonomy (degree of influence over job). Although there is some evidence of declining satisfaction for women, these differences are not statistically significant. [Table 1 around here] A more detailed picture of the distribution of satisfaction across gender for diverse aspects of satisfaction is presented in Table 2 and this is also inconclusive so as to a definite trend over time for either males or females. It is however worth mentioning that the female distribution is slightly more skewed than the male one towards being “satisfied” with pay and autonomy, and that the proportion of respondents falling into this category is larger in the case of satisfaction with autonomy. [Table 2 around here] Tables 1A and 2A in the appendix present the full descriptive statistics of the data. Most of the individual level data is standard information concerning the worker and the working position. Compared to studies based on other datasets we are disadvantaged in that the WERS data on age, tenure and wages is categorical instead of a continuum. These categorical variables were linearised choosing the middle point in each segment. Since these have been the object of studies elsewhere7 we think we are not losing much information with these approximations.
6 Sloane and Williams (2000) show that satisfaction from work accounts for most of the overall job satisfaction. Rose (2005) claims that this variable captures better intrinsic aspects of satisfaction, as opposed to more extrinsic aspects such as satisfaction with pay or with hours. 7 See for example Bender and Heywood (2006) and Sloane and Ward (2001).

More relevant for our purposes is the set of WLB policies as reported by the employee Although some degree of misreporting may be possible (Budd and Mumford, 2005), it is unlikely that unknown policies would affect individual satisfaction, in which case misreporting would not have an impact on the conclusions of this study8. We restrict the analysis to WLB practices that are available in both years. These include: (1) flexi-time (discretion over start and leave timings) (2) job-share (sharing a full-time job with someone else) (3) working from home (4) having parental paid leave (over and above the statutory) (5) having a nursery in the workplace or help with child care. Comparing the descriptive statistics regarding these variables it is apparent that flexi-time is the most prevalent of all the practices, reported available by over one third of the sample and it is unsurprisingly also more common among women. Job-sharing and parental paid leave are the next most popular WLP practices with the latter being much more predominant in 2004 than in 1998. Interestingly working from home is the one practice that is more prevalent among the male population. Finally, selection into workplaces that offer non-pecuniary benefits such as WLB ought to bring about gender segregation and women ought to appear reportedly happier in these workplaces. We capture this possibility using the percentage of females among the workforce as reported by managers. Gender segregation is visible through the higher representation of men in workplaces with less than 25% females (44%) and vice versa for females, who are mostly (70%) employed in workplaces where more than half the workforce is female. This pattern is observed in both years while the situation appears static regarding changes in the distribution of males and females across gender segregated workplaces. Chart 1 illustrates the relationship between reported job satisfaction and gender segregation in 2004. If gender segregation was preferred we should observe a U shape pattern in reported satisfaction, indicating that the extremes are better than the averages. This is observed for the more intrinsic aspects of job satisfaction such as the work itself or autonomy but not with the extrinsic aspect of pay. Irrespective of segregation and gender however, reported satisfaction is highest with the work itself and lowest with pay. The female series (squares) lies above the male one (triangles) in most cases, confirming the prior that females are comparatively more contented than males on average.
8 We are grateful to one referee for pointing this out to us.

[Chart 1 around here] 3 Methodology and Estimation Most existing studies of reported satisfaction use individual level data and typically one of two methodologies (Ferrer-i-Carbonell and Frijters, 2004). The approach favoured by psychologists assumes that satisfaction is a monotonic transformation of an underlying personal trait called “welfare” and because of continuity not only the levels but also differences in reported satisfaction are meaningful measurable magnitudes. These types of models can be estimated by OLS under the standard assumptions and whenever a panel or matched dimension are available fixed effects can be purged away through differencing over the relevant variable9. Economists tend to think of utility as an ordinal rather than cardinal magnitude and therefore the observed general satisfaction indicates that the latent welfare variable falls within a certain interval. That is, we observe general satisfaction (JSi) being k=1…n (where n is the number of categories of satisfaction permitted) whenever the underlying utility falls within two contiguous ranks:
* *i 1i i i k i kJ X and JS k iff rank JS rankβ ε += + = < < , (1) S
where the errors and explanatory variables in the latent utility equation are orthogonal and an asterisk indicates unobserved variables. These are typically estimated as an ordered probit and unless the number of ranks is limited to two, corrections for fixed effects yield inconsistent estimates (Maddala, 1983, Ferrer-i-Carbonell and Frijters, 2004). In this paper, the model specification follows standard economic practice: we express the probability that a person reports job satisfaction in rank k as a function of personal characteristics, firm characteristics and an error term:
iiiii FXGenderFXkJSP εγβα +++== ),/( (2) Where we explicitly consider the possibility of a gender effect and we use a simple notation to separate variables that refer to the individual (Xi) from variables that refer to
9 For a detailed description of the biases generated by not accounting for all the relevant fixed effects see Abowd and Kramarz, 1999.

the firm (Fi). Individual level variables include age, education, union membership and health status as well as other variables that are particular to the job such as hours worked, pay, tenure and occupation. Firm level variables include size, sector of activity and crucially the presence of WLB practices and the extent of gender segregation. We first establish the presence of a gender gap in job satisfaction after controlling for standard correlates used elsewhere in the literature but before considering WLB and gender segregation. We call this the “raw” gender gap in job satisfaction that remains after including all blocks of variables in Tables A1 and A2 except for the last two blocks. By including the firm characteristics of interest in a stepwise manner we can ascertain what impact, if any, they have in the gender gap in job satisfaction, and any correlation between the additional controls. We estimate pooled and separate regressions for males and females. This is important for the purposes of interpretation: the pooled regression imposes the restriction that males and females draw utility from the explanatory variables in an identical fashion, while being a female would simply shift the common utility function upwards. By allowing the coefficients to differ across gender we let these two groups have different utility functions regarding job and workplace characteristics Cross-sectional specifications like the one we are bound to use are convenient in order to identify what individual or firm characteristics matter for job satisfaction but they have the disadvantage that they cannot control fully for unobserved heterogeneity. Unlike existing studies using individual-level data we have the advantage of matched employer-employee dataset that allows us to purge firm effects away from the observed gender gap in job satisfaction. In doing this however we lose the ability to pinpoint which firm characteristics are making employees happier. Still, we are aware that selection of otherwise happier workers in certain firms could bias the results and to somewhat illustrate whether firm selection is important we carry out relevant tests for the importance of firm effects after looking at WLB practices and gender segregation. A final step in our analysis is to try and obtain a more aggregate but still meaningful indicator of the extent to which a workplace or a job offers work-life balance. We build two intuitive measures of workplace flexibility that combine the five WLB practices using the weights obtained from undertaking factor analysis. Interestingly, the first factor that we call “Flexibility” gives largest weights to the practices of flexi-time, job-share and work from home. The second factor that we call “Family” gives the largest weights to paid parental leave and having nursery facilities. To control for the possible correlation
across the WLB components, factor loadings were rotated using an oblique rotation and the internal consistency of the resulting factors was evaluated using the Cronbach Alpha coefficient scores. The reliability is higher for the first factor (flexibility) albeit not great 0.45 but the correlation of the factor scores with the Alpha is high (0.87). The reliability of the second factor (family) is much lower and so is the correlation of the factor score and the Alpha score (0.62). There are small differences in the results of the factor analysis in the two years so these concerns should be borne in mind when interpreting the results.
4 Job satisfaction, gender segregation and family friendly policies We report in this section the results of fitting an ordered probit model to the data on individual workers in each of the two cross-sections. The model specification includes all variables reported in Tables A1 and A2 respectively for the 2004 and 1998 samples, although only a selection of coefficients will be commented upon. The non reported coefficients10 have been highlighted in previous research and conform to existing conventional wisdom. The following are also robust to the various specifications we use and for the most part the same results are reproduced for the two years. In general we find that hours worked are negatively correlated with all three dimensions of job satisfaction we consider (Booth and Van Ours, 2008), being largest in size the negative impact on satisfaction with pay and smallest when considering satisfaction with the work itself. Pay on the other hand appears to increase satisfaction while magnitudes are again largest when looking at the pay dimension and smallest with satisfaction with the work itself (Sloane and Williams, 2000; Groot and Maassen van de Brink, 1999). Education and tenure are both associated with lower job satisfaction along the three dimensions we consider, with dissatisfaction increasing with the level of education (Bender and Heywood, 2006). Union members are notably known for being less contented than non-union workers (Clark, 1997; Bryson et al. 2004), while there is some patchy evidence of a U shape between age and satisfaction in 2004 but not in 1998 (Sloane and Ward, 2001). Unsurprisingly suffering from some illness reduces significantly the likelihood of reporting high satisfaction while having a permanent or a fixed term contract are both associated with lower satisfaction with pay but not with lower satisfaction with autonomy or the work itself. Workers of larger firms are reportedly less contented only in 2004. Note finally that occupational and sectoral dummies are included in all specifications.
10 A full set of results is available in the working paper soon to appear at IZA

4a Satisfaction with the work itself Table 3 reports the results for satisfaction with the work itself in the 2004 cross-section. The results are remarkable. A gender gap remains after controlling for all individual characteristics, firm size and sector of activity. In specification (2) in the full sample, a sizeable gender gap in job satisfaction remains despite the fact that all WLB practices except nursery facilities are positively correlated with job satisfaction, increasing average satisfaction by between 0.05 and 0.2 standard deviations depending on which practice is considered. There are some small differences in the job satisfaction equation for males and females with the former drawing satisfaction from nursery facilities and neither displaying a significant impact of job-share on reported satisfaction. All in all, it appears that WLB practices are not disproportionately more important for females than for males and hence why the presence of these policies does not wash the gender gap in job satisfaction away. Neither does gender segregation explain away the relative happiness of females at work. Although there is some evidence that completely segregated workplaces aid reported satisfaction with the work itself in column (5) this is only the case for males. This aspect of satisfaction appears to be independent of gender segregation for females. More importantly, including both sets of explanatory variables has virtually no impact on the results so the presence of WLB practices and gender segregation have largely independent effects on reported job satisfaction. Interestingly, when using aggregate measures of WLB only the factor Flexibility, encompassing a somewhat flexible working schedule, appears to improve reported job satisfaction by around 0.25 standard deviations without interfering with gender segregation. Note finally that the gender gap in job satisfaction remains sizeable.
4b Satisfaction with pay Table 4 presents the results for satisfaction with pay for the 2004 cross-section. The corresponding Table for 1998 is in the appendix marked A3. The raw gap in job satisfaction in column (1) is of comparable size to that obtained from satisfaction with the work itself in 2004. Note however that the same raw gap was double in size six years earlier. WLB practices play a clear larger role in satisfaction with pay in both years but still insufficient to eliminate the raw gap across gender in any year. Both the male and female sub-samples draw substantial utility from all WLB practices, except for nursery facilities. Still, women remain on average 0.12 and 0.3 standard deviations happier than

men in 2004 and 1998 respectively. Gender segregation in the workplace appears largely irrelevant for satisfaction with pay in both years. This is unsurprising since earnings are controlled for in all specifications and any penalties associated with being in female dominated occupations (Connolly and Gregory, 2008) have been purged away with the pay and occupation controls. Once again, combining the presence of WLB practices and gender segregation has no impact on the relative importance of one another or on the prevailing gender gap in job satisfaction. Since the gender gap appears to halve by 2004 irrespective of which firm characteristics we consider, there is evidence that there are reasons other than the ones considered in this paper driving the evolution of the gender gap in job satisfaction over time (Sousa Poza and Sousa Poza, 2003). Using the indices obtained through factor analysis reveals an interesting pattern though. It seems that the flexibility measure has a significant positive impact on average satisfaction. On the other hand, the family factor has the opposite effect, although the latter is smaller and insignificant in the male sub-sample. It therefore seems that flexibility in location and schedule are important determinants of satisfaction with pay. These policies are somewhat closer to the so called work-life balance practices than what one could call strictly family friendly policies and it is also apparent that the former apply to men as much as to women. It is also conceivable that the components of the family factor, paid leave and help with childcare costs, are perceived as “being discounted” from take-home pay and therefore they reflect negatively on subjective well-being. In stark contrast with these findings, it appears that in 1998 only family related policies mattered for satisfaction with pay and they had a positive impact on it. The descriptive statistics in Tables A1 and A2 show a clear shift in the presence of family friendly policies away from parental leave and towards job-share and working from home practices. It is thus plausible that unobserved factors connected to the reasons why this shift has not occurred in some workplaces make respondents in these workplaces unhappier. It is important to bear in mind however that the Cronbach Alpha’s diagnose test showed a much lower reliability score for the family factor than for the flexibility factor (0.25 compared to 0.47 respectively) and the correlation of the family factor with the corresponding Alpha is also low calling for some caution in interpreting the results. 4c Satisfaction with Autonomy

Tables 5 and 4A display the results corresponding to the analysis of the satisfaction with autonomy dimension for 2004 and 1998 respectively. The first observation worth highlighting is the noticeably smaller raw gap between males and females and the fact that this gap has also approximately halved between 1998 and 2004. Satisfaction with autonomy therefore appears to capture a somewhat different aspect of job satisfaction which is also declining proportionately more for women than for men, suggesting that more work on the determinants of the gender gap is needed. Of the five WLB practices considering, flexi-time and being allowed to work from home have disproportionately larger correlations with satisfaction with autonomy, of the order of 0.3 standard deviations average impact of reported satisfaction, compared to 0.09 of having paid parental leave. To the extent that a flexible working schedule reflects higher autonomy this finding is reassuring. There is some patchy evidence that completely segregated workplaces are preferred for autonomy in column (5) but this pattern is not reflected clearly in the gendered sub-samples. As before WLB practices and gender segregation in the workplace have largely independent, if any, effects on satisfaction with autonomy. When aggregate measures of WLB practices are considered, the same pattern as with pay re-appears, namely that flexibility improves satisfaction with autonomy in 2004 while family policies worsen this perception. Curiously, the opposite pattern is observed in 1998 suggesting that the same cautions and endogeneity issues as with pay may be at work.
5 Robustness and Sensitivity Tests The results in the previous section indicate that WLB practices impact on various aspects of job satisfaction, that they do so differently for males and females and always independently of the degree of gender segregation in the workplace. Furthermore these effects are not large enough to explain the paradox of the contented female worker, since the gender gap in job satisfaction remains after appropriate control for these firm characteristics. In this section we report the results of various robustness checks on the previous findings. To check the importance of worker selection into firms, we estimated models of job satisfaction with firm fixed effects using OLS techniques and found that most individual variables retain their importance individually and collectively (joint in-significance test rejected at 0.1% level) and that the gender gap in job satisfaction remains, although it is

reduced by around a half. Estimating an ordered probit with firm fixed effects is ostensibly criticised in the literature because unless the number of observations per firm is very large it obtains inconsistent estimates (Maddala 1983). The WERS 2004 sample contains 12 workers per firm on average which is not large when 4 cut-off points per firm are to be estimated. In another test we include fixed effects and a gender dummy in a probit model of the likelihood of reporting being satisfied or very satisfied, that is after collapsing the independent variable into a dichotomous one. The satisfaction gap in favour of females also remains in this case, albeit reduced to a half. The firm dummies are jointly significant at the 0.1% confidence level11. We conclude that firm effects in our data would at most reduce the gender gap in job satisfaction to a half but not wash it away. Since firm effects do not appear to be driving the gender gap in job satisfaction it must be that individual heterogeneity is. We therefore carried out various sensitivity tests on the composition of the workforce in our data by splitting the sample into relevant demographic groups other than by gender to assess the relative importance of firm characteristics. Admittedly WLB practices may be more relevant for those with family responsibilities. Splitting the sample between those married or with dependent children as opposed to those without, goes some way in improving the relevance of WLB but not as far as to wash away the gender gap, which is unsurprisingly smaller for those with family responsibilities compared to those without. A related test is to consider that those with family responsibilities normally choose part-time jobs that allow them to continue with a family and a working life (Booth and Van Ours, 2008). Splitting the sample between those with more or less than 30 hours a week’s work obtains a somewhat smaller gender gap in job satisfaction for part-timers but it is worth noting that women are disproportionally represented in this category and hence the comparison is mostly between females here. In addition, for part-timers, practices as working from home or having parental leave come up irrelevant, but these findings are consistent with the argument that workers select part-time jobs because of their flexibility and therefore draw little additional benefit from other practices enhancing flexibility.
11 The specific values are Chi2(1551)=3374.36 in 2004 and Chi2(1682)= 4678.05 in 1998, for both, P>Chi2 = 0.000

In light of the persistence of the gender gap in satisfaction in the data we performed a final check to discern the importance of unobserved heterogeneity. A counterfactual (Oaxaca-Blinder) decomposition of the gender gap in job satisfaction reveals that unobserved heterogeneity is important. Females are happier in the WERS sample for reasons that we cannot account for. Over 40% of the gender gap in satisfaction with the work itself is attributable to differences in observable characteristics with the remaining 60% attributable to the differential valuations of males and females. This percentage rises to 57% when WLB practices are also considered but still leaves a large part of the gap unexplained by observables. Even after including segregation and the availability of WLB policies a sizeable proportion of the gender gap is driven by the higher female valuation of observables.
6 Conclusion This paper examines the determinants of various aspects of job satisfaction in the UK with an emphasis in gender differences and the presence work-life balance practices. It contributes to the literature with recent results that highlight the role of employer characteristics which have not been previously taken into account. In particular we revisit the paradox of the contented female worker and after establishing that there remains a gender gap in job satisfaction in the UK we proceed to test whether this is because females select workplaces that offer non-pecuniary benefits such as work-life balance practices, resulting also in some degree of gender segregation in these workplaces. The main findings are that WLB are important determinants of intrinsic and extrinsic aspects of job satisfaction, although they improve the wellbeing of males and females alike, thereby reducing gender differences only slightly. The relevance of WLB practices applies to satisfaction with the work itself, satisfaction with pay and satisfaction with the degree of influence over the job, which we call autonomy. In addition, a similar pattern is found in two separate cross-sections of the working population in the UK, indicating that in the course of the 6 years that separate the 1998 from the 2004 surveys WLB practices remained significant while the gender gap in job satisfaction dropped to a half for reasons other than firm characteristics. From our analysis we can only conclude that there are factors other firm characteristics driving the gender gap in job satisfaction in the UK and more work is needed to understand better a phenomenon that is not reproduced in other European countries. The

measurement of subjective well-being is under continuous scrutiny (Kahneman and Krueger, 2006) and it is inevitably shaped by idiosyncratic factors. For example, it has been suggested that gender differences in reported job satisfaction may emerge due to labour market institutions. Kaiser (2007) found that access to the labour market was important in reported job satisfaction. Other intrinsic differences between Europeans and Americans in terms of reported happiness have been related to inequality by Alesina et al (2004).

References Abowd, J. M. and Kramarz, F. (1999), “The Analysis of Labor Markets Using Matched
Employer-Employee Data”, in Ashenfelter O. and Card D. (Eds), Handbook of Labor Economics, Vol. 3B, Elsevier Science Publishers BV, Netherlands, pp. 2629-271 0.
Alesina, A. Di Tella, R and MacCulloc R. (2004) “Inequality and Happiness: are Europeans and Americans Different? Journal of Public Economics, 88.
Blanchflower, D. G. and A. J. Oswald (2004). "Well-Being Over Time in Britain and the USA," Journal of Public Economics, Volume 88(7-8), pp. 1359-1386.
Bender, K. A, and Heywood, J.S. (2006). “Job Satisfaction of the Highly Educated: The Role of Gender, Academic Tenure and Earnings” Scottish Journal of Political Economy 53(2).
Bender, K A., Susan M. Donohue and John S. Heywood (2005). “Job satisfaction and gender segregation”, Oxford Economic Papers, vol. 57(3), pp. 479-496.
Nick Bloom and John van Reenen (2006) “Management Practices, Work-Life Balance and Productivity: A Review of Some Recent Evidence, Oxford Review of Economic Policy, 2006, vol. 22, issue 4, pages 457-482.
Booth, A. L. and Jan C. van Ours (2008) “Job Satisfaction and Family Happiness: The Part-Time Work Puzzle” The Economic Journal 118 (526), F77–F99
Bryson, A. Capellari, L and Lucifora, C (2004). “Does union membership really reduce job satisfaction?” British Journal of Industrial Relations 42(3).
Budd, J W and Mumford, K (2005) "Family-Friendly Work Practices in Britain: Availability and Perceived Accessibility". IZA Discussion Paper No. 1662
Chaplin, J.; Mangla, J.; Purdon, S. and Colin Airey (2005). Technical Report: The Workplace Employment Relations Survey (WERS) 2004 London: DTI
Clark, A. E. (1997). “Job Satisfaction and Gender: Why are Women so Happy at Work?” Labour Economics 4: 341-372.
Clark, A. E. and A. J. Oswald (1996). “Satisfaction and Comparison Income.” Journal of Public Economics 61(3): 359-381.
Connolly S and M Gregory (2008) “Moving Down: Women’s Part-Time Work and Occupational Change in Britain 1991-2001”. The Economic Journal 118 (526), F52–F76
Cully, M., Woodland, S., O’Reilly, A., Dix, G. (1999), Britain at Work: As Depicted by the 1998 Workplace Employee Relations Survey, Routledge, London.
Evans J. M (2002), “Work/Family Reconciliation, Gender Wage Equity and Occupational Segregation: The Role of Firms and Public Policy”, Canadian Public Policy, 2002, vol. 28, issue s1, pages 187-216.
Ferrer-i-Carbonell, A. and P Frijters (2004) “How Important Is Methodology for the Estimates of the Determinants of Happiness” The Economic Journal 114 (July)
Freeman, RB (1978) “Job Satisfaction as an Economic Variable” The American Economic Review, Vol. 68, No. 2, pp. 135-141
Frey, B. S. and A. Stutzer (2002). "What Can Economists Learn from Happiness Research?" Journal of Economic Literature 40 (2): 402-425.
Gardner, J. and A. J. Oswald (2002). What Has Been Happening to the Quality of Workers' Lives in Britain?, University of Warwick, Department of Economics, mimeo.

Green, Francis and Tsitsianis, Nicholas (2004) “Can the Changing Nature of Jobs Account for National Trends in Job Satisfaction?”, Studies in Economics from Department of Economics, University of Kent.
Groot, W and Maasesen van den Brink, H (1999) “Job satisfaction and preference drift” Economics Letters, 63.
Hamermesh, D. S. (2001). “The Changing Distribution of Job Satisfaction.” Journal of Human Resources 36 (1): 1-30.
Hayward, B, Fong, B and Thornton, A (2007) “The Third Work-Life Balance Survey: Main Findings” London: Department for Business, Enterprise and Regulatory Reform. http://www.berr.gov.uk/files/file42645.pdf
Heywood, J.S, Siebert W.S and Wei X (2002)“Worker Sorting and Job Satisfaction: The Case of Union and Government Jobs” Industrial and Labor Relations Review, Vol. 55 (4) pp. 595-609
Kahneman, D and Krueger, A. B (2006) “Developments in the Measurement of Subjective Well-Being” Journal of Economic Perspectives, 20(1).
Kaiser, Lutz (2007). “Gender-Job Satisfaction Differences across Europe: An Indicator for Labour Market Modernization” International Journal of Manpower 28(1).
Maddala, G. S. (1983) Limited Dependent and Qualitative Variables in Econometrics. Cambridge: Cambridge University Press.
Petrongolo, B (2004). “Gender Segregation in Employment Contracts”. Journal of the European Economic Association 2(2-3).
Pezzini, S.(2005) “The Effect of Women’s Rights on Women’s Welfare: Evidence from a Natural Experiment” The Economic Journal 115, C208-C227.
Pitts, David W., Jarry, Elizabeth M., Wilkins, Vicky M. and Pandey, Sanjay K. (2006) “What do Women Want? Men, Women, and Job Satisfaction in the Public Service”. Andrew Young School of Policy Studies Research Paper No. 06-34 Available at SSRN: http://ssrn.com/abstract=895330
Rose, M. (2005) “Job Satisfaction in Britain: Coping with Complexity” British Journal of Industrial Relations 43(3), pp 455-67.
Sanz de Galdeano, A (2001) “Gender Differences in Job Satisfaction and Labour Market Participation: UK Evidence from Propensity Score Matching” Presented at the 2001 BHPS Conference at the Institute for Social and Economic Research http://www.iser.essex.ac.uk/bhps/2001/docs/pdf/papers/galdeano.pdf.
Sloane, P. J and Ward, M. E (2001). “Cohort Effects and Job Satisfaction of Academics” Applied Economics Letters, 8
Sloane, P. J. and H. Williams (2000). “Job Satisfaction, Comparison Income, and Gender.” Labour 14(3): 473-502. http://www.blackwell ... &year=2000&part=null
Sousa-Poza A and Sousa-Poza, A A. (2000) “Taking Another Look at the Gender/Job-Satisfaction Praradox” KYKLOS 53(2)
Sousa-Poza A and Sousa-Poza, A A. (2003). "Gender differences in job satisfaction in Great Britain, 1991-2000: permanent or transitory?," Applied Economics Letters, Taylor and Francis Journals, vol. 10(11), pages 691-694, September.
White M., Hill S., McGovern P., Mills C., and Smeaton D. (2003) 'High-performance' Management Practices, Working Hours and Work-Life Balance, British Journal of Industrial Relations

Table 1: Average job satisfaction across different dimensions and gender 2004 1998
Satisfaction with Male Female Male Female Work itself 3.70 3.84
Pay 2.83 2.89 2.79 2.95 Autonomy 3.52 3.54 3.51 3.58
Observations 10270 11812 13767 14194 Table 2: Distribution of satisfaction by gender in each cross-section
Male pay Female pay Male autonomy Female autonomy 1998 2004 1998 2004 1998 2004 1998 2004
Very dissatisfied 14.65 13.74 10.33 12.43 4.02 3.77 2.33 2.36 Dissatisfied 29.11 27.93 27.43 27.47 13.45 11.51 11.67 10.98
Neither 23.41 24.34 23.66 23.01 24.56 27.44 25.94 28.76 Satisfied 29.51 29.84 34.99 32.67 45.69 43.91 48.9 45.95
Very satisfied 3.32 4.15 3.60 4.42 12.29 13.36 11.16 11.95
Observations 13,731 10,268 14,140 11,793 13,658 10,206 13,976 11,731

2.40
2.90
3.40
3.90Work itself
100% male 0-25% female 25/50% female 50-75% female 75-99% female 100% female
Pay
Autonomy
Chart 1: Distribution of various aspects of satisfaction by gender and composition of the workforce. Triangles represent males.

Table 1A: Descriptive Statistics by gender, 2004 Variable Mean Std. Dev. Mean Std. Dev. Mean Std. Dev.Female 0.54 0.50 0.00 0.00 1.00 0.00Log(hours) 3.49 0.52 3.65 0.43 3.35 0.56Log(pay) 5.66 0.76 5.94 0.63 5.42 0.78Education
Level 4+ 0.38 0.49 0.40 0.49 0.36 0.48Level1-3 0.43 0.50 0.39 0.49 0.47 0.50
Other 0.06 0.24 0.08 0.27 0.05 0.22Tenure(weeks) 271 187 282 189 260 185Member of Union 0.37 0.48 0.38 0.48 0.36 0.48Permanent contract 0.92 0.27 0.93 0.26 0.92 0.28Fixed contract 0.03 0.18 0.03 0.18 0.04 0.18Long Term Illness 0.12 0.33 0.13 0.34 0.11 0.31Ethnic Origin
White 0.93 0.26 0.93 0.25 0.93 0.25Asian 0.03 0.17 0.03 0.17 0.03 0.16Black 0.02 0.13 0.01 0.12 0.02 0.13Other 0.03 0.16 0.02 0.15 0.02 0.15
Age Under 22 0.06 0.24 0.05 0.22 0.07 0.25
22-29 years 0.15 0.36 0.15 0.36 0.16 0.3730-39 years 0.25 0.43 0.26 0.44 0.25 0.4340-49 yars 0.27 0.44 0.26 0.44 0.27 0.45
50-59 years 0.22 0.41 0.22 0.42 0.22 0.4160+ 0.04 0.19 0.05 0.22 0.03 0.17
Standard Occupational Classification Managers 0.11 0.32 0.15 0.36 0.08 0.27
Professionals 0.12 0.32 0.13 0.34 0.11 0.31Associate professionals 0.17 0.37 0.16 0.37 0.17 0.38
Clerical 0.19 0.39 0.09 0.28 0.28 0.45Skilled Trades 0.07 0.25 0.13 0.34 0.01 0.11
Personal Services 0.09 0.28 0.03 0.18 0.14 0.34Sales 0.07 0.25 0.04 0.19 0.09 0.29
Operatives 0.07 0.26 0.13 0.34 0.02 0.15Elementary 0.11 0.32 0.13 0.34 0.10 0.29
Establishment size 100-499 0.33 0.47 0.38 0.49 0.28 0.45500-999 0.08 0.27 0.09 0.29 0.07 0.26
1000+ 0.11 0.31 0.10 0.30 0.11 0.31Standard Industrial Classification
Manufacturing 0.15 0.35 0.23 0.42 0.07 0.26Utilities 0.02 0.13 0.03 0.16 0.01 0.10
Construction 0.05 0.21 0.08 0.27 0.02 0.14Wholesale and Retail 0.10 0.30 0.09 0.29 0.10 0.30
Hotels and Restaurants 0.03 0.16 0.02 0.14 0.03 0.17Transport and Telecoms 0.06 0.24 0.10 0.30 0.03 0.18
Financial services 0.06 0.24 0.05 0.23 0.07 0.25Other business services 0.11 0.32 0.12 0.33 0.11 0.31
Public Administration 0.08 0.28 0.08 0.28 0.08 0.28Education 0.12 0.33 0.06 0.24 0.17 0.38
Health 0.16 0.37 0.07 0.25 0.24 0.43Other community services 0.06 0.24 0.06 0.24 0.06 0.24
Work Life Balance Practices: 1) Flexi-time 0.38 0.48 0.35 0.48 0.40 0.492) Job-share 0.20 0.40 0.14 0.34 0.25 0.43
3) Working from home 0.14 0.35 0.16 0.37 0.12 0.324) Paid parental leave 0.10 0.30 0.11 0.31 0.10 0.304) Workplace nursery 0.06 0.24 0.05 0.21 0.07 0.26
Percentage of female employees 0% 0.01 0.08 0.01 0.12
0-25% 0.24 0.43 0.44 0.50 0.07 0.2625-50% 0.19 0.39 0.24 0.43 0.15 0.3550-75% 0.31 0.46 0.24 0.43 0.37 0.4875-00% 0.22 0.42 0.07 0.25 0.36 0.48
100% 0.03 0.16 0.05 0.22Number of Observations 22345 10383 11962

Table 2A: Descriptive Statistics by gender, 1998 Variable Mean Std. Dev. Mean Std. Dev. Mean Std. Dev.Female 0.51 0.50 0.00 0.00 1.00 0.00Log(hours) 3.53 0.48 3.70 0.36 3.37 0.53Log(pay) 5.41 0.80 5.70 0.68 5.12 0.81Education
Level 4+ 0.25 0.44 0.27 0.45 0.23 0.42Level1-3 0.52 0.50 0.49 0.50 0.55 0.50
Other 0.00 0.02 0.00 0.02 0.00 0.02Tenure(weeks) 278 189 290 192 266 185Member of Union 0.40 0.49 0.45 0.50 0.36 0.48Permanent contract 0.93 0.26 0.93 0.25 0.92 0.27Fixed contract 0.03 0.18 0.03 0.17 0.04 0.19Long Term Illness 0.05 0.23 0.06 0.24 0.05 0.21Ethnic Origin
White 0.95 0.21 0.96 0.20 0.95 0.21Asian 0.02 0.12 0.02 0.12 0.02 0.13Black 0.01 0.12 0.01 0.11 0.02 0.13Other 0.02 0.12 0.01 0.12 0.01 0.12
Age Under 20 0.04 0.19 0.04 0.19 0.04 0.20
20-24 years 0.07 0.26 0.07 0.25 0.08 0.2725-29 years 0.13 0.33 0.12 0.33 0.13 0.3430-39 years 0.28 0.45 0.29 0.45 0.26 0.4440-49 years 0.26 0.44 0.26 0.44 0.26 0.4450-59 years 0.18 0.39 0.18 0.38 0.19 0.39
60+ 0.04 0.19 0.05 0.21 0.03 0.17Standard Occupational Classification
Managers 0.11 0.31 0.15 0.35 0.07 0.26Professionals 0.17 0.38 0.18 0.39 0.16 0.36
Associate professionals 0.10 0.30 0.11 0.31 0.10 0.29Clerical 0.21 0.40 0.08 0.27 0.33 0.47
Skilled Trades 0.08 0.27 0.14 0.35 0.02 0.13Personal Services 0.07 0.26 0.06 0.24 0.08 0.27
Sales 0.07 0.26 0.05 0.21 0.10 0.30Operatives 0.09 0.28 0.13 0.34 0.04 0.20
Elementary 0.10 0.30 0.10 0.30 0.10 0.31Establishment size
100-499 0.40 0.49 0.44 0.50 0.36 0.48500-999 0.09 0.28 0.10 0.30 0.07 0.26
1000+ 0.05 0.22 0.05 0.21 0.05 0.22Standard Industrial Classification
Manufacturing 0.14 0.35 0.21 0.41 0.08 0.27Utilities 0.04 0.20 0.06 0.24 0.02 0.15
Construction 0.05 0.21 0.08 0.27 0.02 0.13Wholesale and Retail 0.13 0.33 0.11 0.31 0.14 0.35
Hotels and Restaurants 0.04 0.20 0.03 0.18 0.05 0.22Transport and Telecoms 0.06 0.24 0.10 0.29 0.03 0.17
Financial services 0.06 0.23 0.04 0.20 0.07 0.25Other business services 0.09 0.29 0.09 0.29 0.09 0.28
Public Administration 0.10 0.30 0.11 0.31 0.09 0.29Education 0.12 0.33 0.07 0.26 0.18 0.38
Health 0.12 0.33 0.04 0.21 0.20 0.40Other community services 0.05 0.21 0.05 0.21 0.04 0.21
Work Life Balance Practices: 1) Flexi-time 0.33 0.47 0.30 0.46 0.37 0.482) Job-share 0.17 0.38 0.11 0.32 0.24 0.42
3) Working from home 0.11 0.31 0.14 0.35 0.08 0.284) Paid parental leave 0.28 0.45 0.24 0.43 0.31 0.464) Workplace nursery 0.04 0.19 0.03 0.17 0.05 0.21
Percentage of female employees 0% 0.01 0.08 0.01 0.11
0-25% 0.25 0.43 0.44 0.50 0.07 0.2625-50% 0.21 0.40 0.25 0.44 0.16 0.3750-75% 0.30 0.46 0.23 0.42 0.36 0.4875-00% 0.23 0.42 0.07 0.25 0.38 0.49
100% 0.01 0.09 0.01 0.12Number of Observations 28186 13859 14327
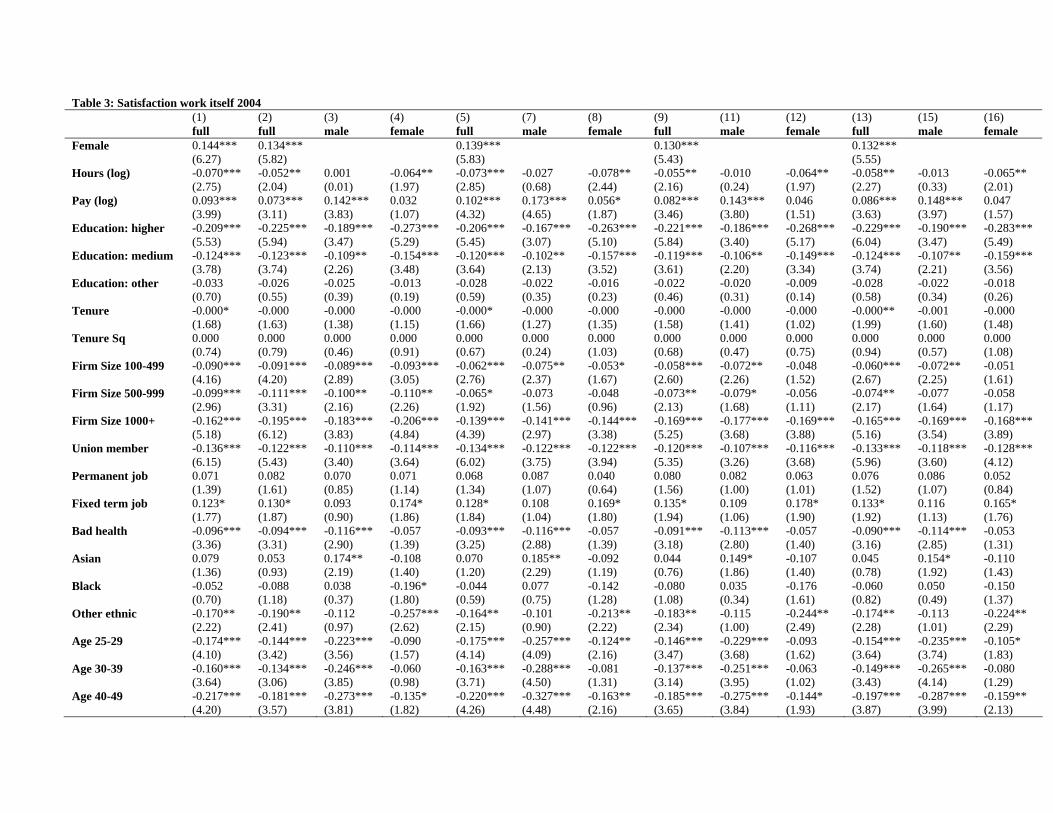
Table 3: Satisfaction work itself 2004 (1) (2) (3) (4) (5) (7) (8) (9) (11) (12) (13) (15) (16) full
full male
female
full male
female
full male
female
full male
female Female 0.144*** 0.134*** 0.139*** 0.130*** 0.132***
(6.27)
(5.82) (5.83) (5.43) (5.55)Hours (log) -0.070***
-0.052**
0.001 -0.064**
-0.073***
-0.027 -0.078**
-0.055**
-0.010 -0.064**
-0.058**
-0.013 -0.065**
(2.75) (2.04) (0.01) (1.97) (2.85) (0.68) (2.44) (2.16) (0.24) (1.97) (2.27) (0.33) (2.01)Pay (log) 0.093***
0.073***
0.142***
0.032 0.102***
0.173***
0.056* 0.082***
0.143***
0.046 0.086***
0.148***
0.047
(3.99) (3.11) (3.83) (1.07) (4.32) (4.65) (1.87) (3.46) (3.80) (1.51) (3.63) (3.97) (1.57)Education: higher -0.209***
-0.225***
-0.189***
-0.273***
-0.206***
-0.167***
-0.263***
-0.221***
-0.186***
-0.268***
-0.229***
-0.190***
-0.283***
(5.53) (5.94) (3.47) (5.29) (5.45) (3.07) (5.10) (5.84) (3.40) (5.17) (6.04) (3.47) (5.49)Education: medium -0.124***
-0.123***
-0.109**
-0.154***
-0.120***
-0.102**
-0.157***
-0.119***
-0.106**
-0.149***
-0.124***
-0.107**
-0.159***
(3.78) (3.74) (2.26) (3.48) (3.64) (2.13) (3.52) (3.61) (2.20) (3.34) (3.74) (2.21) (3.56)Education: other -0.033 -0.026 -0.025 -0.013 -0.028 -0.022 -0.016 -0.022 -0.020 -0.009 -0.028 -0.022 -0.018 (0.70) (0.55) (0.39) (0.19) (0.59) (0.35) (0.23) (0.46) (0.31) (0.14) (0.58) (0.34) (0.26)Tenure -0.000* -0.000 -0.000 -0.000 -0.000* -0.000 -0.000 -0.000 -0.000 -0.000 -0.000**
-0.001 -0.000
(1.68) (1.63) (1.38) (1.15) (1.66) (1.27) (1.35) (1.58) (1.41) (1.02) (1.99) (1.60) (1.48)Tenure Sq 0.000 0.000 0.000 0.000 0.000 0.000 0.000 0.000 0.000 0.000 0.000 0.000 0.000 (0.74) (0.79) (0.46) (0.91) (0.67) (0.24) (1.03) (0.68) (0.47) (0.75) (0.94) (0.57) (1.08)Firm Size 100-499 -0.090***
-0.091***
-0.089***
-0.093***
-0.062***
-0.075**
-0.053* -0.058***
-0.072**
-0.048 -0.060***
-0.072**
-0.051
(4.16) (4.20) (2.89) (3.05) (2.76) (2.37) (1.67) (2.60) (2.26) (1.52) (2.67) (2.25) (1.61)Firm Size 500-999 -0.099***
-0.111***
-0.100**
-0.110**
-0.065* -0.073 -0.048 -0.073**
-0.079* -0.056 -0.074**
-0.077 -0.058
(2.96) (3.31) (2.16) (2.26) (1.92) (1.56) (0.96) (2.13) (1.68) (1.11) (2.17) (1.64) (1.17)Firm Size 1000+ -0.162***
-0.195***
-0.183***
-0.206***
-0.139***
-0.141***
-0.144***
-0.169***
-0.177***
-0.169***
-0.165***
-0.169***
-0.168***
(5.18) (6.12) (3.83) (4.84) (4.39) (2.97) (3.38) (5.25) (3.68) (3.88) (5.16) (3.54) (3.89)Union member -0.136***
-0.122***
-0.110***
-0.114***
-0.134***
-0.122***
-0.122***
-0.120***
-0.107***
-0.116***
-0.133***
-0.118***
-0.128***
(6.15) (5.43) (3.40) (3.64) (6.02) (3.75) (3.94) (5.35) (3.26) (3.68) (5.96) (3.60) (4.12)Permanent job 0.071 0.082 0.070 0.071 0.068 0.087 0.040 0.080 0.082 0.063 0.076 0.086 0.052 (1.39) (1.61) (0.85) (1.14) (1.34) (1.07) (0.64) (1.56) (1.00) (1.01) (1.52) (1.07) (0.84)Fixed term job 0.123* 0.130* 0.093 0.174* 0.128* 0.108 0.169* 0.135* 0.109 0.178* 0.133* 0.116 0.165* (1.77) (1.87) (0.90) (1.86) (1.84) (1.04) (1.80) (1.94) (1.06) (1.90) (1.92) (1.13) (1.76)Bad health -0.096***
-0.094***
-0.116***
-0.057 -0.093***
-0.116***
-0.057 -0.091***
-0.113***
-0.057 -0.090***
-0.114***
-0.053
(3.36) (3.31) (2.90) (1.39) (3.25) (2.88) (1.39) (3.18) (2.80) (1.40) (3.16) (2.85) (1.31)Asian 0.079 0.053 0.174** -0.108 0.070 0.185** -0.092 0.044 0.149* -0.107 0.045 0.154* -0.110 (1.36) (0.93) (2.19) (1.40) (1.20) (2.29) (1.19) (0.76) (1.86) (1.40) (0.78) (1.92) (1.43)Black -0.052 -0.088 0.038 -0.196* -0.044 0.077 -0.142 -0.080 0.035 -0.176 -0.060 0.050 -0.150 (0.70) (1.18) (0.37) (1.80) (0.59) (0.75) (1.28) (1.08) (0.34) (1.61) (0.82) (0.49) (1.37)Other ethnic -0.170**
-0.190**
-0.112 -0.257***
-0.164**
-0.101 -0.213**
-0.183**
-0.115 -0.244**
-0.174**
-0.113 -0.224**
(2.22) (2.41) (0.97) (2.62) (2.15) (0.90) (2.22) (2.34) (1.00) (2.49) (2.28) (1.01) (2.29)Age 25-29 -0.174***
-0.144***
-0.223***
-0.090 -0.175***
-0.257***
-0.124**
-0.146***
-0.229***
-0.093 -0.154***
-0.235***
-0.105*
(4.10) (3.42) (3.56) (1.57) (4.14) (4.09) (2.16) (3.47) (3.68) (1.62) (3.64) (3.74) (1.83)Age 30-39 -0.160***
-0.134***
-0.246***
-0.060 -0.163***
-0.288***
-0.081 -0.137***
-0.251***
-0.063 -0.149***
-0.265***
-0.080
(3.64) (3.06) (3.85) (0.98) (3.71) (4.50) (1.31) (3.14) (3.95) (1.02) (3.43) (4.14) (1.29)Age 40-49 -0.217***
-0.181***
-0.273***
-0.135* -0.220***
-0.327***
-0.163**
-0.185***
-0.275***
-0.144* -0.197***
-0.287***
-0.159**
(4.20) (3.57) (3.81) (1.82) (4.26) (4.48) (2.16) (3.65) (3.84) (1.93) (3.87) (3.99) (2.13)

Age 50-59 -0.273*** -0.225*** -0.316*** -0.183* -0.276*** -0.382*** -0.221** -0.228*** -0.316*** -0.191** -0.241*** -0.328*** -0.208** (4.23) (3.57) (3.68) (1.94)
-0.328***
(4.27) (4.33) (2.30) (3.62) (3.68) (2.01) (3.80) (3.79) (2.19) Age 60+ -0.173* -0.109 -0.151 -0.116 -0.175* -0.240**
-0.163 -0.111 -0.150 -0.128 -0.127 -0.165 -0.145
(1.85) (1.19) (1.26) (0.83) (1.88) (1.97) (1.13) (1.22) (1.26) (0.90) (1.38) (1.37) (1.02)Age Sq 0.011***
0.011***
0.011***
0.010***
0.011***
0.012***
0.009***
0.011***
0.011***
0.010***
0.010***
0.011***
0.009***
(7.40) (7.52) (6.00) (4.50) (7.41) (6.06) (4.27) (7.53) (5.95) (4.56) (7.27) (5.76) (4.40)Utilities -0.122* -0.164**
-0.120 -0.281**
-0.121* -0.084 -0.246* -0.165**
-0.117 -0.293**
-0.148**
-0.102 -0.288**
(1.67) (2.32) (1.37) (2.23) (1.67) (0.93) (1.93) (2.33) (1.34) (2.34) (2.08) (1.15) (2.30)Construction 0.147***
0.130** 0.120** 0.152 0.148***
0.130** 0.210* 0.127** 0.118** 0.147 0.132** 0.126** 0.147
(2.88) (2.55) (2.10) (1.29) (2.86) (2.26) (1.76) (2.46) (2.04) (1.25) (2.56) (2.19) (1.23)Wholesale 0.126***
0.112***
0.173***
-0.001 0.137***
0.210***
-0.002 0.126***
0.193***
-0.009 0.130***
0.199***
-0.006
(3.25) (2.89) (3.43) (0.01) (3.49) (4.15) (0.03) (3.20) (3.80) (0.14) (3.31) (3.93) (0.09)Hospitality 0.295***
0.246***
0.343***
0.129 0.319***
0.416***
0.179** 0.281***
0.370***
0.143 0.273***
0.360***
0.134
(4.64) (3.86) (3.42) (1.51) (4.90) (4.11) (2.00) (4.29) (3.62) (1.60) (4.18) (3.53) (1.51)Transport and Tele -0.001 0.002 -0.004 -0.017 -0.006 -0.003 -0.046 -0.004 -0.009 -0.023 -0.007 -0.007 -0.044 (0.02) (0.05) (0.07) (0.19) (0.13) (0.05) (0.50) (0.08) (0.17) (0.26) (0.16) (0.13) (0.50)Financial services -0.214***
-0.220***
-0.232***
-0.274***
-0.209***
-0.219***
-0.288***
-0.207***
-0.222***
-0.282***
-0.212***
-0.223***
-0.289***
(4.93) (5.06) (3.75) (4.09) (4.59) (3.41) (4.11) (4.54) (3.43) (4.03) (4.65) (3.45) (4.15)Other business SS 0.046 0.001 -0.026 -0.016 0.052 0.038 0.008 0.011 -0.015 -0.022 0.017 -0.003 -0.025 (1.19) (0.02) (0.51) (0.26) (1.31) (0.73) (0.12) (0.28) (0.29) (0.33) (0.42) (0.06) (0.38)
-0.000 -0.098**
Public Admin -0.056 -0.185***
0.003 0.032 -0.084 -0.089**
-0.043 -0.195***
-0.091**
-0.049 -0.187*** (0.01) (2.24) (0.95) (2.66) (0.07) (0.54) (1.21) (1.96) (0.71) (2.72) (2.02) (0.82) (2.63)
Education 0.326***
0.333***
0.365***
0.250***
0.340***
0.431***
0.209***
0.354***
0.421***
0.232***
0.342***
0.423***
0.212*** (7.74) (7.82) (5.67) (3.85) (7.40) (6.07) (3.01) (7.65) (5.87) (3.34) (7.41) (5.93) (3.07)
Health 0.276***
0.225***
0.183***
0.206***
0.252***
0.276***
0.185***
0.200***
0.216***
0.140** 0.206***
0.230***
0.141** (6.96) (5.58) (2.59) (3.45) (5.61) (3.59) (2.78) (4.39) (2.78) (2.08) (4.54) (2.96) (2.11)Other community 0.304***
0.260***
0.240***
0.262***
0.306***
0.302***
0.280***
0.269***
0.247***
0.257***
0.269***
0.253***
0.251***
(6.10) (5.19) (3.59) (3.28)
(6.06) (4.50) (3.46) (5.28) (3.65) (3.15) (5.30) (3.74) (3.10)Professional -0.170***
-0.141***
-0.208***
0.003 -0.174***
-0.226***
-0.049 -0.146***
-0.211***
-0.004 -0.147***
-0.208***
-0.010
(4.12) (3.40) (3.93) (0.05) (4.19) (4.27) (0.74) (3.51) (3.95) (0.05) (3.54) (3.93) (0.15)Ass Professional -0.105***
-0.064* -0.051 -0.030 -0.102***
-0.084 -0.077 -0.060 -0.054 -0.025 -0.067* -0.057 -0.035
(2.78) (1.69) (0.99) (0.52) (2.69) (1.63) (1.33) (1.58) (1.06) (0.43) (1.76) (1.11) (0.60)Clerical -0.334***
-0.296***
-0.345***
-0.238***
-0.352***
-0.285***
-0.291***
-0.339***
-0.231***
-0.298***
-0.339***
-0.242***
(8.70) (7.57) (5.74) (4.25) (8.54) (5.94) (5.15) (7.42) (5.66) (4.11) (7.69) (5.69) (4.35)Skilled trades -0.226***
-0.145***
-0.139**
-0.120 -0.235***
-0.219***
-0.195 -0.158***
-0.157***
-0.117 -0.174***
-0.165***
-0.128
(4.81) (3.04) (2.55) (0.85) (4.93) (4.01) (1.41) (3.27) (2.83) (0.83) (3.61) (3.01) (0.90)Personal SS -0.049 0.031 -0.101 0.114* -0.057 -0.175**
0.019 0.022 -0.096 0.107 0.013 -0.103 0.092
(1.01) (0.62) (1.18) (1.70) (1.16) (2.05) (0.29) (0.44) (1.12) (1.60) (0.27) (1.20) (1.38)Sales -0.364***
-0.302***
-0.346***
-0.214***
-0.372***
-0.395***
-0.303***
-0.310***
-0.349***
-0.228***
-0.319***
-0.355***
-0.242***
(7.19) (5.93) (4.15) (3.10) (7.34) (4.74) (4.40) (6.08) (4.20) (3.30) (6.26) (4.25) (3.51)Operatives -0.374***
-0.293***
-0.287***
-0.289***
-0.383***
-0.372***
-0.365***
-0.305***
-0.305***
-0.283***
-0.322***
-0.315***
-0.312***
(7.65) (5.94) (4.82) (2.90) (7.75) (6.18) (3.68) (6.12) (5.05) (2.85) (6.47) (5.20) (3.14)Elementary -0.391***
-0.316***
-0.336***
-0.240***
-0.391***
-0.402***
-0.322***
-0.319***
-0.344***
-0.233***
-0.330***
-0.350***
-0.250***
(8.33)
(6.66) (5.34) (3.34) (8.30)
(6.40)
(4.49)
(6.69) (5.44) (3.22) (6.94)
(5.53)
(3.46) Flexi-time 0.194*** 0.188*** 0.205*** 0.199*** 0.191*** 0.212***

(8.22) (5.58) (6.27) (8.43) (5.68) (6.49)Work Home
0.050** 0.061 0.042 0.048* 0.063 0.035 (1.98) (1.40) (1.34) (1.88) (1.47) (1.11)Job Share 0.210***
0.221***
0.174***
0.213***
0.218***
0.184***
(6.52) (4.93) (3.77) (6.62) (4.91) (3.99)Paid leave 0.153***
0.164***
0.159***
0.158***
0.169***
0.162***
(4.39) (3.28) (3.37) (4.54) (3.36) (3.44)Nursery 0.053 0.163** -0.027 0.055 0.163** -0.026 (1.21)
(2.41)
(0.48)
(1.26) (2.41) (0.47) 0% female 0.040 -0.533** 0.040 -0.527** 0.035 -0.544**
(0.32) (2.06) (0.33) (2.10) (0.29) (2.16)0-25% female -0.179*** -0.746*** -0.161 -0.185*** -0.742***
-0.167 -0.168***
-0.739***
-0.184
(2.76) (3.14) (0.67) (2.87) (3.22) (0.71) (2.59) (3.20) (0.78)25-50% female -0.153** -0.700*** -0.179 -0.186*** -0.726***
-0.198 -0.163***
-0.717***
-0.216
(2.46) (2.96) (0.75) (3.00) (3.16) (0.85) (2.61) (3.12) (0.93)50-75% female -0.231*** -0.792*** -0.213 -0.262*** -0.823***
-0.225 -0.243***
-0.821***
-0.248
(3.94) (3.36) (0.90) (4.48) (3.60) (0.98) (4.15) (3.58) (1.07)75-99% female -0.126** -0.745*** -0.099 -0.139** -0.766***
-0.093 -0.130**
-0.767***
-0.128
(2.19)
(3.09)
(0.42) (2.43)
(3.26)
(0.41) (2.26)
(3.26)
(0.55)100% female -0.005 0.014 -0.034 (0.02)
(0.06)
(0.14)Flexibility factor 0.240*** 0.202*** 0.266*** (5.87) (3.30) (4.94)Family factor -0.042 0.036 -0.103* (0.97) (0.54) (1.83)Observations 20927 20908 9764 11144 20927 9769 11158 20908 9764 11144 20908 9764 11144Robust z statistics in parentheses * significant at 10%; ** significant at 5%; *** significant at 1% Non-response of WLB practices controlled for in all specifications. Hubert-White Standard errors accounting for the fact that the sample may not be random obtained the z-statistics in parenthesis. All estimations use sample weights provided by WERS04

Table 4: Satisfaction with pay, 2004. (1) (2) (3) (4) (5) (7) (8) (9) (11) (12) (13) (15) (16)
full full male
female
full male
female
full male
female
full male
female Female 0.142*** 0.126*** 0.150*** 0.136*** 0.143***
(6.28)
(5.57) (6.43) (5.85) (6.16)Hours (log) -0.430***
-0.414***
-0.319***
-0.447***
-0.429***
-0.334***
-0.459***
-0.414***
-0.319***
-0.446***
-0.415***
-0.320***
-0.446***
(13.98) (13.71) (6.99) (11.41) (13.95) (7.15) (11.59) (13.70) (6.98) (11.39) (13.67) (6.95) (11.37)Pay (log) 0.408***
0.392***
0.524***
0.335***
0.401***
0.540***
0.333***
0.385***
0.519***
0.325***
0.386***
0.517***
0.325***
(15.95) (15.48) (12.71) (10.08) (15.50) (13.02)
(9.87) (15.04) (12.50) (9.72) (15.03) (12.66) (9.64)Education: higher -0.109***
-0.125***
-0.101* -0.153***
-0.109***
-0.081 -0.148***
-0.124***
-0.098* -0.154***
-0.133***
-0.105* -0.170***
(2.85) (3.24) (1.85) (2.77) (2.85) (1.50) (2.69) (3.22) (1.80) (2.80) (3.49) (1.94) (3.10)Education: medium -0.079**
-0.075**
-0.115**
-0.044 -0.080**
-0.112**
-0.058 -0.077**
-0.115**
-0.047 -0.084**
-0.117**
-0.059
(2.30) (2.18) (2.38) (0.88) (2.35) (2.34) (1.18) (2.23) (2.39) (0.96) (2.45) (2.44) (1.19)Education: other -0.104**
-0.097**
-0.099 -0.063 -0.107**
-0.106* -0.069 -0.100**
-0.102 -0.067 -0.106**
-0.105* -0.071
(2.18) (2.04) (1.58) (0.85) (2.24) (1.70) (0.93) (2.13) (1.64) (0.92) (2.24) (1.69) (0.97)Tenure -0.001***
-0.001***
-0.001***
-0.001***
-0.001***
-0.001***
-0.002***
-0.001***
-0.001***
-0.001***
-0.001***
-0.001***
-0.002***
(5.69) (5.47) (3.87) (4.41) (5.69) (3.63) (5.12) (5.46) (3.79) (4.52) (6.03) (4.01) (5.19)Tenure Sq 0.000***
0.000***
0.000***
0.000***
0.000***
0.000** 0.000***
0.000***
0.000***
0.000***
0.000***
0.000***
0.000***
(4.89) (4.84) (2.80) (4.55) (4.90) (2.45) (5.17) (4.81) (2.71) (4.67) (5.18) (2.82) (5.16)Firm Size 100-499 -0.068***
-0.071***
-0.049 -0.094***
-0.079***
-0.054* -0.114***
-0.077***
-0.050 -0.112***
-0.075***
-0.047 -0.112***
(3.22) (3.36) (1.60) (3.13) (3.64) (1.74) (3.67) (3.53) (1.62) (3.60) (3.47) (1.52) (3.60)Firm Size 500-999 -0.118***
-0.132***
-0.034 -0.230***
-0.128***
-0.030 -0.241***
-0.137***
-0.033 -0.252***
-0.136***
-0.032 -0.251***
(3.65) (4.03) (0.73) (4.96) (3.91) (0.65) (5.11) (4.13) (0.70) (5.32) (4.09) (0.68) (5.30)Firm Size 1000+ -0.090***
-0.117***
-0.109**
-0.138***
-0.101***
-0.089* -0.133***
-0.124***
-0.116**
-0.158***
-0.124***
-0.114**
-0.154***
(2.86) (3.65) (2.22) (3.35) (3.16) (1.83) (3.21) (3.82) (2.34) (3.74) (3.84) (2.30) (3.68)Union member -0.128***
-0.116***
-0.116***
-0.075**
-0.128***
-0.129***
-0.082***
-0.118***
-0.118***
-0.077***
-0.125***
-0.123***
-0.085***
(6.03) (5.40) (3.60) (2.56) (5.98) (4.03) (2.80) (5.46) (3.66) (2.61) (5.81) (3.81) (2.91)Permanent job -0.191***
-0.180***
-0.212***
-0.183***
-0.189***
-0.210***
-0.200***
-0.178***
-0.214***
-0.177***
-0.178***
-0.210***
-0.185***
(3.95) (3.71) (2.66) (3.11) (3.88) (2.62) (3.41) (3.66) (2.67) (3.00) (3.69) (2.63) (3.15)Fixed term job -0.133**
-0.131* -0.185* -0.076 -0.133**
-0.186* -0.080 -0.131* -0.189* -0.075 -0.133**
-0.187* -0.084
(1.98) (1.94) (1.82) (0.83) (1.99) (1.83) (0.89) (1.94) (1.85) (0.82) (1.99) (1.84) (0.93)Bad health -0.109***
-0.111***
-0.103**
-0.111***
-0.108***
-0.097**
-0.108***
-0.110***
-0.100**
-0.109***
-0.108***
-0.098**
-0.105***
(3.85) (3.92) (2.56) (2.74) (3.84) (2.43) (2.65) (3.87) (2.51) (2.69) (3.81) (2.45) (2.59)Asian -0.012 -0.044 0.069 -0.216***
-0.004 0.104 -0.181**
-0.035 0.080 -0.214***
-0.033 0.075 -0.211***
(0.21) (0.73) (0.83) (2.91) (0.06) (1.26) (2.42) (0.59) (0.97) (2.88) (0.56) (0.92) (2.83)Black -0.103 -0.140**
-0.038 -0.219**
-0.106 -0.007 -0.192**
-0.142**
-0.043 -0.227**
-0.120* -0.033 -0.197**
(1.52) (2.09) (0.35) (2.49) (1.56) (0.07) (2.09) (2.12) (0.40) (2.57) (1.78) (0.30) (2.22)Other ethnic -0.146**
-0.165**
-0.080 -0.235***
-0.150**
-0.079 -0.203**
-0.166**
-0.082 -0.242***
-0.157**
-0.085 -0.213**
(2.17) (2.39) (0.78) (2.62) (2.20) (0.78) (2.27) (2.39) (0.79) (2.69) (2.28) (0.83) (2.36)Age 25-29 -0.412***
-0.388***
-0.554***
-0.287***
-0.410***
-0.574***
-0.312***
-0.387***
-0.555***
-0.288***
-0.395***
-0.555***
-0.303***
(9.04) (8.53) (8.01) (4.62) (8.99) (8.24) (5.05) (8.50) (7.97) (4.66) (8.62) (7.97) (4.88)Age 30-39 -0.338***
-0.306***
-0.537***
-0.178**
-0.337***
-0.573***
-0.205***
-0.307***
-0.537***
-0.180***
-0.326***
-0.549***
-0.209***
(7.10) (6.44) (7.64) (2.56) (7.10) (8.13) (2.98) (6.46) (7.65) (2.61) (6.85) (7.79) (3.04)

Age 40-49 -0.416*** -0.370*** -0.535*** -0.313*** -0.416*** -0.599*** -0.338*** -0.372*** -0.536*** -0.313*** -0.395*** -0.556*** -0.342*** (7.19) (6.42) (6.66) (3.51) (7.22) (7.40) (3.85) (6.47) (6.69) (3.55) (6.86) (6.90) (3.90) Age 50-59 -0.492***
-0.433***
-0.657***
-0.316***
-0.491***
-0.729***
-0.356***
-0.432***
-0.656***
-0.316***
-0.455***
-0.672***
-0.348*** (6.60) (5.85) (6.78) (2.68) (6.62) (7.44) (3.06) (5.87) (6.78) (2.71) (6.16) (6.90) (3.00)
Age 60+ -0.413***
-0.334***
-0.500***
-0.253 -0.413***
-0.598***
-0.300* -0.335***
-0.497***
-0.253 -0.361***
-0.515***
-0.286* (3.93) (3.18) (3.80) (1.47) (3.95) (4.55) (1.76) (3.21) (3.80) (1.49) (3.45) (3.91) (1.68)Age Sq 0.005***
0.004** 0.005** 0.004 0.005***
0.005** 0.004 0.004** 0.004** 0.004 0.004** 0.004** 0.004
(2.74) (2.49) (2.22) (1.45) (2.75) (2.56) (1.38) (2.47) (2.14) (1.43) (2.35) (1.99) (1.40)Utilities 0.085 0.047 -0.072 0.259** 0.084 -0.041 0.308***
0.046 -0.072 0.263** 0.058 -0.057 0.262**
(1.16) (0.64) (0.80) (2.20) (1.15) (0.45) (2.67) (0.63) (0.80) (2.25) (0.80) (0.64) (2.28)Construction 0.128***
0.108** 0.120** 0.109 0.128***
0.128** 0.152 0.103** 0.117** 0.082 0.112** 0.125** 0.081
(2.66) (2.26) (2.20) (1.00) (2.63) (2.31) (1.36) (2.13) (2.14) (0.74) (2.30) (2.27) (0.72)Wholesale -0.025 -0.042 0.068 -0.181***
-0.017 0.085* -0.151**
-0.030 0.073 -0.155**
-0.025 0.075 -0.157**
(0.63) (1.06) (1.34) (2.62) (0.44) (1.67) (2.17) (0.76) (1.44) (2.25) (0.63) (1.47) (2.28)Hospitality 0.081 0.020 0.316***
-0.273***
0.100 0.405***
-0.197**
0.052 0.359***
-0.241**
0.048 0.350***
-0.252***
(1.15) (0.28) (2.98) (2.89) (1.38) (3.55) (2.03) (0.73) (3.25) (2.51) (0.68) (3.19) (2.62)Transport and Tele 0.011 0.013 -0.041 0.152* 0.018 -0.024 0.129 0.018 -0.035 0.158* 0.020 -0.027 0.135 (0.27) (0.30) (0.81) (1.85) (0.43) (0.49) (1.55) (0.42) (0.68) (1.92) (0.46) (0.53) (1.64)Financial services -0.215***
-0.233***
-0.239***
-0.302***
-0.199***
-0.202***
-0.270***
-0.205***
-0.214***
-0.263***
-0.201***
-0.205***
-0.271***
(4.90) (5.30) (3.90) (4.27) (4.35) (3.14) (3.73) (4.50) (3.33) (3.68) (4.42) (3.20) (3.79)Other business SS -0.035 -0.089**
-0.151***
-0.071 -0.020 -0.076 -0.004 -0.067* -0.130**
-0.038 -0.060 -0.121**
-0.043
(0.95) (2.35) (3.05) (1.11) (0.51) (1.52) (0.07) (1.73) (2.57) (0.59) (1.55) (2.40) (0.66)Public Admin -0.200***
-0.315***
-0.399***
-0.290***
-0.187***
-0.288***
-0.129* -0.292***
-0.377***
-0.251***
-0.293***
-0.381***
-0.248***
(4.89) (7.40) (6.94) (4.14) (4.44) (5.07) (1.88) (6.71) (6.41) (3.56) (6.78) (6.50) (3.55)Education 0.053 0.043 0.036 -0.046 0.075* 0.102 -0.026 0.074* 0.083 -0.007 0.078* 0.097 -0.021 (1.29) (1.06) (0.56) (0.71) (1.70) (1.48) (0.38) (1.67) (1.19) (0.10) (1.76) (1.40) (0.32)Health -0.024 -0.088**
-0.091 -0.124**
0.002 -0.020 -0.018 -0.062 -0.091 -0.071 -0.051 -0.071 -0.071
(0.61) (2.23) (1.29) (2.02) (0.05) (0.26) (0.28) (1.40) (1.19) (1.07) (1.16) (0.93) (1.07)Other community -0.030 -0.082* -0.052 -0.128 -0.014 0.020 -0.062 -0.057 -0.034 -0.084 -0.054 -0.030 -0.096 (0.62) (1.66) (0.77) (1.61) (0.28) (0.29) (0.78) (1.14) (0.49) (1.06) (1.07) (0.44) (1.20)Professional -0.106***
-0.078**
-0.152***
0.106* -0.110***
-0.182***
0.060 -0.085**
-0.159***
0.100* -0.082**
-0.163***
0.100*
(2.77) (2.02) (2.98) (1.76) (2.87) (3.60) (1.01) (2.19) (3.12) (1.66) (2.14) (3.20) (1.67)Ass Professional -0.174***
-0.134***
-0.081* -0.108**
-0.182***
-0.119**
-0.167***
-0.142***
-0.084* -0.119**
-0.146***
-0.092* -0.124**
(4.98) (3.80) (1.73) (1.97) (5.17) (2.54) (3.05) (4.00) (1.78) (2.16) (4.15) (1.96) (2.26)Clerical -0.161***
-0.122***
-0.125**
-0.096* -0.167***
-0.148**
-0.160***
-0.129***
-0.124**
-0.110**
-0.133***
-0.129**
-0.114**
(4.37) (3.26) (2.11) (1.78)
(4.51) (2.52) (3.00) (3.42) (2.09) (2.04) (3.57) (2.19) (2.14)Skilled trades -0.244***
-0.154***
-0.148***
0.029 -0.243***
-0.218***
-0.058 -0.160***
-0.152***
0.031 -0.177***
-0.162***
0.016
(5.28) (3.30) (2.74) (0.24) (5.16) (4.01) (0.48) (3.37) (2.76) (0.26) (3.74) (2.95) (0.13)Personal SS -0.281***
-0.198***
-0.059 -0.190***
-0.287***
-0.140* -0.286***
-0.207***
-0.065 -0.195***
-0.211***
-0.068 -0.203***
(5.99) (4.18) (0.69) (2.95) (6.09) (1.67) (4.47) (4.34) (0.76) (3.03) (4.45) (0.80) (3.17)Sales -0.239***
-0.175***
-0.091 -0.126* -0.224***
-0.127 -0.191***
-0.160***
-0.081 -0.113 -0.166***
-0.082 -0.125*
(4.72) (3.44) (1.09) (1.83) (4.44) (1.51) (2.79) (3.15) (0.97) (1.64) (3.28) (0.98) (1.82)Operatives -0.227***
-0.136***
-0.127**
-0.044 -0.230***
-0.205***
-0.141 -0.144***
-0.134**
-0.044 -0.162***
-0.142**
-0.080
(4.69) (2.78) (2.16) (0.43) (4.68) (3.45) (1.41) (2.92) (2.23) (0.43) (3.29) (2.40) (0.80)Elementary -0.112** -0.028 -0.082 0.151** -0.122*** -0.156** 0.032 -0.043 -0.093 0.133* -0.053 -0.097 0.114

(2.41) (0.60) (1.32) (2.07) (2.61) (2.50) (0.44) (0.91) (1.48) (1.82) (1.14) (1.56) (1.56)Flexi-time 0.171***
0.159***
0.193***
0.170***
0.159***
0.190***
(7.37) (4.81) (5.97) (7.34) (4.80) (5.89)Work Home 0.129***
0.128***
0.119***
0.131***
0.131***
0.124***
(5.29) (3.06) (4.02) (5.37) (3.12) (4.18)Job Share 0.243***
0.235***
0.220***
0.243***
0.237***
0.217***
(8.14) (5.58) (5.19) (8.12) (5.65) (5.11)Paid leave 0.172***
0.213***
0.148***
0.173***
0.218***
0.146***
(5.19) (4.34) (3.36) (5.23) (4.45) (3.31)Nursery -0.013 0.011 -0.024 -0.008 0.017 -0.018 (0.31)
(0.16)
(0.46)
(0.18) (0.23) (0.35) 0% female -0.054 -0.374 -0.044 -0.339 -0.058 -0.359
(0.39) (1.41) (0.32) (1.26) (0.43) (1.33)0-25% female 0.154** -0.193 0.095 0.158** -0.160 0.104 0.168** -0.159 0.073 (2.31) (0.82) (0.44) (2.37) (0.66) (0.48) (2.52) (0.66) (0.33)25-50% female 0.158** -0.183 0.023 0.128** -0.185 0.010 0.148** -0.175 -0.019 (2.47) (0.78) (0.11) (2.01) (0.77) (0.05) (2.31) (0.72) (0.09)50-75% female 0.118* -0.234 0.017 0.089 -0.245 0.012 0.105* -0.240 -0.021 (1.95) (1.00) (0.08) (1.48) (1.01) (0.06) (1.73) (0.99) (0.10)75-99% female 0.127** -0.138 -0.023 0.119** -0.129 -0.007 0.126** -0.130 -0.051 (2.16)
(0.57)
(0.11) (2.03)
(0.52)
(0.03) (2.14)
(0.53)
(0.24)100% female -0.156 -0.132 -0.186 (0.71)
(0.60)
(0.83)
Flexibility factor 0.321*** 0.286*** 0.343*** (8.06) (4.70) (6.61)Family factor -0.112*** -0.048 -0.158*** (2.59) (0.71) (2.91)Observations 20910 20890 9762 11128 20910 9767 11143 20890 9762 11128 20890 9762 11128Robust z statistics in parentheses * significant at 10%; ** significant at 5%; *** significant at 1% Non-response of WLB practices controlled for in all specifications.. Ordered probit on a 5 point likert scale of satisfaction with pay. All specifications include personal characteristics and occupational dummies, firm characteristics and industry dummies as per Table 1A in the appendix. Hubert-White Standard errors accounting for the fact that the sample may not be random obtained the z-statistics in parenthesis. All estimations use sample weights provided by WERS04.
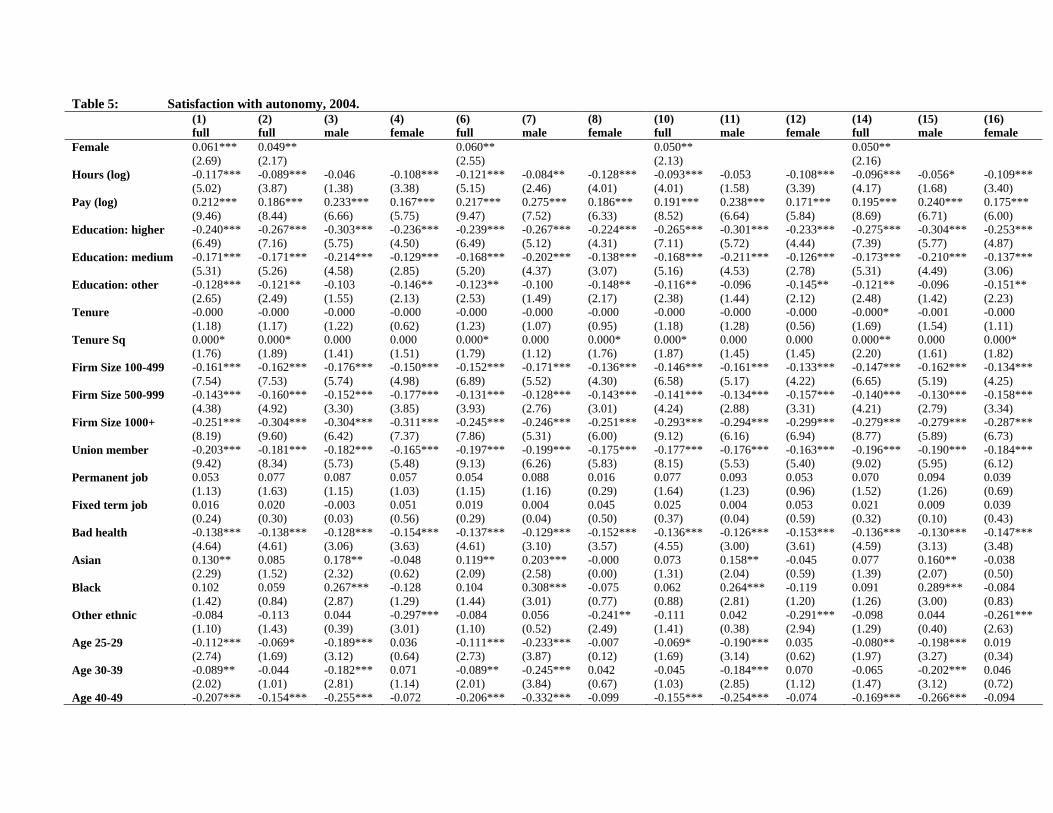
Table 5: Satisfaction with autonomy, 2004. (1) (2) (3) (4) (6) (7) (8) (10) (11) (12) (14) (15) (16)
full full male
female
full male
female
full male
female
full male
female 0.061*** 0.049** 0.060** 0.050** 0.050**Female
(2.69) (2.17)
-0.121**
(2.55) (2.13) (2.16) -0.117***
-0.089***
-0.046 -0.108***
-0.121***
-0.084**
-0.128***
-0.093***
-0.053 -0.108***
-0.096***
-0.056* -0.109***
Hours (log)
(5.02) (3.87) (1.38) (3.38) (5.15) (2.46) (4.01) (4.01) (1.58) (3.39) (4.17) (1.68) (3.40) 0.212***
0.186***
0.233***
0.167***
0.217***
0.275***
0.186***
0.191***
0.238***
0.171***
0.195***
0.240***
0.175***
Pay (log)
(9.46) (8.44) (6.66) (5.75) (9.47) (7.52) (6.33) (8.52) (6.64) (5.84) (8.69) (6.71) (6.00) -0.240***
-0.267***
-0.303***
-0.236***
-0.239***
-0.267***
-0.224***
-0.265***
-0.301***
-0.233***
-0.275***
-0.304***
-0.253***
Education: higher
(6.49) (7.16) (5.75) (4.50) (6.49) (5.12) (4.31) (7.11) (5.72) (4.44) (7.39) (5.77) (4.87) -0.171***
Education: medium -0.171***
-0.214***
-0.129***
-0.168***
-0.202***
-0.138***
-0.168***
-0.211***
-0.126***
-0.173***
-0.210***
-0.137***
(5.31) (5.26) (4.58) (2.85) (5.20) (4.37) (3.07) (5.16) (4.53) (2.78) (5.31) (4.49) (3.06)Education: other -0.128***
-0.103 -0.146**
-0.123**
-0.100 -0.148**
-0.116**
-0.096 -0.145**
-0.121**
-0.096 -0.151**
(2.65) (2.49) (1.55) (2.13) (2.53) (1.49) (2.17) (2.38) (1.44) (2.12) (2.48) (1.42) (2.23)Tenure -0.000 -0.000 -0.000 -0.000 -0.000 -0.000 -0.000 -0.000 -0.000 -0.000 -0.000* -0.001 -0.000 (1.18) (1.17) (1.22) (0.62) (1.23) (1.07) (0.95) (1.18) (1.28) (0.56) (1.69) (1.54) (1.11)Tenure Sq 0.000* 0.000* 0.000 0.000 0.000* 0.000 0.000* 0.000* 0.000 0.000 0.000** 0.000 0.000* (1.76) (1.89) (1.41) (1.51) (1.79) (1.12) (1.76) (1.87) (1.45) (1.45) (2.20) (1.61) (1.82)Firm Size 100-499 -0.161***
-0.162***
-0.176***
-0.150***
-0.152***
-0.171***
-0.136***
-0.146***
-0.161***
-0.133***
-0.147***
-0.162***
-0.134***
(7.54) (7.53) (5.74) (4.98) (6.89) (5.52) (4.30) (6.58) (5.17) (4.22) (6.65) (5.19) (4.25)Firm Size 500-999 -0.143***
-0.160***
-0.152***
-0.177***
-0.131***
-0.128***
-0.143***
-0.141***
-0.134***
-0.157***
-0.140***
-0.130***
-0.158***
(4.38) (4.92) (3.30) (3.85) (3.93) (2.76) (3.01) (4.24) (2.88) (3.31) (4.21) (2.79) (3.34)Firm Size 1000+ -0.251***
-0.304***
-0.304***
-0.311***
-0.245***
-0.246***
-0.251***
-0.293***
-0.294***
-0.299***
-0.279***
-0.279***
-0.287***
(8.19) (9.60) (6.42) (7.37) (7.86) (5.31) (6.00) (9.12) (6.16) (6.94) (8.77) (5.89) (6.73)Union member -0.203***
-0.181***
-0.182***
-0.165***
-0.197***
-0.199***
-0.175***
-0.177***
-0.176***
-0.163***
-0.196***
-0.190***
-0.184***
(9.42) (8.34) (5.73) (5.48) (9.13) (6.26) (5.83) (8.15) (5.53) (5.40) (9.02) (5.95) (6.12)Permanent job 0.053 0.077 0.087 0.057 0.054 0.088 0.016 0.077 0.093 0.053 0.070 0.094 0.039 (1.13) (1.63) (1.15) (1.03) (1.15) (1.16) (0.29) (1.64) (1.23) (0.96) (1.52) (1.26) (0.69)Fixed term job 0.016 0.020 -0.003 0.051 0.019 0.004 0.045 0.025 0.004 0.053 0.021 0.009 0.039 (0.24) (0.30) (0.03) (0.56) (0.29) (0.04) (0.50) (0.37) (0.04) (0.59) (0.32) (0.10) (0.43)Bad health -0.138***
-0.138***
-0.128***
-0.154***
-0.137***
-0.129***
-0.152***
-0.136***
-0.126***
-0.153***
-0.136***
-0.130***
-0.147***
(4.64) (4.61) (3.06) (3.63) (4.61) (3.10) (3.57) (4.55) (3.00) (3.61) (4.59) (3.13) (3.48)Asian 0.130** 0.085 0.178** -0.048 0.119** 0.203***
-0.000 0.073 0.158** -0.045 0.077 0.160** -0.038
(2.29) (1.52) (2.32) (0.62) (2.09) (2.58) (0.00) (1.31) (2.04) (0.59) (1.39) (2.07) (0.50)Black 0.102 0.059 0.267***
-0.128 0.104 0.308***
-0.075 0.062 0.264***
-0.119 0.091 0.289***
-0.084
(1.42) (0.84) (2.87) (1.29) (1.44) (3.01) (0.77) (0.88) (2.81) (1.20) (1.26) (3.00) (0.83)Other ethnic -0.084 -0.113 0.044 -0.297***
-0.084 0.056 -0.241**
-0.111 0.042 -0.291***
-0.098 0.044 -0.261***
(1.10) (1.43) (0.39) (3.01)
(1.10) (0.52) (2.49) (1.41) (0.38) (2.94) (1.29) (0.40) (2.63)Age 25-29 -0.112***
-0.069* -0.189***
0.036 -0.111***
-0.233***
-0.007 -0.069* -0.190***
0.035 -0.080**
-0.198***
0.019
(2.74) (1.69) (3.12) (0.64) (2.73) (3.87) (0.12) (1.69) (3.14) (0.62) (1.97) (3.27) (0.34)Age 30-39 -0.089**
-0.044 -0.182***
0.071 -0.089**
-0.245***
0.042 -0.045 -0.184***
0.070 -0.065 -0.202***
0.046
(2.02) (1.01) (2.81) (1.14) (2.01) (3.84) (0.67) (1.03) (2.85) (1.12) (1.47) (3.12) (0.72)Age 40-49 -0.207*** -0.154*** -0.255*** -0.072 -0.206*** -0.332*** -0.099 -0.155*** -0.254*** -0.074 -0.169*** -0.266*** -0.094

(3.87) (2.92) (3.44) (0.92) (3.83) (4.51) (1.24) (2.92) (3.44) (0.93) (3.15) (3.58) (1.17)Age 50-59 -0.245***
*** -0.197*** -0.085 (0.62) (3.63) (3.79) (0.95)
Financial services -0.287*** -0.295*** -0.356*** -0.270*** -0.296*** -0.350*** -0.265*** -0.293*** -0.357*** -0.254*** -0.302*** -0.360*** -0.269*** (6.73) (6.97) (5.92) (4.06) (6.62) (5.44) (3.80) (6.59) (5.58) (3.69) (6.76) (5.62) (3.89) Other business SS -0.012 -0.083** -0.106** -0.070 -0.014 -0.033 -0.002 -0.079** -0.106** -0.054 -0.070* -0.094* -0.056 (0.32) (2.18) (2.17) (1.09) (0.36) (0.66) (0.02) (2.01) (2.09) (0.81) (1.79) (1.87) (0.86) Public Admin -0.099** -0.265*** -0.299*** -0.248*** -0.109** -0.172*** -0.055 -0.265*** -0.304*** -0.235*** -0.261*** -0.307*** -0.223*** (2.38) (6.18) (5.08) (3.64) (2.54) (2.89) (0.81) (6.02) (5.03) (3.36) (5.96) (5.06) (3.22) Education 0.114*** 0.138*** 0.206*** 0.081 0.120*** 0.217*** 0.063 0.154*** 0.227*** 0.103 0.130*** 0.223*** 0.069 (2.76) (3.33) (3.23) (1.25) (2.67) (3.11) (0.90) (3.41) (3.23) (1.50) (2.89) (3.19) (1.00) Health 0.138*** 0.067* 0.011 0.103* 0.138*** 0.084 0.174*** 0.065 0.013 0.108 0.073 0.023 0.108 (3.51) (1.68) (0.16) (1.71) (3.13) (1.10) (2.60) (1.46) (0.16) (1.62) (1.64) (0.30) (1.62) Other community 0.078 0.015 0.008 0.038 0.067 0.075 0.081 0.013 0.002 0.046 0.015 0.011 0.034 (1.58) (0.31) (0.12) (0.47) (1.33) (1.15) (0.98) (0.27) (0.03) (0.57) (0.29) (0.17) (0.42) Professional -0.393*** -0.356*** -0.374*** -0.313*** -0.392*** -0.390*** -0.379*** -0.358*** -0.374*** -0.317*** -0.357*** -0.370*** -0.325*** (9.72) (8.78) (7.15) (4.85) (9.64) (7.45) (5.91) (8.77) (7.11) (4.92) (8.79) (7.07) (5.03) Ass Professional -0.343*** -0.292*** -0.247*** -0.326*** -0.341*** -0.281*** -0.390*** -0.291*** -0.247*** -0.323*** -0.295*** -0.245*** -0.333*** (8.98) (7.65) (4.84) (5.45) (8.91) (5.48) (6.56) (7.58) (4.83) (5.40) (7.72) (4.81) (5.58) Clerical -0.443*** -0.397*** -0.307*** -0.441*** -0.439*** -0.321*** -0.510*** -0.394*** -0.303*** -0.440*** -0.399*** -0.298*** -0.453*** (11.40) (10.01) (5.10) (7.47) (11.27) (5.43) (8.70) (9.92) (5.06) (7.44) (10.16) (5.00) (7.70) Skilled trades -0.424*** -0.312*** -0.320*** -0.146 -0.425*** -0.408*** -0.260* -0.320*** -0.328*** -0.142 -0.338*** -0.334*** -0.161 (8.74) (6.33) (5.77) (1.00) (8.58) (7.32) (1.79) (6.38) (5.80) (0.98) (6.80) (5.96) (1.10) Personal SS -0.410*** -0.300*** -0.346*** -0.288*** -0.410*** -0.442*** -0.419*** -0.303*** -0.342*** -0.292*** -0.312*** -0.344*** -0.313*** (8.60) (6.23) (3.99) (4.23) (8.56) (5.12) (6.19) (6.28) (3.92) (4.28) (6.48) (3.97) (4.59) Sales -0.511*** -0.427*** -0.396*** -0.432*** -0.514*** -0.457*** -0.536*** -0.431*** -0.398*** -0.435*** -0.440*** -0.402*** -0.451*** (10.14) (8.40) (5.17) (5.78) (10.23) (6.04) (7.20) (8.50) (5.22) (5.81) (8.69) (5.29) (6.01) Operatives -0.636*** -0.521*** -0.501*** -0.552*** -0.636*** -0.600*** -0.654*** -0.527*** -0.509*** -0.544*** -0.549*** -0.518*** -0.583*** (12.81) (10.41) (8.41) (5.37) (12.70) (10.02) (6.33) (10.46) (8.45) (5.31) (10.94) (8.62) (5.73) Elementary -0.438*** -0.331*** -0.358*** -0.254*** -0.432*** -0.438*** -0.375*** -0.330*** -0.359*** -0.249*** -0.344*** -0.364*** -0.268*** (9.29) (6.96) (5.82) (3.37) (9.05) (7.04) (4.99) (6.87) (5.75) (3.29) (7.16) (5.84) (3.53)
-0.173**
-0.242***
-0.118 -0.245***
-0.340***
-0.163 -0.174**
-0.243***
-0.121 -0.189***
-0.254***
-0.144 (3.55) (2.54) (2.65) (1.15) (3.54) (3.75) (1.55) (2.55) (2.67) (1.16) (2.73) (2.76) (1.36)Age 60+ -0.121 -0.023 -0.127 0.087 -0.120 -0.258**
0.030 -0.024 -0.127 0.083 -0.040 -0.137 0.061
(1.23) (0.23) (1.02) (0.57) (1.22) (2.11) (0.19) (0.24) (1.03) (0.54) (0.40) (1.10) (0.39)Age Sq 0.007***
0.007***
0.007***
0.006***
0.007***
0.008***
0.006** 0.007***
0.007***
0.006***
0.007***
0.007***
0.006**
(4.84) (4.56) (3.64) (2.61) (4.86) (4.38) (2.37) (4.57) (3.66) (2.61) (4.25) (3.42) (2.42)Utilities -0.071 -0.129 -0.151 -0.062 -0.070 -0.113 0.014 -0.128 -0.151 -0.061 -0.105 -0.131 -0.052 (0.85) (1.60) (1.57) (0.44) (0.83) (1.12) (0.10) (1.59) (1.56) (0.44) (1.29) (1.35) (0.37)Construction 0.148***
0.126** 0.098* 0.220* 0.154***
0.113** 0.296** 0.127** 0.099* 0.211* 0.133***
0.110** 0.200
(2.91) (2.49) (1.75) (1.76) (3.01) (2.02) (2.35) (2.49) (1.78) (1.69) (2.61) (1.98) (1.58)Wholesale 0.060 0.045 0.059 0.018 0.064 0.092* 0.028 0.053 0.071 0.028 0.056 0.080 0.023 (1.50) (1.12) (1.15) (0.26) (1.59) (1.79) (0.40) (1.31) (1.37) (0.40) (1.39) (1.54) (0.33)Hospitality 0.225***
0.152** 0.247** 0.049 0.224***
0.318***
0.126 0.165** 0.251** 0.076 0.152** 0.239** 0.052
(3.52) (2.36) (2.53) (0.54) (3.39) (3.22) (1.33) (2.48) (2.52) (0.81) (2.29)-0.163
(2.41)
(0.55)Transport and Tele
-0.161***(3.61)
-0.153*** -0.193*** -0.058(3.44) (3.76) (0.65) (3.67) (3.80)
-0.164*** -0.195*** -0.087(0.
-0.158***96) (3.53)
-0.199***(3.85)
-0.055
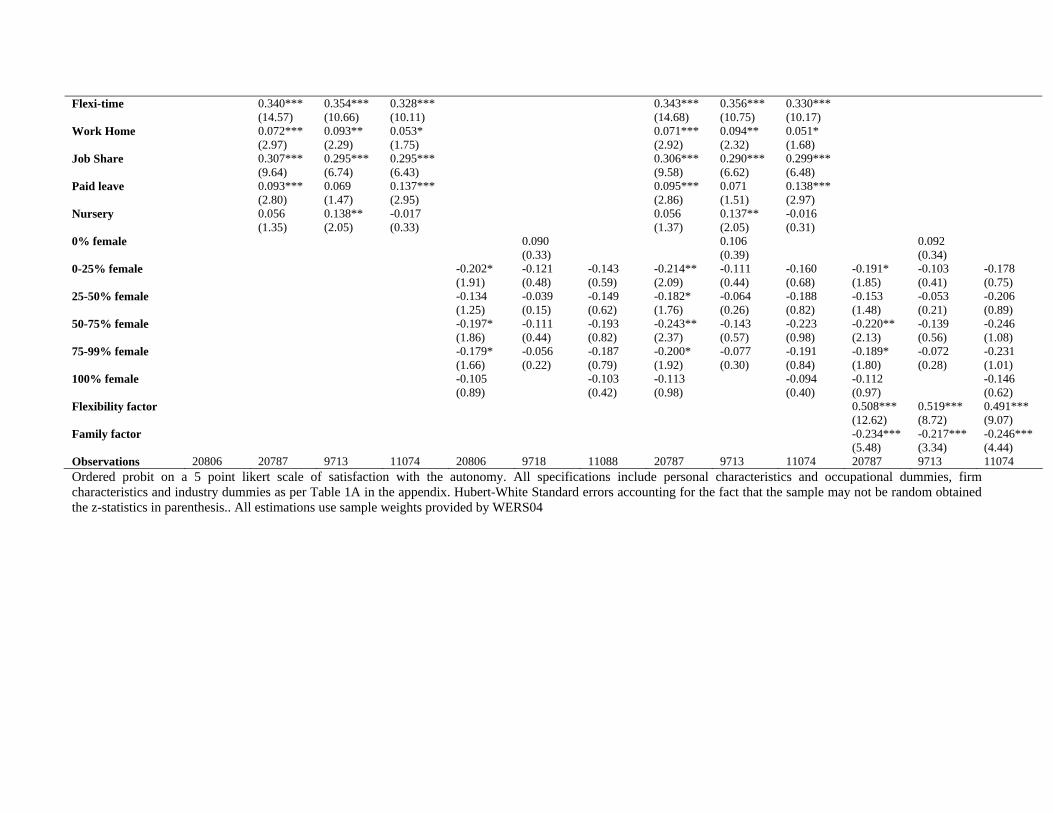
Flexi-time 0.340*** 0.354*** 0.328*** 0.343*** 0.356*** 0.330*** (14.57) (10.66) (10.11) (14.68) (10.75) (10.17) Work Home 0.072*** 0.093** 0.053* 0.071*** 0.094** 0.051* (2.97) (2.29) (1.75) (2.92) (2.32) (1.68) Job Share 0.307*** 0.295*** 0.295*** 0.306*** 0.290*** 0.299*** (9.64) (6.74) (6.43) (9.58) (6.62) (6.48) Paid leave 0.093*** 0.069 0.137*** 0.095*** 0.071 0.138*** (2.80) (1.47) (2.95) (2.86) (1.51) (2.97) Nursery 0.056 0.138** -0.017 0.056 0.137** -0.016 (1.35) (2.05) (0.33) (1.37) (2.05) (0.31) 0% female 0.090 0.106 0.092 (0.33) (0.39) (0.34) 0-25% female -0.202* -0.121 -0.143 -0.214** -0.111 -0.160 -0.191* -0.103 -0.178 (1.91) (0.48) (0.59) (2.09) (0.44) (0.68) (1.85) (0.41) (0.75) 25-50% female -0.134 -0.039 -0.149 -0.182* -0.064 -0.188 -0.153 -0.053 -0.206 (1.25) (0.15) (0.62) (1.76) (0.26) (0.82) (1.48) (0.21) (0.89) 50-75% female -0.197* -0.111 -0.193 -0.243** -0.143 -0.223 -0.220** -0.139 -0.246 (1.86) (0.44) (0.82) (2.37) (0.57) (0.98) (2.13) (0.56) (1.08) 75-99% female -0.179* -0.056 -0.187 -0.200* -0.077 -0.191 -0.189* -0.072 -0.231 (1.66) (0.22) (0.79) (1.92) (0.30) (0.84) (1.80) (0.28) (1.01) 100% female -0.105 -0.103 -0.113 -0.094 -0.112 -0.146 (0.89) (0.42) (0.98) (0.40) (0.97) (0.62) Flexibility factor 0.508*** 0.519*** 0.491*** (12.62) (8.72) (9.07) Family factor -0.234*** -0.217*** -0.246*** (5.48) (3.34) (4.44) Observations 20806 20787 9713 11074 20806 9718 11088 20787 9713 11074 20787 9713 11074 Ordered probit on a 5 point likert scale of satisfaction with the autonomy. All specifications include personal characteristics and occupational dummies, firm characteristics and industry dummies as per Table 1A in the appendix. Hubert-White Standard errors accounting for the fact that the sample may not be random obtained the z-statistics in parenthesis.. All estimations use sample weights provided by WERS04

Table A3: Satisfaction with pay 1998 (1) (2) (3) (4) (5) (7) (8) (9) (11) (12) (13) (15) (16) full full male female full male female full male female full male female Female 0.305*** 0.287*** 0.305*** 0.291*** 0.292*** (10.67) (9.96) (10.47) (9.86) (9.92) Hours (log) -0.880*** -0.870*** -0.822*** -0.826*** -0.879*** -0.838*** -0.838*** -0.868*** -0.821*** -0.821*** -0.865*** -0.824*** -0.819*** (20.04) (20.13) (12.66) (14.37) (19.99) (12.41) (14.42) (20.07) (12.59) (14.30) (19.78) (12.28) (14.20) Pay (log) 0.705*** 0.699*** 0.863*** 0.599*** 0.701*** 0.863*** 0.603*** 0.693*** 0.864*** 0.583*** 0.687*** 0.851*** 0.584*** (19.74) (19.98) (16.74) (12.47) (19.53) (15.84) (12.49) (19.71) (16.52) (12.23) (19.30) (15.68) (12.22) Education: higher -0.237*** -0.269*** -0.214*** -0.363*** -0.238*** -0.187*** -0.328*** -0.268*** -0.216*** -0.363*** -0.268*** -0.212*** -0.362*** (4.80) (5.49) (3.11) (5.78) (4.88) (2.68) (5.30) (5.52) (3.14) (5.85) (5.44) (3.00) (5.85) Education: medium
-0.101*** -0.113*** -0.101* -0.138*** -0.102*** -0.094* -0.124** -0.113*** -0.102* -0.140*** -0.111*** -0.100* -0.138***
(2.71) (3.04) (1.95) (2.84) (2.72) (1.79) (2.58) (3.04) (1.96) (2.90) (2.95) (1.89) (2.86) Education: other 0.151 0.103 -0.024 0.323 0.145 0.034 0.370 0.097 -0.022 0.340 0.150 0.045 0.382 (0.42) (0.30) (0.03) (0.97) (0.40) (0.04) (1.06) (0.28) (0.03) (1.03) (0.43) (0.05) (1.14) Tenure -0.001** -0.001** -0.001** -0.001* -0.001** -0.001** -0.000 -0.001** -0.001** -0.001* -0.001*** -0.001** -0.001* (2.31) (2.51) (2.42) (1.67) (2.33) (2.32) (1.44) (2.52) (2.44) (1.69) (2.60) (2.46) (1.72) Tenure Sq 0.000 0.000 0.000 0.000 0.000 0.000 0.000 0.000 0.000 0.000 0.000 0.000 0.000 (0.32) (0.49) (0.81) (0.29) (0.35) (0.79) (0.08) (0.51) (0.84) (0.32) (0.59) (0.90) (0.33) Firm Size 100-499 -0.031 -0.039** -0.025 -0.055** -0.033* -0.019 -0.053** -0.040** -0.027 -0.060** -0.039** -0.024 -0.063** (1.62) (2.09) (0.92) (2.10) (1.74) (0.68) (2.02) (2.12) (0.99) (2.27) (2.10) (0.86) (2.40) Firm Size 500-999 -0.018 -0.030 -0.005 -0.057 -0.020 0.004 -0.053 -0.030 -0.006 -0.062 -0.036 -0.011 -0.071 (0.61) (0.98) (0.12) (1.24) (0.66) (0.10) (1.14) (0.98) (0.15) (1.33) (1.16) (0.26) (1.53) Firm Size 1000+ 0.049 0.025 0.087 -0.042 0.046 0.121* -0.035 0.021 0.085 -0.056 0.021 0.096 -0.066 (1.05) (0.53) (1.31) (0.69) (0.98) (1.73) (0.57) (0.47) (1.27) (0.91) (0.45) (1.40) (1.08) Union member -0.019 -0.020 -0.043 0.023 -0.014 -0.032 0.033 -0.016 -0.040 0.029 -0.014 -0.037 0.033 (0.75) (0.78) (1.20) (0.62) (0.53) (0.91) (0.86) (0.64) (1.15) (0.77) (0.53) (1.04) (0.87) Permanent job -0.094** -0.097** -0.180** -0.073 -0.094** -0.180** -0.069 -0.097** -0.182** -0.073 -0.091** -0.177** -0.068 (2.04) (2.11) (2.35) (1.27) (2.04) (2.35) (1.20) (2.10) (2.36) (1.26) (1.99) (2.32) (1.19) Fixed term job -0.096 -0.097 -0.096 -0.139 -0.097 -0.092 -0.142 -0.098 -0.095 -0.142 -0.095 -0.091 -0.139 (1.47) (1.47) (0.96) (1.54) (1.48) (0.93) (1.60) (1.48) (0.96) (1.58) (1.45) (0.93) (1.55) Bad health -0.189*** -0.198*** -0.244*** -0.100* -0.189*** -0.246*** -0.075 -0.198*** -0.242*** -0.102* -0.201*** -0.251*** -0.096* (4.30) (4.62) (3.87) (1.77) (4.32) (3.89) (1.29) (4.62) (3.85) (1.79) (4.65) (3.95) (1.69) Asian -0.011 -0.012 0.209 -0.210** -0.012 0.200 -0.200** -0.012 0.208 -0.208** -0.018 0.208 -0.215** (0.08) (0.09) (0.84) (2.44) (0.09) (0.78) (2.27) (0.09) (0.84) (2.43) (0.13) (0.81) (2.52) Black -0.270*** -0.268*** -0.150 -0.297** -0.272*** -0.158 -0.307*** -0.269*** -0.150 -0.301** -0.269*** -0.157 -0.304** (3.23) (3.11) (1.27) (2.43) (3.26) (1.33) (2.65) (3.13) (1.27) (2.48) (3.17) (1.32) (2.54) Other ethnic -0.081 -0.083 -0.059 -0.072 -0.083 -0.065 -0.076 -0.084 -0.058 -0.076 -0.084 -0.064 -0.078 (1.20) (1.23) (0.60) (0.78) (1.22) (0.65) (0.82) (1.24) (0.59) (0.81) (1.25) (0.65) (0.84) Age 25-29 0.400*** 0.396*** 0.917*** 0.054 0.399*** 0.922*** 0.049 0.396*** 0.919*** 0.043 0.377*** 0.904*** 0.026 (3.35) (3.35) (4.86) (0.35) (3.34) (4.77) (0.32) (3.34) (4.84) (0.28) (3.17) (4.72) (0.17) Age 30-39 1.096*** 1.088*** 2.417*** 0.255 1.094*** 2.406*** 0.256 1.087*** 2.419*** 0.235 1.041*** 2.362*** 0.201 (4.53) (4.52) (6.26) (0.81) (4.51) (6.13) (0.82) (4.51) (6.24) (0.75) (4.32) (6.08) (0.64)

Age 40-49 1.983*** 1.971*** 4.408*** 0.440 1.981*** 4.386*** 0.438 1.970*** 4.410*** 0.407 1.896*** 4.312*** 0.357 (4.88) (4.88) (6.79) (0.84) (4.87) (6.65) (0.84) (4.87) (6.77) (0.78) (4.69) (6.61) (0.68) Age 50-59 3.039*** 3.017*** 6.702*** 0.741 3.034*** 6.672*** 0.738 3.015*** 6.704*** 0.689 2.910*** 6.563*** 0.619 (5.00) (4.99) (6.90) (0.95) (4.98) (6.77) (0.94) (4.98) (6.88) (0.88) (4.81) (6.72) (0.79) Age 60+ 4.567*** 4.538*** 9.861*** 1.300 4.561*** 9.815*** 1.293 4.538*** 9.864*** 1.228 4.390*** 9.665*** 1.132 (5.38) (5.37) (7.26) (1.19) (5.36) (7.12) (1.18) (5.37) (7.24) (1.12) (5.19) (7.08) (1.03) Age Sq -0.095*** -0.093*** -0.212*** -0.022 -0.095*** -0.212*** -0.022 -0.093*** -0.212*** -0.020 -0.091*** -0.208*** -0.019 (5.16) (5.11) (7.24) (0.93) (5.14) (7.13) (0.94) (5.11) (7.22) (0.86) (4.96) (7.07) (0.79) Utilities 0.200*** 0.158*** 0.142** 0.187* 0.199*** 0.178*** 0.226** 0.158*** 0.141** 0.196* 0.151*** 0.139** 0.173 (3.91) (3.10) (2.42) (1.84) (3.88) (3.02) (2.13) (3.09) (2.41) (1.89) (2.97) (2.39) (1.63) Construction -0.047 -0.053 0.007 -0.168 -0.043 0.021 -0.162 -0.055 0.010 -0.194* -0.061 0.007 -0.202* (0.97) (1.12) (0.14) (1.50) (0.89) (0.40) (1.46) (1.13) (0.20) (1.73) (1.26) (0.13) (1.79) Wholesale -0.033 -0.036 0.002 -0.085 -0.029 0.007 -0.065 -0.026 -0.003 -0.044 -0.027 0.002 -0.050 (0.81) (0.89) (0.05) (1.08) (0.71) (0.15) (0.79) (0.64) (0.06) (0.56) (0.66) (0.04) (0.62) Hospitality -0.059 -0.069 0.162** -0.229** -0.049 0.177** -0.194* -0.045 0.157* -0.170* -0.062 0.153* -0.191* (1.07) (1.24) (2.05) (2.45) (0.85) (2.22) (1.90) (0.80) (1.94) (1.73) (1.07) (1.90) (1.88) Transport and Tele
-0.223*** -0.238*** -0.201*** -0.218** -0.220*** -0.182*** -0.208** -0.237*** -0.198*** -0.219** -0.238*** -0.198*** -0.223**
(4.71) (5.09) (3.86) (2.32) (4.60) (3.39) (2.20) (5.04) (3.75) (2.35) (5.00) (3.71) (2.37) Financial services -0.070 -0.109** -0.122* -0.141 -0.056 -0.086 -0.052 -0.084 -0.125* -0.066 -0.084 -0.118* -0.067 (1.30) (2.08) (1.74) (1.58) (1.04) (1.20) (0.54) (1.60) (1.78) (0.72) (1.57) (1.66) (0.72) Other business SS -0.132*** -0.160*** -0.172*** -0.171** -0.126*** -0.144*** -0.117 -0.148*** -0.177*** -0.118 -0.157*** -0.187*** -0.127 (3.13) (3.79) (3.39) (2.13) (2.97) (2.90) (1.35) (3.48) (3.48) (1.41) (3.70) (3.76) (1.49) Public Admin -0.223*** -0.293*** -0.297*** -0.334*** -0.216*** -0.231*** -0.223** -0.277*** -0.300*** -0.284*** -0.284*** -0.296*** -0.298*** (4.51) (5.90) (4.75) (3.75) (4.39) (3.81) (2.36) (5.60) (4.85) (3.09) (5.63) (4.73) (3.13) Education -0.185*** -0.181*** -0.145** -0.227*** -0.169*** -0.170** -0.176* -0.152*** -0.152** -0.151* -0.165*** -0.178*** -0.157* (3.81) (3.70) (2.22) (2.61) (3.40) (2.54) (1.86) (3.02) (2.16) (1.65) (3.27) (2.60) (1.67) Health -0.275*** -0.287*** -0.257*** -0.320*** -0.261*** -0.279*** -0.241** -0.264*** -0.290*** -0.231** -0.278*** -0.296*** -0.248** (4.73) (4.99) (2.78) (3.42) (4.36) (2.64) (2.38) (4.44) (2.80) (2.38) (4.65) (2.87) (2.47) Other community -0.233*** -0.246*** -0.127** -0.326*** -0.229*** -0.112* -0.283*** -0.235*** -0.130** -0.280*** -0.245*** -0.131** -0.291*** (4.58) (4.84) (2.04) (3.59) (4.47) (1.81) (2.91) (4.59) (2.08) (2.96) (4.75) (2.10) (2.99) Professional -0.326*** -0.297*** -0.298*** -0.238*** -0.324*** -0.306*** -0.300*** -0.297*** -0.295*** -0.242*** -0.294*** -0.287*** -0.249*** (6.19) (5.67) (4.23) (3.33) (6.16) (4.33) (3.88) (5.67) (4.17) (3.38) (5.62) (4.05) (3.43) Ass Professional -0.405*** -0.373*** -0.273*** -0.403*** -0.407*** -0.276*** -0.481*** -0.378*** -0.272*** -0.412*** -0.375*** -0.260*** -0.421*** (7.48) (6.87) (3.95) (5.52) (7.47) (3.93) (6.16) (6.92) (3.88) (5.64) (6.85) (3.67) (5.67) Clerical -0.296*** -0.271*** -0.196** -0.277*** -0.296*** -0.192** -0.348*** -0.273*** -0.196** -0.292*** -0.272*** -0.182** -0.305*** (5.95) (5.29) (2.38) (4.60) (5.92) (2.39) (5.55) (5.29) (2.37) (4.88) (5.33) (2.20) (5.11) Skilled trades -0.408*** -0.359*** -0.292*** -0.346*** -0.405*** -0.318*** -0.381*** -0.361*** -0.288*** -0.326*** -0.357*** -0.277*** -0.332*** (6.21) (5.43) (3.58) (3.12) (6.07) (3.78) (3.33) (5.39) (3.47) (2.95) (5.32) (3.28) (2.99) Personal SS -0.133** -0.080 0.074 -0.172** -0.139** 0.018 -0.246*** -0.093 0.076 -0.188** -0.083 0.080 -0.192** (2.22) (1.33) (0.87) (2.23) (2.29) (0.20) (3.13) (1.53) (0.87) (2.46) (1.36) (0.90) (2.49) Sales -0.078 -0.054 -0.010 -0.068 -0.072 -0.025 -0.102 -0.048 -0.008 -0.051 -0.043 -0.010 -0.056 (1.30) (0.90) (0.12) (0.92) (1.20) (0.29) (1.33) (0.80) (0.09) (0.69) (0.71) (0.12) (0.75) Operatives -0.174** -0.131 -0.015 -0.202* -0.175** -0.035 -0.279** -0.134 -0.012 -0.203 -0.130 -0.001 -0.212* (2.13) (1.60) (0.15) (1.66) (2.14) (0.34) (2.20) (1.64) (0.12) (1.64) (1.56) (0.01) (1.70)

Elementary -0.061 -0.015 -0.073 0.075 -0.063 -0.104 -0.008 -0.020 -0.071 0.061 -0.011 -0.063 0.060 (0.85) (0.20) (0.80) (0.77) (0.86) (1.12) (0.08) (0.27) (0.78) (0.63) (0.15) (0.67) (0.60) Flexi-time 0.121*** 0.173*** 0.077*** 0.123*** 0.173*** 0.081*** (5.04) (4.56) (2.59) (5.10) (4.54) (2.70) Work Home 0.074** -0.003 0.158*** 0.072** -0.004 0.157*** (2.19) (0.06) (3.05) (2.14) (0.09) (3.04) Job Share 0.024 -0.024 0.075** 0.025 -0.027 0.079** (0.75) (0.39) (2.13) (0.77) (0.42) (2.27) Paid leave 0.159*** 0.168*** 0.143*** 0.160*** 0.168*** 0.144*** (5.83) (3.98) (4.31) (5.86) (3.98) (4.32) Nursery -0.072 -0.057 -0.076 -0.068 -0.054 -0.071 (0.93) (0.37) (1.14) (0.87) (0.36) (1.07) 0% female -0.065 0.039 -0.002 0.039 -0.001 0.039 (0.50) (0.18) (0.01) (0.18) (0.01) (0.18) 0-25% female 0.017 0.094 0.092 0.050 0.057 0.096 0.052 0.065 0.091 (0.19) (0.50) (0.57) (0.58) (0.30) (0.60) (0.60) (0.35) (0.57) 25-50% female 0.064 0.138 0.084 0.077 0.086 0.068 0.083 0.098 0.063 (0.74) (0.73) (0.56) (0.89) (0.46) (0.47) (0.96) (0.52) (0.43) 50-75% female -0.002 0.121 -0.014 0.000 0.060 -0.039 0.005 0.068 -0.047 (0.03) (0.64) (0.09) (0.01) (0.32) (0.28) (0.06) (0.36) (0.33) 75-99% female 0.019 0.166 -0.018 0.033 0.118 -0.038 0.036 0.119 -0.043 (0.23) (0.84) (0.12) (0.41) (0.60) (0.27) (0.44) (0.60) (0.30) 100% female -0.059 -0.101 -0.119 (0.34) (0.59) (0.69) Flexibility factor -0.050 0.034 -0.076 (0.43) (0.17) (0.62) Family factor 0.217* 0.113 0.262* (1.66) (0.52) (1.78) Observations 25451 25451 12649 12802 25451 12649 12802 25451 12649 12802 25451 12649 12802 Ordered probit on a 5 point likert scale of satisfaction with pay. All specifications include personal characteristics and occupational dummies, firm characteristics and industry dummies as per Table 1A in the appendix. Hubert-White corrected z-statistics in parenthesis. All estimations use sample weights provided for WERS98

Table A4: Satisfaction with autonomy 1998 (1) (2) (3) (4) (6) (7) (8) (10) (11) (12) (14) (15) (16) full full male female full male female full male female full male Female Female 0.115*** 0.096*** 0.106*** 0.094*** 0.094*** (4.56) (3.80) (4.10) (3.59) (3.56) Hours (log) -0.141*** -0.118*** -0.135*** -0.069 -0.140*** -0.161*** -0.090** -0.116*** -0.132*** -0.063 -0.113*** -0.135*** -0.059 (4.24) (3.59) (2.72) (1.63) (4.19) (3.16) (2.13) (3.49) (2.63) (1.49) (3.38) (2.67) (1.39) Pay (log) 0.140*** 0.131*** 0.182*** 0.084** 0.138*** 0.190*** 0.096** 0.127*** 0.181*** 0.074** 0.114*** 0.163*** 0.068* (4.86) (4.58) (4.26) (2.27) (4.71) (4.36) (2.51) (4.33) (4.20) (1.97) (3.85) (3.75) (1.76) Education: higher -0.304*** -0.353*** -0.288*** -0.445*** -0.309*** -0.245*** -0.397*** -0.354*** -0.293*** -0.444*** -0.356*** -0.289*** -0.448*** (7.52) (8.75) (5.16) (7.95) (7.65) (4.36) (7.11) (8.79) (5.25) (7.93) (8.79) (5.11) (8.01) Education: medium -0.221*** -0.234*** -0.257*** -0.218*** -0.221*** -0.248*** -0.199*** -0.234*** -0.256*** -0.219*** -0.233*** -0.255*** -0.218*** (7.13) (7.58) (5.89) (5.26) (7.14) (5.65) (4.84) (7.58) (5.90) (5.28) (7.54) (5.83) (5.27) Education: other 0.181 0.163 -0.230 0.500* 0.173 -0.217 0.502* 0.156 -0.239 0.508* 0.191 -0.174 0.523* (0.84) (0.78) (0.77) (1.82) (0.79) (0.59) (1.88) (0.74) (0.76) (1.80) (0.86) (0.52) (1.82) Tenure -0.001** -0.001** -0.001** -0.000 -0.001** -0.001* -0.000 -0.001** -0.001** -0.000 -0.001** -0.001** -0.001 (2.00) (2.34) (2.00) (1.44) (2.05) (1.78) (1.14) (2.36) (2.05) (1.45) (2.43) (1.99) (1.52) Tenure Sq 0.000** 0.000** 0.000** 0.000 0.000** 0.000** 0.000 0.000** 0.000** 0.000 0.000** 0.000** 0.000 (2.02) (2.38) (2.28) (1.16) (2.08) (2.07) (0.86) (2.42) (2.33) (1.18) (2.47) (2.29) (1.24) Firm Size 100-499 -0.019 -0.032* -0.016 -0.051* -0.024 -0.013 -0.037 -0.034* -0.021 -0.052* -0.034* -0.018 -0.052* (1.01) (1.70) (0.59) (1.92) (1.24) (0.47) (1.41) (1.81) (0.76) (1.93) (1.76) (0.66) (1.96) Firm Size 500-999 -0.067** -0.089*** -0.081** -0.093* -0.072** -0.073* -0.069 -0.091*** -0.087** -0.093* -0.094*** -0.093** -0.094** (2.22) (2.89) (1.97) (1.95) (2.35) (1.79) (1.47) (2.94) (2.11) (1.93) (3.06) (2.27) (1.98) Firm Size 1000+ -0.026 -0.061 -0.005 -0.130** -0.030 0.021 -0.098 -0.065 -0.008 -0.139** -0.060 0.003 -0.140** (0.55) (1.30) (0.08) (2.08) (0.65) (0.30) (1.61) (1.40) (0.12) (2.25) (1.24) (0.05) (2.26) Union member -0.217*** -0.208*** -0.243*** -0.160*** -0.208*** -0.232*** -0.162*** -0.202*** -0.233*** -0.157*** -0.199*** -0.227*** -0.156*** (8.90) (8.49) (6.97) (4.84) (8.81) (6.83) (4.99) (8.46) (6.78) (4.86) (8.22) (6.44) (4.81) Permanent job 0.051 0.055 -0.056 0.131** 0.050 -0.062 0.127** 0.055 -0.057 0.131** 0.056 -0.052 0.132** (1.12) (1.20) (0.75) (2.26) (1.10) (0.83) (2.22) (1.21) (0.75) (2.24) (1.24) (0.70) (2.26) Fixed term job 0.016 0.020 -0.073 0.095 0.017 -0.063 0.086 0.021 -0.071 0.093 0.018 -0.065 0.090 (0.24) (0.30) (0.72) (1.02) (0.25) (0.63) (0.95) (0.31) (0.70) (1.00) (0.28) (0.66) (0.97) Bad health -0.256*** -0.273*** -0.294*** -0.218*** -0.257*** -0.294*** -0.187*** -0.273*** -0.292*** -0.220*** -0.275*** -0.301*** -0.217*** (5.41) (6.11) (4.83) (3.48) (5.49) (4.63) (2.82) (6.15) (4.82) (3.52) (6.07) (4.85) (3.45) Asian 0.297*** 0.286*** 0.406** 0.164 0.294*** 0.407** 0.183 0.285*** 0.408** 0.167 0.288*** 0.413** 0.167 (2.63) (2.78) (2.45) (1.44) (2.61) (2.23) (1.42) (2.78) (2.44) (1.49) (2.71) (2.33) (1.46) Black -0.018 -0.014 0.175 -0.148 -0.021 0.156 -0.149 -0.017 0.177 -0.150 -0.016 0.169 -0.148 (0.20) (0.15) (1.46) (1.08) (0.23) (1.36) (1.15) (0.18) (1.48) (1.10) (0.17) (1.45) (1.09) Other ethnic -0.077 -0.088 -0.175 0.023 -0.079 -0.169 0.030 -0.090 -0.176 0.020 -0.087 -0.179* 0.025 (0.99) (1.14) (1.63) (0.21) (1.02) (1.54) (0.27) (1.17) (1.64) (0.18) (1.12) (1.67) (0.23) Age 25-29 -0.019 -0.054 0.033 -0.120 -0.020 0.066 -0.093 -0.054 0.035 -0.126 -0.063 0.025 -0.135 (0.17) (0.49) (0.20) (0.80) (0.18) (0.39) (0.63) (0.49) (0.21) (0.84) (0.56) (0.15) (0.90) Age 30-39 -0.119 -0.205 0.030 -0.348 -0.124 0.097 -0.272 -0.205 0.035 -0.362 -0.235 -0.015 -0.380 (0.54) (0.92) (0.09) (1.14) (0.56) (0.28) (0.91) (0.92) (0.10) (1.19) (1.06) (0.04) (1.25) Age 40-49 -0.191 -0.335 0.178 -0.692 -0.197 0.291 -0.573 -0.333 0.184 -0.715 -0.377 0.103 -0.740

(0.51) (0.89) (0.31) (1.36) (0.53) (0.51) (1.14) (0.89) (0.32) (1.40) (1.01) (0.18) (1.45) Age 50-59 -0.167 -0.388 0.449 -0.977 -0.178 0.616 -0.793 -0.386 0.457 -1.011 -0.444 0.342 -1.042 (0.30) (0.69) (0.53) (1.28) (0.32) (0.72) (1.05) (0.69) (0.53) (1.32) (0.79) (0.40) (1.37) Age 60+ 0.119 -0.178 1.040 -1.051 0.106 1.268 -0.805 -0.173 1.052 -1.096 -0.257 0.890 -1.142 (0.15) (0.23) (0.87) (0.98) (0.14) (1.05) (0.77) (0.22) (0.88) (1.03) (0.33) (0.75) (1.07) Age Sq 0.005 0.012 -0.015 0.030 0.005 -0.020 0.025 0.012 -0.015 0.031 0.013 -0.012 0.032 (0.31) (0.71) (0.59) (1.32) (0.33) (0.78) (1.09) (0.70) (0.59) (1.36) (0.79) (0.47) (1.40) Utilities 0.012 -0.076 -0.050 -0.149 0.006 0.032 -0.069 -0.079 -0.056 -0.143 -0.078 -0.054 -0.143 (0.24) (1.57) (0.95) (1.34) (0.12) (0.61) (0.62) (1.60) (1.06) (1.26) (1.58) (1.01) (1.28) Construction 0.036 0.019 0.045 -0.029 0.047 0.072 0.009 0.023 0.052 -0.045 0.020 0.050 -0.048 (0.75) (0.41) (0.90) (0.24) (0.99) (1.44) (0.08) (0.49) (1.03) (0.38) (0.42) (0.99) (0.40) Wholesale -0.129*** -0.136*** -0.141*** -0.112 -0.137*** -0.137*** -0.108 -0.134*** -0.152*** -0.085 -0.132*** -0.145*** -0.083 (3.08) (3.26) (2.91) (1.31) (3.19) (2.72) (1.26) (3.13) (3.06) (0.97) (3.05) (2.89) (0.97) Hospitality 0.029 -0.005 0.070 -0.065 0.018 0.099 -0.037 0.005 0.054 -0.023 -0.001 0.056 -0.029 (0.52) (0.08) (0.92) (0.65) (0.31) (1.26) (0.37) (0.09) (0.69) (0.23) (0.03) (0.71) (0.28) Transport and Tele -0.230*** -0.258*** -0.210*** -0.309*** -0.221*** -0.170*** -0.280*** -0.252*** -0.202*** -0.307*** -0.255*** -0.204*** -0.308*** (5.12) (5.75) (4.15) (3.20) (4.95) (3.36) (3.06) (5.66) (3.99) (3.26) (5.68) (4.01) (3.30) Financial services -0.132** -0.206*** -0.190*** -0.233** -0.135** -0.109 -0.154 -0.191*** -0.198*** -0.181* -0.186*** -0.186** -0.176* (2.43) (3.77) (2.58) (2.38) (2.40) (1.39) (1.56) (3.39) (2.58) (1.78) (3.29) (2.39) (1.78) Other business SS -0.048 -0.106** -0.153*** -0.070 -0.053 -0.087 -0.017 -0.102** -0.162*** -0.032 -0.108** -0.172*** -0.033 (1.04) (2.30) (2.74) (0.77) (1.12) (1.53) (0.18) (2.15) (2.91) (0.34) (2.25) (3.02) (0.36) Public Admin -0.059 -0.184*** -0.173*** -0.187* -0.069 -0.069 -0.041 -0.178*** -0.187*** -0.149 -0.171*** -0.171*** -0.146 (1.28) (3.80) (3.04) (1.93) (1.43) (1.20) (0.44) (3.57) (3.22) (1.49) (3.46) (2.92) (1.52) Education 0.004 0.016 0.035 0.012 -0.001 -0.012 0.020 0.032 0.024 0.064 0.018 -0.006 0.060 (0.07) (0.33) (0.52) (0.13) (0.03) (0.16) (0.21) (0.62) (0.33) (0.67) (0.33) (0.08) (0.63) Health -0.077 -0.107* -0.123 -0.124 -0.083 -0.123 -0.070 -0.097 -0.146 -0.071 -0.102* -0.148 -0.073 (1.38) (1.91) (1.47) (1.18) (1.39) (1.28) (0.65) (1.64) (1.56) (0.65) (1.71) (1.56) (0.68) Other community -0.093* -0.117** -0.081 -0.150 -0.102** -0.063 -0.119 -0.115** -0.093 -0.118 -0.121** -0.090 -0.123 (1.84) (2.32) (1.29) (1.55) (1.97) (1.00) (1.18) (2.22) (1.46) (1.16) (2.32) (1.41) (1.22) Professional -0.362*** -0.312*** -0.289*** -0.314*** -0.356*** -0.311*** -0.396*** -0.310*** -0.283*** -0.318*** -0.303*** -0.273*** -0.312*** (7.32) (6.47) (4.72) (4.70) (7.23) (4.73) (5.86) (6.43) (4.64) (4.71) (6.04) (4.11) (4.54) Ass Professional -0.488*** -0.440*** -0.470*** -0.371*** -0.487*** -0.479*** -0.467*** -0.444*** -0.470*** -0.380*** -0.432*** -0.454*** -0.370*** (9.55) (8.65) (7.89) (4.69) (9.49) (7.84) (5.76) (8.70) (7.77) (4.76) (8.40) (7.48) (4.51) Clerical -0.512*** -0.472*** -0.537*** -0.459*** -0.508*** -0.545*** -0.535*** -0.471*** -0.536*** -0.467*** -0.457*** -0.513*** -0.458*** (11.29) (10.16) (7.78) (7.69) (11.12) (7.91) (9.05) (10.09) (7.73) (7.81) (9.90) (7.45) (7.72) Skilled trades -0.475*** -0.394*** -0.351*** -0.391*** -0.461*** -0.400*** -0.445*** -0.390*** -0.341*** -0.377*** -0.379*** -0.328*** -0.366*** (8.40) (6.96) (5.37) (3.52) (8.13) (5.91) (4.05) (6.87) (5.15) (3.42) (6.71) (4.91) (3.38) Personal SS -0.479*** -0.375*** -0.286*** -0.416*** -0.474*** -0.410*** -0.510*** -0.382*** -0.284*** -0.427*** -0.373*** -0.286*** -0.418*** (8.95) (6.97) (3.87) (5.60) (8.74) (5.35) (6.87) (7.02) (3.75) (5.74) (6.83) (3.75) (5.57) Sales -0.433*** -0.390*** -0.272*** -0.466*** -0.425*** -0.288*** -0.523*** -0.383*** -0.265*** -0.456*** -0.377*** -0.272*** -0.447*** (7.75) (6.99) (3.44) (6.17) (7.59) (3.58) (6.91) (6.87) (3.34) (6.01) (6.73) (3.39) (5.93) Operatives -0.745*** -0.671*** -0.593*** -0.732*** -0.740*** -0.640*** -0.835*** -0.671*** -0.589*** -0.731*** -0.659*** -0.574*** -0.721*** (11.38) (10.25) (7.59) (6.97) (11.30) (7.93) (7.89) (10.23) (7.47) (6.86) (10.00) (7.12) (6.92) Elementary -0.474*** -0.389*** -0.391*** -0.357*** -0.468*** -0.452*** -0.466*** -0.390*** -0.385*** -0.367*** -0.380*** -0.376*** -0.357*** (8.39) (6.90) (5.34) (4.54) (8.24) (5.97) (5.96) (6.90) (5.21) (4.66) (6.69) (5.02) (4.53)
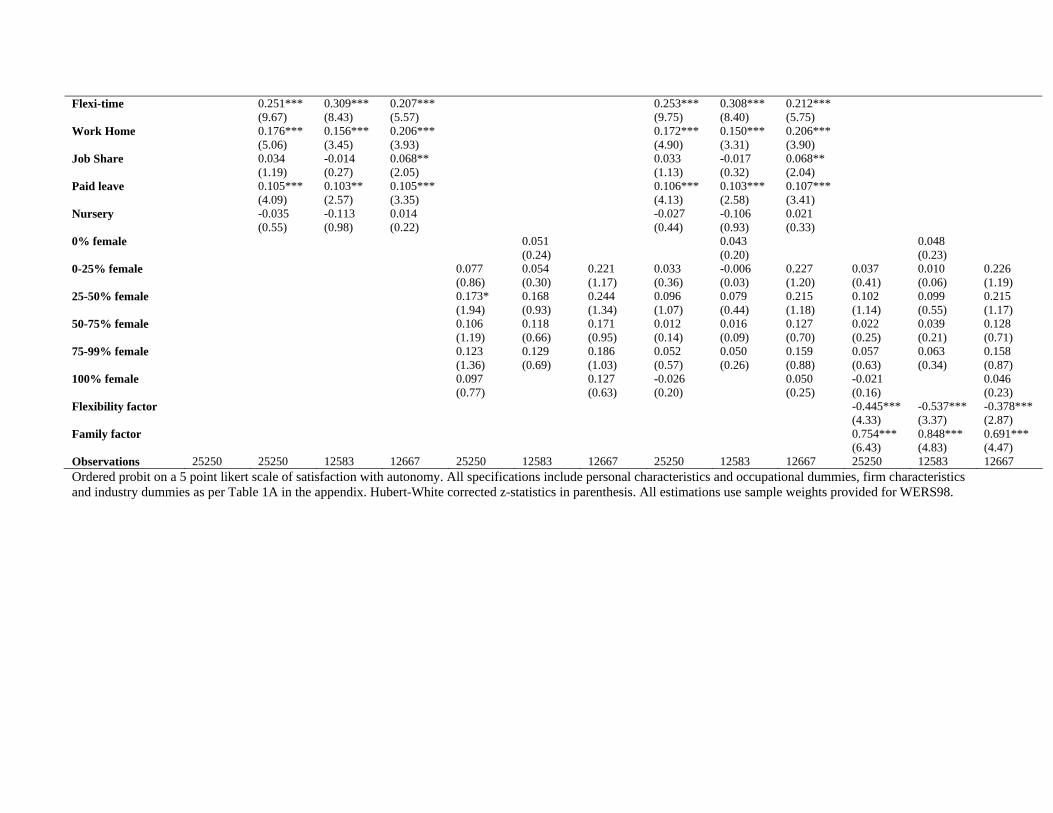
Flexi-time 0.251*** 0.309*** 0.207*** 0.253*** 0.308*** 0.212*** (9.67) (8.43) (5.57) (9.75) (8.40) (5.75) Work Home 0.176*** 0.156*** 0.206*** 0.172*** 0.150*** 0.206*** (5.06) (3.45) (3.93) (4.90) (3.31) (3.90) Job Share 0.034 -0.014 0.068** 0.033 -0.017 0.068** (1.19) (0.27) (2.05) (1.13) (0.32) (2.04) Paid leave 0.105*** 0.103** 0.105*** 0.106*** 0.103*** 0.107*** (4.09) (2.57) (3.35) (4.13) (2.58) (3.41) Nursery -0.035 -0.113 0.014 -0.027 -0.106 0.021 (0.55) (0.98) (0.22) (0.44) (0.93) (0.33) 0% female 0.051 0.043 0.048 (0.24) (0.20) (0.23) 0-25% female 0.077 0.054 0.221 0.033 -0.006 0.227 0.037 0.010 0.226 (0.86) (0.30) (1.17) (0.36) (0.03) (1.20) (0.41) (0.06) (1.19) 25-50% female 0.173* 0.168 0.244 0.096 0.079 0.215 0.102 0.099 0.215 (1.94) (0.93) (1.34) (1.07) (0.44) (1.18) (1.14) (0.55) (1.17) 50-75% female 0.106 0.118 0.171 0.012 0.016 0.127 0.022 0.039 0.128 (1.19) (0.66) (0.95) (0.14) (0.09) (0.70) (0.25) (0.21) (0.71) 75-99% female 0.123 0.129 0.186 0.052 0.050 0.159 0.057 0.063 0.158 (1.36) (0.69) (1.03) (0.57) (0.26) (0.88) (0.63) (0.34) (0.87) 100% female 0.097 0.127 -0.026 0.050 -0.021 0.046 (0.77) (0.63) (0.20) (0.25) (0.16) (0.23) Flexibility factor -0.445*** -0.537*** -0.378*** (4.33) (3.37) (2.87) Family factor 0.754*** 0.848*** 0.691*** (6.43) (4.83) (4.47) Observations 25250 25250 12583 12667 25250 12583 12667 25250 12583 12667 25250 12583 12667 Ordered probit on a 5 point likert scale of satisfaction with autonomy. All specifications include personal characteristics and occupational dummies, firm characteristics and industry dummies as per Table 1A in the appendix. Hubert-White corrected z-statistics in parenthesis. All estimations use sample weights provided for WERS98.