Work, Health and Emotional Lives of Midwives in the United ... · to midwives’ workplace stress...
72
Work, Health and Emotional Lives of Midwives in the United Kingdom: The UK WHELM study School of Healthcare Sciences Cardiff University Project commissioned by:
Transcript of Work, Health and Emotional Lives of Midwives in the United ... · to midwives’ workplace stress...
Work, Health and Emotional Lives ofMidwivesintheUnitedKingdom:TheUKWHELMstudy
SchoolofHealthcareSciences
CardiffUniversity
Projectcommissionedby:
2
ThisresearchwascommissionedbytheRoyalCollegeofMidwives(RCM),andisacollaborationbetweenCardiffUniversityandGriffithUniversity,QueenslandAustralia.Researchteam:UKTeam:ProfessorBillieHunter,RCMProfessorofMidwifery,SchoolofHealthcareSciences,CardiffUniversity,WalesUKDrJosieHenley,ResearchAssociate,SchoolofHealthcareSciences,CardiffUniversity,WalesUKAustralianTeam:ProfessorJenniferFenwick,GriffithUniversityandGoldCoastUniversityHospital,SchoolofNursingandMidwiferyQueenslandAustraliaAssociateProfessorMarySidebotham,GriffithUniversity,SchoolofNursingandMidwiferyQueenslandAustraliaAdjunctAssociateProfessor,DrJuliePallantGriffithUniversity,QueenslandAustraliaCorrespondingauthor:ProfessorBillieHunterEmail:HunterB1@cardiff.ac.ukSchoolofHealthcareSciencesCardiffUniversityEastgateHouse35-43NewportRoadCardiffCF240AB
Acknowledgements:Oursincerethankstoallthemidwiveswhogavefreelyoftheirtimetoparticipate in this study.We would also like to thank the midwives who piloted the UKversion of the WHELM tool, and the team at RCM who supported publicising anddisseminatingthesurveytoRCMmembers (inparticularGillAdgie,TamaraDale,PauletteBoniface, Amy Leversidge, Emma Godfrey-Edwards). Finally, we wish to thank LouiseSilvertonforhercommitmentandsupportfortheprojectthroughoutitsvariousstages.
3
EXECUTIVE SUMMARY
Background: There is growing evidence that high levels of emotional distress in the
midwiferyworkforcecontributetolowmoraleandattrition.Thereisachronicshortageof
midwivesinEnglandpartlyattributabletodifficultieswithstaffretention.Therearesimilar
concernsnotedinrelationtothemidwiferyworkforceinotherhighincomecountries.Itis
important to find out more about the characteristics of the midwifery workforce and
working environment that may contribute to emotional distress and ill health, so that
possiblesolutionscanbeidentified.
WiththisaiminmindtheRoyalCollegeofMidwives(RCM)commissionedtheWork,Health
andEmotional LivesofMidwives (WHELM) study for theUnitedKingdom (UK). The study
builds on the ‘Caring for You’ campaign https://www.rcm.org.uk/caring-for-you-campaign
and contributes to the evidence base on how best to support and sustain themidwifery
workforce.
Aim:Theaimofthestudywastoexploretherelationshipbetweentheemotionalwellbeing
ofUKmidwivesandtheirworkenvironment,usingacrosssectionalresearchdesign.
Methods: An on-line surveywas distributed via the RCM to all fullmidwifemembers in
2017 (n=31,898). TheWHELMsurvey toolwas conceivedwithin theAustralianmaternity
context and todatehas been conducted inAustralia,NewZealand, Sweden, Canada and
Norway. The survey tool consisted of a number of validatedmeasures: The Copenhagen
BurnoutInventory(CBI),Depression,AnxietyandStressScale(DASS-21),ThePerceptionsof
Empowerment in Midwifery Scale (PEMS: Revised), and the Practice Environment Scale
(PES:Midwives).ThesurveyalsoincludeditemsfromtheRCM‘WhyMidwivesLeave’study
(Ball et al., 2002). Demographic questions were modified for the UK context and pilot
tested.
Key Results:Justunder2000midwivesrespondedtothesurvey(n=1997).Thisrepresents
16%oftheRCMmembership.
The key results were very concerning and indicate that the UK’s midwifery workforce is
experiencingsignificantlevelsofemotionaldistress.

4
High levels of burnout
83%ofparticipantsweresufferingfrompersonalburnoutand67%wereexperiencingwork-
relatedburnout.Client-relatedburnoutwas lowat15.5%.Thepersonalandwork related
burnoutscoreswerewellabovepopulationnormsaswellashigherthantheresults from
otherWHELMcollaboratingcountries.
High levels of stress, anxiety and depression.
Over one third of participants scored in the moderate/severe/extreme range for stress
(36.7%) anxiety (38%) and depression (33%). This was well above population norms and
thoseofotherWHELMcountries.
Factors associated with high levels of burnout, depression, anxiety and stress.
• Youngermidwives(midwivesaged40andbelow)
• Midwiveswithadisability
• Midwiveswithlessthan30years’experience
• Clinicalmidwives, particularly thoseworking rotation in hospital and in integrated
hospital/communitysettings.
• Perceptionsoflowlevelsofresourceadequacywasthestrongestpredictorofwork-
relatedburnout
• Perceived low levels of management support, professional recognition and
opportunitiesfordevelopmentalsocontributedtoburnout,depression,anxietyand
stress.
High numbers of midwives intending to leave the profession
66.6%ofparticipantsstatedtheyhadthoughtabout leavingtheprofessionwithinthelast
sixmonths. The two top reasonswere: ‘Dissatisfactionwith staffing levels atwork’ (60%)
and‘DissatisfactionwiththequalityofcareIwasabletoprovide’(52%).
Midwives intending to leavehad significantlyhigher levelsofburnout,anxiety, stressand
depressionthanthosewhohadnotconsideredleaving.
Key Recommendations
• Lobby for systems level changes in the resourcing andprovisionofmaternity care
throughouttheUK.
5
• Increasepressureongovernment toaddress issuesofworkforceshortages,witha
new focuson retentionof recentgraduates rather thanmerely increasing student
numbers.
• Introduce evidence-based interventions for workforce support and ensure that
midwivesaregiven‘protected’timetoattend.
• Provide proactive support for younger, recently qualified midwives, a group
identified asbeingparticularly at riskof emotional compromise. Focus support on
theirkeyidentifiedneeds,topromoteworkforcesustainability.
• Provideproactivesupportformidwiveswithadisabilitytosupporttheiremotional
wellbeing.
• Ensure thatallmanagers receivehighqualitymanagementand leadership training
appropriate for thecontextandchallengesofUKmaternitycare,andunderpinned
byasupportive,empoweringandcollaborativeapproachtoleadership.
• Facilitate a sense of shared leadership amongst midwives at a team level, for
exampleengagingclinicalmidwivesindiscussionsabouthowtoimprovecare.Seek
opportunitiesforoptimisingmidwives’senseofagency.
• Update the evidence base relating to midwifery managers’ experiences by
undertakingresearchintotheiremotionalwellbeingandneeds.
6
INTRODUCTION
WorkforcewellbeingisakeyconcernfortheRoyalCollegeofMidwives(RCM),asevidentin
their Caring for You campaign https://www.rcm.org.uk/caring-for-you-campaign. There is
growing evidence that high levels of emotional distress contribute to low morale and
midwiferyattrition(Balletal.,2002;RCM,2016a;RCM,2016b;Sheenetal.,2015;Yoshida
&Sandall,2013).ThereisachronicshortageofmidwivesinEngland(Warwick,2017),partly
attributable to difficulties with staff retention. In 2016 two membership surveys were
conductedbyRCM:theCaringforYouSurvey (RCM,2016a),andtheWhyMidwivesLeave
Survey(RCM,2016b).Findingsfrombothsurveys identifiedimportantconcerns inrelation
tomidwives’workplacestressandlowmorale,butleftmanyquestionsunanswered.
As a response, RCM commissioned the United Kingdom arm of the ‘Work Health and
EmotionalLivesofMidwives’(WHELM)studytoprovidestrongerscientificevidenceabout
workforce wellbeing and the factors that influence this. The College considered it was
importanttofindoutmoreaboutthecharacteristicsofmidwiferyworkthatmaycontribute
toworkplacestress,sothatpossiblesolutionscanbeidentified.Thekeystudyaimwasto
explore the relationship between the emotional wellbeing of midwives and the work
environment, within the context of UKmaternity care. The working hypothesis was that
workrelatedvariablesmaybeassociatedwithemotionaldistressinmidwives.
TheUKWHELMstudycontributestoabroadprogrammeofRCMworkseekingtodevelop
and implement strategies to better support the midwifery workforce, and ultimately
improvethequalityofcareprovidedtowomenandfamilies.WHELMstudieshavealready
beenundertaken inAustralia,NewZealand, Sweden,CanadaandNorwaywith additional
armsplannedforGermany,LithuaniaandIreland.ParticipatingintheWHELMcollaboration
also provides opportunities for future cross-cultural comparisons, facilitating rich insights
intothewellbeingoftheinternationalmidwiferyworkforce.
Background
Attendingtotheemotionalwellbeingofindividualmidwivesisincreasinglyrecognisedasan
important strategy in retainingmidwiveswithin theprofession andmaintaining ahealthy
midwiferyworkforce (RCM, 2016a). However, there has been limited research attention
7
paid to the emotional needs and experiences of midwives as a factor in retention and
workplacehealth.
Midwives care for women and their families during an emotionally demanding time.
Althoughpregnancyandbirthisamostlyjoyfulexperience,thisisnotalwaysthecase.Even
whencaring forwomenwith straightforwardpregnancies,midwivesmayhave to support
women experiencing anxiety and pain. They also may experience vicarious secondary
trauma when caring for women who experience adverse situations such as pregnancy
complications and loss of their baby (Leinweber & Rowe, 2010; Rice &Warland, 2013).
Midwifery work is intrinsically emotionally demanding, and it has been argued that the
extensive ‘emotion work’ that this creates for midwives is largely unrecognised and
undervalued(Hunter,2010).
Thecurrentevidenceindicatesarangeoforganisationalandprofessionalfactorsthatcreate
workplaceadversity formidwivesandmaycompromise theiremotionalwellbeing. These
include shift working, heavyworkload, bullying, poor quality support and staff shortages
(Balletal.,2002,Mollartetal.,2013;RCM,2016a,2016b).Overadecadeago,anextensive
study of why UKmidwives leave or stay in practice showed that high levels of stress or
workplaceadversity inmidwiferywerewidespreadandassociatedwithbothphysicaland
mental ill-health, increased rates of sickness and poor staff retention, (Ball et al., 2002;
Kirkhametal.,2006).Thestudyofwhymidwivesleavehasrecentlybeenreplicated(RCM,
2016b), and shows that the situation has not improved. Moreover, the context of UK
maternitycarehasbecomemoredemandingformidwives:thebirthratehasrisenbynearly
20%since2002,womenaccessingmaternityserviceshaveincreasinglycomplexcareneeds
(RCM, 2016b), and a persistent shortage of midwives exists (estimated by RCM to be a
shortageof3,500postsinEnglandalone,RCM2017).Thekeyreasonsgivenbymidwivesfor
leaving or intending to leavemidwifery in the RCM’s 2016 survey were: not happy with
staffing levels at work; not satisfiedwith the quality of care theywere able to give; not
happywiththeworkload;nothappywithworkingconditions.Concernswerealsoexpressed
aboutthequalityofmanagerialsupport,themodelofcarethatmidwiveswereworkingin,
bullyinganddiscrimination(RCM,2016b).

8
Theseconcernssuggestthatitisnotjustpracticalfactorssuchasstaffshortagesandlackof
resourcesthatcontributetolowmoraleanddistress,butthattherearealsootherfactorsat
playwhicharelesstangible. Someofthefreetextresponsestothissurvey(RCM,2016b)
indicatedthatnotbeingabletogivegoodqualitycareand‘dothejob(they)love’erodesjob
satisfaction.Other studies ofmidwives’ emotionalwellbeing suggest thatmanymidwives
experience a conflict of ideologies resulting from a profound mismatch between the
professionalidealofbeing‘withwoman’andprovidingwoman-centredcare,andthereality
of working in a busy workplace environment where the needs of the institution are
perceived to take precedence (Fenwick et al., 2012; Hunter, 2004; Hunter, 2010). This
conflictcreatesasenseofdissonance,whichleavesmidwivesfeelingfrustrated,angryand
emotionally exhausted, creating substantial ‘emotion work’ or ‘emotional labour’. Some
time ago, Hunter (2006) argued that the lack of professional acknowledgment of this
emotionwork leaves individualmidwivesat riskof internalisinganynegativeemotionsas
personaldilemmasandfailings.
There are, however, studies which have identified factors which impact positively on
midwives’ emotional wellbeing, in particular relationships, occupational autonomy and
social support. The emotional significance of developing meaningful relationships with
childbearingwomenhasbeenidentifiedinnumerousstudies(Kirkhametal.,2006;McAra-
Couperetal.,2014;Sullivanetal.,2011).Highlevelsofoccupationalautonomyhavebeen
foundtosupporttheemotionalwellbeingofmidwives,withlowerlevelsof‘burnout’found
amongst midwives working in self-employed practice and in the community (Bakker,
Groenewegen,Jabaaij,Sixma,&deVeer,1996;Wakelin&Skinner,2007;Yoshida&Sandall,
2012; Dixon et al., 2017). More recently, there has been growing interest in midwifery
resilience(Hunter&Warren,2014)andsustainability(Crowtheretal.,2016).Thesestudies
highlight the importance of relationships, autonomy and social support, as well as
professional identity and loveof the job, as buffers against the inevitable stressesof this
emotionallydemandingwork.
9
AIM
Thisstudyexploredtherelationshipbetweentheemotionalwellbeingofmidwivesandthe
work environmentwithin the UK context ofmaternity care. Theworking hypothesiswas
thatwork-relatedvariablesmaybeassociatedwithemotionaldistress(definedasburnout,
depression,anxietyandstress)inmidwives.Thespecificobjectivesofthestudywereto:
1. Determine the socio-demographic and work-related variables that correlate with
highlevelsofemotionaldistressinmidwivesintheUK
2. Determine the level of burnout, depression, anxiety and stress in midwives and
describethepredictorsofburnout,depression,anxietyandstress
3. Identify intention to leave the profession, and the reasons and factors associated
withanintentiontoleave
4. Describe midwives’ perceptions of the workplace (relationships, practice
environment and midwifery empowerment) and associations with burnout,
depression,anxietyandstress
5. Identifywhetheraninterventiondesignedtoimproveemotionalwellbeingmightbe
acceptabletomidwives,andwhatformthismighttake
METHODS
ThestudyemployedacrosssectionaldesignreplicatingtheWHELMsurvey.Initiallypiloted
byresearchersatGriffithUniversity,Australia, thesurveyconsistedofpersonalandwork-
related characteristics, together with a number of well validated measures as well as
questionsfromtheRCM‘WhyMidwivesLeave’study(Balletal.,2002).
Target Population
The population was registered midwives working in the UK. Most UK midwives work as
employedmidwiveswithinNHSmaternityservices. Workcontextvaries:hospitalsettings
(DistrictGeneralHospitalorTertiaryReferralCentre),standaloneoralongsidemidwifery-led
birth centres, primary care (community) or in integrated NHS schemes,moving between
communityandhospitalsettings. It isalsopossible, though lesscommon, formidwivesto
work in self-employed independent practice or within private healthcare. All qualified
midwiveswereeligibletoparticipate,regardlessofworklocationorrole.
10
Recruitment
All midwife members of the RCM were invited to participate via e-mail. The RCM, a
membershiporganisationthatsupportsandrepresentsmidwivesintheUK,hasadatabase
ofmembers (which includese-mailcontactdetails)withwhomitregularlycommunicates.
ThemajorityofmidwivesinUKaremembersoftheRCM;estimatedtobe90%.Thestudy
wasalsopublicisedviatheRCMwebsite,socialmedia,regularRCMmailshotsandanarticle
intheRCMMidwivesJournal.
Thee-mail tomembers includeda letterof invitationoutlining theaimsandobjectivesof
thestudy,thecontactdetailsoftheprojectmanagershouldclarificationberequired,anda
live link to the questionnaire platform hosting the survey. As no name-related data was
required,consentwas implied if themidwifeparticipantcompleted thequestionnaire. E-
mailremindersweresentat2and5weeks.
Data collection
TheWHELMsurveywasadapted foruse in theUKcontext, forexamplebyaltering some
terminologyandbyaddingquestionsrelatedtotheUKcontextofmidwifery.Themodified
surveywaspilottestedwith14midwives.Participantsweregivenaspecificscenarioprofile
(i.e.,role, location,modelofcare)andaskedtocompletethesurveyasthoughtheywere
thatparticipantmidwife.Midwiveswereaskedtocheckthesurveyforclarityofmeaning,
relevanceandanswerability.Nochangesweremadeasaresultofthepilot.
The finalquestionnairepackageconsistedofanumberof sections.Firstly,midwiveswere
asked a number of demographic questions (for example age, marital status, education).
Secondly,midwiveswere asked aboutwork related characteristics such employee status,
principal role, model of care. Midwives were then asked to complete a number of well
tested and validated measures. These included the: The Copenhagen Burnout Inventory
(CBI); Depression, Anxiety and Stress Scale (DASS-21); Practice Environment Scale (PES:
Midwives);andthePerceptionsofEmpowerment inMidwiferyScale(PEMS:Revised) (see
Box 1 for a detailed description). Key questions pertaining to participant’s intention, or
otherwise,toleavetheprofessionwerealsoincluded.Spacetoprovidefreetextresponses
to some questions was also offered. In order to identify possible support strategies,
11
questionswere included askingmidwives to indicatewhether theywould access support
strategiesifprovidedandwhatstrategiestheywouldliketoseeoffered.
DatawerecollectedovereightweeksbetweenMaytoJuly2017.Thedatacollectionperiod
was extended by two weeks, as there were concerns that participation may have been
negativelyaffectedbytheNHScyber-attackinMay2017.
Data Analysis
Statistical analyses
Descriptive analyses were conducted to describe the demographic and work-related
characteristicsofthesample,andtodetermine levelsofburnout,depression,anxietyand
stressinthesample.
Non-parametric statistical analyses were used to compare CBI and DASS scores across
groupsbasedondemographicandworkcharacteristics. Somevariablesweremodifiedby
collapsingorexcludingcategories toensure that therewere sufficient cases for statistical
comparison. Only variables with sufficient numbers were reported in the results tables.
Mann-Whitney U tests were used for two group comparisons, Kruskal Wallis tests were
used for groupswith 2+ groups. Given the large number of analyses undertaken amore
conservativealphalevel(p<.01)wasusedtoidentifystatisticallysignificantcomparisons.
Chi-squareanalyseswereconductedtocomparethecharacteristicsofmidwiveswhohad,
versus had not considered leaving the profession. Pearson correlation coefficients were
calculated to explore the relationship between scores on the PES: Midwives and PEMS:
RevisedwiththeCBIandDASSscales.
Qualitative analayis
Content analysis was used to analyse the free text responses. A coding framework was
developedbyanalysingtheresponsesofthefirst200participants,withtwomembersofthe
teamundertaking independentcoding.Theresultingcodingframeworkwasdiscussedand
agreed,withreferencetothequantitativeresults,andthenappliedtotheremainderofthe
freetextresponses.
12
Ethical Considerations
EthicalapprovaltoconductthestudywasgrantedbyCardiffUniversitySchoolofHealthcare
SciencesResearchEthicson9thMay2017.
RESULTS
Theresultsarepresentedinanintegratedformat,withqualitativedataextractsillustrating
thequantitativedata.Participantsareidentifiedbytheirworkplacesetting:DistrictGeneral
Hospital (DGH), Tertiary Referral Unit, Stand alone birth centre, Alongside birth centre,
Community–Primarycaresettingonly,University(educationand/orresearch).
Thequalitativedataextractshaveoccasionallybeingeditedforclarity,asrespondentsoften
discussed a range of issueswithin one account.Where editing has occurred, the deleted
textisindicatedbytheuseofsquarebracketsi.e.[….]
Participant characteristics
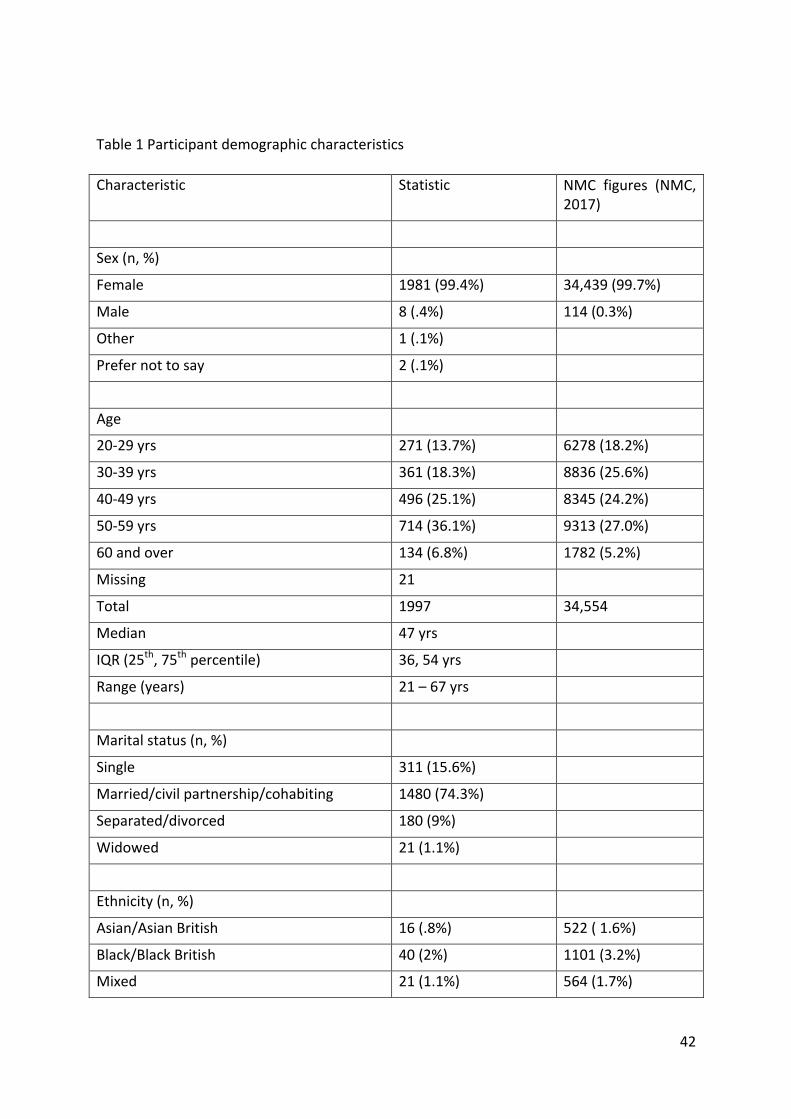
The totalnumberofmidwiveswho responded to the surveywas1997. Thevastmajority
werefemale(n=1981,99.4%)1withamedianageof47years(range21to67years).While
74% (n=1477) noted they had children, nearly 84% (n=1615) recorded ‘carer’
responsibilities.Inaddition12.5%(n=249)identifiedashavingadisability2.Themajorityof
midwives (n=1639, 82.9%) worked in England. See Table 1 for additional demographic
1Reflectingthenationalgendermixformidwifery(NMC,2017),seeTable1.2ItisdifficulttoassesshowthiscompareswithUKwideself-reporteddisabilityratesformidwives.LatestNMCfigures (NMC,2017)showonly5.0%ofmidwivesnotingadisability,althoughanother2ItisdifficulttoassesshowthiscompareswithUKwideself-reporteddisabilityratesformidwives.LatestNMCfigures (NMC,2017)showonly5.0%ofmidwivesnotingadisability,althoughanother16.6%didnotanswerthequestion.ThePapworthTrustestimatesthat16%ofUKadultsofworkingagehaveadisability.However, theycaution that those inemploymentmaynotdisclosedisabilityduetostigma.Forexample, intheCivilService in2013,8.8%declaredadisability,withthoseatahigherlevelofresponsibilitybeinglesslikelytodeclaredisability(5%).
http://www.papworthtrust.org.uk/sites/default/files/Disability%20Facts%20and%20Figures%202016.pdf
13
details (including how some of these characteristics compare with themost recent data
availablefromtheNursingandMidwiferyCouncil,NMC2017).Participantagetendedtobe
greater than theUKprofile, andparticipantsweremore likely tobe fromaWhiteBritish
backgroundandmorelikelytodiscloseadisability.Table2providesdetailsofself-reported
disabilitycategories.
In terms of work characteristics, nearly 57% of participants (n=1128) had an initial
undergraduatemidwiferyqualification.Yearsofexperiencerangedfromlessthanoneto55
with15.1beingthemedian.Justunder92%worked insometypeofclinicalcapacitywith
only 8.3% (n=315) choosing a non-clinical category (education, research, management,
policy/administration).
Over88%(n=1765)ofparticipantswereemployedbytheNHSwith66.6%(n=1311)stating
theyworked in a district general hospital or tertiary referral unit. A further 20% (n=390)
stated theyonlyworked in a communityprimaryhealth care setting. Themajorityof the
remaining participants worked in a Birth Centre (n=189, 9.6%) or the University sector
(n=79, 4%). Less than one percent of the sample (n=11) were working in
private/independentpractice.
Justoverathirdofthesample36%(n=719)reportedarequirementtoprovideregular“on
call” cover. In the majority of cases this requirement was related to general
organisational/community cover as opposed to being “on call for a defined caseload of
women”.While63(3.2%)midwivesindicatedthattheywereoncallforadefinedcaseload
of women, only 43 (2.1%)midwives reported working in a continuitymodel where they
werethedesignatednamedmidwifetoadefinedcaseloadofwomenprovidingcareacross
the childbirth continuum (pregnancy, labour and birth and transition to early parenting).
The remaining 20 midwives worked in a modified continuity model where they only
providedantenatalandpostnatalcare.Table3providesmoredetailed informationonthe
work-relatedcharacteristicsofthecohort.
Midwives’ emotional well-being
Midwives were asked to complete a number of validated questionnaires which were
designedtomeasure theiremotionalwell-being.These includedtheCopenhagenBurnout
14
Inventory(Kristensenetal.,2005)andtheDepression,AnxietyandStressScale(Lovibund&
Lovibund,1995).
Levels of burnout, stress, anxiety, and depression
TheCBIhas threeburnoutdomains/ subscales:personal,work-related,client-related (for
details of the domains see Box 1). Eighty-three percent of midwives recorded scores of
moderateor aboveon thepersonal domainwith some67%also registeringmoderateor
abovelevelsofburnoutonthework-relateddomain.Incomparisonclientrelatedburnout
was low at 15.5%. In addition over one third of the sample recorded scores in the
moderate/severe/extreme range for each of the three DASS subscales (Stress 36.7%;
Anxiety38%;Depression33%).
Factors associated with burnout, depression, anxiety and stress
Statistical analyses were conducted to identify demographic and work-related factors
associated with elevated levels of burnout, depression, anxiety and stress. Younger
midwives (midwives aged 40 and below) recorded significantly higher scores on the
personalandworkburnoutsubscalesscales,andoneachoftheDASSscalescomparedwith
oldermidwives.
Respondents with a self-reported disability recorded higher scores on all scales, except
Client-Burnout. Lack of collegial andmanagerial acknowledgement and understanding of
disabilitywas noted by some of these participants. For example, amidwifeworking in a
stand-alonebirthcentrenoted:“Lackofunderstandingaboutmydisability.”
Married or partnered midwives recorded lower depression scores, while midwives with
children recorded lower client related burnout and anxiety scores. Personal and work
related burnout scores varied across regions, with England (North East) recording the
highestscores,andScotlandandNorthIrelandthelowest(seeTable4formoredetail).
Midwiveswithmore than 30 years’ experience recorded lower scores on all the CBI and
DASSscales.Likewisemidwiveswhoseinitialqualificationwasacertificateofmidwifery(an
initialmidwiferyeducationpathwayoffereduntiltheearly1980s)recordedlowerscoreson
all measures, except client related burnout, when compared with the other two groups
(DiplomaandBachelor).
15
In terms of workplace setting, the highest burnout scores were recorded for midwives
employedbytheNHS(that is,88%ofthesample).Thisgroupalsorecordedhigherstress,
anxietyanddepression.
Midwivesworkingindistrictgeneralhospitalsrecordedhighburnoutandanxietyscores,as
didmidwiveswhoworkednightshift,howeverthisgroupalsohadhighstressscores.When
the principal role ofmidwiveswas used to compare groups, high levels of burnoutwere
recordedinclinicalmidwivesparticularlythoseworkinginrotationthroughoutthehospital
andthoseworking in integratedhospital/communitysettings.Furtherdetailsareprovided
inTable5.
Contextualising the quantitative results
Themajorityofparticipants (87%)providedextensivefreetextcommentsdescribingtheir
working conditions and work relationships and the impact these were having on their
physicalandmentalwellbeing.Analysisofthefreetextdataprovidesvaluableinsightsinto
thehighCBIandDASSscores recordedandpresentsamoredetailedpictureofmidwives
whoareexperiencingacutelevelsofemotionaldistress.Theoverwhelmingimpressionwas
that manymidwives felt exhausted by their day-to-day work, emotionally and physically
drained, dreaded the thought of another day’s work and seriously wondered howmuch
longertheycouldcarryon.Manyofthemthankedtheteamforconductingthestudy,and
expressedthehopethatthefindingswouldleadtochange.
Theparticipantresponsesbelowaretypicaloftheavalanchethatwerereceived:
“I don't remember the last time I had any energy and wasn't completely
exhausted”(DGH)
“Ispendmytimeawayfromwork(daysoff,sleeplessnights)worryingthatI
may have made a mistake, or missed something because of the time
pressuresfelt”(DGH)
“Wakingupwithflashbacks[…]wonderingwheredidmyfirego”(DGH)
“IthoughtwhenItrainedtobecomeamidwifemydreamshadallcometrue,
feelingvery sadnow facinghowtraumatic the jobcanbeonmy family life
16
andhealthandwonderhowmuchlongerthedreamwilllast”(Community–
primarycaresetting)
Participantsdescribedhavingseriousconcernsabout theirownmentalhealthandthatof
theircolleagues,describingthe‘constantbatterytomymentalhealthandanxietylevels’:
“Icouldn'tsleepduetoworryingaboutgoingtowork.Ioncesleptinmycarin
thehospitalcarparkbecauseIwassostressedaboutcomingtowork.Atthis
point I realised I had to seek some help, I saw my GP and I am now on
antidepressantsandreducedmycontracttozerohours.Istillhaveanxietyat
presentbutI'mtryingtoworkthroughitasIdon'twanttoendmycareerthis
way.Tolookatmeintheworkplaceyouwouldn'tknowbutinsideI'mburnt
out”(Tertiaryreferralunit)
Togaingreaterinsightintothereasonswhymidwivesareexperiencingsuchhighlevelsof
burnout,stress,depressionandanxiety, theresponsestoothersectionsof thesurveyare
presentedbelowinmoredetail.
Intention to leave the profession
Midwiveswereaskedwhether theyhadconsidered leavingthemidwiferyprofessionover
thelastsixmonths.Sixty-sixpercent(n=1318)responded‘yes’tothisquestion.Allreasons
thatmidwivesgaveforconsideringleavingtheprofessionareprovidedinTable6.
Factors associated with intention to leave the profession
Statisticalanalyseswereconductedtocomparethosemidwiveswhohadconsideredleaving
the professionwith those that had not. For this set of comparisons thosemidwiveswho
indicated that their reason for leavingwas ‘planned retirement’ were removed from the
sampletopreventbias.
Midwives who had considered leaving the profession showed statistically significant
differencesacrossallmeasuresofemotionalwellbeing.Theyrecordedmuchhigherlevelsof
burnoutacrossthethreeCBIdomains:personal(75v54.1);work(64.2v46.4);client(29.1v
12.5) and also recorded substantially higher levels on all three subscales of the DASS
[(depression16v8);anxiety(8v4);stress10v2)](seeTable7).
17
Therewerethreeleadingreasonswhymidwivesconsideredleaving:staffinglevelsatwork,
qualityofcare,andorganisationofmidwiferycare.Thesearediscussedinturn, illustrated
withextractsfromthefreetextresponses.
Dissatisfaction with staffing levels at work
Sixty percent of participants indicated that they intended to leave as a result of
‘dissatisfactionwithstaffinglevelsatwork’.Therewereextensivefreetextcommentsabout
inadequatestaffinglevelsfromparticipantsworkingacrossallmaternitycaresettings.The
data setwasdominatedbydescriptionsoforganisational failure toprovide cover for sick
leaveandmaternityleaveoreventoprovidecoverforlunchbreaks.Theresultantincreased
workload left many feeling like they were continually ‘fire fighting’ and ‘plugging gaps’.
Perpetual staff shortages and unsustainable workloads contributed to the midwives’
assessment that theirworkingenvironmentswerenotonlyunhealthy for themselvesbut,
moreimportantly,forthewomanintheircare.
“Isufferfromstressandanxietyduetoworkload.Lackofstaffandresources
mean I am stretched and cannot give the care Iwant to give to families. I
work12hourshiftsandhardlyevergetabreakandoftenworkovermyhours
but never get any timeback/extrapay. I have seen services being cut back
due to financial restraints meaning women aren't getting as good care as
theyusedto.Ifeelliketherearemanyinstanceswherethewomeninmycare
arenotsafeduetoashortageofhealthcareprofessionals.”(DGH)
“Unsafe workload. Not having breaks on regular basis. Not feeling valued.
Notenoughequipmenttopractisesafely.Insufficientsupportstaff,meaningI
have to perform a lot of non-midwifery duties, impacting on my role.”
(Tertiaryreferralunit)
Quality of care
Notsurprisinglytheinabilitytofeelsatisfiedwiththe‘qualityofcare’thatmidwivescould
provide to childbearing women was the second most commonly recorded reason for
consideringleaving(n=682,52%).Concernsaboutclinicalsafety,unnecessaryintervention,
non-evidencedbasedpractices,overmedicalisation,lackofwoman-centredcare,andalack
18
ofcontinuityleftmidwivesfeeling‘physicallyexhausted’and‘demoralised’,asdescribedby
thismidwife: ‘Thefeelingoffailurewhenyou'vephysicallyexhaustedyourselfandcouldn't
possibly do anymore is demoralising’ (DGH).Many of these concerns were linked to the
staffing shortages previously described and the resultant lack of time to care.Midwives’
perceptions that theywere ‘failing’ women on almost every level created a deep-seated
senseofburdenanddistress.Thecomment,‘Aboveeverything,notgivingthewomenand
babiesthecaretheydeserveistheworstaspect’(DGH)reflectsthewordsofhundredsinthe
dataset.
Forsome,the‘sadness’and‘frustration’generatedbynotbeingabletoprovidequalityof
careresultedinmidwivesmovingoutofclinicalpractice.Asonemidwifesaid:
“Imovedfromaclinical'hands-on'midwiferyrolebecauseIdidnotfeelable
togive thequalityofcare that Iwouldaspire to. I felt inmy formerclinical
rolethattheworkingpatternsandon-callscontributedtoexhaustionandjob
satisfaction and risked safe practice.” (Community - primary care setting
only)
Organisation of midwifery care
Just under half of the respondents identified that they were dissatisfied with the
‘organisation of midwifery care’ (n = 621, 52%). Unhappiness with organisational issues
included dissatisfaction with: the support afforded for regular breaks; shift patterns;
rotation;expectationofflexibility;providingoncallcover,andmodelofcare3.
Further insights into these concernswereprovided in the responses to generalquestions
aboutworkplacesatisfactionanddissatisfaction.Itwasclearthatmidwivesfrequentlyfaced
difficulties in taking regular breaks during theworking day, especially thoseworking in a
DGHortertiaryreferralunit.Indeed,thesedifficultiesappearedtobesocommonplacethat
theywereoftennotnotedinthe‘negative’comments.Rather,itwaswhenitwaspossible
to take a break that a positive commentwasmade; for example, sources of satisfaction
3 ‘Model of care’was a possible response in the ‘Reasons for considering leaving’ surveyquestion.Thisresponseappearstohavebeeninterpretedindifferentwaysbyparticipants
19
were:‘GettingreliablebreakssoIdon't‘burnout’’(DGH)and‘Beingabletohaveabreakon
shift or even able to urinate when needing to’ (DGH). Likewise for community-based
midwives,apositivedaywasonewhentherewas:‘Timetocompletecareandadminwithin
work hours. Not working excess hours, getting lunch break.’ (Community - primary care
settingonly)
There were also extensive negative comments from hospital-basedmidwives about shift
work,inparticularwheretherewaslittlepersonalcontrolovershiftallocationsandwhere
rotaswerechangedat shortnotice.This created stresses forpersonaland family lifeand
compromisedwellbeing:
“Workingenvironment.Lackofshiftpattern(haphazardshiftpattern).Rotas
notavailableontime-unabletoplanfamilylifeandchildcare.Shortstaffing
leading to stretched workloads, not providing high quality experience for
womenandfamiliesduetoproduction lineofwork,burnout,missedbreaks
etc.”(DGH)
Manymidwives commentedon a lackof personal autonomy in relation toworkpatterns
andlocations,feelingfeltthattheyweremoved‘whenitsuitsmanagers’to‘plugthegaps’.
Thiswasexperiencedasstressfulandanxietyproducing:
“TheperceptionthatmyroleisnotessentialandtheexpectationthatIcanbe
usedtopluggapselsewheremeansIamaskedtoworkclinicallyinareasI'm
veryunfamiliarwith,butwherethereisnosupportanditdoesn'tfeelsafe.”
(DGH)
“Havingtoworkorbeoncallonmydaysofftosupportmyteamortheunit,
beingcalled intowork intheunitwhenIamoncall forhomebirths,feeling
likemyworkloadistoohighandthatIcannotcontrolit,feelinglikeIcan'tsay
notomanagers'requestsbecauseofpressuresintheunit.”(DGH)
Forcommunity-basedmidwives,thisexpectationof‘flexibleworking’tooktheformofbeing
requiredtoprovideoncallcoverforbirthcentresanddeliverysuites,inadditiontocovering
theirowncaseload.Communitymidwivesexperiencedthisas ‘Beingtoldcommunitywork
isn'tasimportantasdeliverysuite.’Theydescribedbeingfrequentlycalledintocoverwhen
20
thelabourwardwasshort-staffed.Thiscreatedanxietieswhentheywerecaringfor‘higher
riskwomen’thanwastheirusualpractice,andalsowhentheyfeltthatcarefor‘theirown
women’wascompromised:‘Beingoncallforhomebirthsbutinsteadbeingcalledtocover
highriskwomenonalabourward’.(Community-primarycaresettingonly)
Other reasons for considering leaving
Dissatisfactionwithworkloadaccountedfor44%(n=585)ofresponses,whilstdissatisfaction
withworkingconditions,pay,andshiftpatternswasrecordedat38%(n=495),36%(n=468),
32% (n=423) respectively. Fearof litigationaccounted for30% (n=399)of responses,with
‘dissatisfactionwithlinemanagersupport’recordedat28%(n=373).
Midwives vividly described their personal concerns about the level of responsibility they
carriedand their feelingof ‘beingunder themicroscope’ (DGH).Theiraccounts suggested
that they did not feel well supported by managers in this respect. Some hospital-based
participantswerealso concerned thatawidespreadcultureof litigation fear impactedon
thecarethatwomenreceived,withadefaulttomedicalisedcareto‘erronthesafeside’:
“Women receiving complex care instead of midwifery care because of
midwives’fearoflitigation”(DGH)
Conversely, community-based midwives described fears related to caring for ‘high risk’
womenbirthingathomewithoutadequatebackupandsupportfortheattendingmidwife.
Underpinning these accounts were strongly expressed concerns about high levels of
responsibilityandaccountabilitywithoutappropriatesupport.
“Everyshiftweareshortstaffedandthereforeoverworked,don'tgetbreaks
andleavelate.Wedonotgetpaidenoughfortheresponsibilitywehave.Itis
terrifyingsometimesthepressurewehave,thefearof litigation,thefearof
somethingawfulhappening.”(DGH)
Fearsaboutbeing suedor caughtup in litigationcaseswere thought tobewell founded,
withmidwivesdescribingafailureofthesystemandtheirmanagementtosupportthemin
adverse clinical situations. The following quote from one community-based midwife is a
powerfulexampleandresonateswiththemanyothersthatweremade:
21
“Whensomethinggoeswrong,whichinevitablywillalwayshappen,assadly
noteverypregnancyendswell,howevergoodthecare,midwivesaretreated
appallingly, it is shocking and devastating to observe good hard working
midwivestornapartbytheabsolutelydisgustingwaythatincidentsaredealt
with.Babiesdoandwilldie,anditisnotalwayssomebodies(sic)fault.Trusts
persecute individual midwives in order to cover their own back as far as
litigation. There is never any support it is a truly horrificwitch-hunt. I have
metsomanybrokenmidwives,whothenleavetheprofession.”(Community-
primarycaresettingonly)
Perceptions of the workplace
Working relationships
Midwiveswere asked to rate how satisfied theywerewith their relationshipswith other
professionals. The results are summarized in Table 10. Satisfaction rates with midwifery
colleagues(bothhospitalandcommunity)wereveryhighacrossallworksettings,withover
90%ofmidwivesreportingmoderateorhighsatisfaction.Thiswasreflectedinthefreetext
responses, where positive relationships with midwifery colleagues were frequently
mentionedasnotonlyasourceofsatisfactionandaffirmationbutalsoenablingmidwivesto
‘keepgoing’.
“The support receivedby colleaguesand trust forgedbyworking ina small
unit.Agoodworkingrelationshipwithcommunitymidwivesandfeedbackwe
receivefromthem.”(DGH)
“Healthyworkingrelationshipwithcolleagues,camaraderie,beingrespected
asanexpertclinician.”(Tertiaryreferralunit)
“I work as part of an excellent community team and we have great
relationships and support one another.” (Community - primary care setting
only)
While some midwives did describe feeling affirmed and supported by their midwifery
manager, almost 45% were not satisfied or reported low satisfaction levels with these

22
relationships. Participants stated that theydidnot feel valuedor respectedbymanagers,
thattheirexpertisewasnotacknowledgedandthattheywerenotconsultedonimportant
organisational changes. In themost negative accounts, therewasmention of bullying or
underminingbehaviourbymanagers.
There were extensive comments about these issues, particularly from those working in
hospital-based practice. Examples include: “Managers don't care. Pay lip service only”
(DGH);“Unrealisticexpectationsfrommanagement”(DGH);“Bullyingandhumiliationoften
in front of the woman” (DGH); and “Not feeling valued (or not being consulted about
changes) for your hard work, contribution and efforts by women, colleagues, managers
and/orwiderteam.”(DGH)
Whiletherewereasmallnumberoffreetextcommentsfromcommunity-basedandbirth
centre midwives describing a good relationship with general practitioners, 41.4% of
midwivesreportedalackoforlowsatisfactionwiththeserelationships.
Work-life balance
Half of the sample indicated they hadmoderate or high levels of satisfaction with their
work-lifebalance,andthreequartersofthesampleratedtheirsatisfactionwiththeamount
oftimeoffasmoderateorhigh.Theseaccountscontrastwiththeearlierdescriptionsoflack
ofpersonalcontroloverrotasandshiftworkingexperiencedbyotherparticipants.Personal
controlappearedtobeanimportantfactorforthosedescribingapositivework-lifebalance.
For example, in the qualitative data some respondents referred to having taken semi-
retirement and/or working part-time, thus reducing the number of shifts and enhancing
theirwork-lifebalanceinthisway.Inaddition,reducinghourswasoftenconsideredaway
to prevent tiredness and therefore subsequently be more able to fulfil their role and
responsibilities as amidwife; "I have taken flexi retirement.Which has resulted in better
work / lifestyle balance. Less tired so able to fulfil role easier" (DGH). Other midwives
‘condensed’theirhoursintolongerdayssothattheyhadmoredaysoff.
23
Practice environment
Included in the questionnaire was the revised Practice Environment Scale (midwives)
(Pallant et al., 2016). Descriptive statistics for each of the PES: Midwives subscales are
presentedinTable11.Scoresbelow2.5equatetoanegativeresponsewithscoresof2.5or
aboveequatingtoapositiveresponse.Overallmidwivesweremostpositiveaboutmidwife-
doctor relationshipswithnearly82%ofmidwivesusinga scoreof2.5orabove.Although
there were some negative comments in the qualitative data about difficult relationships
withhospitaldoctors,thedominantmessagewasthattheserelationshipswerepositive.For
example:
“Themajorityofmyamazingcolleagues-wetrytohelpeachotheroutwhere
possible.ThereisnotanenvironmentwhereDrs(particularlytheConsultants)
displayanotionofhierarchyandtheyaren'tdismissive.”(DGH)
Theother threedomainsof thepracticeenvironment,however,didnot fareaswell. Just
over 50% of respondents scored ‘Quality of management’ and ‘Opportunities for
development’ negatively. The lowest scores were recorded for items on the ‘Resource
Adequacy’subscale,with75%ofmidwivesgivingthisdomainascorelessthan2.5.
Similar to theearlierdiscussion, therewereextensivenegative comments that supported
the quantitative results especially about the quality ofmanagerial support.Management
stylewasdescribedaspoor,unsupportive,micro-managing,autocratic,incompetent,unfair,
unilateral,inconsistentandpunitive.Inadditionmanymidwivesperceivedtheirmanagersto
be driven by economic outcomes and reaching targets,with changesmade as ‘knee-jerk’
reactionstoproblems.Thiswasespeciallythecaseintheexperienceofmidwivesworkingin
hospital settings, butwasalsomentionedbymidwivesworking inbirth centres, although
their negative experiences appeared to be of widermaternity servicemanagement than
direct‘line’managementwithinthebirthcentre.Overall,therewasapervadingsenseofa
lack ofmanagerial credibility, leadershipandvision aswell as an absenceof positive role
modelsandanabsenceof focusonprovidingqualitywomancentredcare.Theresponses
belowarereflectiveofmanyreceived.
24
“Micromanagementofeverything,constantfearofblameculture,novisibility
of senior management, unfairness between colleagues & lack of
communicationresultingindictatorshipmanagementstyles.”(DGH)
“Incompetent senior management, morally questionable ‘leadership’.
Disabilitydiscrimination,punitive "healthandwell-being"policies.Knee jerk
reactionstomistakes,lackofinformationaboutresolutions.Bullyingculture,
lackofteamspirit.”(Tertiaryreferralunit)
“HOMseniorteamnovision.Generalmanagertoomuchcontrol/inputinto
clinicalcare.Focusnotonqualitycare.Focussavemoney.Complaintsbring
aboutmorechangethanwomen'sneeds.”(Tertiaryreferralunit)
“Poormanagement. Innot listeningto thestaff in theMLUandcommunity
andvaluingtheresourcesthattheyhave intheircollectiveknowledge,skills
andcarethattheygivetowomenandeachother.Bullying/aggressivestyle
of management. Over scrutiny in MLU care. Management appear not to
care.”(Standalonebirthcentre)
Managementwasdescribedas ‘outof touch’and lackingskills incommunicatingwiththe
workforce. There were many criticisms that managers lacked understanding of the
challenges of the ‘current working environment’ and the ‘complexities of current
demography’.Midwivesdescribedhow,intheirperception,managersfocusedontheshort-
term resolution of problems, rather than attending to issues of workforce sustainability:
‘Constantuseofstafftopluggapsinserviceinsteadofproperworkforcemanagementand
development.’(DGH)
Therewasageneral feeling thatmanagersdidnot ‘haveourback’ (DGH),andwouldnot
advocateforstaffinchallengingsituations:
“Coordinators not understanding area of yourwork and pulling staff away.
Coordinatorsnotescalatingtomanagerswhenshortstaffed.”(DGH)
“Poormanagers-whoseemtocarelittleformidwiferyanddon'tfightforeg
facilitiesforourwomen.”(DGH)
25
Participantsdescribeda lackofsupportandopportunity forpersonaldevelopment,which
was experienced as disheartening and demoralising. This was often attributed to lack of
fundingortime:
“Lackofopportunity forprofessionaldevelopment....nomoneyallocated,no
timeallocatedcomparedtoearlierinmycareer.Ifeelforyoungermidwives.”
(DGH)
Perceptions of midwifery empowerment
Midwives indicated high levels of empowerment on all subscales of the PEMS: Revised
scales(morethan95%positiveresponses),exceptitemsrelatingtoManagerSupport,which
recordedonly71%positiveresponses(Table12).
Predictors of burnout, depression, anxiety and stress.
Pearson correlation coefficientswere calculated between each of the PEMS: Revised and
PES:Midwivessubscalesandthemeasuresofburnoutandemotionalwellbeing(seeTable
13below).
The best predictor of Burnout-Work was the PES-Resource Adequacy subscale (r=-.47)
suggestingthatmidwiveswhoperceivetheyhavelowlevelsofresourceadequacyaremore
likelytoexperienceburnout.Substantialcorrelations(abover=.35)werealsoidentifiedfor
PEM-Manager Support, PES-Quality of Management, PEM-Professional recognition, and
PES-Opportunities for development. As previously highlighted the qualitative responses
overwhelmingly supported these results. The following comment perhaps sums up the
situation well: ‘Women's and managers expectations of gold standard care with only
‘bronze’standardstaffinglevels,clerksupport,equipmentandfacilities.’(DGH)
ScoresontheStressandDepressionsubscalesoftheDASSshowedsignificantcorrelations
withtwoofthesubscalesofthePEMSRevised:ManagerSupport,ProfessionalRecognition,
suggestingthattheseaspectsoftheworkenvironmentmayimpactonemotionalwellbeing
ofmidwives.
26
Midwivesalsodescribedalackofprofessionalrecognitionwithinthequalitativedata.While
sometimesthiswasnotedtobebetweenmidwiferycolleaguesandalsoduringinteractions
withwomen and their families, itwasmore commonlymentioned in relation tomedical
colleagues:‘LackofrespectfromObstetriccolleaguesatConsultantlevel.Feelingpowerless
whenwitnessingbehaviourthatisdetrimentaltojuniorcolleagues.’(DGH)
Thissenseofbeingundervaluedandunder-recognisedasaprofessionwascompoundedby
a perception that midwifery concerns were not acknowledged at a governmental level.
Frequently,the‘payfreeze’affectingmanyNHSprofessionalswascitedasevidenceofthis
invisibility:
“Lack of appreciation from those who create un-achievable targets i.e.
governmentministers. Devaluation of income from salary freeze/ increases
that are ridiculously behind inflation and behind other public services i.e.
politicians.”(Community-primarycaresettingonly)
AspectsoftheworkenvironmentmeasuredbythePEMS:RevisedandPES:Midwivesalso
hadasignificantimpactonmidwives’decisiontoleavetheprofession.InTable14scoreson
eachofthePEMS:RevisedandPES:Midwivessubscaleswerecomparedformidwiveswho
had, versus had not, considered leaving the profession in the past sixmonths.Midwives
whohadconsidered leavingtheprofessionrecordedmorenegativescoresoneachof the
PEMS:RevisedandPES:Midwivessubscales;thatis,theyhadmorenegativeperceptionsof
theirlevelofempowermentandoftheirpracticeenvironment.
Improving emotional wellbeing at work
Midwives were asked ‘if an intervention was made available to you to promote your
emotional wellbeing at work would you be interested in accessing that intervention?’
Ninety-threepercentofthesample(n=1682)answered‘yes’tothisquestion.Responsesto
additional questions concerning the type of intervention are presented in Table 15. The
majority of the midwives would be happy with either an individual or group-based
programme,with the largemajority (90.3%) preferring face-to-face as opposed to online
delivery.
27
Inthefreetextresponses,midwivesalso identifiedanumberofstrategiestheysuggested
wereworthyof furtherconsideration.Theseranged from ‘compulsory leadership training’
toaccessingmonthly‘clinicalsupervision’(asprovidedinmentalhealthnursing).Accessto
complementary therapies as well as Pilates, yoga, massage and relaxation (mindfulness)
werealsocommonlymentioned.Howeverperhapsthemostimportantconsiderationnoted
was the midwives’ request that, whatever was introduced to support their emotional
wellbeing, thereneeded tobeanassurance that theywouldbegiven ‘protected’ time to
attend.
The followingcommentbyoneparticipant seems to sumupwellwhatmidwivesneed to
improve their emotional wellbeing at work, and suggests the importance of the wider
culturalchangethatisneeded:
“Trainingtochangeculturewithinmidwifery.Wearenotsupportiveofeach
other.'Suckitup'iscommon,andisolationforthosethatmakeamistake.Far
toopunitive.Weneed courses to teachushow to support eachother!!We
can't assume this is obvious. Also leadership skills& how to address issues
whenneededorexpectedchangeisn'thappening.”(DGH).
SUMMARY AND DISCUSSION
In this final discussion, the original research aim and questions are returned to, and the
extenttowhichthesehavebeenansweredisconsidered.Limitationsareidentifiedandthe
resultsofthestudyarediscussed,withrecommendationsforpracticeandpolicy.
The study aim was to explore the relationship between the emotional wellbeing of UK
midwives and their work environment, to inform the RCM’s Caring for You campaign. A
survey was conducted using the WHELM survey tool, conceived within the Australian
maternity context and adjusted to ensure relevance to the UK context. The working
hypothesis was that work-related variables might be associated with emotional distress
(defined as burnout, depression, anxiety and stress) in midwives. We were particularly
interestedinidentifyinglevelsandpredictorsofburnout,depression,anxietyandstressin
midwives, and how these correlated with socio-demographic and work-related variables.
28
Wealsowantedtoidentifymidwives’intentiontoleavetheprofessionandthereasonsand
factorsassociatedwith this, and toexplorewhetheran interventiondesigned to improve
emotionalwellbeingmightbeacceptabletomidwives,andwhatformthismighttake.
These aims and objectives have been achieved, and important new insights have been
obtainedintohowmidwives’worksettingimpactsontheiremotionalwellbeing.Therewas
a good response rate: just under 2000 midwives responded to the survey (n=1997),
representing 16% of the RCMmembership. In addition to responding to the quantitative
questions,theparticipantsalsoprovideddetailedandoftenlengthyfreetextresponsesto
specificquestions. Itwasnotpossiblewithinthetimeframeofthestudytoprovidean in
depthanalysisofthequalitativedata.However,furtheranalysiswillbeundertakenwitha
viewtopublishingadditionalqualitativeandquantitativefindingspapers.
Discussion of the findings
ThefindingsofthisstudyareextremelyconcerningastheyindicatethattheUK’smidwifery
workforce isexperiencinghigh levelsofemotionaldistress. Indeed, the levelsofburnout,
stressandanxietyarethehighestrecordedtodatewithinamidwiferypopulationandthisis
ofgreatconcern(forinternationalcomparisons,seeCreedyetal.,2017;Hildingssonetal.,
2013;Dixonetal,2016).Theimpactthatthis ishavingontheprofessionisprofoundwith
many considering leaving the profession as a result. It is of great concern that many
younger,morerecententrantstotheprofessionareconsideringleaving.
Levels of emotional ill health: who is at risk?
There are worryingly high levels of burnout, stress, anxiety and depression within this
sample of UK midwives. Over one third of participants scored in the
moderate/severe/extremerangeforstress(36.7%)anxiety(38%)anddepression(33%).This
was well above population norms and those of other WHELM countries. In relation to
burnout, 83% of participants were suffering from personal burnout and 67% were
experiencing work-related burnout. Once again, the personal and work related burnout
scores were well above population norms as well as the results from other WHELM
collaboratingcountries.Onamorepositivenote,client-relatedburnoutwaslowat15.5%.
29
Thosemostlikelytoscorehighlyforburnout,stress,anxietyanddepressionwereyounger
midwives(midwivesaged40andbelow);midwiveswithadisability;midwiveswithlessthan
30years’experience;andclinicalmidwives,particularly thoseworkingrotation inhospital
andinintegratedhospital/communitysettings.
Ofgreatconcernisthefindingthatyoungermidwives(aged40yearsandunder)andthose
withfeweryearsofclinicalexperienceareatincreasedriskofemotionalcompromisethan
theirpeers.TherehavebeensimilarworryingfindingsinWHELMstudiesconductedinother
countries (see for example Creedy et al., 2017; Hildingsson et al., 2013; Hildingsson and
Fenwick, 2015) and other studies outside of theWHELM consortium have also reported
similarfindings(Mollartetal.,2013).Thesemidwivesarethefutureoftheprofessionandit
is crucial that themore recent entrants to theprofession feel supported and satisfiedby
theirwork.
Itisallthemorecriticaltosupportthenewermembersoftheprofession,giventheageing
midwiferyworkforce.TherecentStateoftheMaternityServicesReport(RCM2016c)warns
that, in England andWales, one in threemidwives are in their 50s and 60s. The report
argues that “More students need to be trained and brought into the health service as a
matter of urgency if we are to turn this situation around” (RCM 2016c, p.3). However,
without seriousattention toaddressing the issues raisedby this study,whether itwill be
possibletoretainthesenewrecruitsisquestionable.
In addition the finding that midwives who self-report a disability are at greater risk of
burnout,stress,anxietyanddepressionisworrying.Twelvepercentoftheparticipantsself-
reported some form of physical or mental disability, which represents a sizeable group
within themidwiferyworkforce. It is disappointing that those inmost needofworkplace
supportdonotappeartobereceivingthisinwaysthatpromotetheiremotionalwellbeing.
Perhapsnot surprisinglymidwivesworking clinicallyweremore at riskof burnout, stress,
anxietyanddepressionthantheirnon-clinicalcolleagues.Thiswasparticularlythecasefor
those working in rotational positions within hospitals and those working in integrated
hospital /community settings. The qualitative data provided important insights into why
theseways ofworking created stress and anxiety. In both situations,midwives described
howtheylackedagencyandfelttheywerebeingusedinstrumentally,thatis,solelytomeet
30
theneedsoftheorganisation.Theydescribedalackofpersonalcontrolovermanyaspects
oftheirwork;forexample,shiftworking,rotas,oncall.Therewerenoperceivedpersonal
benefits (e.g. in termsofbroadeningexperience)or for thecareofwomen, ratherall the
benefitswereperceivedasbeingto theorganisation. Interestingly,wheresomemidwives
hadbeenabletotakecontroloftheirworkinglife,forexamplebyworkingpart-time,they
describedimprovedworklifebalance.
Thestrongestpredictorofwork-relatedburnoutwasaperceptionoflowlevelsofresource
adequacy (staffing levels, equipment). In addition, perceived low levels of management
support, professional recognition and opportunities for development also contributed to
burnout,depression,anxietyandstress.Onceagain,thequalitativedataprovidedvaluable
insightsintothesenegativeexperiences.Thedescriptionsofbeingunabletotakeabreakto
usethetoiletorhaverefreshmentswereshocking,evenmoresoastheyappearedtohave
becomeanacceptedpartofeverydaypractice.
The impact of relationships
Poor relationships with managers, poor quality and unsupportive management featured
strongly in both the quantitative and qualitative data sets. Midwives described feeling
undervaluedandunappreciatedbyall levelsofmanagement.Managementwasalsooften
discussed in relation to other concerns; for example when concerns about staffing and
workloadwere raised, therewasdisappointment thatmanagersdidnotacknowledge the
validityof theseconcerns.Whenparticipantsdescribedanxietiesaboutpossible litigation,
theyindicatedthatthemanagersoftencouldnotbereliedonforsupport:‘Theyhaven’tgot
ourbacks’(DGH).ThereweresimilarfindingsinanAustralianstudywhichinvestigatedhow
an external review of maternity services impacted on midwives (Hood et al, 2010). The
impressiongainedwasthat, intheWHELMstudyparticipants’perception,managerswere
often out of touch with the day-to-day realities of midwives’ working lives, failed to
acknowledge the needs and expertise of individual midwives and were over-focused on
meetingorganisationaldemandsattheexpenseofensuringtheemotionalwellbeingofthe
workforce.Ratherthanleadingteamsofmidwivesbysupportingprofessionaldevelopment,
involving and advocating for them and arguing for better working conditions, many
midwivesdescribedmanagersasdisassociatedanddisconnected.
31
Thereweresimilar findings inaKingsFundstudyof safety inmaternity services (Smith&
Dixon, 2008). Midwives described how poor quality management was a key factor in
compromisingthesafetyofwomenandtheirbabies.Similartotheparticipantsinthisstudy,
midwives described managers as problematic when they were remote and business
focused,lackedclinicalcredibility,andfailedtocommunicateeffectivelywithstaff.
It is important, however, to balance this critique with a consideration of the challenges
facedbymanagersthemselves.Theliteraturesuggeststhatdirectlinemanagersareoften
caught between the needs of the staff they manage and the expectations of their own
managers,andalsobetweentheircommitmenttomidwiferyidealsofwoman-centredcare
andtheneedtomeetorganisationalrequirements(Curtisetal.,2003).
Thesefindingsarenotnew.Dissatisfactionwithmidwiferymanagement, inparticularthat
managerswere unapproachable and out of touchwith practice,was a key finding of the
original ‘WhyMidwives Leave’ report for RCM (Ball et al., 2002). As a result, a followup
qualitative study ‘WhyDoMidwives Leave?Talking toManagers’ (Curtisetal., 2003)was
commissioned. This studyprovided important insights into the challenges experiencedby
midwiferymanagers at various levels of the organisation, highlighting the powerlessness
andsenseofdissonance thatmanyexperienced. It is sobering that relationshipsbetween
midwivesandtheirmanagersdonotseemtohaveimprovedinthepastfourteenyears,and
that the recommendationsof the2003 report (Curtis et al., 2003)donotappear tohave
beenwidelyimplemented.
Asdifficultrelationshipswithmanagersandpoorqualitymanagementaresuchsignificant
findingsofthisWHELMstudy,itisimportanttoexaminethemidwiferymanagersagainasa
separate group and identify their needs, if we are to be able to effect positive changes
movingforward.
Onamorepositivenote,relationshipswithmidwiferycolleaguesweregenerallydescribed
as positive and supportive. Good teamworking, collegial support and camaraderie were
identifiedassatisfyingaspectsofwork.
Sustainability of the workforce at risk:
32
Two thirds of participants (66.6%) stated they had thought about leaving the profession
within the last sixmonths. The significanceof suchadisturbing finding for aprofessional
workforce that is already understaffed should not be underplayed. It provides strong
evidence that high level policy intervention is urgently needed to address the concerns
identified. The two top reasons given for considering leaving were: ‘Dissatisfaction with
staffing levels at work’ (60%) and ‘Dissatisfaction with the quality of care I was able to
provide’ (52%). Midwives intending to leave had significantly higher levels of burnout,
anxiety,stressanddepressionthanthosewhohadnotconsideredleaving.
‘Dissatisfactionwithstaffinglevels’issimilartothe‘lowlevelsofresourceadequacy’noted
as the strongest predictor of work-related burnout. The free text responses related to
‘Dissatisfactionwith the quality of care Iwas able to provide’ provided insights into how
poor staffing levels impactedonto thequalityof care.This is clearlynotgood forwomen
andtheirfamilies,butitisalsodistressinganddemoralisingformidwives.
ThefindingsoftherecentlypublishedMBRRACEPerinatalConfidentialEnquiry(Draperet
al.,2017)stronglyreinforceparticipants’concernsabouttheimpactofstaffingshortageson
safetyandqualityofcare.Shockingly,theEnquiryidentified‘servicecapacityissues’as
affecting‘…overafifthofthedeathsreviewed,withmorethanhalfofthesesituations
beingconsideredtohavecontributedtothepooroutcome’(Draperetal.,2017,p12).
Indeed,thefirstkeypolicyrecommendationisthat‘Concernsidentifiedinthisconfidential
enquiryaboutstaffingandcapacityissuesinmaternityservices[……]needtobeaddressed’
(Draperetal.,2017,p15).
Theseconcerningfindingsaboutworkforcesustainabilityshouldnotcomeasashock.They
are very similar to those of the RCM’s 2016 survey of midwives who had left or were
considering leaving midwifery. That is, midwives were not happy with staffing levels at
work; not satisfied with the quality of care they were able to give; not happy with the
workload; not happy with working conditions. Concerns were also expressed about the
qualityofmanagerial support, themodelof care thatmidwiveswereworking in,bullying
anddiscrimination(RCM,2016b).TheWHELMstudyaddstothisevidencebase,providinga
deeper analysis of the organisational and relationship factors impacting on midwives’
emotionalwellbeing.
33
Limitations of the study
Thestudyhadsomelimitations,whichshouldbetakenintoaccountwhenconsideringthe
findings. Midwives self-selected when deciding to participate in the study, which means
some midwives experiencing severe burnout and/or depression or who were extremely
dissatisfied may not have participated or conversely they may have been motivated to
participate in the study and thus be over represented. In addition, during the process of
datacollectiontheNHSsufferedacyber-attack.Disruptiontointernetservicesmeantthat
someparticipantshadnot fullycompletedthesurveyat the timeof theattack,andwere
not able to return to their saved survey once internet services were resumed. Many
midwivesmayhavethendecidednottorecommencethesurvey.
Measuringoutcomesatonlyonepointintimealsolimitsunderstanding.Thecross-sectional
designdoesnotpermitcauseandeffecttobeconcluded,butdoeshighlightprevalenceand
relationships amongst factors as the basis for future research. However, the use ofwell-
validatedtoolsproducedsomeinterestingresultsthat lendthemselvestofurthernational
andinternationalcomparisons.LikewisemanyofthefindingsechothoseoftheRCM’sother
recentworkforcesurvey(RCM,2016b),suggestingthecredibilityofourresults.
Conclusion and recommendations:
This research study has investigated UK midwives’ emotional wellbeing and how this is
affected by theworkplace. The findings aredeeply concerning, indicating thatmidwives’
emotionalwellbeing is compromised to suchanextent that two thirdsof those surveyed
were considering leaving the profession. The prospect of an evenmore heavily depleted
workforce has major implications for the quality of UK maternity services, and for the
wellbeingofwomenandtheirbabies.For thosemidwiveswhostay in theprofession, the
evidence from this survey suggests that they run the risk of unacceptably high levels of
stress,anxietyanddepression.Thiswillnotonlyaffecttheirpersonalandfamily lives,but
will also significantly impact on the quality of care that they can provide forwomen and
theirfamilies.
34
Therearenoquickfixesforthissituation.Under-investmentintheNHS,achronicshortage
ofmidwifery personnel and the increasing complexity of maternity care will continue to
presentmany challenges (Draper et al., 2017). TheWHELM study, however, offers some
newinsights,addingtotheexistingevidencebaseandaffordingadeeperanalysisofhow
midwives’emotionalwellbeingisaffectedbyorganisationalandrelationshipfactors.Some
ofthesefactorswillbeamenabletoorganisationalchange,thusthefindingscouldinforma
systems-wide,solution-focusedapproachtoresolvetheselevelsofdistressatanindividual
practitioner level. It is vital that any solutions attend to the wider processes and policy
changes thatareneeded to supportnewstrategiesand interventions, thusensuring their
relevance,acceptabilityandsustainability.
For example, investment in high quality training for midwifery managers and leaders is
criticaltodevelopcommunicationandadvocacyskills,thusensuringthatclinicalmidwives
feel authentically heard, valued and supported. It is essential that all managers receive
training which is appropriate for the context and challenges of UK maternity care, and
underpinned by a supportive, empowering and collaborative approach to leadership
congruentwith best practice (West et al., 2015).Midwiferymanagers are of course also
underconsiderablestrainthemselves,whichislikelytoimpactonthewaythattheyinteract
with midwives ‘on the ground’. Research is needed into the experiences of midwifery
managers,andinparticularthebarriersandfacilitatorsthattheyexperienceincarryingout
theirrole,inordertoinformnewapproachestotraining.
It is also important to embrace new thinking about NHS healthcare management and
leadership (Dixon-Woods et al., 2014; West et al., 2015) which focuses on a collective
leadership approach whereby leadership is ‘everyone’s business’, rather than the pre-
occupationofasmallnumberofdesignatedleaders.Thiscouldalsohavetheadvantageof
facilitating a senseof agency,which theparticipants in this studydescribedpositively, as
wellasreducingthedivisive‘usandthem’culturedescribedvividlyinthequalitativedata.
It is hoped that the RCM will use the robust data provided by this empirical study to
strengthen its ongoing campaigns to push for systems level change that will support,
nurture and grow a skilled and compassionate midwifery workforce at all levels of the
service.
35
Specific Recommendations:
• Lobby for systems level changes in the resourcing andprovisionofmaternity care
throughouttheUK.
• Increasepressureongovernment toaddress issuesofworkforceshortages,witha
new focus on retention of new graduates rather than merely increasing student
numbers.
• Introduceevidence-basedinterventionsforworkforcewellbeingsupport(e.g.clinical
supervision,mindfulness, complementary therapies) andensure thatmidwivesare
given‘protected’timetoattend.
• Provide proactive support for younger, recently qualified midwives, a group
identifiedinthisstudyasbeingparticularlyatriskofemotionalcompromise.Focus
thissupportonthekeyidentifiedneedsofthisgroup,inordertopromoteworkforce
sustainability.
• Provideproactivesupportformidwiveswithadisabilitytosupporttheiremotional
wellbeing.
• Ensure thatallmanagers receivehighqualitymanagementand leadership training
which is appropriate for the context and challenges of UK maternity care, and
underpinnedbyasupportive,empoweringandcollaborativeapproachtoleadership
congruentwithbestpractice(Westetal.,2015).
• Facilitate a sense of shared leadership amongst midwives at a team level, for
exampleengagingclinicalmidwivesinpurposefuldiscussionsabouthowtoimprove
carewhicharethenactedupon.Seekopportunitiesforoptimisingmidwives’sense
ofagency.
• Update the evidence base relating to midwifery managers’ experiences by
undertakingresearchintotheiremotionalwellbeingandneeds.
36
References
Bakker, R.,Groenewegen, P., Jabaaij, L., Sixma,H.,&deVeer,A. (1996) 'Burnout' among
Dutchmidwives.Midwifery,12,pp.174-181.
Ball,L.,Curtis,P.&KirkhamM.(2002)WhydoMidwivesLeave?,London,RoyalCollegeof
Midwives.
Creedy,D.K.,Sidebotham,M.,GambleJ.,PallantJ.,FenwickJ.(2017)Prevalenceofburnout,
depression, anxiety and stress in Australian midwives: a cross-sectional survey. BMC
PregnancyandChildbirth,17(13),pp.1-8.
Crowther,S.,Hunter,B.,McAra-Couper,J.,Warren,L.,Gilkinson,A.,Hunter,M.,Fielder,A.,
& Kirkham, M. (2016) Sustainability and resilience in midwifery: a discussion paper.
Midwifery,40,pp.40-48.(10.1016/j.midw.2016.06.005)
CurtisP.,BallL.,KirkhamM.(2003)WhydoMidwivesLeave?TalkingtoManagers,London,
RoyalCollegeofMidwives/Women’sInformedChildbearingGroup,UniversityofSheffield.
Dixon,L.,Guilliland,K.,Pallant,J.,Sidebotham,M.,Fenwick,J.,McAra-Couper,J.,&Gilkison,
A.(2017)TheemotionalwellbeingofNewZealandmidwives:comparingresponsesbetween
employed,self-employed(caseloading)andmidwiveswhodoboth.NZCOMJournal,53,pp.
5-14.doi:http://dx.doi.org/10.12784/nzcomjnl53.2017.1.5-14
37
Dixon-Woods,M.,Baker,R.,Charles,K.,Dawson,J.,Jerzembek,G.,Martin,G.,McCarthy,I.,
McKee,L.,Minion, J.,Ozieranski,P.,Willars, J.,Wilkie,P.,&West,M. (2014).Cultureand
behaviour in the English National Health Service: overview of lessons from a large
multimethodstudy.BMJQualityandSafety,23(2),pp.106-115.
Draper, E.S., Kurinczuk, J.J, & Kenyon, S., (Eds.) on behalf ofMBRRACE-UK.MBRRACE-UK
(2017) Perinatal Confidential Enquiry: Term, singleton, intrapartum stillbirth and
intrapartum-related neonatal death. The Infant Mortality and Morbidity Studies,
DepartmentofHealthSciences,UniversityofLeicester:Leicester,2017.
Fenwick,J.,Hammond,A.,Raymond,J.,Smith,R.,Gray,J.,Foureur,M.,Homer,C.,&Symon,
A.(2012)Surviving,notthriving:aqualitativestudyofnewlyqualifiedmidwives.Journalof
ClinicalNursing,21,pp.2054-2063.
Hildingsson, I., & Fenwick, J. (2015) Swedish midwives' perception of their practice
environment–Acrosssectionalstudy.Sexual&ReproductiveHealthcare,6(3),pp.174-181.
Hildingsson, I.,Westlund,K.,&Wiklund, I. (2013)Burnout in Swedishmidwives.Sexual&
ReproductiveHealthcare.4(3),pp.87-91.
Hood, L., Fenwick, J., & Butt, J. (2010) A story of scrutiny and fear: Australianmidwives'
experienceofanexternalreviewofobstetricservices,beinginvolvedwithlitigationandthe
impactonclinicalpractice.Midwifery,26,pp.268-285.
Hunter, B. (2004) Conflicting ideologies as a source of emotion work in midwifery.
Midwifery,20,pp.261-272.
38
Hunter,B.(2006)Theimportanceofreciprocityinrelationshipsbetweencommunity-based
midwivesandmothers.Midwifery,22,pp.308-322.
Hunter,B.(2010)Mappingtheemotionalterrainofmidwifery:whatcanweseeandwhat
liesahead?InternationalJournalofWorkOrganisationandEmotion,3,pp.253-269.
Hunter,B.,&Warren,L. (2014)Midwives׳experiencesofworkplaceresilience.Midwifery,
30(8),pp.926-934.doi:http://dx.doi.org/10.1016/j.midw.2014.03.010
Kirkham, M., Morgan, R. K., & Davies, C. (2006)Why do midwives stay? Department of
Health via Bedfordshire & Hertfordshire Workforce Development Confederation,
DepartmentofHealth.
Kristensen, T. S., Borritz, M., Villadsen, E., & Christensen, K. B. (2005) The Copenhagen
BurnoutInventory:Anewtoolfortheassessmentofburnout.Work&Stress,19(3),pp.192-
207.
Leinweber, J.,&Rowe,H. J. (2010)Thecostsof 'beingwithwoman': secondary traumatic
stressinmidwifery.Midwifery,26,pp.76-87.
Lovibund, S,& Lovibund,P. (1995)Manual for theDepression StressAnxiety Scales. 2 ed.
Sydney:PsychologyFoundationofAustralia.
McAra-Couper, J., Gilkison, A., Crowther, S., Hunter, M., Hotchin, C., & Gunn, J. (2014)
PartnershipandreciprocitywithwomensustainLeadMaternityCarermidwivesinpractice.
NewZealandCollegeofMidwivesJournal,49,pp.29-33.
39
Mollart, L., Skinner, V.M., Newing, C., & Foureur,M. (2013) Factors that may influence
midwiveswork-relatedstressandburnout.WomenandBirth,26(1),pp.26-32.
NursingandMidwiferyCouncil(NMC)(2017)AnnualEquality,DiversityandInclusionReport.
NMC/17/103.London,NMC.29thNovember2017.
Pallant, J. F., Dixon, L., Sidebotham, M., & Fenwick J. (2015) Further validation of the
perceptionsofempowermentinmidwiferyscale.Midwifery,31(10),pp.941-5.
Pallant,J.F.,Dixon,L.,Sidebotham,M.,&Fenwick,J.(2016)Adaptationandpsychometric
testingof thePracticeEnvironmentScale forusewithmidwives.WomenandBirth,29(1),
pp.24-29.
Rice, H., & Warland, J. (2013) Bearing witness: Midwives’ experiences of witnessing
traumaticbirth.Midwifery,29(9),pp.1056-1063.
RCM(2016a)CaringforYouCampaign:SurveyResults.RCMcampaignforhealthy
workplacesdeliveringhighqualitycare
https://www.rcm.org.uk/sites/default/files/Caring%20for%20You%20%20Survey%20Results
%202016%20A5%2084pp_5%20spd.pdf
RCM(2016b)WhyMidwivesLeave–Revisited.
https://www.rcm.org.uk/sites/default/files/Why%20Midwives%20Leave%20Revisted%20-
%20October%202016.pdf
40
RCM(2016c)StateofMaternityServicesReport2016.
https://www.rcm.org.uk/sites/default/files/SoMS%20Report%202016_New%20Design_low
res.pdf
RCM(2017)NewNMCreportshowstheneedformoremidwivessaysRCM.November2nd
2017 https://www.rcm.org.uk/news-views-and-analysis/news/‘new-nmc-report-shows-the-
need-for-more-midwives-says-rcm’.
Sheen, K., Spiby, H., & Slade, P. (2015) Exposure to traumatic perinatal experiences and
posttraumatic stress symptoms in midwives: Prevalence and association with burnout.
InternationalJournalofNursingStudies,2(2),pp.578-587.
Smith A., & Dixon A. (2008) Health Care Professionals’ Views About Safety in Maternity
Services.London,KingsFund
Sullivan, K., Lock, L., & Homer, C. (2011) Factors that contribute to midwives staying in
midwifery: A study in one area health service in New SouthWales, Australia.Midwifery,
27(3),pp.331-335.doi:http://dx.doi.org/10.1016/j.midw.2011.01.007
Wakelin, K., & Skinner, K. (2007) Staying or leaving: A telephone survey of midwives,
exploringthesustainabilityofpracticeasLeadMaternityCarersinoneurbanregionofNew
Zealand.NewZealandCollegeofMidwives,37,pp.10-14.
Warwick, C. (2017) 'Midwife leader’sNew Yearwish list for England’smaternity services'
https://www.rcm.org.uk/news-views-and-analysis/news/midwife-leader%E2%80%99s-new-
year-wish-list-for-england%E2%80%99s-maternity-services
41
West,M., Armit, K., Loewenthal, L., Eckert, R.,West, T.,& Lee, A. (2015) Leadership and
Leadership Development in Healthcare: The Evidence Base. London, Faculty of Medical
LeadershipandManagement.
Yoshida,Y.,&Sandall, J. (2013)Occupationalburnoutandworkfactors incommunityand
hospital midwives: A survey analysis. Midwifery, 29(8), pp. 921-926.
doi:http://dx.doi.org/10.1016/j.midw.2012.11.002
42
Table1Participantdemographiccharacteristics
Characteristic Statistic NMC figures (NMC,2017)
Sex(n,%)
Female 1981(99.4%) 34,439(99.7%)
Male 8(.4%) 114(0.3%)
Other 1(.1%)
Prefernottosay 2(.1%)
Age
20-29yrs 271(13.7%) 6278(18.2%)
30-39yrs 361(18.3%) 8836(25.6%)
40-49yrs 496(25.1%) 8345(24.2%)
50-59yrs 714(36.1%) 9313(27.0%)
60andover 134(6.8%) 1782(5.2%)
Missing 21
Total 1997 34,554
Median 47yrs
IQR(25th,75thpercentile) 36,54yrs
Range(years) 21–67yrs
Maritalstatus(n,%)
Single 311(15.6%)
Married/civilpartnership/cohabiting 1480(74.3%)
Separated/divorced 180(9%)
Widowed 21(1.1%)
Ethnicity(n,%)
Asian/AsianBritish 16(.8%) 522(1.6%)
Black/BlackBritish 40(2%) 1101(3.2%)
Mixed 21(1.1%) 564(1.7%)
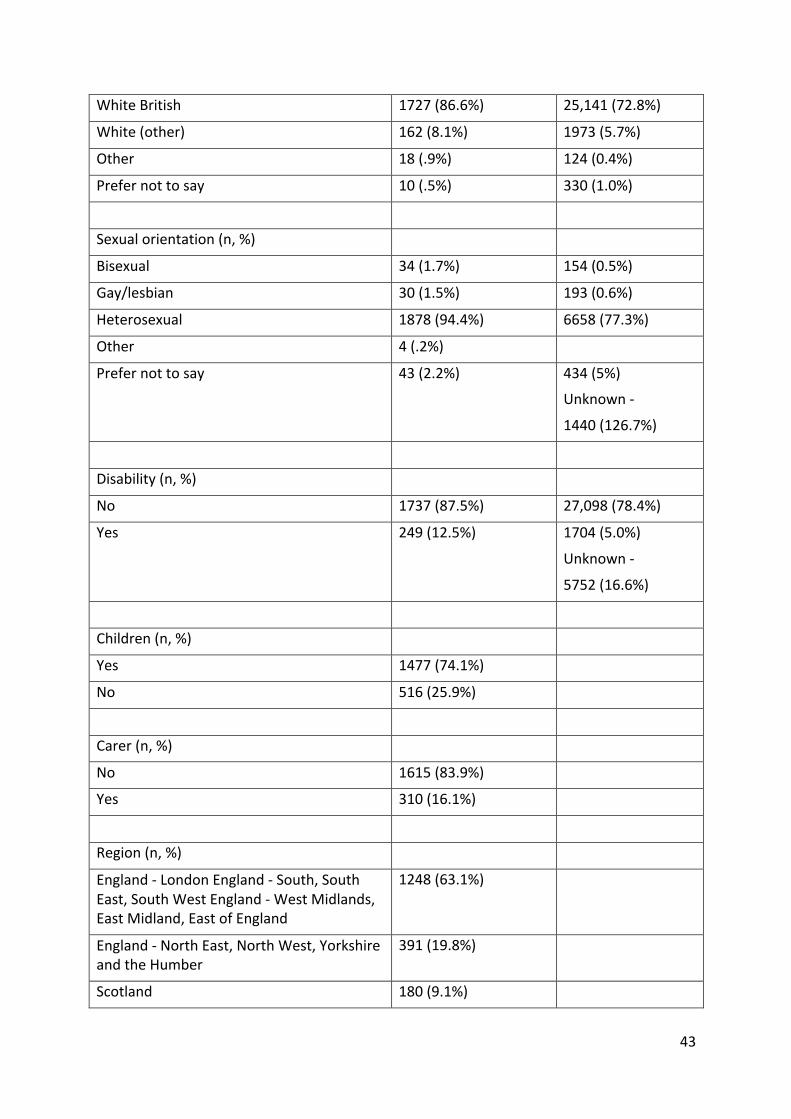
43
WhiteBritish 1727(86.6%) 25,141(72.8%)
White(other) 162(8.1%) 1973(5.7%)
Other 18(.9%) 124(0.4%)
Prefernottosay 10(.5%) 330(1.0%)
Sexualorientation(n,%)
Bisexual 34(1.7%) 154(0.5%)
Gay/lesbian 30(1.5%) 193(0.6%)
Heterosexual 1878(94.4%) 6658(77.3%)
Other 4(.2%)
Prefernottosay 43(2.2%) 434(5%)
Unknown-
1440(126.7%)
Disability(n,%)
No 1737(87.5%) 27,098(78.4%)
Yes 249(12.5%) 1704(5.0%)
Unknown-
5752(16.6%)
Children(n,%)
Yes 1477(74.1%)
No 516(25.9%)
Carer(n,%)
No 1615(83.9%)
Yes 310(16.1%)
Region(n,%)
England-LondonEngland-South,SouthEast,SouthWestEngland-WestMidlands,EastMidland,EastofEngland
1248(63.1%)
England-NorthEast,NorthWest,YorkshireandtheHumber
391(19.8%)
Scotland 180(9.1%)

44
Wales 107(5.4%)
NorthernIreland 52(2.6%)
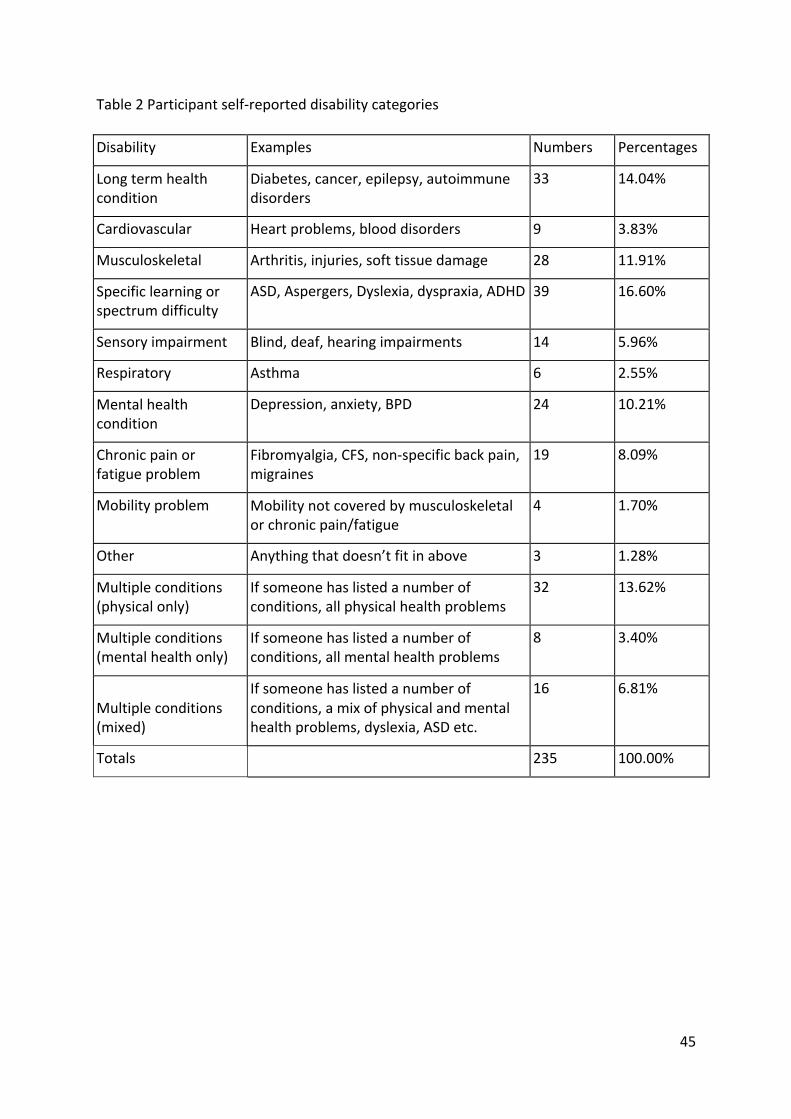
45
Table2Participantself-reporteddisabilitycategories
Disability Examples Numbers Percentages
Longtermhealthcondition
Diabetes,cancer,epilepsy,autoimmunedisorders
33 14.04%
Cardiovascular Heartproblems,blooddisorders 9 3.83%
Musculoskeletal Arthritis,injuries,softtissuedamage 28 11.91%
Specificlearningorspectrumdifficulty
ASD,Aspergers,Dyslexia,dyspraxia,ADHD 39 16.60%
Sensoryimpairment Blind,deaf,hearingimpairments 14 5.96%
Respiratory Asthma 6 2.55%
Mentalhealthcondition
Depression,anxiety,BPD 24 10.21%
Chronicpainorfatigueproblem
Fibromyalgia,CFS,non-specificbackpain,migraines
19 8.09%
Mobilityproblem Mobilitynotcoveredbymusculoskeletalorchronicpain/fatigue
4 1.70%
Other Anythingthatdoesn’tfitinabove 3 1.28%
Multipleconditions(physicalonly)
Ifsomeonehaslistedanumberofconditions,allphysicalhealthproblems
32 13.62%
Multipleconditions(mentalhealthonly)
Ifsomeonehaslistedanumberofconditions,allmentalhealthproblems
8 3.40%
Multipleconditions(mixed)
Ifsomeonehaslistedanumberofconditions,amixofphysicalandmentalhealthproblems,dyslexia,ASDetc.
16 6.81%
Totals
235 100.00%
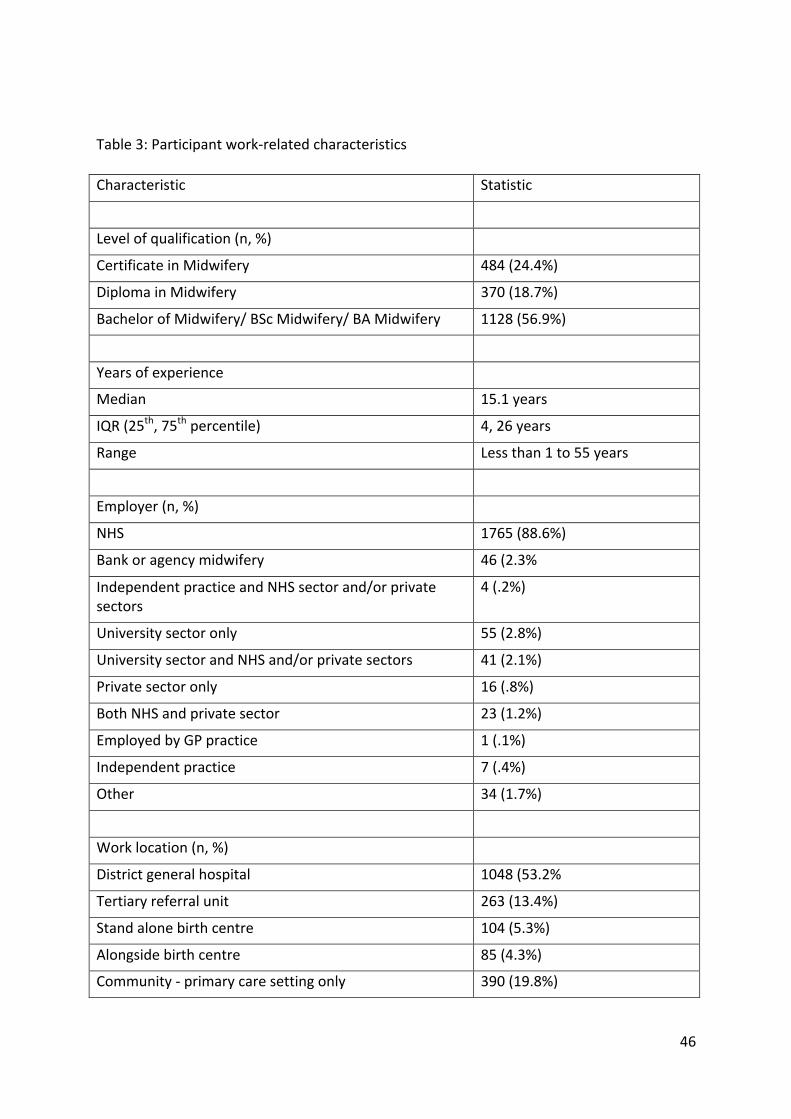
46
Table3:Participantwork-relatedcharacteristics
Characteristic Statistic
Levelofqualification(n,%)
CertificateinMidwifery 484(24.4%)
DiplomainMidwifery 370(18.7%)
BachelorofMidwifery/BScMidwifery/BAMidwifery 1128(56.9%)
Yearsofexperience
Median 15.1years
IQR(25th,75thpercentile) 4,26years
Range Lessthan1to55years
Employer(n,%)
NHS 1765(88.6%)
Bankoragencymidwifery 46(2.3%
IndependentpracticeandNHSsectorand/orprivatesectors
4(.2%)
Universitysectoronly 55(2.8%)
UniversitysectorandNHSand/orprivatesectors 41(2.1%)
Privatesectoronly 16(.8%)
BothNHSandprivatesector 23(1.2%)
EmployedbyGPpractice 1(.1%)
Independentpractice 7(.4%)
Other 34(1.7%)
Worklocation(n,%)
Districtgeneralhospital 1048(53.2%
Tertiaryreferralunit 263(13.4%)
Standalonebirthcentre 104(5.3%)
Alongsidebirthcentre 85(4.3%)
Community-primarycaresettingonly 390(19.8%)
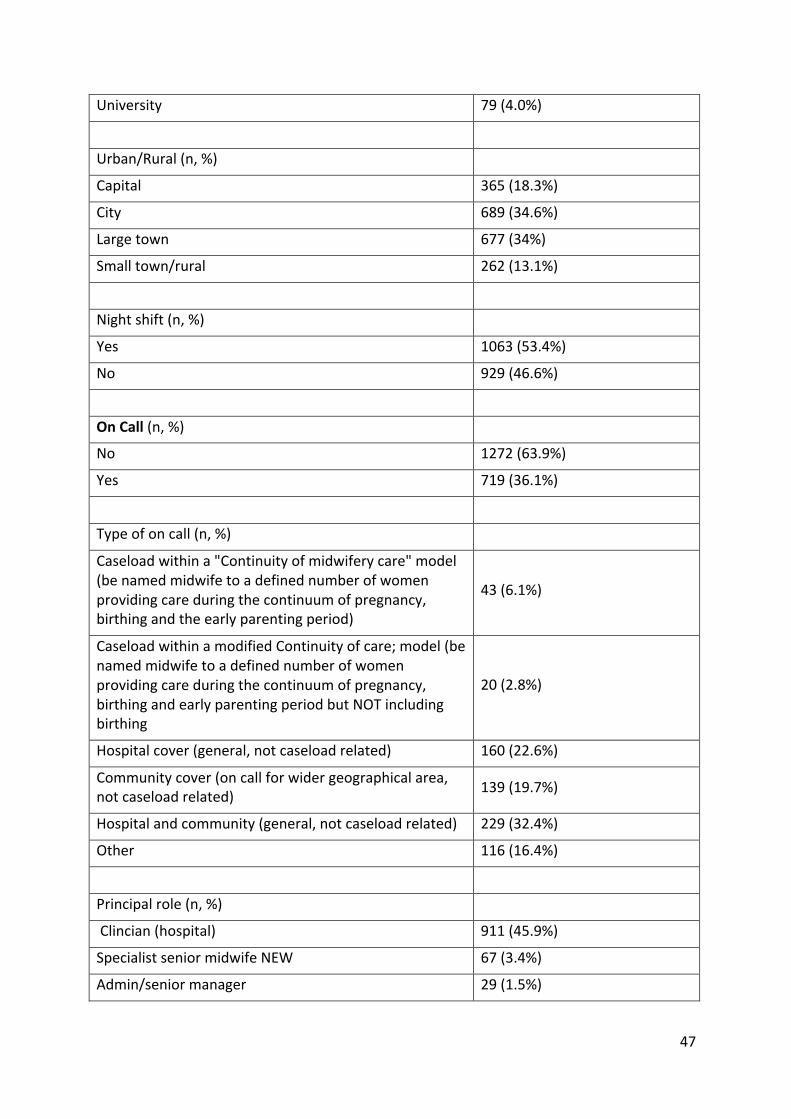
47
University 79(4.0%)
Urban/Rural(n,%)
Capital 365(18.3%)
City 689(34.6%)
Largetown 677(34%)
Smalltown/rural 262(13.1%)
Nightshift(n,%)
Yes 1063(53.4%)
No 929(46.6%)
OnCall(n,%)
No 1272(63.9%)
Yes 719(36.1%)
Typeofoncall(n,%)
Caseloadwithina"Continuityofmidwiferycare"model(benamedmidwifetoadefinednumberofwomenprovidingcareduringthecontinuumofpregnancy,birthingandtheearlyparentingperiod)
43(6.1%)
CaseloadwithinamodifiedContinuityofcare;model(benamedmidwifetoadefinednumberofwomenprovidingcareduringthecontinuumofpregnancy,birthingandearlyparentingperiodbutNOTincludingbirthing
20(2.8%)
Hospitalcover(general,notcaseloadrelated) 160(22.6%)
Communitycover(oncallforwidergeographicalarea,notcaseloadrelated) 139(19.7%)
Hospitalandcommunity(general,notcaseloadrelated) 229(32.4%)
Other 116(16.4%)
Principalrole(n,%)
Clincian(hospital) 911(45.9%)
SpecialistseniormidwifeNEW 67(3.4%)
Admin/seniormanager 29(1.5%)
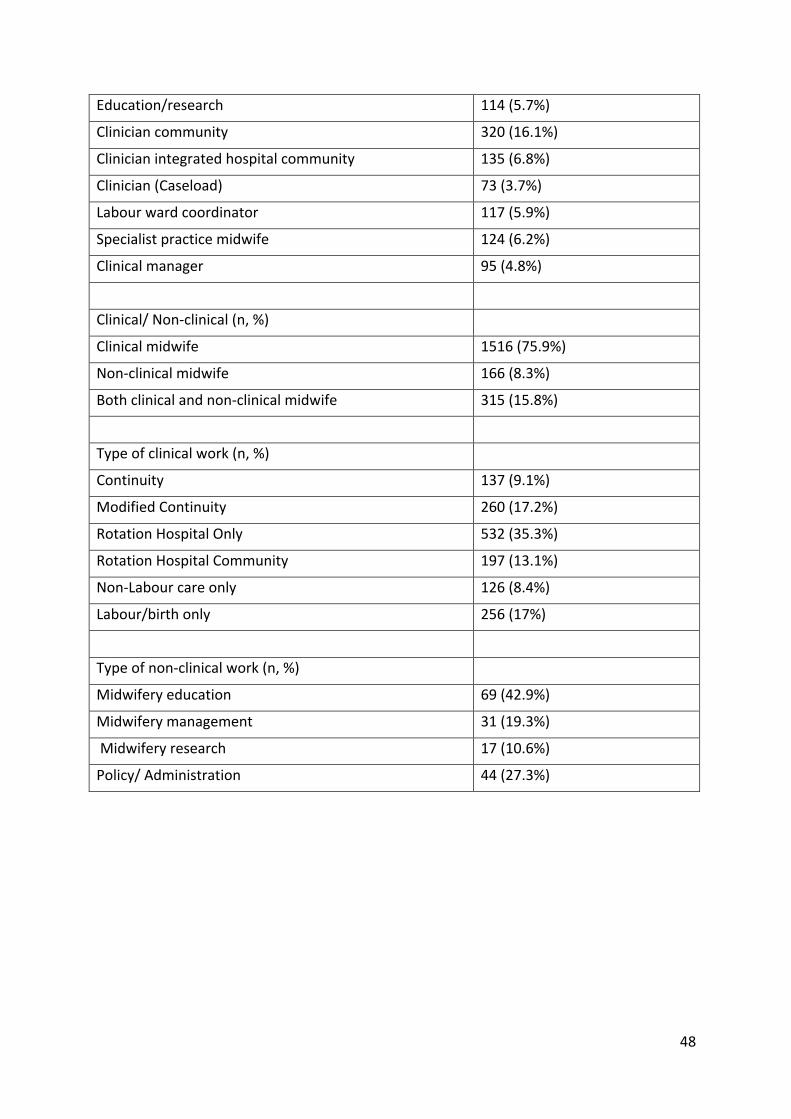
48
Education/research 114(5.7%)
Cliniciancommunity 320(16.1%)
Clinicianintegratedhospitalcommunity 135(6.8%)
Clinician(Caseload) 73(3.7%)
Labourwardcoordinator 117(5.9%)
Specialistpracticemidwife 124(6.2%)
Clinicalmanager 95(4.8%)
Clinical/Non-clinical(n,%)
Clinicalmidwife 1516(75.9%)
Non-clinicalmidwife 166(8.3%)
Bothclinicalandnon-clinicalmidwife 315(15.8%)
Typeofclinicalwork(n,%)
Continuity 137(9.1%)
ModifiedContinuity 260(17.2%)
RotationHospitalOnly 532(35.3%)
RotationHospitalCommunity 197(13.1%)
Non-Labourcareonly 126(8.4%)
Labour/birthonly 256(17%)
Typeofnon-clinicalwork(n,%)
Midwiferyeducation 69(42.9%)
Midwiferymanagement 31(19.3%)
Midwiferyresearch 17(10.6%)
Policy/Administration 44(27.3%)
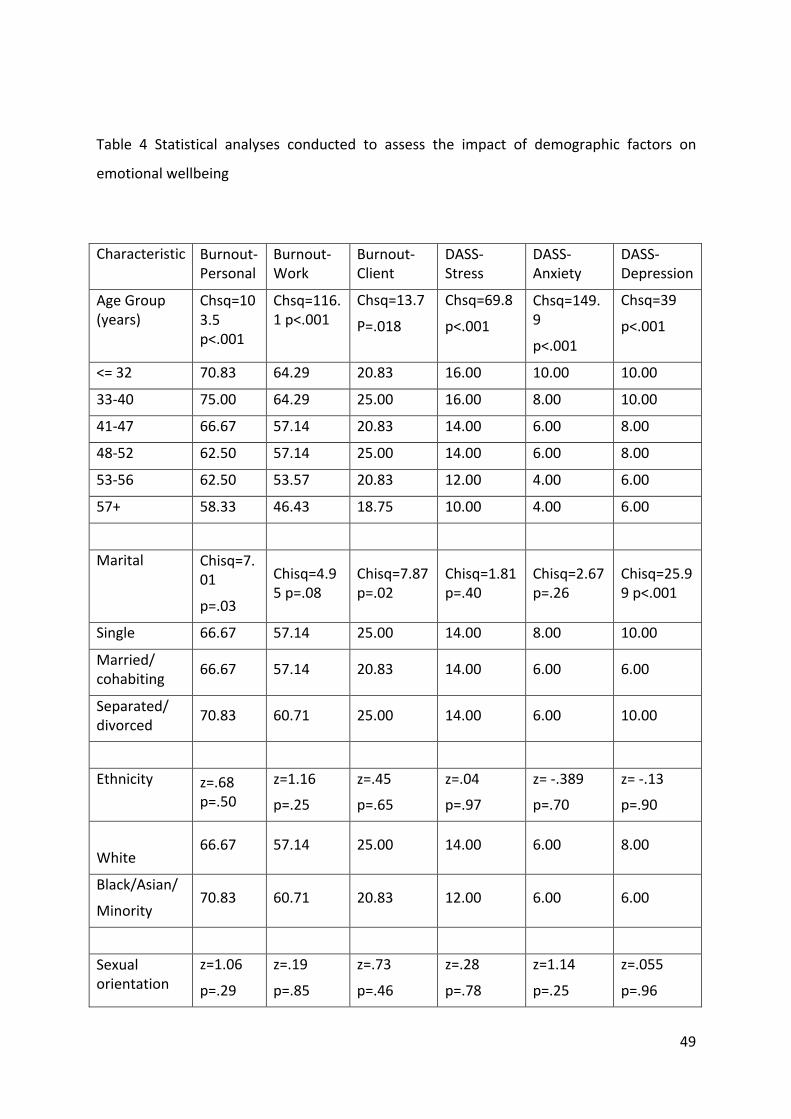
49
Table 4 Statistical analyses conducted to assess the impact of demographic factors on
emotionalwellbeing
Characteristic Burnout-Personal
Burnout-Work
Burnout-Client
DASS-Stress
DASS-Anxiety
DASS-Depression
AgeGroup(years)
Chsq=103.5p<.001
Chsq=116.1p<.001
Chsq=13.7
P=.018
Chsq=69.8
p<.001
Chsq=149.9
p<.001
Chsq=39
p<.001
<=32 70.83 64.29 20.83 16.00 10.00 10.00
33-40 75.00 64.29 25.00 16.00 8.00 10.00
41-47 66.67 57.14 20.83 14.00 6.00 8.00
48-52 62.50 57.14 25.00 14.00 6.00 8.00
53-56 62.50 53.57 20.83 12.00 4.00 6.00
57+ 58.33 46.43 18.75 10.00 4.00 6.00
Marital Chisq=7.01
p=.03
Chisq=4.95p=.08
Chisq=7.87p=.02
Chisq=1.81p=.40
Chisq=2.67p=.26
Chisq=25.99p<.001
Single 66.67 57.14 25.00 14.00 8.00 10.00
Married/cohabiting 66.67 57.14 20.83 14.00 6.00 6.00
Separated/divorced 70.83 60.71 25.00 14.00 6.00 10.00
Ethnicity z=.68p=.50
z=1.16
p=.25
z=.45
p=.65
z=.04
p=.97
z=-.389
p=.70
z=-.13
p=.90
White66.67 57.14 25.00 14.00 6.00 8.00
Black/Asian/
Minority70.83 60.71 20.83 12.00 6.00 6.00
Sexualorientation
z=1.06
p=.29
z=.19
p=.85
z=.73
p=.46
z=.28
p=.78
z=1.14
p=.25
z=.055
p=.96
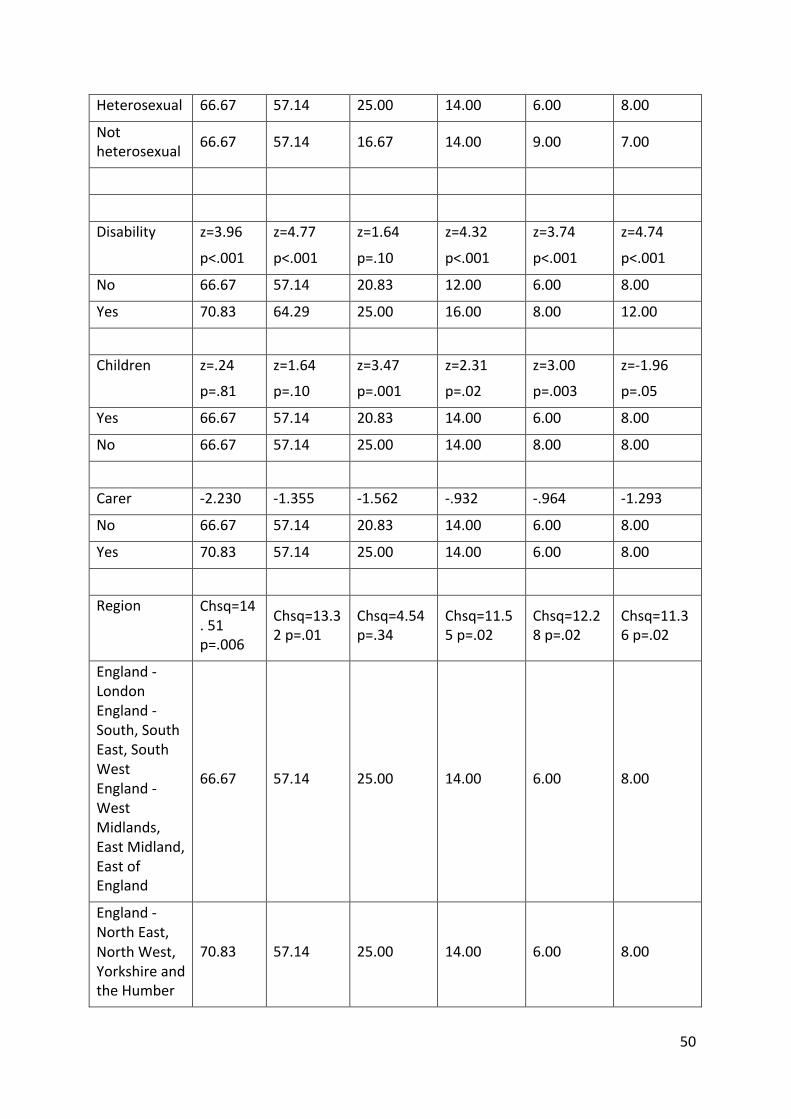
50
Heterosexual 66.67 57.14 25.00 14.00 6.00 8.00
Notheterosexual 66.67 57.14 16.67 14.00 9.00 7.00
Disability z=3.96
p<.001
z=4.77
p<.001
z=1.64
p=.10
z=4.32
p<.001
z=3.74
p<.001
z=4.74
p<.001
No 66.67 57.14 20.83 12.00 6.00 8.00
Yes 70.83 64.29 25.00 16.00 8.00 12.00
Children z=.24
p=.81
z=1.64
p=.10
z=3.47
p=.001
z=2.31
p=.02
z=3.00
p=.003
z=-1.96
p=.05
Yes 66.67 57.14 20.83 14.00 6.00 8.00
No 66.67 57.14 25.00 14.00 8.00 8.00
Carer -2.230 -1.355 -1.562 -.932 -.964 -1.293
No 66.67 57.14 20.83 14.00 6.00 8.00
Yes 70.83 57.14 25.00 14.00 6.00 8.00
Region Chsq=14.51p=.006
Chsq=13.32p=.01
Chsq=4.54p=.34
Chsq=11.55p=.02
Chsq=12.28p=.02
Chsq=11.36p=.02
England-LondonEngland-South,SouthEast,SouthWestEngland-WestMidlands,EastMidland,EastofEngland
66.67 57.14 25.00 14.00 6.00 8.00
England-NorthEast,NorthWest,YorkshireandtheHumber
70.83 57.14 25.00 14.00 6.00 8.00
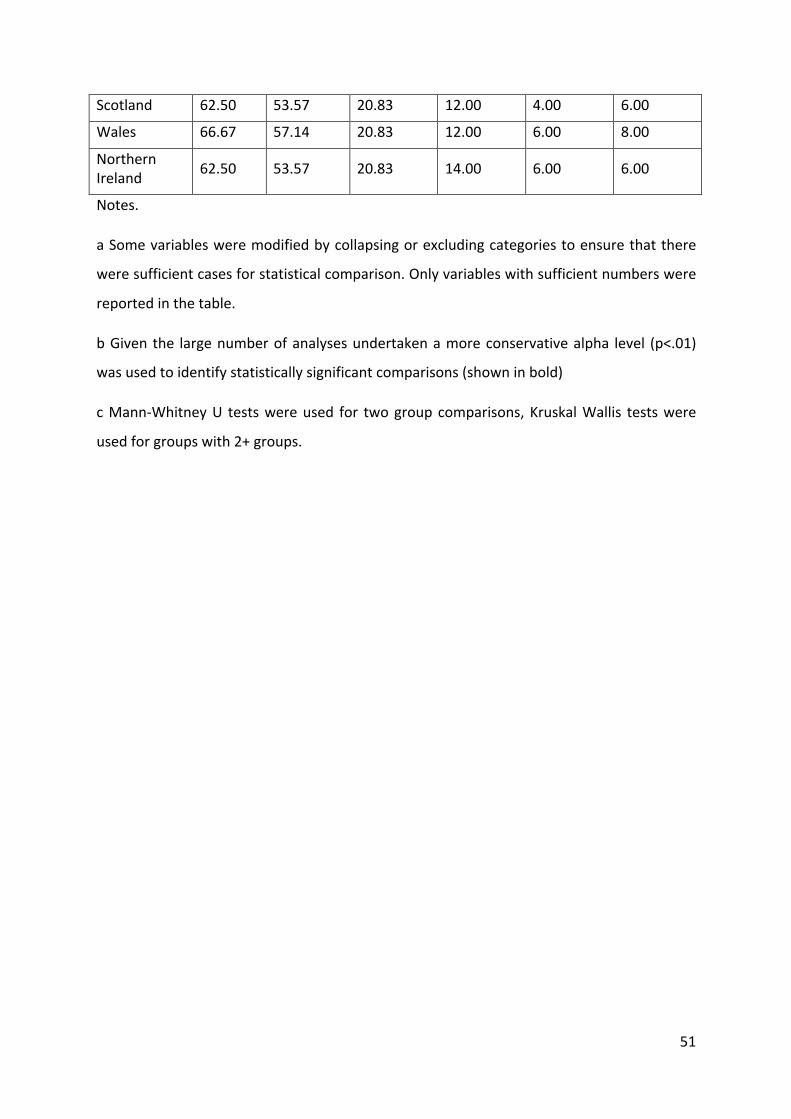
51
Scotland 62.50 53.57 20.83 12.00 4.00 6.00
Wales 66.67 57.14 20.83 12.00 6.00 8.00
NorthernIreland 62.50 53.57 20.83 14.00 6.00 6.00
Notes.
aSomevariablesweremodifiedbycollapsingorexcludingcategoriestoensurethatthere
weresufficientcasesforstatisticalcomparison.Onlyvariableswithsufficientnumberswere
reportedinthetable.
bGiventhe largenumberofanalysesundertakenamoreconservativealpha level (p<.01)
wasusedtoidentifystatisticallysignificantcomparisons(showninbold)
cMann-WhitneyU testswereused for twogroupcomparisons,KruskalWallis testswere
usedforgroupswith2+groups.
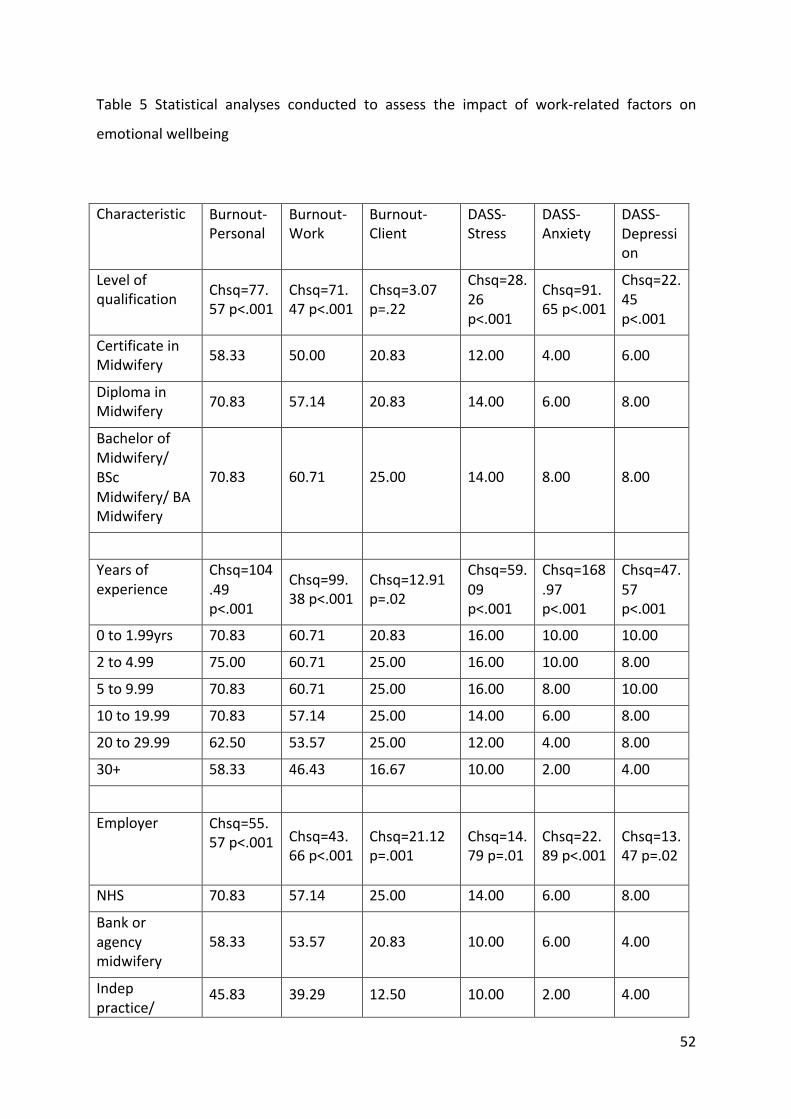
52
Table 5 Statistical analyses conducted to assess the impact of work-related factors on
emotionalwellbeing
Characteristic Burnout-Personal
Burnout-Work
Burnout-Client
DASS-Stress
DASS-Anxiety
DASS-Depression
Levelofqualification Chsq=77.
57p<.001Chsq=71.47p<.001
Chsq=3.07p=.22
Chsq=28.26p<.001
Chsq=91.65p<.001
Chsq=22.45p<.001
CertificateinMidwifery 58.33 50.00 20.83 12.00 4.00 6.00
DiplomainMidwifery 70.83 57.14 20.83 14.00 6.00 8.00
BachelorofMidwifery/BScMidwifery/BAMidwifery
70.83 60.71 25.00 14.00 8.00 8.00
Yearsofexperience
Chsq=104.49p<.001
Chsq=99.38p<.001
Chsq=12.91p=.02
Chsq=59.09p<.001
Chsq=168.97p<.001
Chsq=47.57p<.001
0to1.99yrs 70.83 60.71 20.83 16.00 10.00 10.00
2to4.99 75.00 60.71 25.00 16.00 10.00 8.00
5to9.99 70.83 60.71 25.00 16.00 8.00 10.00
10to19.99 70.83 57.14 25.00 14.00 6.00 8.00
20to29.99 62.50 53.57 25.00 12.00 4.00 8.00
30+ 58.33 46.43 16.67 10.00 2.00 4.00
Employer Chsq=55.57p<.001
Chsq=43.66p<.001
Chsq=21.12p=.001
Chsq=14.79p=.01
Chsq=22.89p<.001
Chsq=13.47p=.02
NHS 70.83 57.14 25.00 14.00 6.00 8.00
Bankoragencymidwifery
58.33 53.57 20.83 10.00 6.00 4.00
Indeppractice/
45.83 39.29 12.50 10.00 2.00 4.00
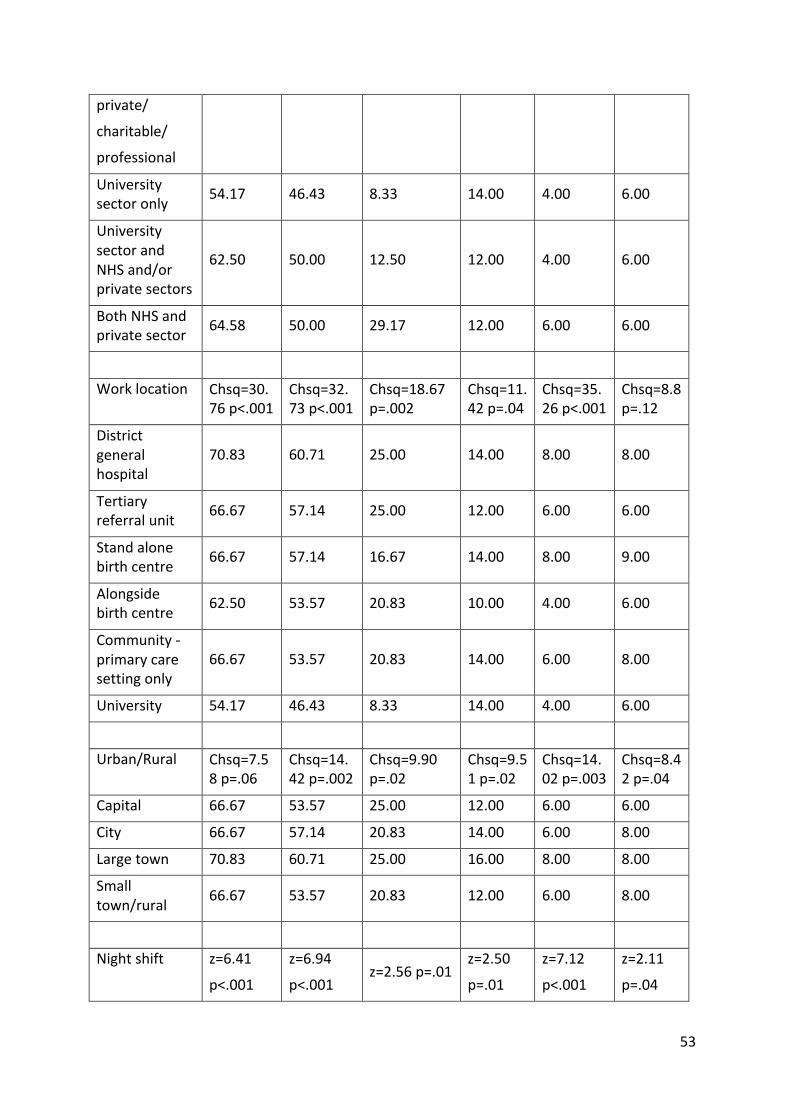
53
private/
charitable/
professional
Universitysectoronly 54.17 46.43 8.33 14.00 4.00 6.00
UniversitysectorandNHSand/orprivatesectors
62.50 50.00 12.50 12.00 4.00 6.00
BothNHSandprivatesector 64.58 50.00 29.17 12.00 6.00 6.00
Worklocation Chsq=30.76p<.001
Chsq=32.73p<.001
Chsq=18.67p=.002
Chsq=11.42p=.04
Chsq=35.26p<.001
Chsq=8.8p=.12
Districtgeneralhospital
70.83 60.71 25.00 14.00 8.00 8.00
Tertiaryreferralunit 66.67 57.14 25.00 12.00 6.00 6.00
Standalonebirthcentre 66.67 57.14 16.67 14.00 8.00 9.00
Alongsidebirthcentre 62.50 53.57 20.83 10.00 4.00 6.00
Community-primarycaresettingonly
66.67 53.57 20.83 14.00 6.00 8.00
University 54.17 46.43 8.33 14.00 4.00 6.00
Urban/Rural Chsq=7.58p=.06
Chsq=14.42p=.002
Chsq=9.90p=.02
Chsq=9.51p=.02
Chsq=14.02p=.003
Chsq=8.42p=.04
Capital 66.67 53.57 25.00 12.00 6.00 6.00
City 66.67 57.14 20.83 14.00 6.00 8.00
Largetown 70.83 60.71 25.00 16.00 8.00 8.00
Smalltown/rural 66.67 53.57 20.83 12.00 6.00 8.00
Nightshift z=6.41
p<.001
z=6.94
p<.001z=2.56p=.01
z=2.50
p=.01
z=7.12
p<.001
z=2.11
p=.04
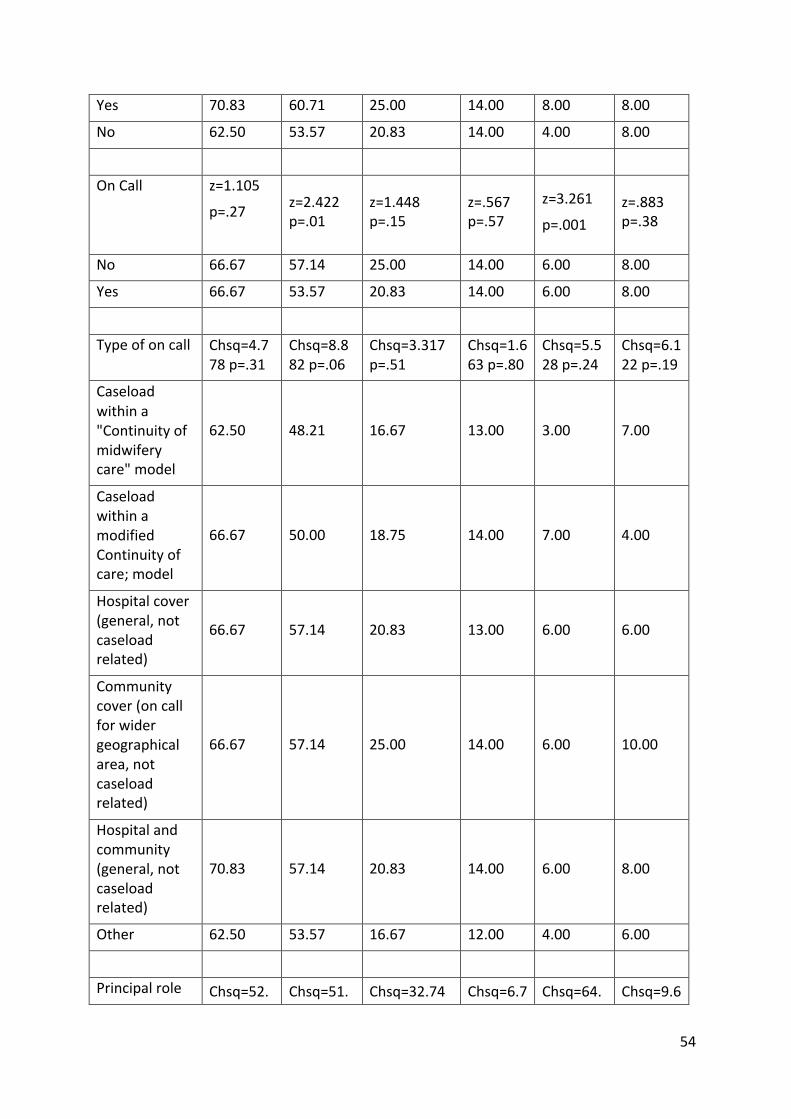
54
Yes 70.83 60.71 25.00 14.00 8.00 8.00
No 62.50 53.57 20.83 14.00 4.00 8.00
OnCall z=1.105
p=.27
z=2.422p=.01
z=1.448p=.15
z=.567p=.57
z=3.261
p=.001z=.883p=.38
No 66.67 57.14 25.00 14.00 6.00 8.00
Yes 66.67 53.57 20.83 14.00 6.00 8.00
Typeofoncall Chsq=4.778p=.31
Chsq=8.882p=.06
Chsq=3.317p=.51
Chsq=1.663p=.80
Chsq=5.528p=.24
Chsq=6.122p=.19
Caseloadwithina"Continuityofmidwiferycare"model
62.50 48.21 16.67 13.00 3.00 7.00
CaseloadwithinamodifiedContinuityofcare;model
66.67 50.00 18.75 14.00 7.00 4.00
Hospitalcover(general,notcaseloadrelated)
66.67 57.14 20.83 13.00 6.00 6.00
Communitycover(oncallforwidergeographicalarea,notcaseloadrelated)
66.67 57.14 25.00 14.00 6.00 10.00
Hospitalandcommunity(general,notcaseloadrelated)
70.83 57.14 20.83 14.00 6.00 8.00
Other 62.50 53.57 16.67 12.00 4.00 6.00
Principalrole Chsq=52. Chsq=51. Chsq=32.74 Chsq=6.7 Chsq=64. Chsq=9.6
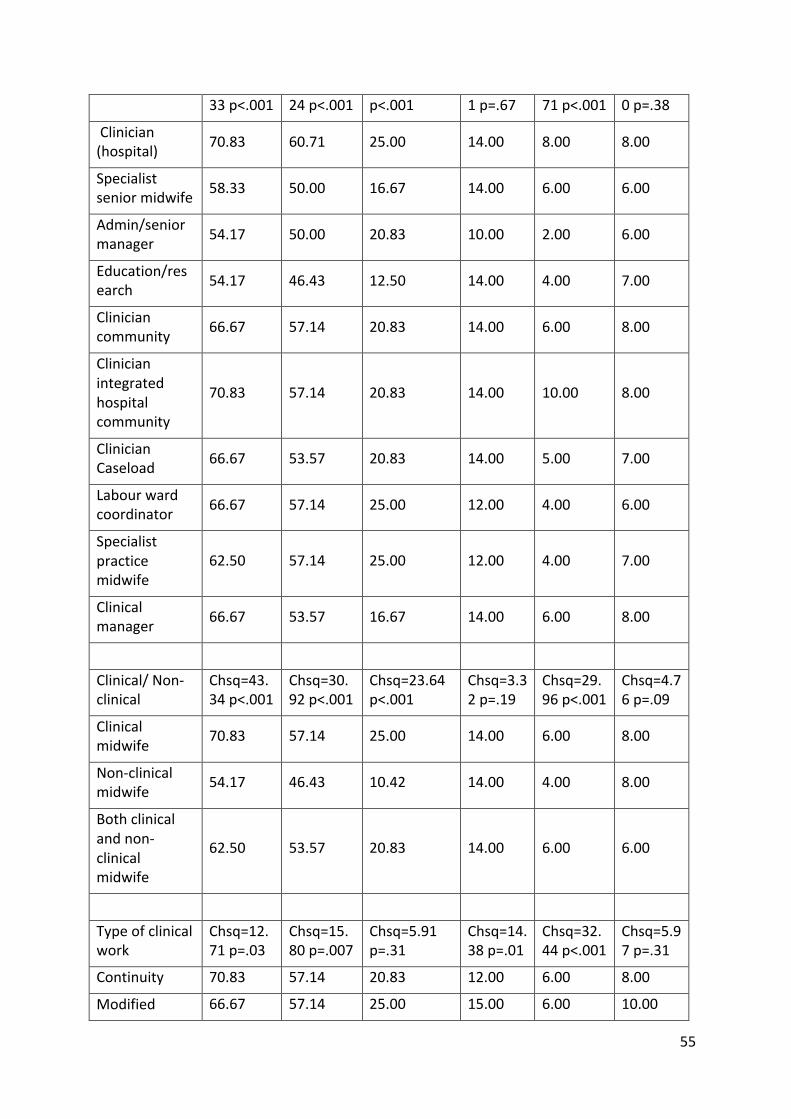
55
33p<.001 24p<.001 p<.001 1p=.67 71p<.001 0p=.38
Clinician(hospital) 70.83 60.71 25.00 14.00 8.00 8.00
Specialistseniormidwife 58.33 50.00 16.67 14.00 6.00 6.00
Admin/seniormanager 54.17 50.00 20.83 10.00 2.00 6.00
Education/research 54.17 46.43 12.50 14.00 4.00 7.00
Cliniciancommunity 66.67 57.14 20.83 14.00 6.00 8.00
Clinicianintegratedhospitalcommunity
70.83 57.14 20.83 14.00 10.00 8.00
ClinicianCaseload 66.67 53.57 20.83 14.00 5.00 7.00
Labourwardcoordinator 66.67 57.14 25.00 12.00 4.00 6.00
Specialistpracticemidwife
62.50 57.14 25.00 12.00 4.00 7.00
Clinicalmanager 66.67 53.57 16.67 14.00 6.00 8.00
Clinical/Non-clinical
Chsq=43.34p<.001
Chsq=30.92p<.001
Chsq=23.64p<.001
Chsq=3.32p=.19
Chsq=29.96p<.001
Chsq=4.76p=.09
Clinicalmidwife 70.83 57.14 25.00 14.00 6.00 8.00
Non-clinicalmidwife 54.17 46.43 10.42 14.00 4.00 8.00
Bothclinicalandnon-clinicalmidwife
62.50 53.57 20.83 14.00 6.00 6.00
Typeofclinicalwork
Chsq=12.71p=.03
Chsq=15.80p=.007
Chsq=5.91p=.31
Chsq=14.38p=.01
Chsq=32.44p<.001
Chsq=5.97p=.31
Continuity 70.83 57.14 20.83 12.00 6.00 8.00
Modified 66.67 57.14 25.00 15.00 6.00 10.00
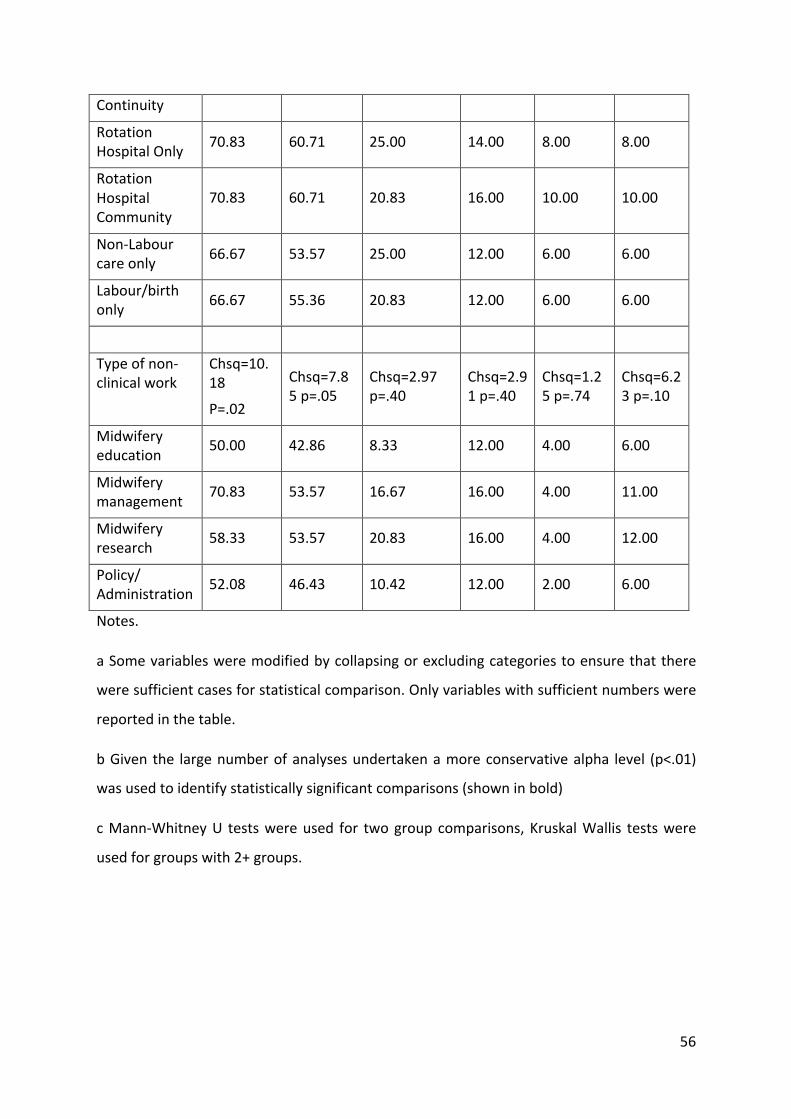
56
Continuity
RotationHospitalOnly 70.83 60.71 25.00 14.00 8.00 8.00
RotationHospitalCommunity
70.83 60.71 20.83 16.00 10.00 10.00
Non-Labourcareonly 66.67 53.57 25.00 12.00 6.00 6.00
Labour/birthonly 66.67 55.36 20.83 12.00 6.00 6.00
Typeofnon-clinicalwork
Chsq=10.18
P=.02
Chsq=7.85p=.05
Chsq=2.97p=.40
Chsq=2.91p=.40
Chsq=1.25p=.74
Chsq=6.23p=.10
Midwiferyeducation 50.00 42.86 8.33 12.00 4.00 6.00
Midwiferymanagement 70.83 53.57 16.67 16.00 4.00 11.00
Midwiferyresearch 58.33 53.57 20.83 16.00 4.00 12.00
Policy/Administration 52.08 46.43 10.42 12.00 2.00 6.00
Notes.
aSomevariablesweremodifiedbycollapsingorexcludingcategoriestoensurethatthere
weresufficientcasesforstatisticalcomparison.Onlyvariableswithsufficientnumberswere
reportedinthetable.
bGiventhe largenumberofanalysesundertakenamoreconservativealpha level (p<.01)
wasusedtoidentifystatisticallysignificantcomparisons(showninbold)
cMann-WhitneyU testswereused for twogroupcomparisons,KruskalWallis testswere
usedforgroupswith2+groups.
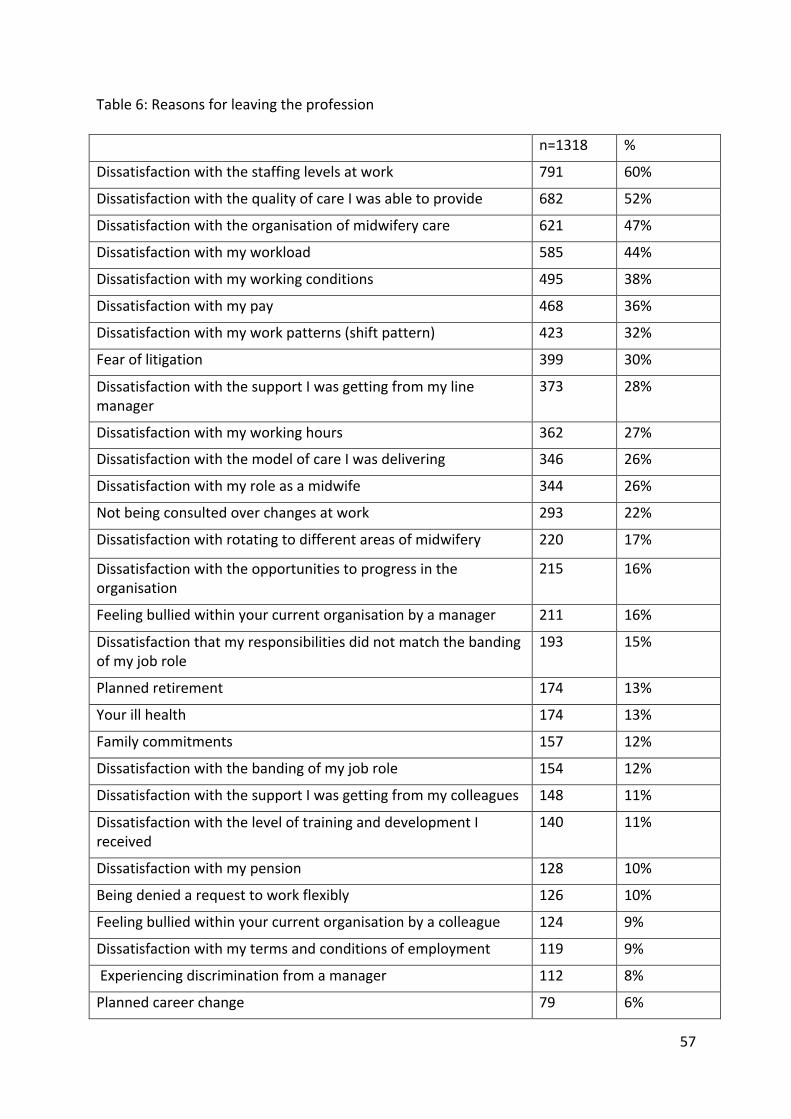
57
Table6:Reasonsforleavingtheprofession
n=1318 %
Dissatisfactionwiththestaffinglevelsatwork 791 60%
DissatisfactionwiththequalityofcareIwasabletoprovide 682 52%
Dissatisfactionwiththeorganisationofmidwiferycare 621 47%
Dissatisfactionwithmyworkload 585 44%
Dissatisfactionwithmyworkingconditions 495 38%
Dissatisfactionwithmypay 468 36%
Dissatisfactionwithmyworkpatterns(shiftpattern) 423 32%
Fearoflitigation 399 30%
DissatisfactionwiththesupportIwasgettingfrommylinemanager
373 28%
Dissatisfactionwithmyworkinghours 362 27%
DissatisfactionwiththemodelofcareIwasdelivering 346 26%
Dissatisfactionwithmyroleasamidwife 344 26%
Notbeingconsultedoverchangesatwork 293 22%
Dissatisfactionwithrotatingtodifferentareasofmidwifery 220 17%
Dissatisfactionwiththeopportunitiestoprogressintheorganisation
215 16%
Feelingbulliedwithinyourcurrentorganisationbyamanager 211 16%
Dissatisfactionthatmyresponsibilitiesdidnotmatchthebandingofmyjobrole
193 15%
Plannedretirement 174 13%
Yourillhealth 174 13%
Familycommitments 157 12%
Dissatisfactionwiththebandingofmyjobrole 154 12%
DissatisfactionwiththesupportIwasgettingfrommycolleagues 148 11%
DissatisfactionwiththeleveloftraininganddevelopmentIreceived
140 11%
Dissatisfactionwithmypension 128 10%
Beingdeniedarequesttoworkflexibly 126 10%
Feelingbulliedwithinyourcurrentorganisationbyacolleague 124 9%
Dissatisfactionwithmytermsandconditionsofemployment 119 9%
Experiencingdiscriminationfromamanager 112 8%
Plannedcareerchange 79 6%
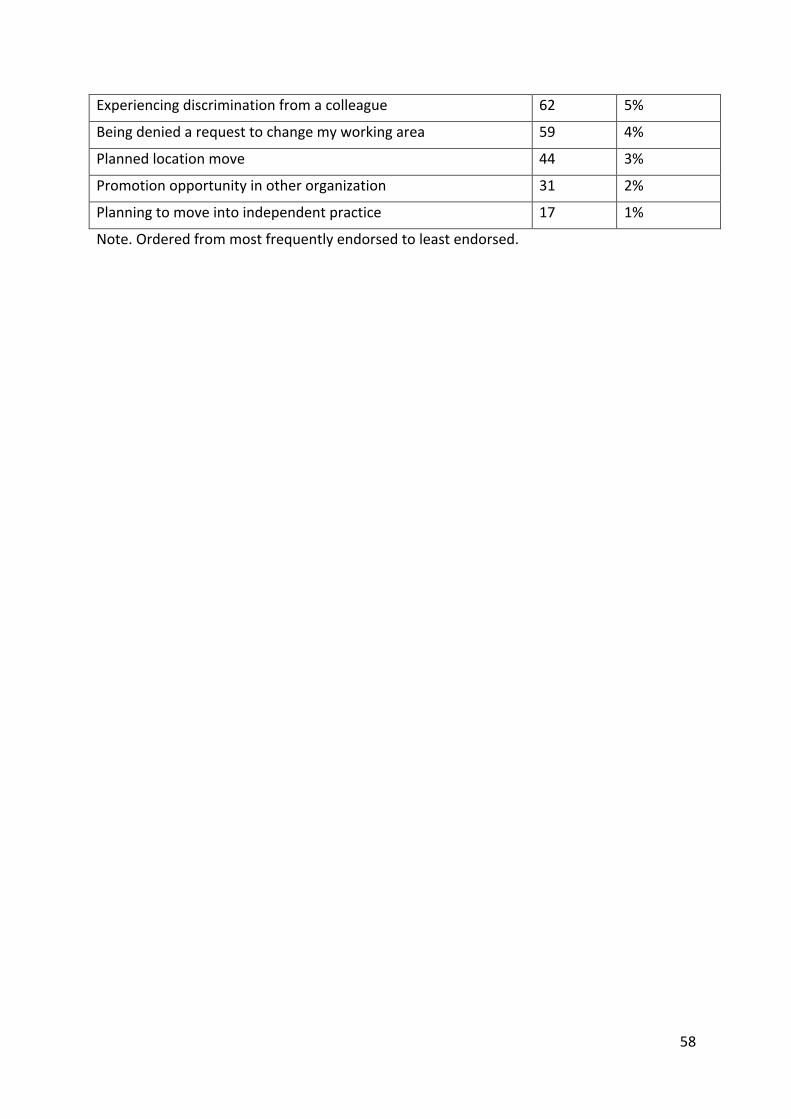
58
Experiencingdiscriminationfromacolleague 62 5%
Beingdeniedarequesttochangemyworkingarea 59 4%
Plannedlocationmove 44 3%
Promotionopportunityinotherorganization 31 2%
Planningtomoveintoindependentpractice 17 1%
Note.Orderedfrommostfrequentlyendorsedtoleastendorsed.
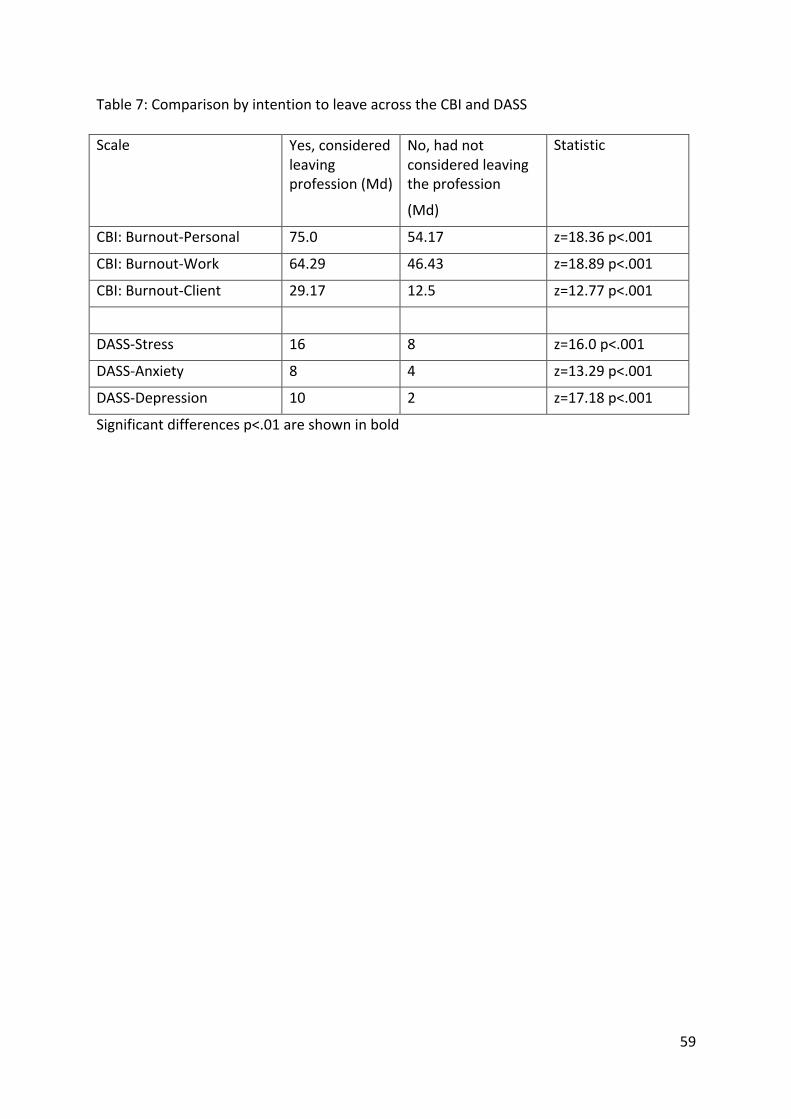
59
Table7:ComparisonbyintentiontoleaveacrosstheCBIandDASS
Scale Yes,consideredleavingprofession(Md)
No,hadnotconsideredleavingtheprofession
(Md)
Statistic
CBI:Burnout-Personal 75.0 54.17 z=18.36p<.001
CBI:Burnout-Work 64.29 46.43 z=18.89p<.001
CBI:Burnout-Client 29.17 12.5 z=12.77p<.001
DASS-Stress 16 8 z=16.0p<.001
DASS-Anxiety 8 4 z=13.29p<.001
DASS-Depression 10 2 z=17.18p<.001
Significantdifferencesp<.01areshowninbold
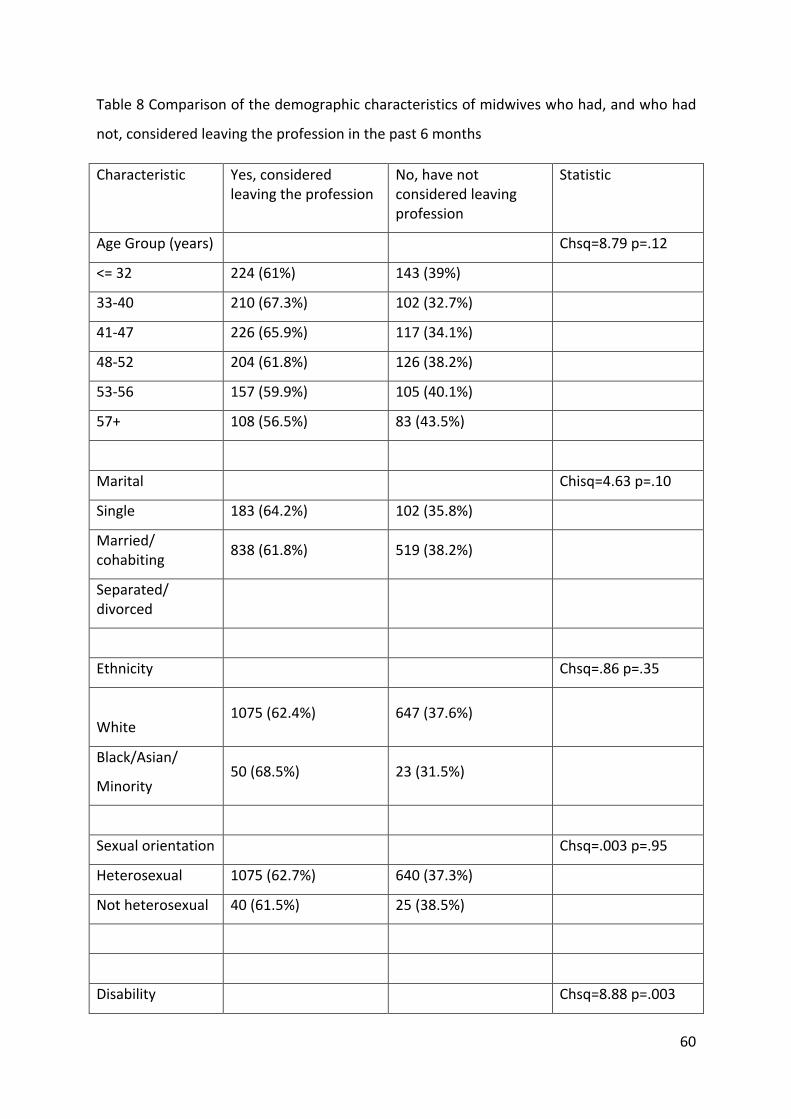
60
Table8Comparisonofthedemographiccharacteristicsofmidwiveswhohad,andwhohad
not,consideredleavingtheprofessioninthepast6months
Characteristic Yes,consideredleavingtheprofession
No,havenotconsideredleavingprofession
Statistic
AgeGroup(years) Chsq=8.79p=.12
<=32 224(61%) 143(39%)
33-40 210(67.3%) 102(32.7%)
41-47 226(65.9%) 117(34.1%)
48-52 204(61.8%) 126(38.2%)
53-56 157(59.9%) 105(40.1%)
57+ 108(56.5%) 83(43.5%)
Marital Chisq=4.63p=.10
Single 183(64.2%) 102(35.8%)
Married/cohabiting 838(61.8%) 519(38.2%)
Separated/divorced
Ethnicity Chsq=.86p=.35
White1075(62.4%) 647(37.6%)
Black/Asian/
Minority50(68.5%) 23(31.5%)
Sexualorientation Chsq=.003p=.95
Heterosexual 1075(62.7%) 640(37.3%)
Notheterosexual 40(61.5%) 25(38.5%)
Disability Chsq=8.88p=.003
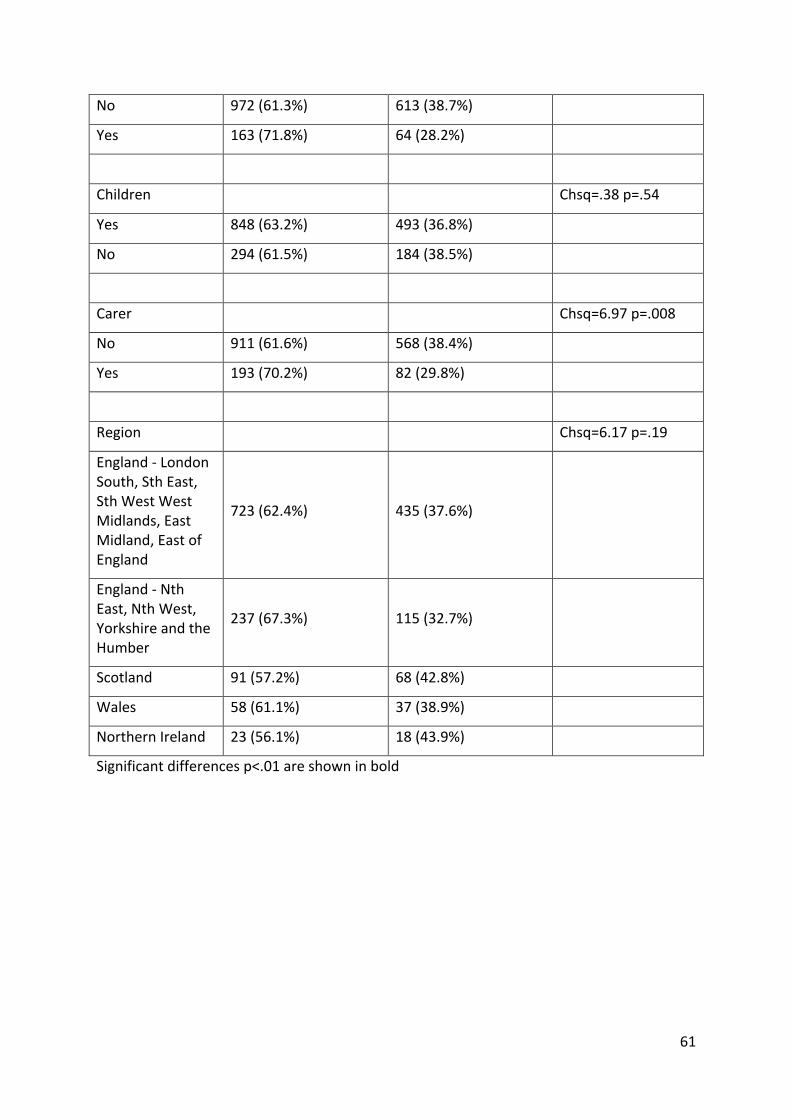
61
No 972(61.3%) 613(38.7%)
Yes 163(71.8%) 64(28.2%)
Children Chsq=.38p=.54
Yes 848(63.2%) 493(36.8%)
No 294(61.5%) 184(38.5%)
Carer Chsq=6.97p=.008
No 911(61.6%) 568(38.4%)
Yes 193(70.2%) 82(29.8%)
Region Chsq=6.17p=.19
England-LondonSouth,SthEast,SthWestWestMidlands,EastMidland,EastofEngland
723(62.4%) 435(37.6%)
England-NthEast,NthWest,YorkshireandtheHumber
237(67.3%) 115(32.7%)
Scotland 91(57.2%) 68(42.8%)
Wales 58(61.1%) 37(38.9%)
NorthernIreland 23(56.1%) 18(43.9%)
Significantdifferencesp<.01areshowninbold
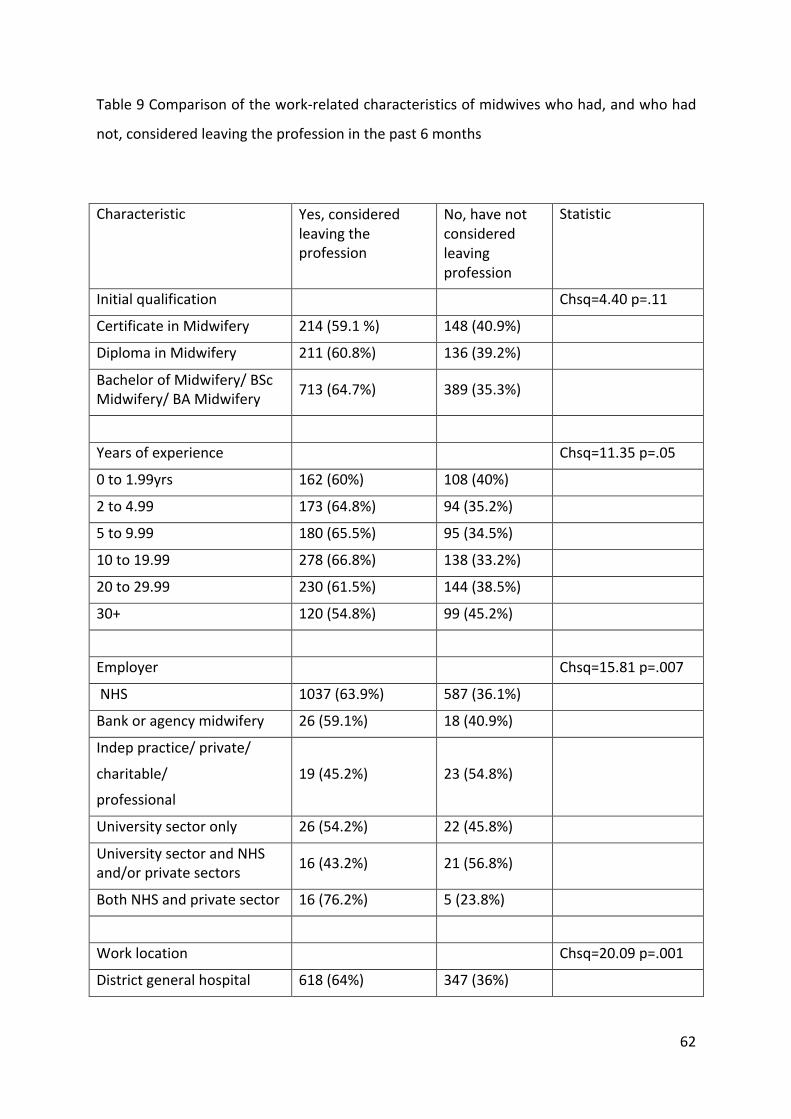
62
Table9Comparisonofthework-relatedcharacteristicsofmidwiveswhohad,andwhohad
not,consideredleavingtheprofessioninthepast6months
Characteristic Yes,consideredleavingtheprofession
No,havenotconsideredleavingprofession
Statistic
Initialqualification Chsq=4.40p=.11
CertificateinMidwifery 214(59.1%) 148(40.9%)
DiplomainMidwifery 211(60.8%) 136(39.2%)
BachelorofMidwifery/BScMidwifery/BAMidwifery 713(64.7%) 389(35.3%)
Yearsofexperience Chsq=11.35p=.05
0to1.99yrs 162(60%) 108(40%)
2to4.99 173(64.8%) 94(35.2%)
5to9.99 180(65.5%) 95(34.5%)
10to19.99 278(66.8%) 138(33.2%)
20to29.99 230(61.5%) 144(38.5%)
30+ 120(54.8%) 99(45.2%)
Employer Chsq=15.81p=.007
NHS 1037(63.9%) 587(36.1%)
Bankoragencymidwifery 26(59.1%) 18(40.9%)
Indeppractice/private/
charitable/
professional
19(45.2%) 23(54.8%)
Universitysectoronly 26(54.2%) 22(45.8%)
UniversitysectorandNHSand/orprivatesectors 16(43.2%) 21(56.8%)
BothNHSandprivatesector 16(76.2%) 5(23.8%)
Worklocation Chsq=20.09p=.001
Districtgeneralhospital 618(64%) 347(36%)
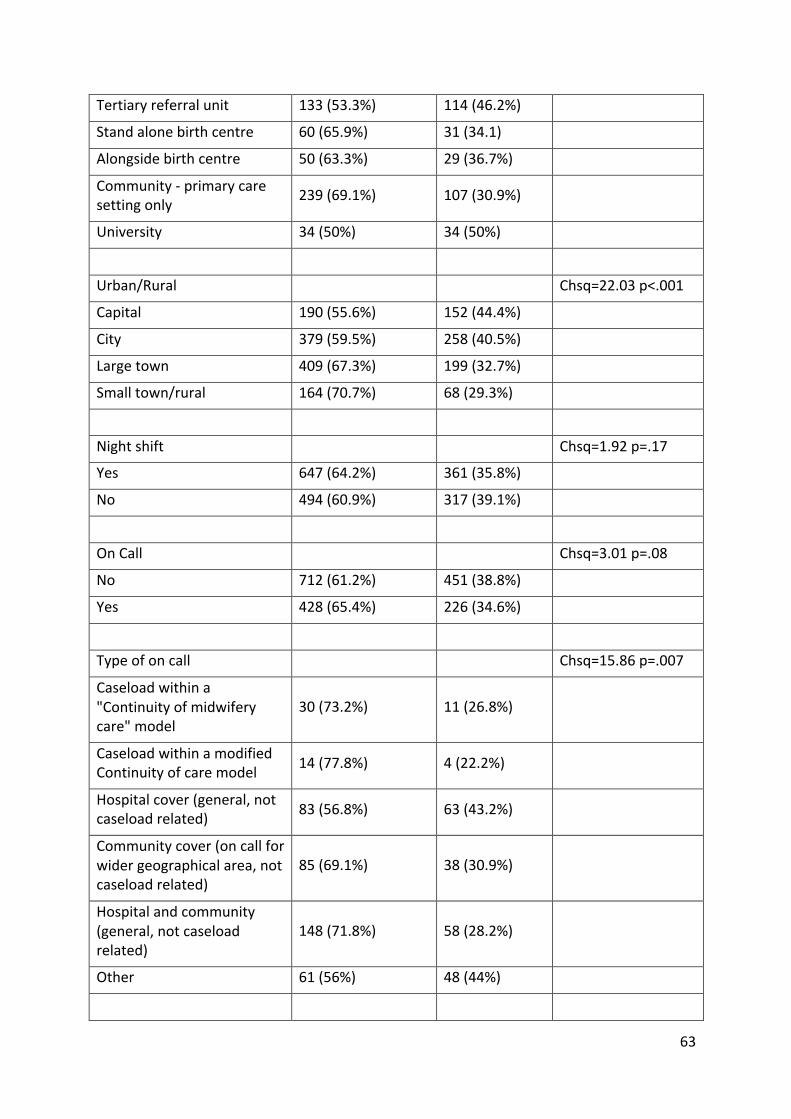
63
Tertiaryreferralunit 133(53.3%) 114(46.2%)
Standalonebirthcentre 60(65.9%) 31(34.1)
Alongsidebirthcentre 50(63.3%) 29(36.7%)
Community-primarycaresettingonly 239(69.1%) 107(30.9%)
University 34(50%) 34(50%)
Urban/Rural Chsq=22.03p<.001
Capital 190(55.6%) 152(44.4%)
City 379(59.5%) 258(40.5%)
Largetown 409(67.3%) 199(32.7%)
Smalltown/rural 164(70.7%) 68(29.3%)
Nightshift Chsq=1.92p=.17
Yes 647(64.2%) 361(35.8%)
No 494(60.9%) 317(39.1%)
OnCall Chsq=3.01p=.08
No 712(61.2%) 451(38.8%)
Yes 428(65.4%) 226(34.6%)
Typeofoncall Chsq=15.86p=.007
Caseloadwithina"Continuityofmidwiferycare"model
30(73.2%) 11(26.8%)
CaseloadwithinamodifiedContinuityofcaremodel 14(77.8%) 4(22.2%)
Hospitalcover(general,notcaseloadrelated) 83(56.8%) 63(43.2%)
Communitycover(oncallforwidergeographicalarea,notcaseloadrelated)
85(69.1%) 38(30.9%)
Hospitalandcommunity(general,notcaseloadrelated)
148(71.8%) 58(28.2%)
Other 61(56%) 48(44%)
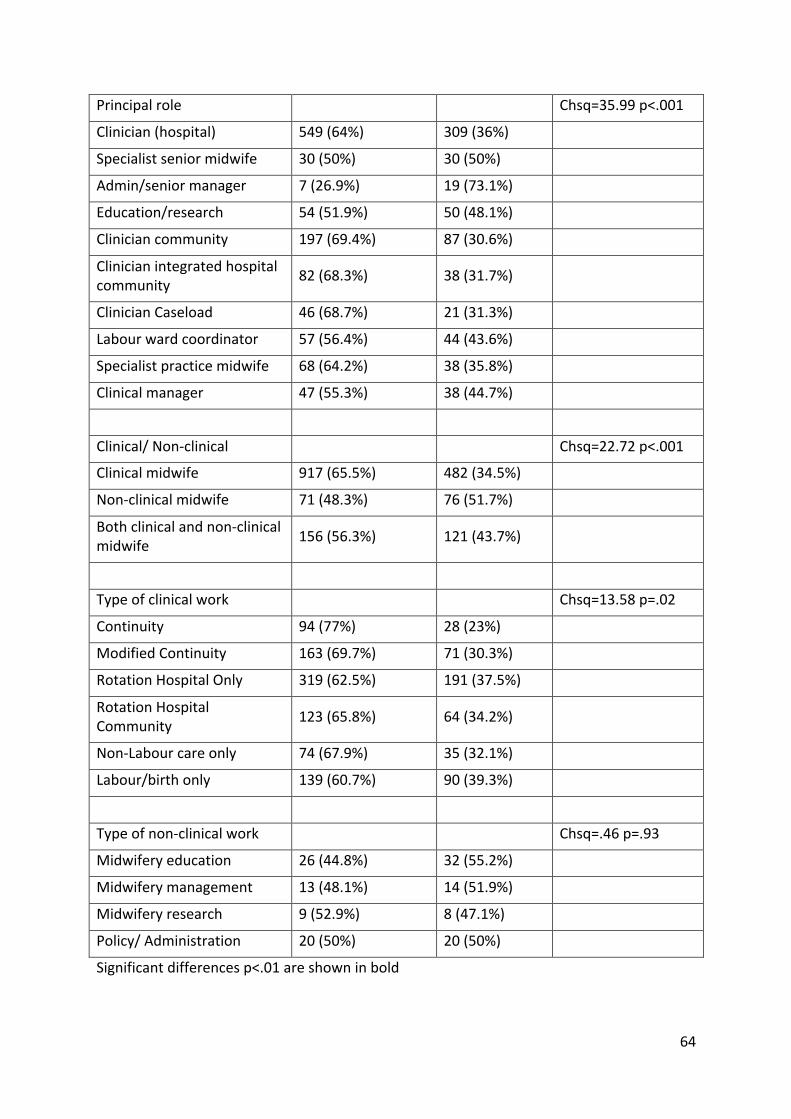
64
Principalrole Chsq=35.99p<.001
Clinician(hospital) 549(64%) 309(36%)
Specialistseniormidwife 30(50%) 30(50%)
Admin/seniormanager 7(26.9%) 19(73.1%)
Education/research 54(51.9%) 50(48.1%)
Cliniciancommunity 197(69.4%) 87(30.6%)
Clinicianintegratedhospitalcommunity 82(68.3%) 38(31.7%)
ClinicianCaseload 46(68.7%) 21(31.3%)
Labourwardcoordinator 57(56.4%) 44(43.6%)
Specialistpracticemidwife 68(64.2%) 38(35.8%)
Clinicalmanager 47(55.3%) 38(44.7%)
Clinical/Non-clinical Chsq=22.72p<.001
Clinicalmidwife 917(65.5%) 482(34.5%)
Non-clinicalmidwife 71(48.3%) 76(51.7%)
Bothclinicalandnon-clinicalmidwife 156(56.3%) 121(43.7%)
Typeofclinicalwork Chsq=13.58p=.02
Continuity 94(77%) 28(23%)
ModifiedContinuity 163(69.7%) 71(30.3%)
RotationHospitalOnly 319(62.5%) 191(37.5%)
RotationHospitalCommunity 123(65.8%) 64(34.2%)
Non-Labourcareonly 74(67.9%) 35(32.1%)
Labour/birthonly 139(60.7%) 90(39.3%)
Typeofnon-clinicalwork Chsq=.46p=.93
Midwiferyeducation 26(44.8%) 32(55.2%)
Midwiferymanagement 13(48.1%) 14(51.9%)
Midwiferyresearch 9(52.9%) 8(47.1%)
Policy/Administration 20(50%) 20(50%)
Significantdifferencesp<.01areshowninbold

65
Table10Satisfactionwithrelationships,worklifebalanceandamountoftimeoff
Notsatisfied
Lowsatisfaction
Moderatesatisfaction
Highsatisfaction
Satisfactionwithrelationshipwith:
Hospitalmidwiferycolleagues 50(2.6%) 133(7.0%) 779(40.8%) 945(49.6%)
Communitymidwiferycolleagues
32(1.9%) 131(7.7%) 729(42.7%) 816(47.8%)
Midwiferymanagers 280(14.6%) 573(30%) 793(41.5%) 266(13.9%)
Obstetricians 73(4.0%) 291(16%) 987(54.1%) 473(25.9%)
Generalpractitioners 138(10.9%) 387(30.5%) 576(45.5%) 166(13.1%)
Paediatricians 75(4.4%) 259(15.2%) 968(56.8%) 401(23.5%)
Neonatalintensivecareunit/specialcarestaff
65(4%) 237(14.4%) 873(53.1%) 468(28.5%)
Hospitalnursingcolleagues 52(5.5%) 127(13.4%) 456(48%) 315(33.2%)
Worklifebalance 352(18.3%) 575(29.9%) 767(39.8%) 232(12%)
Amountoftimeoff 134(7%) 336(17.5%) 1034(53.7%)
421(21.9%)
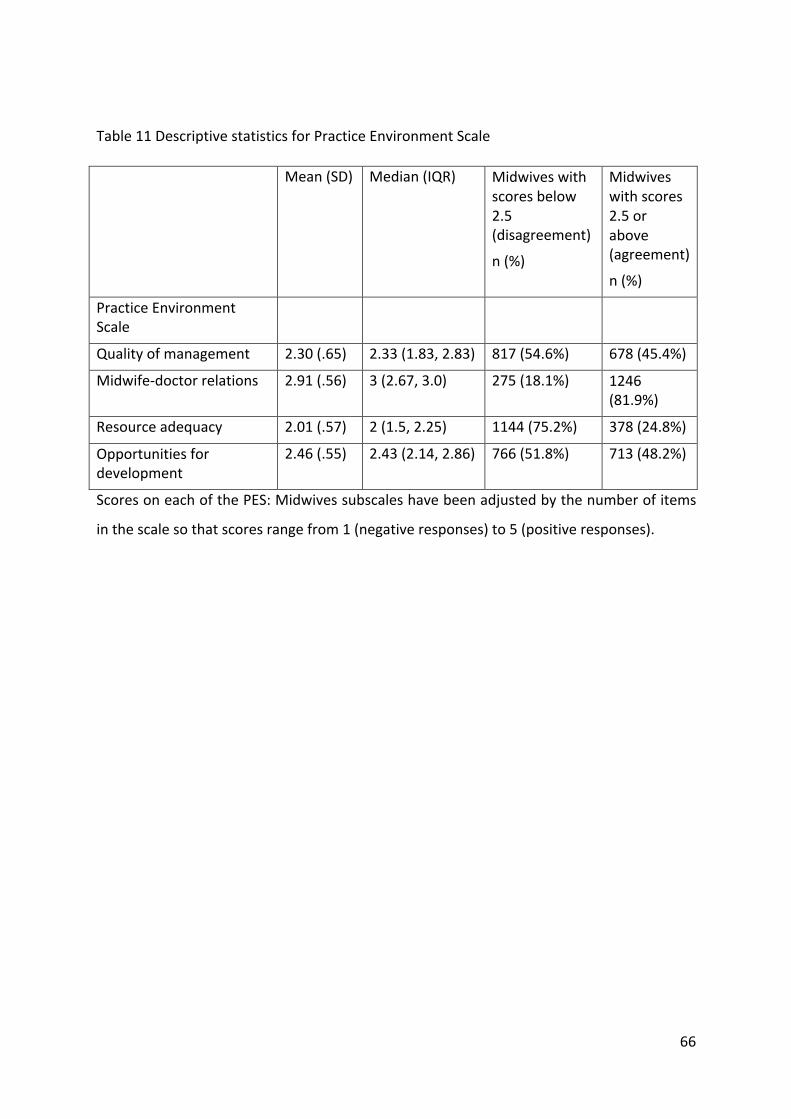
66
Table11DescriptivestatisticsforPracticeEnvironmentScale
Mean(SD) Median(IQR) Midwiveswithscoresbelow2.5(disagreement)
n(%)
Midwiveswithscores2.5orabove(agreement)
n(%)
PracticeEnvironmentScale
Qualityofmanagement 2.30(.65) 2.33(1.83,2.83) 817(54.6%) 678(45.4%)
Midwife-doctorrelations 2.91(.56) 3(2.67,3.0) 275(18.1%) 1246(81.9%)
Resourceadequacy 2.01(.57) 2(1.5,2.25) 1144(75.2%) 378(24.8%)
Opportunitiesfordevelopment
2.46(.55) 2.43(2.14,2.86) 766(51.8%) 713(48.2%)
ScoresoneachofthePES:Midwivessubscaleshavebeenadjustedbythenumberofitems
inthescalesothatscoresrangefrom1(negativeresponses)to5(positiveresponses).
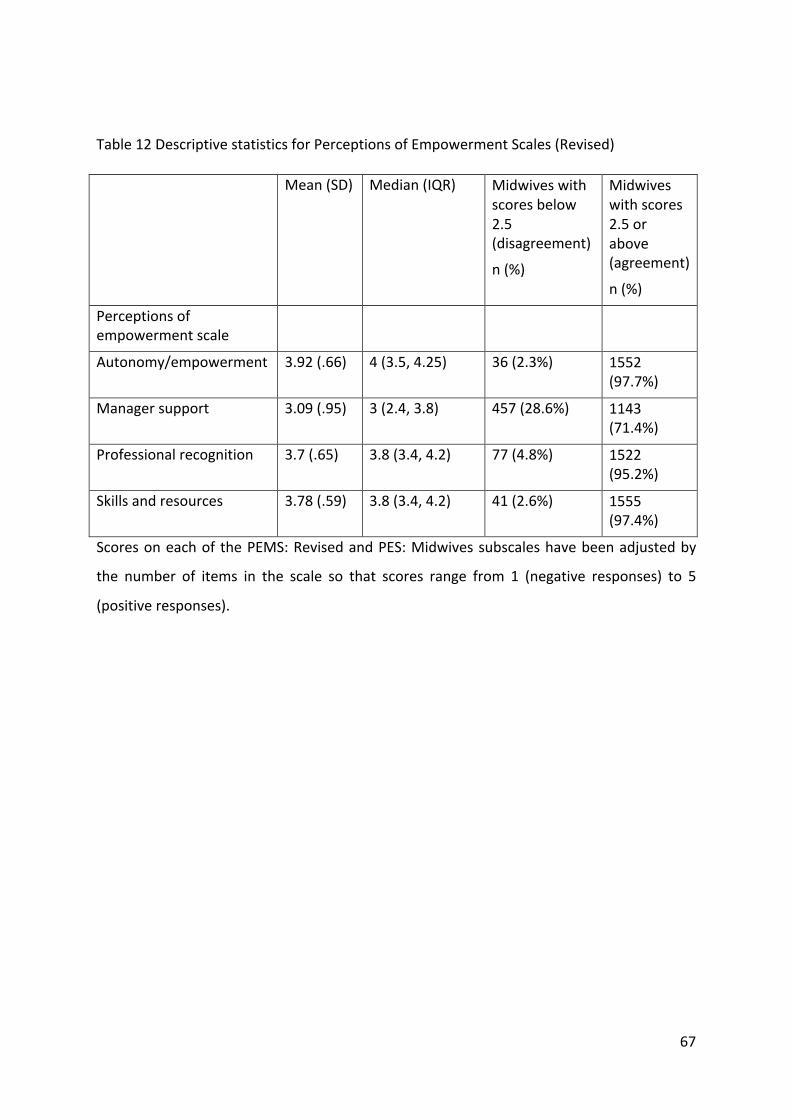
67
Table12DescriptivestatisticsforPerceptionsofEmpowermentScales(Revised)
Mean(SD) Median(IQR) Midwiveswithscoresbelow2.5(disagreement)
n(%)
Midwiveswithscores2.5orabove(agreement)
n(%)
Perceptionsofempowermentscale
Autonomy/empowerment 3.92(.66) 4(3.5,4.25) 36(2.3%) 1552(97.7%)
Managersupport 3.09(.95) 3(2.4,3.8) 457(28.6%) 1143(71.4%)
Professionalrecognition 3.7(.65) 3.8(3.4,4.2) 77(4.8%) 1522(95.2%)
Skillsandresources 3.78(.59) 3.8(3.4,4.2) 41(2.6%) 1555(97.4%)
Scoresoneachof thePEMS:RevisedandPES:Midwivessubscaleshavebeenadjustedby
the number of items in the scale so that scores range from 1 (negative responses) to 5
(positiveresponses).
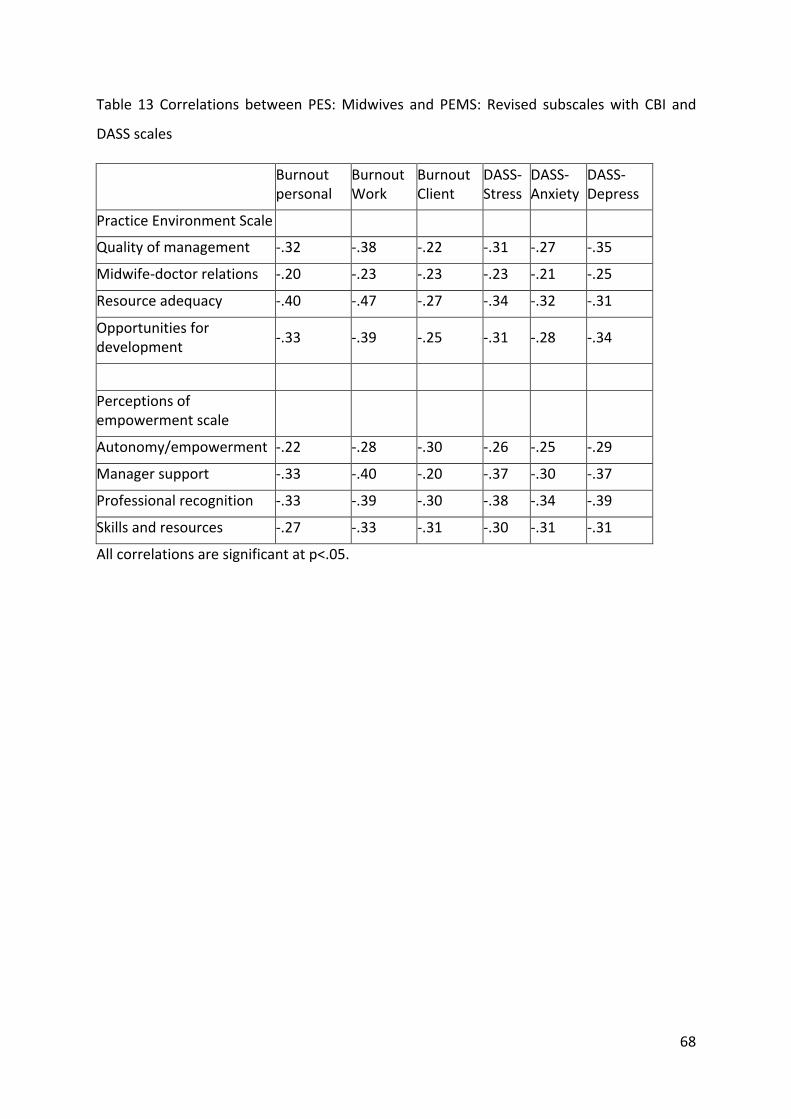
68
Table 13 Correlations between PES:Midwives and PEMS: Revised subscaleswith CBI and
DASSscales
Burnoutpersonal
BurnoutWork
BurnoutClient
DASS-Stress
DASS-Anxiety
DASS-Depress
PracticeEnvironmentScale
Qualityofmanagement -.32 -.38 -.22 -.31 -.27 -.35
Midwife-doctorrelations -.20 -.23 -.23 -.23 -.21 -.25
Resourceadequacy -.40 -.47 -.27 -.34 -.32 -.31
Opportunitiesfordevelopment -.33 -.39 -.25 -.31 -.28 -.34
Perceptionsofempowermentscale
Autonomy/empowerment -.22 -.28 -.30 -.26 -.25 -.29
Managersupport -.33 -.40 -.20 -.37 -.30 -.37
Professionalrecognition -.33 -.39 -.30 -.38 -.34 -.39
Skillsandresources -.27 -.33 -.31 -.30 -.31 -.31
Allcorrelationsaresignificantatp<.05.
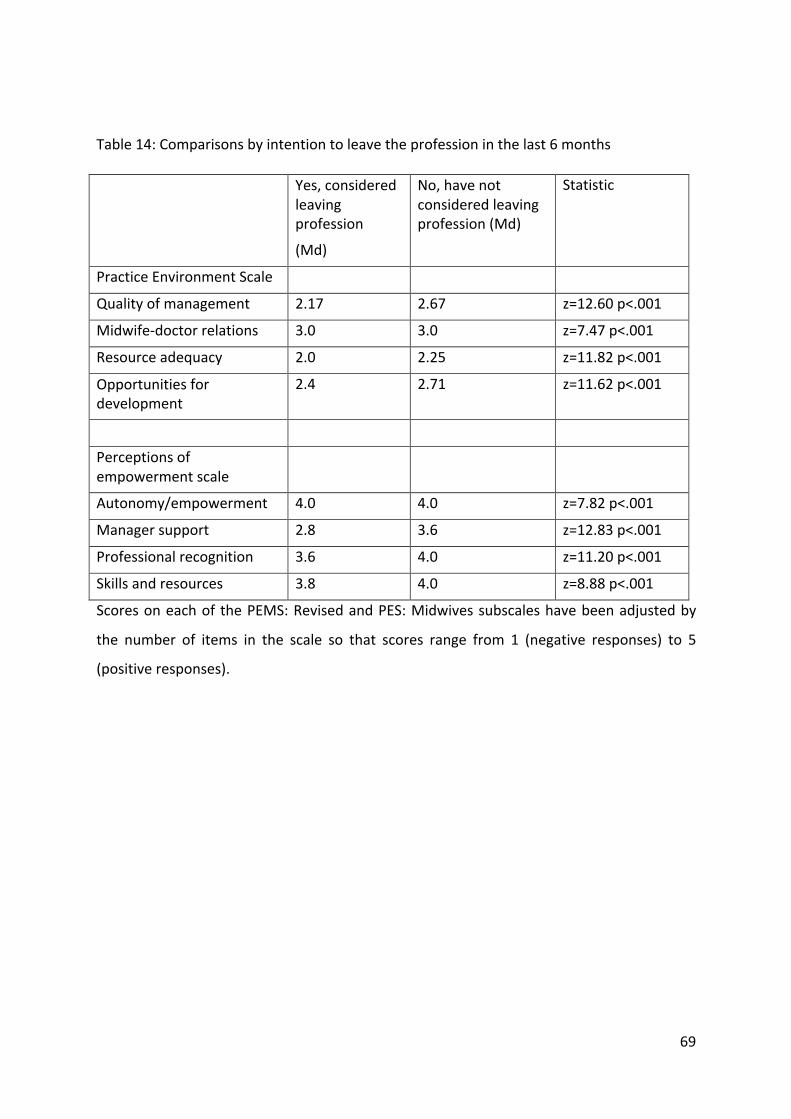
69
Table14:Comparisonsbyintentiontoleavetheprofessioninthelast6months
Yes,consideredleavingprofession
(Md)
No,havenotconsideredleavingprofession(Md)
Statistic
PracticeEnvironmentScale
Qualityofmanagement 2.17 2.67 z=12.60p<.001
Midwife-doctorrelations 3.0 3.0 z=7.47p<.001
Resourceadequacy 2.0 2.25 z=11.82p<.001
Opportunitiesfordevelopment
2.4 2.71 z=11.62p<.001
Perceptionsofempowermentscale
Autonomy/empowerment 4.0 4.0 z=7.82p<.001
Managersupport 2.8 3.6 z=12.83p<.001
Professionalrecognition 3.6 4.0 z=11.20p<.001
Skillsandresources 3.8 4.0 z=8.88p<.001
Scoresoneachof thePEMS:RevisedandPES:Midwivessubscaleshavebeenadjustedby
the number of items in the scale so that scores range from 1 (negative responses) to 5
(positiveresponses).
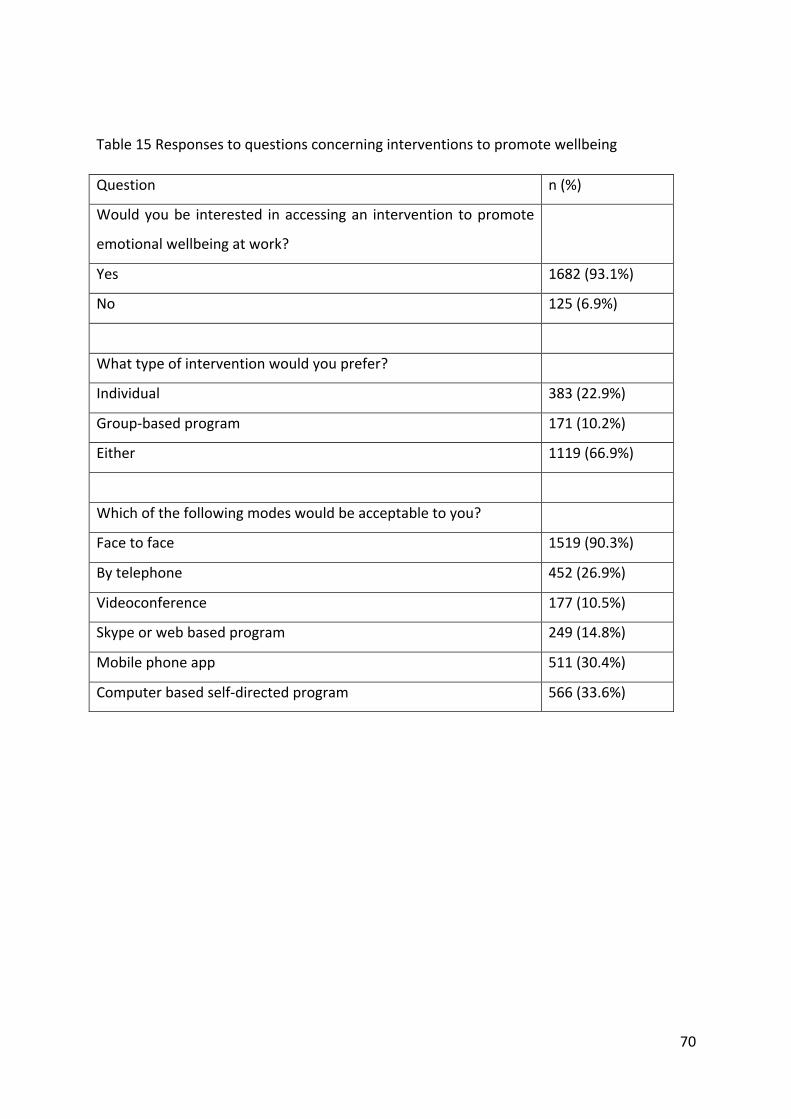
70
Table15Responsestoquestionsconcerninginterventionstopromotewellbeing
Question n(%)
Wouldyoube interested inaccessingan intervention topromote
emotionalwellbeingatwork?
Yes 1682(93.1%)
No 125(6.9%)
Whattypeofinterventionwouldyouprefer?
Individual 383(22.9%)
Group-basedprogram 171(10.2%)
Either 1119(66.9%)
Whichofthefollowingmodeswouldbeacceptabletoyou?
Facetoface 1519(90.3%)
Bytelephone 452(26.9%)
Videoconference 177(10.5%)
Skypeorwebbasedprogram 249(14.8%)
Mobilephoneapp 511(30.4%)
Computerbasedself-directedprogram 566(33.6%)
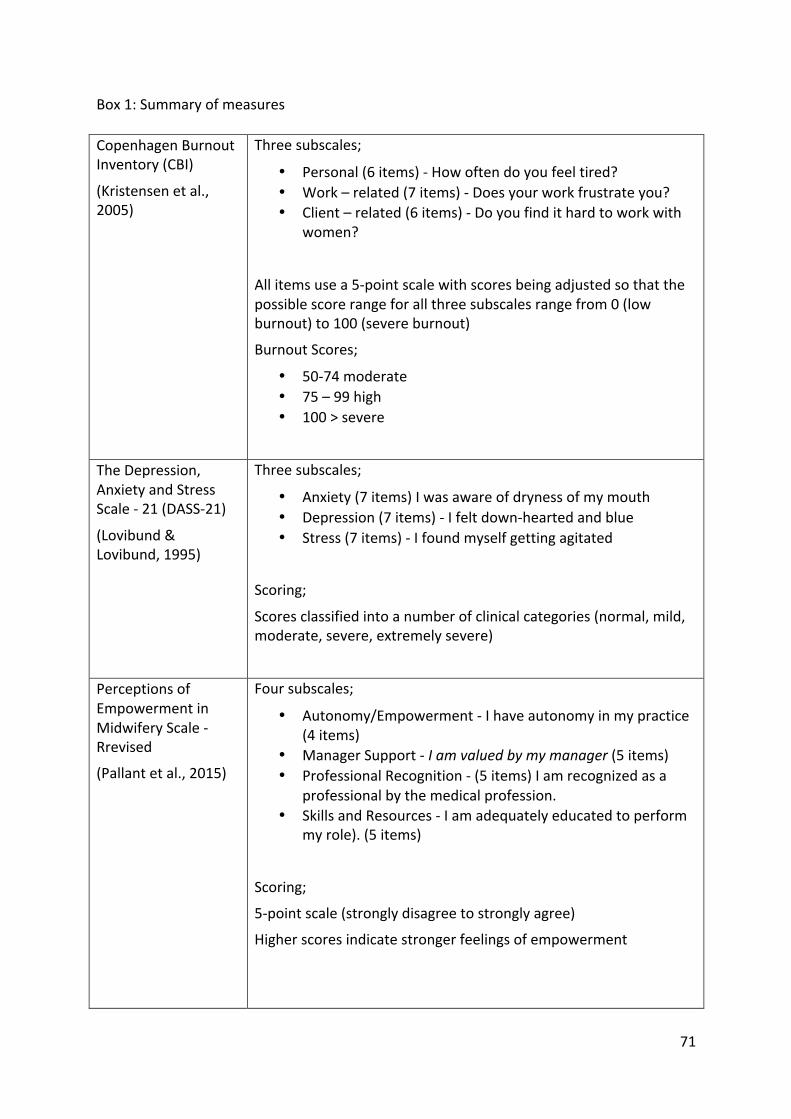
71
Box1:Summaryofmeasures
CopenhagenBurnoutInventory(CBI)
(Kristensenetal.,2005)
Threesubscales;
• Personal(6items)-Howoftendoyoufeeltired?• Work–related(7items)-Doesyourworkfrustrateyou?• Client–related(6items)-Doyoufindithardtoworkwith
women?
Allitemsusea5-pointscalewithscoresbeingadjustedsothatthepossiblescorerangeforallthreesubscalesrangefrom0(lowburnout)to100(severeburnout)
BurnoutScores;
• 50-74moderate• 75–99high• 100>severe
TheDepression,AnxietyandStressScale-21(DASS-21)
(Lovibund&Lovibund,1995)
Threesubscales;
• Anxiety(7items)Iwasawareofdrynessofmymouth• Depression(7items)-Ifeltdown-heartedandblue• Stress(7items)-Ifoundmyselfgettingagitated
Scoring;
Scoresclassifiedintoanumberofclinicalcategories(normal,mild,moderate,severe,extremelysevere)
PerceptionsofEmpowermentinMidwiferyScale-Rrevised
(Pallantetal.,2015)
Foursubscales;
• Autonomy/Empowerment-Ihaveautonomyinmypractice(4items)
• ManagerSupport-Iamvaluedbymymanager(5items)• ProfessionalRecognition-(5items)Iamrecognizedasa
professionalbythemedicalprofession.• SkillsandResources-Iamadequatelyeducatedtoperform
myrole).(5items)
Scoring;
5-pointscale(stronglydisagreetostronglyagree)
Higherscoresindicatestrongerfeelingsofempowerment
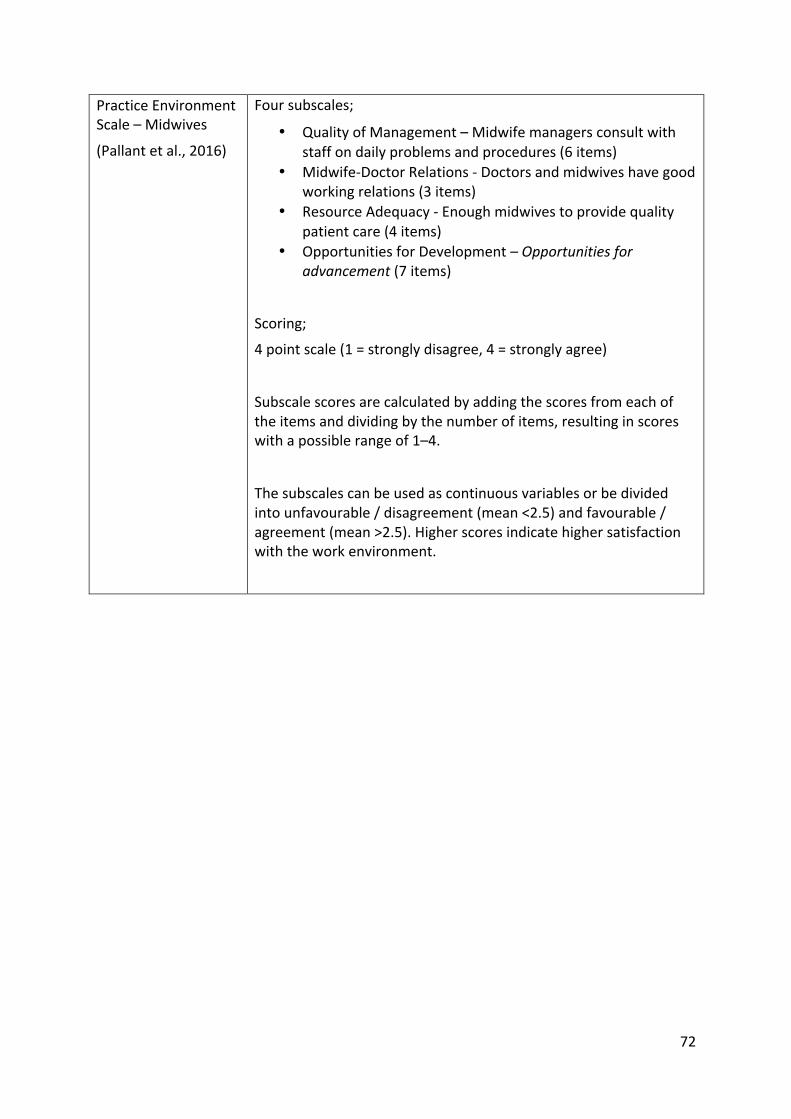
72
PracticeEnvironmentScale–Midwives
(Pallantetal.,2016)
Foursubscales;
• QualityofManagement–Midwifemanagersconsultwithstaffondailyproblemsandprocedures(6items)
• Midwife-DoctorRelations-Doctorsandmidwiveshavegoodworkingrelations(3items)
• ResourceAdequacy-Enoughmidwivestoprovidequalitypatientcare(4items)
• OpportunitiesforDevelopment–Opportunitiesforadvancement(7items)
Scoring;
4pointscale(1=stronglydisagree,4=stronglyagree)
Subscalescoresarecalculatedbyaddingthescoresfromeachoftheitemsanddividingbythenumberofitems,resultinginscoreswithapossiblerangeof1–4.
Thesubscalescanbeusedascontinuousvariablesorbedividedintounfavourable/disagreement(mean<2.5)andfavourable/agreement(mean>2.5).Higherscoresindicatehighersatisfactionwiththeworkenvironment.