
WORK AND RETIREMENT PATTERNS FOR THE G.I....
60
1 WORK AND RETIREMENT PATTERNS FOR THE G.I. GENERATION, SILENT GENERATION, AND EARLY BOOMERS: THIRTY YEARS OF CHANGE Richard W. Johnson, Barbara A. Butrica, and Corina Mommaerts CRR WP 2010-8 Date Released: July 2010 Date Submitted: June 2010 Center for Retirement Research at Boston College Hovey House 140 Commonwealth Avenue Chestnut Hill, MA 02467 Tel: 617-552-1762 Fax: 617-552-0191 All of the authors are affiliated with the Urban Institute. Richard W. Johnson is a senior fellow, Barbara A. Butrica is a senior research associate, and Corina Mommaerts is a research assistant. The research reported herein was pursuant to a grant from the U.S. Social Security Administration (SSA) funded as part of the Retirement Research Consortium (RRC). The findings and conclusions expressed are solely those of the author and do not represent the views of SSA, any agency of the Federal Government, the RRC, the Urban Institute, or Boston College. © 2010, by Richard W. Johnson, Barbara A. Butrica, and Corina Mommaerts. All rights reserved. Short sections of text, not to exceed two paragraphs, may be quoted without explicit permission provided that full credit, including © notice, is given to the source.
Transcript of WORK AND RETIREMENT PATTERNS FOR THE G.I....

1
WORK AND RETIREMENT PATTERNS FOR THE G.I. GENERATION, SILENT GENERATION, AND EARLY BOOMERS:
THIRTY YEARS OF CHANGE
Richard W. Johnson, Barbara A. Butrica, and Corina Mommaerts
CRR WP 2010-8
Date Released: July 2010 Date Submitted: June 2010
Center for Retirement Research at Boston College Hovey House
140 Commonwealth Avenue Chestnut Hill, MA 02467
Tel: 617-552-1762 Fax: 617-552-0191 All of the authors are affiliated with the Urban Institute. Richard W. Johnson is a senior fellow, Barbara A. Butrica is a senior research associate, and Corina Mommaerts is a research assistant. The research reported herein was pursuant to a grant from the U.S. Social Security Administration (SSA) funded as part of the Retirement Research Consortium (RRC). The findings and conclusions expressed are solely those of the author and do not represent the views of SSA, any agency of the Federal Government, the RRC, the Urban Institute, or Boston College. © 2010, by Richard W. Johnson, Barbara A. Butrica, and Corina Mommaerts. All rights reserved. Short sections of text, not to exceed two paragraphs, may be quoted without explicit permission provided that full credit, including © notice, is given to the source.

2
About the Center for Retirement Research The Center for Retirement Research at Boston College, part of a consortium that includes parallel centers at the University of Michigan and the National Bureau of Economic Research, was established in 1998 through a grant from the Social Security Administration. The Center’s mission is to produce first-class research and forge a strong link between the academic community and decision makers in the public and private sectors around an issue of critical importance to the nation’s future. To achieve this mission, the Center sponsors a wide variety of research projects, transmits new findings to a broad audience, trains new scholars, and broadens access to valuable data sources.
Center for Retirement Research at Boston College Hovey House
140 Commonwealth Avenue Chestnut Hill, MA 02467
phone: 617-552-1762 fax: 617-552-0191 e-mail: [email protected]
crr.bc.edu
Affiliated Institutions: The Brookings Institution
Massachusetts Institute of Technology Syracuse University
Urban Institute

3
Abstract This study examines how the shifting choices and constraints facing older workers have changed work and retirement patterns over the past 30 years. Health improvements, declines in physical job demands, changes in Social Security rules, and the erosion in traditional defined benefit pension coverage and employer-sponsored retiree health insurance have altered work incentives at older ages. This paper compares labor force exits by older workers born 1913 to 1917 (part of the G.I. Generation), 1933 to 1937 (part of the Silent Generation), and 1943 to 1947 (part of the Baby Boom Generation). The analysis uses 16-year longitudinal panels from the Health and Retirement Study and decades-long administrative earnings records linked to respondents in the Survey of Income and Program Participation. The results show that early boomers worked longer than members of the Silent Generation, and that the pathways older workers follow out of the labor force have become more complex over time. The median retirement age for men was about one-half year higher in the 1943–47 cohort than in the 1933–37 cohort (62 vs. 61.5), but differences were more pronounced at older ages. By age 65, for example, 40 percent of early boomer men had not yet retired, compared with only 20 percent of Silent Generation men. Both male and female workers in the 1933–37 cohort were much less likely than their counterparts in the 1913–17 cohort to follow the traditional retirement path of exiting the labor force from full-time employment and never returning to work.

4
Policy Abstract This study examines how the shifting choices and constraints facing older workers have changed work and retirement patterns over the past 30 years. Health improvements, declines in physical job demands, changes in Social Security rules, and the erosion in traditional defined benefit pension coverage and employer-sponsored retiree health insurance have altered work incentives at older ages. This paper compares labor force exits by older workers born 1913–17 (part of the G.I. Generation), 1933–37 (part of the Silent Generation), and 1943–47 (part of the Baby Boom Generation). The analysis uses 16-year longitudinal panels from the Health and Retirement Study and decades-long administrative earnings records linked to respondents in the Survey of Income and Program Participation. The results show that early boomers worked longer than members of the Silent Generation, and that the pathways older workers follow out of the labor force have become more complex over time. The median retirement age for men was about one-half year higher in the 1943–47 cohort than in the 1933–37 cohort (62 vs. 61.5), but differences were more pronounced at older ages. By age 65, for example, 40 percent of early boomer men had not yet retired, compared with only 20 percent of Silent Generation men. Both male and female workers in the 1933–37 cohort were much less likely than their counterparts in the 1913–17 cohort to follow the traditional retirement path of exiting the labor force from full-time employment and never returning to work.

1
Introduction
The choices and constraints confronting older workers contemplating retirement have been
changing rapidly. Today’s older adults are generally better able to work than previous
generations, for example, because health has improved at older ages and jobs have become less
physically demanding. Defined contribution (DC) plans have supplanted traditional defined
benefit (DB) pensions as the dominant type of employer-sponsored retirement plan. DB plans
often penalize participants who work too long, whereas DC plans do not. Employer-sponsored
retiree health benefits, which generally provide health insurance to retirees before Medicare
begins at age 65, are disappearing, making it more expensive for many workers to retire early.
Recent Social Security changes are also increasing work incentives at older ages. The full
retirement age (FRA) for Social Security has increased. The retirement earnings test, which
reduces payments to employed beneficiaries who earn more than a certain amount, was
eliminated in 2000 for those who have reached the FRA. And the delayed retirement credit,
which increases Social Security benefits for those who wait until after reaching the FRA to begin
collecting, is now eight times as high as it was in the mid-1970s.
These changes are altering retirement behavior. Labor force participation rates among
both men and women age 62 and older have soared over the past 15 years as work incentives
increased. The traditional retirement pattern, by which older workers leave the labor force
directly from full-time employment and never return to work, may be less popular now than it
used to be, with more complex patterns becoming the norm. For example, many workers
partially retire, moving from full-time to part-time employment, before leaving the labor force
completely. And some retirees return to work. As labor supply patterns shift at older ages and
traditional retirements become less common, various factors may now influence labor force

2
withdrawals in different ways than in the past. For example, the impact of education, pensions,
retiree health insurance, and health status on retirement may be changing.
This study examines how retirement behavior changed over a recent 30-year period. It
compares labor force exits by older workers in three different five-year cohorts—those born
from 1913 to 1917 (part of the G.I. Generation), 1933 to 1937 (part of the Silent Generation),
and 1943 to 1947 (the early years of the Baby Boom Generation).1
The results show that retirement behavior has changed markedly over the past 30 years.
The tendency to retire at age 62 remains nearly as strong today as it was in the past, but age 65 is
no longer a focal point for retirement. Among men and women who remain at work at age 62,
early boomers retired later than those in the Silent Generation born 10 years earlier. Retirement
patterns have also become more complex, with more workers partially retiring and returning to
work after a retirement spell than in the past.
These cohorts reached age 65
around 1980, 2000, and 2010. Using 16-year longitudinal panels from the Health and Retirement
Study and decades-long administrative earnings records linked to respondents in the Survey of
Income and Program Participation (SIPP), the analysis shows changes over time in retirement
ages, retirement dynamics, and the factors influencing retirement decisions.
Background: The Shifting Retirement Environment
Retirement decisions depend on the costs and benefits of withdrawing from the labor force. The
principal cost of retiring is the loss of earnings and fringe benefits (especially health benefits).
How much Social Security and pension benefits offset lost earnings, then, influence when older
1 Our generational classifications correspond to those defined by Strauss and Howe (1991). Others use different definitions. The U.S. Census Bureau, for example, defines the Baby Boom Generation as those born 1946–64.

3
workers retire. The cost of forfeited employer health benefits is often substantial before Medicare
becomes available at age 65, but it is less costly for those whose employers offer retiree health
benefits or who may receive benefits through their spouse’s health plan. Poor health reduces
productivity and makes work less pleasant, especially in jobs that entail physically demanding
activities. Consequently, changes over time in Social Security rules, pensions, retiree health
plans, health status, and job demands will influence retirement incentives.
Employer-Sponsored Pensions
The most dramatic change in the retirement environment over the past few decades has probably
been the growth in employer-sponsored DC retirement plans and the erosion in traditional DB
pension plan coverage. Between 1980 and 2009, the share of private-sector workers participating
in DB plans fell from 39 to 20 percent, while the share participating in DC plans but not DB
plans increased from 8 to 31 percent (Bureau of Labor Statistics [BLS] 2009; Pension and
Welfare Benefits Administration 2001–2002).2
2 DB plans continue to dominate in the public sector, however. In 2009, 79 percent of state and local government employers participated in DB pension plans (BLS 2009), and the federal government offers a DB plan to nearly its entire workforce.
Conversions to cash balance plans, which are
classified as DB plans for legal and regulatory purposes but which resemble DC plans in many
respects, have compounded the decline in traditional DB plans. Cash balance plans, which did
not exist before 1985, provided coverage for 23 percent of all private-sector workers in DB plans
in 2005 (BLS 2007). Because of these retirement plan shifts, those in our study born between
1913 and 1917 are much more likely to have DB coverage than those born between 1943 and
1947.

4
The shift away from traditional DB pension plans significantly affects retirement
incentives. Once DB plan participants have satisfied the plan’s service requirements and reach
retirement age, they may leave their employer and begin collecting monthly retirement benefits,
which are generally based on earnings and years of service and last until they die. Participants
may generally raise their monthly retirement benefits by working beyond the plan’s retirement
age, as years of service (and sometimes annual earnings) increase. However, the increase in
monthly benefits resulting from an additional month of work is usually insufficient to fully offset
the loss of a month of benefits. As a result, most traditional DB plans penalize work beyond the
plan’s retirement age. Numerous studies have found that workers respond to the incentives
embedded in DB pension plans by retiring at a relatively young age (e.g., Lumsdaine, Stock, and
Wise 1996; Samwick 1998; Stock and Wise 1990).
DC retirement plans, by contrast, do not encourage workers to retire early. Most DC
plans function essentially as tax-advantaged savings accounts to which both employers and
employees contribute. Workers gain access to their accumulated account balance when they
retire. Because the account balance may continue to grow while participants remain in the plan
and workers do not forfeit any benefits by remaining with the employer beyond traditional
retirement ages, DC plans do not penalize work at older ages. In fact, Friedberg and Webb
(2005) found that older workers in DC plans generally retire about two years later than those in
DB plans.
Cash balance plans provide incentives similar to those in DC plans (Johnson and Uccello
2004). Employers offering cash balance plans regularly set aside a given percentage of salary for
each employee and credit interest on these contributions. Interest credit rates are usually tied to a
special benchmark, such as the U.S. Treasury bill rate. As in DC plans, cash balance benefits are

5
expressed as an account balance.3
There is some evidence that DB plans better reward work at older ages today than in the
past. Our calculations from BLS tabulations show that among private-sector workers in DB plans
that specify a retirement age, the share in plans that allow workers to retire at age 62 or younger
with full benefits declined from 44 to 30 percent between 1995 and 2005.
As a result, participants do not forfeit benefits by remaining at
work beyond the plan’s retirement age.
4
Over the same period,
the share of DB plan participants who could retire early and receive reduced benefits declined
from 96 to 88 percent. It is likely, then, that recent cohorts of older workers with DB plans retire
later than their counterparts in earlier cohorts.
Health Benefits
Six in ten employers offered health insurance benefits to their workers in 2009, with monthly
premiums averaging $402 for single coverage (Kaiser Family Foundation and Health Research
and Educational Trust 2009). Premiums are generally shared between employers and employees.
Workers with employer health insurance generally forfeit their benefits when they retire, a
significant cost when leaving the labor force before age 65. Early retirees not only forego the
insurance subsidies that most employers offering coverage provide, they also lose access to the
group insurance market. Nongroup health insurance premiums are typically quite expensive for
older adults, particularly those with health problems (Pollitz, Sorian, and Thomas 2001). The
3 In cash balance plans, however, these account balances are only bookkeeping devices. Plans pay benefits from commingled funds invested in a pension trust on behalf of all participants. 4 These estimates are based on data from BLS (1998, 2007). The earlier survey is restricted to workers at medium and large private employers (that employ 100 or more employees), whereas the later survey includes all private-sector workers. This discrepancy is unlikely to affect our findings much because most DB plan participants work at medium or large employers. In 2009, only 9 percent of private-sector workers at small employers participated in DB plans, compared with 46 percent of those at firms that employed 500 or more workers (BLS 2009).

6
cost of losing employer health benefits is lower for workers who wait to retire until age 65, when
they can begin Medicare and avoid having to obtain primary coverage in the nongroup market.5
Retiree health benefits generally allow workers to continue their employer health
insurance coverage after they retire until they qualify for Medicare benefits at age 65. Some
retiree health plans also supplement Medicare benefits after age 65. By lowering retirement
costs, these benefits reduce work incentives and encourage early labor force withdrawals (Blau
and Gilleskie 2001; Johnson, Davidoff, and Perese 2003; Rogowski and Karoly 2000). However,
the share of employers offering retiree health benefits has declined dramatically over the past
two decades as health care costs have increased. Among large private-sector employers (with
200 or more employers) that provided health benefits, only 29 percent offered retiree health
benefits in 2009, down from 66 percent in 1988 (Kaiser Family Foundation and Health Research
and Educational Trust 2009).
6 Additionally, the retiree health benefits that employers provide
have generally become less generous over time and now shift more costs to retirees (Johnson
2007; Laschober 2004). This erosion in retiree health benefits is changing work patterns at older
ages.7
Social Security
Social Security reforms implemented over the past 30 years, especially the past 10 years, have
boosted work incentives. The increase in the FRA raised the penalty for early retirement,
5 Some beneficiaries purchase private supplemental insurance (known as Medigap policies) to help cover Medicare deductibles and copayments and some services excluded from Medicare’s benefits package. 6 Most of this decline occurred in the late 1980s and early 1990s. 7 The 2010 health reform legislation (the Patient Protection and Affordable Care Act) establishes health insurance exchanges in 2014 that may substantially reduce the cost of nongroup health insurance coverage and thus the importance of retiree health benefits in coming years.

7
increases in the delayed retirement credit boosted Social Security benefits for those who delay
retirement, and the elimination of the retirement earnings test for workers who have reached the
FRA removed an apparent tax on work at older ages.
The 1983 amendments to the Social Security Act gradually increased the FRA—the age
at which individuals may begin collecting their full retirement benefits—from 65 to 67.
Beginning with those born in 1938 (who turned 62 in 2000), the FRA increased two months a
year until it reached 66 for those born in 1943 (who turned 62 in 2005). The FRA remains at this
level for the next several years. It begins increasing two months per year again for those born in
1955 (and turning 62 in 2017), until it reaches 67 for those born in 1960 and later. Retirees may
still claim Social Security at age 62, the early entitlement age, but those who face a higher FRA
are penalized more. When the FRA is 66, for example, those who begin collecting retirement
benefits at age 62 receive only 75 percent of their full benefits, whereas those facing an FRA of
65 receive 80 percent of their full benefits when they begin collecting at 62.
In addition to penalizing those who retire early, Social Security rewards those who retire
later. The delayed retirement credit increases monthly payments for each month that the
beneficiary waits beyond the FRA to begin collecting. This credit has increased sharply over
time. When first implemented in 1972, it increased benefits by 1 percent for each year that the
beneficiary waited beyond the FRA to collect, up to age 72. The credit increased to 3 percent per
year in 1981. The 1983 amendments included additional increases that began with those born in
1925, whose credit was boosted to 3.5 percent per year, but stopped increasing benefits for those
who wait beyond age 70 to collect. They further increased the credit by 0.5 percentage points
every other year until it reached 8 percent per year for those born in 1943 and later.

8
The retirement earnings test reduces Social Security benefits for those who receive
benefits while working. The earnings test originally applied to all Social Security beneficiaries,
regardless of age. For beneficiaries below the FRA, Social Security withheld $1 in benefits for
every $2 of earnings in excess of a specified exempt amount. For beneficiaries at or above the
FRA, Social Security withheld $1 in benefits for every $3 of earnings in excess of a different
higher exempt amount. Beginning in 1981, the earnings test did not apply to working
beneficiaries age 70 or older. The benefit reduction while working is partly offset by higher
future benefits (although many beneficiaries may not realize that their benefits will increase in
later years).
The Senior Citizens’ Freedom to Work Act of 2000 eliminated the retirement earnings
test above the FRA. For working beneficiaries below the FRA, the retirement earnings test
currently reduces benefits by $1 for every $2 of earnings in excess of the exempt amount—
$14,160 in 2010. For working beneficiaries at the FRA, it reduces benefits by $1 for every $3 of
earnings in excess of a higher exempt amount—$37,680 in 2010. Several studies have found that
workers responded to the elimination of the retirement earnings test by working more (Friedberg
2000; Haider and Loughran 2008; Song 2004; Tran 2004) or taking Social Security benefits
earlier (Gruber and Orszag 2003; Song and Manchester 2007).
Table 1 shows how Social Security’s penalties for taking early benefits and bonuses for
delaying retirement differ for the cohorts in our study. The FRA is higher for the 1943–47 birth
cohort than earlier cohorts (66 vs. 65), so those in the later cohort who retire at age 62 receive a
smaller percentage of their full benefits, especially if they take spousal benefits instead of retired

9
worker benefits.8 The delayed retirement credit is also higher for later cohorts. As a result, adults
born between 1943 and 1947 can increase their monthly Social Security benefits by 144 percent
if they wait until age 67 to begin collecting, instead of collecting at age 62.9
By contrast, those
born between 1913 and 1915 increased their monthly benefits only 127.5 percent by waiting
until age 67. The elimination of the retirement earnings test after the FRA creates additional
work incentives for those born in later cohorts.
Health Status
Older Americans are healthier now than they used to be, improving their productivity and ability
to work. Figure 1 shows how the percentage of older adults reporting fair or poor health changed
between 1983 and 2007. Although this health measure is subjective, survey respondents who
report poor health have much higher mortality rates than those who report better health (Dowd
and Zajacova 2007; Idler and Benyamini 1997), suggesting that it reflects real health problems.
Between 1983 and 2007, the share reporting fair or poor health fell about 7 percentage points at
age 55 to 64, 10 percentage points at age 65 to 74, and 7 percentage points at age 75 to 84. These
declines represent substantial relative changes. At age 65 to 74, for example, the share with fair
or poor health was nearly one-third lower in 2007 than 1983. Health gains were much more
modest at age 45 to 54, however. And at all older ages, health has improved much more slowly
(or not at all) since 1998, raising concerns about the health status of future generations of older
Americans (Soldo, Mitchell, Tfaily, and McCabe 2007).
8 Instead of receiving Social Security as a retired worker, married (and divorced) beneficiaries may receive payments equal to 50 percent of their spouse’s full retirement benefit. Like retired worker benefits, spouse benefits are reduced when they begin before the recipient’s FRA, but the reduction factors are larger for spouse benefits. 9 This calculation assumes that adults who delay claiming stop working at age 62. Some beneficiaries would experience larger increases if they continued to work after age 62.

10
Job Characteristics
Between 1971 and 2006 the share of workers in blue-collar occupations fell from 36 to 24
percent, while the share of workers in management, the professions, and services increased from
38 to 51 percent (Johnson, Mermin, and Resseger 2007). As the economy moved away from
manufacturing to service and technology-based jobs, fewer Americans engaged in physically
demanding work. The share of jobs involving high physical demands (such as strength, bending,
or quick reaction time) declined from 8.8 to 7.3 percent between 1971 and 2006, while the share
involving moderate or high physical demands (such as standing, walking, or repetitive motion)
declined from 56.5 to 46.0 percent (Johnson, Mermin, and Resseger 2007). Between 1992 and
2002, the share of workers age 55 to 60 in jobs that never or almost never involved much
physical effort increased by nearly one fifth (Johnson 2004). The decline in physically
demanding jobs, combined with improvements in health status, have increased the share of older
adults able to work.
Employment Opportunities
Employment at older ages depends not only on older adults’ willingness and ability to work, but
also on employers’ willingness to hire and retain them. In surveys, employers usually say they
value older workers’ experience, maturity, and work ethic, but often express concern about their
relatively high salaries and benefit costs (Mermin, Johnson, and Toder 2008). One-quarter of
employers in a 2006 said they were reluctant to hire older workers (Pitt-Catsouphes et al. 2007).
Employers appear to hold less favorable views about older rank-and-file workers than older
professionals and managers. In another 2006 survey, for example, 19 percent of employers
reported that older rank-and-file workers were less productive than their younger counterparts

11
(Munnell, Sass, and Soto 2006). Only 6 percent of employers believed that older professionals
and managers were less productive than younger ones.
Some employers appear to discriminate against older workers in hiring decisions. In an
experimental study, Lahey (2008) sent resumes to nearly 4,000 firms in the Boston and St.
Petersburg, Florida areas. The resumes, which were faxed in pairs in response to employment
ads for entry-level jobs, were identical except for the age of the job applicant. Lahey found that
resumes from younger women (age 35 or 45) generated significantly more positive responses
than those from older women (age 50, 55, or 62). These findings are consistent with other
evidence of discrimination by employers against older workers (Reynolds, Ridley, and Van Horn
2005; Rosen and Jerdee 1995).
Changing Work and Retirement Patterns
Perhaps in response to shifts in pension plan design, Social Security rules, retiree health plans,
health status, job demands, and employer attitudes, labor force participation rates have changed
markedly over the past half century. The share of older men participating in the labor force
steadily declined until about 1990, but then began increasing among those age 62 and older
(figure 2). Between 1993 and 2009, for example, participation rates increased 20 percent at ages
62 to 64 and 43 percent at ages 65 to 69. Men born in 1935, then, were less likely to work at ages
62 to 64 than those born in 1915 or those born in 1945. Male participation rates at ages 55 to 61
have not changed much over the past two decades, however. As a result, men born in 1915 were
more likely to work at ages 55 to 61 than those born in 1935 or 1945.
Participation rates for older women have fairly steadily increased since the early 1960s,
and grew especially rapidly over the past two decades (figure 3). Between 1993 and 2009,
female participation rates increased 22 percent at ages 55 to 61, 39 percent at ages 62 to 64, and

12
65 percent at ages 65 to 69. This growth is partly due to the aging of female cohorts who were
always more strongly attached to the labor force than earlier generations.
Although changes in older Americans’ participation rates are well publicized, less is
known about other ways in which work is changing at older ages. For example, older adults’
work patterns may be becoming more complex. Many workers now partially retire, moving from
full-time to part-time employment before leaving the labor force completely (Cahill, Giandrea,
and Quinn 2006). This alternative to the more traditional retirement pattern, in which workers
move directly out of the labor force from full-time employment, may be more popular now than
in the past. Some evidence, for instance, suggests that older workers became more likely to
transition from full-time to part-time employment during the 1970s and 1980s (Peracchi and
Welch 1994), although partial retirement certainly existed in the 1980s (Ruhm 1990). Many
retirees now return to work after leaving the labor force (Maestas forthcoming), which may also
be more common today. Additionally, various factors may now influence labor force
withdrawals in different ways than in the past. For example, the impact of education, pensions,
retiree health insurance, and health status on retirement may be changing as the retirement
landscape shifts.
Data and Methods
This paper used data from the SIPP and HRS to examine how older adults’ work patterns differ
in the 1913–17, 1933–37, and 1943–47 birth cohorts. We compared retirement hazard curves and
the cumulative probability of remaining in the labor force for each cohort, estimated multivariate
hazard models of retirement, and showed how retirement pathways have changed over time.
Using two surveys complicated the analysis, but we could not compare retirement behaviors over

13
a 30-year span with just one survey. The HRS data provided better measures of retirement and its
timing than the SIPP data and included better measures of health, pension coverage, and access
to retiree health insurance, but we could observe employment histories near traditional retirement
ages for only six years in the 1943–47 HRS cohort.
Survey of Income and Program Participation
The SIPP consists of a series of panels that follow respondents for about three to four years,
collecting data on demographics, employment, earnings, assets, and other characteristics. The
first panel began in 1984, and the latest panel began in 2004.10 These panels are too short to
construct long-term employment histories. However, they have been linked to the Social Security
Administration’s Summary Earnings Records (SER) files that extend from 1951 to 2007,
allowing us to examine employment patterns for several decades.11
Our SIPP samples consisted of adults born between 1913 and 1917 and interviewed in the
1984 panel, when they were age 67 to 71, and those born 20 years later (1933 to 1937) who were
interviewed at age 67 to 71 in the 2004 panel. Because health status is correlated with both labor
supply and mortality, we must condition both samples on survival to the same relatively narrow
age range (67 to 71) to avoid potential biases. To focus on those attached to the labor force at
midlife, we also restricted the analysis to respondents with average annual earnings (in 2007
Matched earnings records
were available for about 95 percent of respondents in the 1984 panel and about 81 percent in the
2004 panel.
10 The 2008 SIPP panel was released while this study was underway, but only the first 12 months of data were available. 11 Access to the matched SER files is restricted, and researchers must follow strict confidentiality procedures.

14
wage-adjusted dollars) at age 45 to 49 that exceeded $6,084, the amount earned by workers
employed half-time at the 2007 federal minimum wage ($5.85 times 1,040 hours).12
The SIPP surveys provided basic demographic information, and the earnings records
allowed us to date full and partial retirements that may have occurred outside the survey window.
Retirement measures based on earnings data are somewhat problematic, however. The SER
indicated annual earnings up to Social Security’s taxable maximum for each calendar year. We
classified individuals as having fully retired in year t if their earnings in year t+1 were zero (and
they were not retired in year t). We computed their age in year t based on the age they reported at
the time of the SIPP survey, although these estimated retirement ages may be off by one year
depending on what point during the calendar year they actually stopped working. Individuals
were classified as partially retired at age t if they had positive earnings that were less than half
their average earnings between ages 45 and 49 and if they had positive earnings in year t+1.
Because some workers with low earnings in year t likely worked full-time part of the year and
then fully retired, those with zero earnings in year t+1 were classified as having fully retired in
year t, as noted above. Based on these definitions, our final sample included 1,106 workers from
the 1913–17 cohort and 1,883 workers from the 1933–37 cohort who were working and not
retired at age 49.
The increase over time in Social Security’s taxable maximum introduced another
potential source of error into our partial retirement measure. The taxable maximum, at which our
earnings records were capped, increased from $4,200 in 1957 (the year the oldest members of
our sample turned 45) to $32,400 in 1982, when the youngest members of our sample turned 45
(SSA 2010). This growth could lead us to understate partial retirement in the earlier cohort,
because we may underestimate average earnings at ages 45 to 49 and thus the share of workers 12 Wages were adjusted each year by the change in average economy-wide earnings.

15
whose later earnings fell substantially below that midlife average. In 1957, annual earnings
exceeded the taxable maximum for 30 percent of workers, compared with only 7 percent in 1982
(SSA 2010).
Health and Retirement Study
Much of our analysis was based on the HRS, a nationally representative longitudinal survey of
older Americans that collects detailed information on health status, pensions, wealth, and other
factors correlated with employment decisions. Conducted by the University of Michigan with
primary funding from the National Institute on Aging, it first interviewed respondents born 1931
to 1941 in 1992, when they were age 51 to 61. Older cohorts were introduced to the survey in
1993 and 1998, and younger cohorts were introduced in 1998 and 2004. Respondents were
resurveyed every other year, and the most recent information when this study was completed was
collected in 2008.13
The detailed employment data collected by the HRS allowed us to construct several
different retirement measures. The first measure was based simply on employment; workers
were treated as retired when they stopped working or looking for work. The second measure was
based on workers’ self-identification with retirement. The survey asked respondents whether
they considered themselves to be completely retired, partly retired, or not retired at all. We
classified those who reported complete or partial retirement as being retired. Our final measure
combined the two previous measures, classifying respondents as retired if they were not working
and considered themselves to be partially or completely retired. Those who were not working
We restricted our samples to workers born 1933 to 1937 who were first
interviewed in 1992, and those born 1943 to 1947 who were first interviewed in 1998. Both
cohorts were age 55 to 59 at the baseline interview.
13 For additional information on the HRS, visit http://hrsonline.isr.umich.edu.

16
were asked about the month and year when they stopped working, and those who described
themselves as retired were asked about the month and year they retired. Combined with survey
data on respondents’ month and year of birth, this information allowed us to measure retirement
ages fairly precisely.
We further restricted the sample to those who did not meet our retirement definition at
age 54. Respondents who were not in the labor force at age 54 for reasons other than retirement
(such as disability) were also excluded from the sample. When we used the work definition of
retirement, our sample included 2,828 respondents from the 1933–37 cohort and 1,505 from the
1943–47 cohort. When we used the self-reported and combined retirement definitions, our
sample included 2,596 respondents from the 1933–37 cohort and 1,336 from the 1943–47 cohort.
Analyses
We began by plotting retirement hazard rates and the cumulative probability of not yet retiring
for respondents in our SIPP and HRS samples. We tracked respondents in the SIPP samples for
20 years (from age 50 to 69), and those in the HRS samples for 12 years for the 1933-37 cohort,
spanning ages 55-75, and 6 years for the 1943-47 cohort, spanning ages 55 to 65. The retirement
hazard, λ(t), is the probability of retiring at age t, conditional on not having already retired. The
survival function at age t, S(t), was defined as
S(t) = S(t – 1) * [1 – λ(t)],
and shows the probability of not yet retiring by age t. These curves, then, indicate the likelihood
of first retirements. We compared retirement hazards and survival curves for the 1913–17 and
1933–37 cohorts, and for the 1933–37 and 1943–47 cohorts, but we did not compare all three
cohorts because retirement definitions and sample selection criteria differed in the SIPP and HRS

17
surveys. We estimated rates separately by sex and education, and showed them for each of our
retirement definitions.
We then estimated discrete-time hazard models of the log odds of retiring in our HRS
samples. The advantage of these models is that they can accommodate time-varying predictors,
better enabling us to measure the impact of such factors as age, health, income, and wealth. We
estimated hazard models on a sample that included a separate observation for each wave a
respondent was not yet retired until they retired, dropped out of the labor force for other reasons,
dropped out of the survey, or reached the end of the observation period (1998 for the 1933–37
cohort or 2008 for the 1943–47 cohort). For each interview that respondents remained at risk for
retirement (i.e., they were in the labor force but not yet retired), we observed a dichotomous
outcome—they retired or they did not. We estimated logit models to regress these outcomes on
the predictors, many of which varied over time. Because the data were arranged in person-wave
format, the results could be interpreted as discrete-time hazard models (Allison 1984).
Predictors included health, economic, and demographic variables. Health measures
consisted of the presence of health problems that limit the type or amount of work and whether
the respondent reported fair or poor overall health status (as opposed to excellent, very good, or
good). One drawback of the health-related work limitations measure was that in 2004 the HRS
stopped asking respondents who reported work limitations in the previous wave whether they
continued to have work limitations. We assumed that their health problems continued, even
though some people recovered, causing us to overestimate work limitations in 2004, 2006, and
2008.
The economics variables in the model measured the respondent’s earnings, household
wealth excluding the value of housing, and employee benefits. Earnings and wealth were

18
measured as natural logs to account for skewness in their distributions, and expressed in constant
2008 dollars (as adjusted by the change in the consumer price index). The model included
indicators of any DB pension plan coverage and DC retirement plan coverage but no DB plan
coverage. It also included an indicator of whether the respondent’s employer offered retiree
health insurance. Additionally, we controlled for age, education, race and ethnicity, and marital
status. Each of the predictors were lagged one wave, so the model indicated the impact of health-
related work limitations in 2004, say, on the likelihood of retiring between 2004 and 2006 (and
reporting being retired in 2006). The models were estimated for each of the three retirement
measures, separately for men and women in each cohort.
A final set of tabulations computed the likelihood of alternative pathways into retirement
for the two SIPP cohorts. For men and women not retired at age 50, we computed the share who
moved between work, partial retirement, and full retirement by age 69, as well as the share who
returned to work after retiring. We compared outcomes for the 1913–17 and 1933–37 cohorts.
Results
We first compare retirement rates for men and women in the G.I. Generation and Silent
Generation, and then for men and women in the Silent Generation and Boomer Generation. We
next show the results of our retirement models for the Silent Generation and Boomer Generation.
The final section compares work transitions between age 50 and 69 for men and women in the
G.I. Generation and the Silent Generation.

19
Retirement Rates in the G.I. and Silent Generations
Before comparing retirement rates for men and women in the 1913–17 and 1933–37 cohorts, we
show how other characteristics of the two cohorts differ (table 2). Men and women in the Silent
Generation were much better educated than those in the earlier G.I. Generation. For example,
only 12.9 percent of men born 1933 to 1937 who were working and not retired at age 49 failed to
complete high school, compared with 47.1 percent of their counterparts born 1913 to 1917.
About half of women born 1933 to 1937 who were working and not retired at age 49 had
attended college, up from about a quarter of those born 20 years earlier. Additionally, non-
Hispanic whites made up a smaller share of the later generation of workers than the earlier
generation, and the later generation were much less likely to report health-related work
limitations at age 67 to 71.
Figure 4 shows retirement hazard rates for men in the 1913–17 and 1933–37 cohorts,
where retirement is defined as moving from full-time (or nearly full-time) employment to full or
partial retirement. The risk of retiring was low for both cohorts up to age 60. Hazards for the
Silent Generation men increased sharply at age 61, spiked at age 62 (at 31 percent) when early
Social Security retirement benefits became available, and spiked again at age 65 when full
retirement benefits and Medicare became available. For men born 20 years earlier, retirement
hazards rate remained low at age 61 and spiked at age 62, rising 14 percentage points to 23
percent. They rose substantially at ages 64 and especially 65, when the retirement hazard reached
52 percent, before dropping to 24 percent at age 66.
As suggested by the hazard rates, men in the Silent Generation generally retired earlier
than those in the G.I. Generation. The median retirement age (when half of men working at age
49 had fully or partially retired) fell from 61.6 for those born 1913 to 1917 to 59.3 for those born

20
1933 to 1937 (figure 5). The younger generation was also more likely to retire at much earlier
ages. About 36 percent of men born 1933 to 1937 retired by age 56, compared with only 18
percent of men born 1913 to 1917. However, men in the later generation were as likely as those
in the earlier generation to work at much older ages, because so many men in the earlier
generation retired at age 65. About 12 percent of men in both cohorts waited until after age 65 to
retire.
Unlike men, women in the Silent Generation employed at age 49 did not retire later than
those in the earlier G.I. Generation. Retirement hazards were similar for women in both cohorts,
spiking at age 62 and especially at age 65 (figure 6). Women in the younger cohort were less
likely to retire at age 64 and later. The retirement hazard for women born 1933 to 1937, for
example, peaked at 36 percent at age 65 and then fell to 12 percent at age 66. The age-65 peak
was higher (46 percent) for women born 20 years earlier, and fell less sharply (to 32 percent) at
age 66. The median retirement was 59 for women in both cohorts, although those in the later
cohort were somewhat more likely to remain at work and not yet retired by age 65 than those
born in the earlier cohort (figure 7).
Figures 8 and 9 compare the cumulative probability of remaining employed and not
retiring by educational attainment for men and women. Comparing men born 1913 to 1917 and
those born 1933 to 1937, we see that median retirement ages fell over the 20-year period for both
men who did not complete high school and for those with at least some college education.
Among men in the earlier cohort still working at age 60, those who attended college tended to
retire later than those who did not complete high school. These educational differences were
somewhat smaller among men born 1933 to 1937. For women, retirement trends vary with
education. Women’s median retirement age was lower in the 1933–37 cohort than the 1913–17

21
cohort among those who attended college, but higher among those who did not complete high
school. Whereas women with at least some college education in the 1913–17 cohort tended to
retire later than their counterparts who did not complete high school, college-educated women in
the 1933–37 cohort tended to retire earlier than their less-educated counterparts.
Retirement Rates in the Silent and Boomer Generations
Several factors that tend to influence retirement rates changed significantly for men and women
employed at age 54 between the 1933–37 and 1943–47 birth cohorts, as reported in table 3. Both
men and women in the later cohort were much better educated than those in the earlier cohort.
For example, more than one-third of Boomer men completed college, compared with less than
one-fourth of men in the Silent Generation. Boomer men (but not women) reported better health
than their counterparts in the Silent Generation, and Boomer women (but not men) earned
significantly more than their counterparts in the earlier generation. Both men and women born
1943–47 were less likely than those born 10 years earlier to work for employers offering retiree
health insurance. Employed boomer women were also less likely to have DB pension coverage
and more likely to have DC plan coverage than those born 10 years earlier. Surprisingly,
however, the share of men with any DB coverage or with DC coverage only did not differ
significantly for the two cohorts.
Under each of our three retirement measures, retirement hazard rates were quite similar
for men in the two cohorts up to age 62, but later-cohort men were much less likely to retire after
age 62 than those born 10 years earlier. Consider men’s hazard rates when retirement was
defined as stopping paid work and describing oneself as retired. For both cohorts, the retirement
hazard began slowly increasing at age 59, spiked sharply at age 62, fell back, and then spiked
again at age 65 (figure 10). The hazard for Silent Generation men, for example, increased from 9

22
percent at age 61 to 27 percent at age 62, and then fell to 15 percent at age 63. Up to age 62,
hazards for Baby Boomer Generation men were only a few percentage points smaller than for the
Silent Generation men, spiking to 22 percent at age 62. Baby Boomer men who had not retired
by age 62, however, exhibited much lower retirement rates than those born 10 years earlier. For
example, the retirement hazard spiked to 26 percent at age 65 for men born 1933 to 1937, but
increased only modestly, to 7 percent, for men born 1943 to 1947. Patterns were similar when we
defined retirement based on employment status alone (regardless of self-described retirement
status) (figure 11) or on self-described retirement status alone (regardless of employment) (figure
12).
Because retirement hazards before age 62 were similar for the Silent Generation and
Baby Boomer Generation men, the share retired by 62 did not differ much between the cohorts.
Using the retirement definition that combined employment status and self-reported retirement
status, we found that only 53 percent of Silent Generation men and 47 percent of Boomer men
had retired by age 62 (figure 13). At later ages, however, the share retired was much lower for
the Boomer men than the Silent Generation men. By age 65, for example, 75 percent of Silent
Generation men had retired, compared with only 57 percent of Boomer men. Over the 10-year
period, the median retirement age fell from 61.8 for the Silent Generation men to 62.7 percent
for the Boomer men. Again, patterns were similar under alternative retirement definitions
(figures 14 and 15).
As we observed for men, retirement hazard patterns were similar for women born
between 1933 and 1937 and those born 10 years later. The discussion focuses on the retirement
definition that combined employment status and self-reported retirement status (figure 16). The
results were similar for the other two definitions (figures 17 and 18). Retirement rates were

23
somewhat lower at most ages for the more recent Baby Boomer cohort, and cohort differences
for women (unlike those for men) became apparent before age 62. For working women in both
cohorts, retirement hazards spiked at age 62, but the spike was much lower for the Boomer
women than the Silent Generation women (17 vs. 26 percent). Retirement hazards spiked again
at age 65 for the Silent Generation women (at 29 percent), but not for the Boomer women. The
median retirement was 62.6 years for the 1943-47 birth cohort of women, compared with 61.5
years for women born 10 years earlier (figure 19). Cohort differences in the cumulative
probability of retiring were similar under the other retirement definitions (figures 20 and 21).
Retirement trends varied by education, but most differences did not become apparent
until age 62. The comparisons defined retirement as ending paid employment and describing
oneself as fully or partially retired. For men working at age 54, retirement rates were similar
through age 61 for those who did not complete high school and those with at least some college
education in both the Silent Generation and Boomer cohorts (figure 22). Beginning at age 62,
retirement rates were lower in both cohorts for men with more education. Additionally,
retirement rates were lower among Boomer men than Silent Generation men for those who did
not complete high school and for those who attended college. The delay in retirement at older
ages was not restricted only to well-educated men. For women, Boomers who attended college
delayed retirement longer than their Silent generation counterparts, especially at 62 and older
ages (figure 23). However, Boomer women who did not complete high school were more likely
to retire before age 62 than those born 10 years earlier. Meaningful educational differences in
retirement patterns were not apparent among Silent Generation women.

24
Retirement Model Estimates for the Silent and Boomer Generations
Table 4 reports results from the retirement hazard models estimated on a sample of male HRS
respondents born between 1933 and 1937 and another sample of men in the HRS born between
1943 and 1947. The table shows estimated marginal effects of various worker characteristics on
the likelihood of retirement, under our three alternative retirement definitions.
Health problems and DB pension coverage substantially increased retirement
probabilities for men in both generations. Boomer men born 1943 to 1947 in fair or poor health
were 11.6 percentage points more likely to retire than their counterparts in better health, under
the retirement definition that combined employment status with self-reported retirement status.
In relative terms, they were 77 percent more likely to retire than those in better health. Silent
Generation men born 1933 to 1937 in fair or poor health were 5.2 percentage points, or 31
percent, more likely to retire than their healthier counterparts. The presence of a health-related
work limitation also increased retirement probabilities, but the effects were not significant in the
later cohort, perhaps because (as noted earlier) we were unable to measure work limitations
precisely in 2004, 2006, and 2008. Relative to working men who did not participate in any
retirement plan on the current job, those with DB pension coverage were 7.9 percentage points
(or 52 percent) more likely to retire in the 1943-47 cohort, and 8.5 percentage points (or 51
percent) more likely to retire in the 1933-37 cohort.
Retirement probabilities also increased with age for men in both cohorts, but the effects
were generally larger for men in the earlier cohort. Men age 60 were substantially more likely to
retire by the next survey wave (when they would have reached age 62) than younger men. For
men in the Silent Generation, retirement rates were 24.7 percentage points (or 149 percent)
higher at age 60 than age 55 under the retirement definition that combined employment status

25
14 However, men in households with no wealth (or negative wealth) retired earlier than other men, all else equal.
and self-reported retirement status. For men in the Boomer Generation, retirement rates were
only 16.3 percentage points (or 108 percent) higher at age 60. Generational differences were
similar at older ages.
Hispanic men were less likely to retire than non-Hispanic white men in both generations,
but the effects were larger in the Boomer Generation. There were no significant differences in
retirement rates (when we controlled for other factors) between African American and non-
Hispanic white men. When we defined retirement solely by employment status, we found that
married men were significantly less likely to retire than single men among those born 1933 to
1937, but not among those born 10 years later. Marital status did not significantly affect men’s
retirement decisions in either generation under our other two definitions.
For men born 1933 to 1937, household wealth and access to retiree health insurance
significantly increased retirement probabilities, whereas a bachelor’s degree significantly
reduced retirement probabilities.14
Table 5 shows retirement model results for women in the Silent Generation and Boomer
Generation. As we saw with men, the effect of age on the likelihood of retiring by the next
survey wave increased substantially at age 60. Again, though, age had a larger effect among
those born between 1933 and 1937 than those born 10 years later. Health problems also
substantially increased women’s retirement probabilities. When retirement was defined as no
longer working and describing oneself as retired, Boomer women who reported health problems
When we defined retirement as having stopped work and
classifying oneself as retired, for example, men in the Silent Generation with a bachelor’s degree
were 5.8 percentage points (or 35 percent) less likely to retire than their counterparts with only a
high school diploma. None of these factors, however, significantly affected retirement decisions
for men born 1943 to 1947.

26
that limited the type or amount of work they could perform were 14.5 percentage points (or 87
percent) more likely to retire than those who did not report health problems. The effects were
smaller for women in the Silent Generation.
Employee benefits appear to have stronger effects on women’s retirement rates now than
in the recent past. Under two of our retirement definitions, access to retiree health insurance
significantly increased retirement rates for Boomer women but not for Silent Generation women.
Participation in DC retirement plans significantly reduced retirement rates for Boomer women
under all three of our retirement definitions, but did not have a significant impact for the earlier
Silent Generation women under two of our definitions. Household wealth generally increased
retirement rates for women in both generations (except that Silent Generation women in
households with no wealth or negative wealth also tended to retire early).
The impact of demographic characteristics on women’s retirement decisions also appears
to be changing. African American and Hispanic working women born 1943 to 1947 were
significantly more likely to retire than their non-Hispanic white counterparts, but racial and
ethnic differences were generally insignificant among women born 10 years earlier. Married
working women were significantly more likely to retire than their unmarried counterparts among
those born 1933 to 1937, but not among those born 1943 to 1947. Educational differences were
insignificant in both cohorts.
Retirement Transitions
Table 6 shows work transitions between age 50 and 69 for men and women in the SIPP,
comparing patterns for the G.I. Generation and the Silent Generation. The so-called traditional
retirement pattern, in which workers transition from full-time or nearly full-time work directly to

27
complete retirement and never return to work, has become much less common over time. Among
those born 1913 to 1917 and not yet retired (fully or partially) at age 49, about one-half of men
(51.1 percent) and two-fifths of women (60.1 percent) followed this traditional route into
retirement. This share fell to about one-third (34.3 percent of men and 37.4 percent of women)
among their counterparts born 20 years later. At the same time, workers have become much
more likely to partially retire before retiring completely. For example, 45.4 percent of working
men and 41.3 percent of working women born between 1933 and 1937 partially retired after age
50, compared with only 32.8 percent of men and 25.3 percent of women born 20 years earlier.
The later cohort was also much more likely to have “unretired” than the earlier cohort. About 26
percent of men and 29 percent of women born 1933 to 1937 returned to full-time or nearly full-
time employment after fully or partially retiring.
Complex pathways to retirement remain much less common among workers with limited
education than among those who completed high school or attended college. Among workers
born 1933 to 1937, 44.8 percent of men (table 7) and 42.6 percent of women (table 8) who did
not complete high school followed the traditional retirement path, moving directly out of the
labor force from full-time employment and never returning to work before age 70. By contrast,
only 32.0 percent of their male counterparts and 34.4 percent of their female counterparts who
attended college followed this traditional path. The share of college-educated female workers
who followed the traditional retirement pathway was nearly twice as high in the G.I. Generation
as in the Silent Generation.

28
Conclusions
Retirement patterns have changed sharply over the past 30 years. Men born 1933 to 1937 retired
much earlier, on average, than those born 20 years earlier. The trend reversed 10 years later.
Early Boomer men born 1943 to 1947 generally retired later than those born 1933 to 1937.
Women born 1933 to 1937 were much more likely to participate in the labor force than those
born 1913 to 1917. Among women working at age 49, however, retirement rates were quite
similar in the two cohorts. Like men, early Boomer women born 1943 to 1947 generally retired
later than women in the Silent Generation born 10 years earlier.
Retirement patterns are also becoming more complex, especially among well-educated
workers. The traditional retirement pattern, in which workers transition from full-time or nearly
full-time work directly to complete retirement and never return to work, was the norm among
workers in the G.I. Generation born 1913 to 1917. Only about one-third of workers born 20 years
later followed this traditional pattern. Instead, more than two-fifths partially retired, moving to
part-time work before leaving the labor force completely, and more than one-quarter unretired,
returning to work after a retirement spell. These trends will likely continue or even intensify once
members of the Boomer Generation move into their mid to late sixties.
The rapid growth in married women’s labor force participation over the past 40 years is
now transforming retirement decisions. Among Silent Generation workers born 1933 to 1937,
married women retired earlier than unmarried women, perhaps because many followed their
older husbands out of the labor force. By the time Boomer Generation workers born 1943 to
1947 began exiting the labor force, the retirement gap between married and unmarried women
had disappeared, perhaps because women are now more likely than in the past to make
retirement decisions appropriate to their own careers and financial security. For example,

29
Boomer women generally responded more to retiree health insurance availability and DC
retirement plan participation than earlier generations. And health-related work limitations had
larger effects on retirement decisions for Boomer women, who are now more likely than past
generations to remain at work unless they develop health problems.
The mechanisms that have traditionally regulated retirement behavior are changing or
fading away. Social Security’s FRA is now 65 instead of 66, the retirement earnings test was
eliminated beyond the FRA, and the delayed retirement credit has increased sharply. Employers
are now less likely to offer retiree health insurance. Private-sector workers are much less likely
to be covered by traditional DB pension plans today than 30 years ago. These pensions create
strong incentives for workers to leave at the plan’s retirement age, when benefits become
available, and the security of guaranteed monthly benefits allowed pensioners to remain outside
the labor force once they retired. In light of these changes, then, it is perhaps not surprising that
retirement patterns are now more complex and varied than in the past. Age 65, for example, is no
longer a focal point for retirements. Among G.I. Generation men born 1913 to 1917 who were
still working at age 64, slightly more than half retired at age 65. That figure fell to about 26
percent for their counterparts in the Silent Generation born 1933 to 1937, and to 7 percent for
Boomer Generation men born 1943 to 1947. We need more research to understand better what is
driving these changes.
Sixty-two is now the most common retirement age by far. More than one-fifth of men
born 1943 to 47 working at age 61 retired at age 62. While average retirement ages have been
creeping up recently and labor force participation rates have surged after age 62, the share of
adults retired by age 62 had not fallen much, especially among men. In light of the financial
benefits of working longer and overall improvements in employment prospects at older ages, it is

30
surprising that participation rates have not increased more among men in their late fifties and
early sixties. As policymakers debate the wisdom of increasing Social Security’s early
entitlement age, understanding why so many worker continue to retire by age 62 is a crucial
research challenge.
References Allison, Paul D. 1984. Event History Analysis. Beverly Hills, CA: Sage. Blau, David M., and Donna B. Gilleskie. 2001. “Retiree Health Insurance and the Labor Force
Behavior of Older Men in the 1990s.” Review of Economics and Statistics 83(1): 64–80. BLS. See Bureau of Labor Statistics. Bureau of Labor Statistics. 1998. “Employee Benefits in Medium and Large Private
Establishments, 1995.” Bulletin 2496. Washington, DC: U.S. Department of Labor. http://www.bls.gov/ncs/ebs/sp/ebbl0015.pdf.
———. 2007. “National Compensation Survey: Employee Benefits in Private Industry in the
United States, 2005.” Washington, DC: U.S. Department of Labor. http://www.bls.gov/ncs/ebs/sp/ebbl0022.pdf.
———. 2009. “National Compensation Survey: Employee Benefits in the United States, March
2009.” Bulletin 2731. Washington, DC: U.S. Department of Labor. http://www.bls.gov/ncs/ebs/benefits/2009/ebbl0044.pdf.
———. 2010. “Labor Force Statistics from the Current Population Survey.” Washington, DC:
U.S. Department of Labor. http://data.bls.gov:8080/PDQ/outside.jsp?survey=ln. Cahill, Kevin E., Michael D. Giandrea, and Joseph F. Quinn. 2006. “Retirement Patterns from
Career Employment.” The Gerontologist 46(4): 514–23. Dowd, Jennifer Beam, and Anna Zajacova. 2007. “Does the Predictive Power of Self-Rated
Health for Subsequent Mortality Risk Vary by Socioeconomic Status in the U.S.?” International Journal of Epidemiology 36(6): 1214–21.
Federal Interagency Forum on Aging-Related Statistics. 2008. Older Americans 2008: Key
Indicators of Well-Being. Washington, DC: U.S. Government Printing Office.

31
Friedberg, Leora. 2000. “The Labor Supply Effects of the Social Security Earnings Test.” The Review of Economics and Statistics 82(1): 48–63.
Friedberg, Leora, and Anthony Webb. 2005. “Retirement and the Evolution of Pension
Structure.” Journal of Human Resources 40(2): 281–308. Gruber, Jonathan, and Peter Orszag. 2003. “Does the Social Security Earnings Test Affect Labor
Supply and Benefits Receipt?” National Tax Journal 56(4): 755–73. Haider, Steven J., and David S. Loughran. 2008. “The Effect of the Social Security Earnings
Test on Male Labor Supply: New Evidence from Survey and Administrative Data.” Journal of Human Resources 43(1): 57–87.
Idler, Ellen L., and Yael Benyamini. 1997. “Self-Rated Health and Mortality: A Review of
Twenty-Seven Community Studies.” Journal of Health and Social Behavior 38(1): 21–37.
Johnson, Richard W. 2004. “Trends in Job Demands among Older Workers, 1992–2002.”
Monthly Labor Review 127(7): 48–56. ———. 2007. “What Happens to Health Benefits after Retirement?” Chestnut Hill, MA: Center
for Retirement Research at Boston College. Johnson, Richard W., and Cori E. Uccello. 2004. “Cash Balance Plans: What Do They Mean for
Retirement Security?” National Tax Journal 57(2, Part 1): 315–28. Johnson, Richard W., Amy J. Davidoff, and Kevin Perese. 2003. “Health Insurance Costs and
Early Retirement Decisions.” Industrial and Labor Relations Review 56(4): 716–29. Johnson, Richard W., Gordon B. T. Mermin, and Matthew Resseger. 2007. “Employment at
Older Ages and the Changing Nature of Work.” AARP Public Policy Institute Report 2007-20. Washington, DC: AARP.
Kaiser Family Foundation and Health Research and Educational Trust. 2009. Employer Health
Benefits 2009 Annual Survey. Washington, DC: Kaiser Family Foundation and Health Research and Educational Trust.
Lahey, Joanna N. 2008. “Age, Women, and Hiring: An Experimental Study.” Journal of Human
Resources 43(1): 30–56. Laschober, Mary. 2004. “Trends in Medicare Supplemental Insurance and Prescription Drug
Benefits, 1996-2001.” Menlo Park, CA: Henry J. Kaiser Family Foundation. Lumsdaine, Robin L., James H. Stock, and David A. Wise. 1996. “Retirement Incentives: The
Interaction between Employer-Provided Pensions, Social Security, and Retiree Health

32
Benefits.” In The Economic Effects of Aging in the United States and Japan, edited by Michael D. Hurd and Naohiro Yashiro (261–93). Chicago: University of Chicago Press.
Maestas, Nicole. Forthcoming. “Back to Work: Expectations and Realizations of Work after
Retirement.” Journal of Human Resources. Mermin, Gordon B. T., Richard W. Johnson, and Eric J. Toder. 2008. “Will Employers Want
Aging Boomers?” The Retirement Policy Program Discussion Paper No. 08-04. Washington, DC: The Urban Institute.
Munnell, Alicia H., Steven A. Sass, and Mauricio Soto. 2006. “Employer Attitudes Towards
Older Workers: Survey Results.” Work Opportunities for Older Americans Series 3. Chestnut Hill, MA: Center for Retirement Research at Boston College.
National Center for Health Statistics. 2010. “Health Data Interactive.”
http://www.cdc.gov/nchs/hdi.htm. Pension and Welfare Benefits Administration. 2001–2002. “Private Pension Plan Bulletin:
Abstract of 1998 Form 5500 Annual Reports.” http://www.dol.gov/ebsa/PDF/1998pensionplanbulletin.pdf.
Peracchi, Franco, and Finis Welch. 1994. “Trends in Labor Force Transitions of Older Men and
Women.” Journal of Labor Economics 12(12): 210–42. Pitt-Catsouphes, Marcie, Michael A. Smyer, Christina Matz-Costa, and Katherine Kane. 2007.
“The National Study Report: Phase II of the National Study of Business Strategy and Workforce Development.” Chestnut Hill, MA: Center on Aging and Work at Boston College.
Pollitz, Karen, Richard Sorian, and Kathy Thomas. 2001. “How Accessible Is Individual Health
Insurance for Consumers in Less-than-Perfect Health?” Washington, DC: Kaiser Family Foundation.
Reynolds, Scott, Neil Ridley, and Carl E. Van Horn. 2005. “A Work-Filled Retirement:
Workers’ Changing Views on Employment and Leisure.” Worktrends 8.1. http://www.heldrich.rutgers.edu/Resources/Publication/191/WT16.pdf.
Rogowski, Jeannette, and Lynn Karoly. 2000. “Health Insurance and retirement Behavior:
Evidence from the Health and Retirement Survey.” Journal of Health Economics 19(4): 529–39.
Rosen, Benson, and Thomas H. Jerdee. 1995. “The Persistence of Age and Sex Stereotypes in
the 1990s: The Influence of Age and Gender in Management Decisionmaking.” Public Policy Institute Issue Brief No. 22. Washington, DC: AARP.

33
Ruhm, Christopher J. 1990. “Bridge Jobs and Partial Retirement” Journal of Labor Economics 8(4): 482–501.
Samwick, Andrew A. 1998. “New Evidence on Pensions, Social Security, and the Timing of
Retirement.” Journal of Public Economics 70(2): 207–36. Social Security Administration. 2010. Annual Statistical Supplement to the Social Security
Bulletin, 2009. Washington, DC. Soldo, Beth J., Olivia S. Mitchell, Rania Tfaily, and John F. McCabe. 2007. “Cross-cohort
Differences in Health: A Multi-Level Analysis of Aggregate and Individual Influences.” In Redefining Retirement, edited by Brigitte Madrian, Olivia S. Mitchell, and Beth Soldo (138–58). New York: Oxford University Press.
Song, Jae G. 2004. “Evaluating the Initial Impact of Eliminating the Retirement Earnings Test.”
Social Security Bulletin 65(1): 1–15. Song, Jae G., and Joyce Manchester. 2007. “New Evidence on Earnings and Benefit Claims
Following Changes in the Retirement Earnings Test in 2000.” Journal of Public Economics 91(3-4): 669–700.
SSA. See Social Security Administration. Stock, James H., and David A. Wise. 1990. “Pensions, the Option Value of Work, and
Retirement.” Econometrica 58(5): 1151–80. Strauss, William, and Neil Howe. 1991. Generations: The History of America's Future, 1584 to
2069. New York: William Morrow & Company. Tran, Bac V. 2004. “The Impact of the Repeal of the Retirement Earnings Test on the Labor
Supply of Older Workers.” College Park, MD: University of Maryland.

34
Figure 1. Percentage of Older Americans Reporting Fair or Poor Health, by Age, 1983-2007
0%
5%
10%
15%
20%
25%
30%
35%
40%
1983 1986 1989 1992 1995 1998 2001 2004 2007
Source: Authors' calculations from the National Center for Health Statistics (2010).
75-84
65-74
55-64
45-54
Figure 2. Older Men's Labor Force Participation Rates, by Age, 1963-2009 (%)
0
10
20
30
40
50
60
70
80
90
100
1963 1966 1969 1972 1975 1978 1981 1984 1987 1990 1993 1996 1999 2002 2005 2008
Perc
ent
Source: Federal Interagency Forum on Aging-Related Statistics (2008) and authors' calculations from BLS (2010).
Age 55-61
Age 62-64
Age 65-69
Born 1915
Born 1915
Born 1915
Born 1935
Born 1935
Born 1935
Born 1945
Born 1945

35
Figure 3. Older Women's Labor Force Participation Rates, by Age, 1963-2007 (%)
0
10
20
30
40
50
60
70
1963 1966 1969 1972 1975 1978 1981 1984 1987 1990 1993 1996 1999 2002 2005 2008
Perc
ent
Source: Federal Interagency Forum on Aging-Related Statistics (2008) and authors' calculations from BLS (2010).
Age 55-61
Age 62-64
Age 65-69
Born 1915
Born 1915
Born 1915
Born 1935
Born 1935
Born 1935
Born 1945
Born 1945
Figure 4. Retirement Hazard Rates for Men, 1913–17 and 1933–37 Birth Cohorts
0%
10%
20%
30%
40%
50%
60%
50 51 52 53 54 55 56 57 58 59 60 61 62 63 64 65 66 67 68
Age
Haz
ard
Rat
e
Source: Authors' computations from the SIPP, matched to administrative earnings records.Note: Sample is restricted to men who were working full-time at age 49 (as defined in the text). Workers are classified as having retired when they experience a significant drop in their earnings (partially retired) or first receive zero earnings in a calendar year (fully retired).
1913–17(G.I. Generation)
1933–37(Silent Generation)

36
Figure 5. Cumulative Probability of Remaining Employed and Not Retiring for Men, 1913–17 and 1933–37 Birth Cohorts
0%
10%
20%
30%
40%
50%
60%
70%
80%
90%
100%
49 50 51 52 53 54 55 56 57 58 59 60 61 62 63 64 65 66 67 68
Age
Cum
ulat
ive
Prob
abili
ty
Source: Authors' computations from the SIPP, matched to administrative earnings records.Note: Sample is restricted to men who were working full-time at age 49 (as defined in the text).
1913–17(G.I. Generation)
1933–37(Silent Generation)
Figure 6. Retirement Hazard Rates for Women, 1913–17 and 1933–37 Birth Cohorts
0%
5%
10%
15%
20%
25%
30%
35%
40%
45%
50%
50 51 52 53 54 55 56 57 58 59 60 61 62 63 64 65 66 67 68
Age
Haz
ard
Rat
e
Source: Authors' computations from the SIPP, matched to administrative earnings records.Note: Sample is restricted to women who were working full-time at age 49 (as defined in the text). Workers are classified as having retired when they experience a significant drop in their earnings (partially retired) or first receive zero earnings in a calendar year (fully retired).
1913–17(G.I. Generation)
1933–37(Silent Generation)

37
Figure 7. Cumulative Probability of Remaining Employed and Not Retiring for Women,1913–17 and 1933–37 Birth Cohorts
0%
10%
20%
30%
40%
50%
60%
70%
80%
90%
100%
49 50 51 52 53 54 55 56 57 58 59 60 61 62 63 64 65 66 67 68
Age
Cum
ulat
ive
Prob
abili
ty
Source: Authors' computations from the SIPP, matched to administrative earnings records.Note: Sample is restricted to women who were working full-time at age 49 (as defined in the text).
1913–17(G.I. Generation)
1933–37(Silent Generation)
Figure 8. Cumulative Probability of Remaining Employed and Not Retiring for Men, by Education1913–17 and 1933–37 Birth Cohorts
0%
10%
20%
30%
40%
50%
60%
70%
80%
90%
100%
49 50 51 52 53 54 55 56 57 58 59 60 61 62 63 64 65 66 67 68
Age
Cum
ulat
ive
Prob
abili
ty
1913-17 Not HS Grad
1913-17 Attended College
1933-37 Not HS Grad
1933-37 Attended College
Source: Authors' computations from the SIPP, matched to administrative earnings records.Note: Sample is restricted to men who were working full-time or nearly full-time) at age 49 (as defined in the text).

38
Figure 9. Cumulative Probability of Remaining Employed and Not Retiring for Women, by Education1913–17 and 1933–37 Birth Cohorts
0%
10%
20%
30%
40%
50%
60%
70%
80%
90%
100%
49 50 51 52 53 54 55 56 57 58 59 60 61 62 63 64 65 66 67 68
Age
Cum
ulat
ive
Prob
abili
ty
1913-17 Not HS Grad
1913-17 Attended College
1933-37 Not HS Grad
1933-37 Attended College
Source: Authors' computations from the SIPP, matched to administrative earnings records.Note: Sample is restricted to women who were working full-time at age 49 (as defined in the text).
Figure 10. Hazard Rate of Ending Employment and Describing Oneself as Retired,Men, 1933–37 and 1943–47 Birth Cohorts
0%
5%
10%
15%
20%
25%
30%
55 56 57 58 59 60 61 62 63 64 65 66 67 68 69 70
Age
Haz
ard
Rat
e
Source: Authors' calculations from the HRS.Note: Estimates are restricted to men who were working and not retired at age 54.
1933–37(Silent Generation)
1943–47(Baby Boom)

39
Figure 11. Hazard Rate of Ending Employment, Men, 1933–37 and 1943–47 Birth Cohorts
0%
5%
10%
15%
20%
25%
30%
55 56 57 58 59 60 61 62 63 64 65 66 67 68 69 70
Age
Haz
ard
Rat
e
Source: Authors' calculations from the HRS.Note: Estimates are restricted to men who were employed at age 54.
1933–37(Silent Generation)
1943–47(Baby Boom)
Figure 12. Hazard Rate of Describing Oneself as Retired, Men, 1933–37 and 1943–47 Birth Cohorts
0%
5%
10%
15%
20%
25%
30%
35%
55 56 57 58 59 60 61 62 63 64 65 66 67 68 69 70
Age
Haz
ard
Rat
e
Source: Authors' calculations from the HRS.Note: Estimates are restricted to men who were not retired at age 54.
1933–37(Silent Generation)
1943–47(Baby Boom)

40
Figure 13. Cumulative Probability of Remaining at Work and Not Yet Described Oneself as Retired, Men, 1933–37 and 1943–47 Birth Cohorts
0%
10%
20%
30%
40%
50%
60%
70%
80%
90%
100%
54 55 56 57 58 59 60 61 62 63 64 65 66 67 68 69 70
Age
Cum
ulat
ive
Prob
abili
ty
Source: Authors' calculations from the HRS.Note: Estimates are restricted to men who were working and not retired at age 54.
1933–37
1943–47(Baby Boom)
Figure 14. Cumulative Probability of Remaining at Work, Men, 1933–37 and 1943–47 Birth Cohorts
0%
10%
20%
30%
40%
50%
60%
70%
80%
90%
100%
54 55 56 57 58 59 60 61 62 63 64 65 66 67 68 69 70
Age
Cum
ulat
ive
Prob
abili
ty
Source: Authors' calculations from the HRS.Note: Estimates are restricted to men who were employed at age 54.
1933–37(Silent Generation)
1943–47(Baby Boom)

41
Figure 15. Cumulative Probability of Not Yet Describing Oneself as Retired, Men, 1933–37 and 1943–47 Birth Cohorts
0%
10%
20%
30%
40%
50%
60%
70%
80%
90%
100%
54 55 56 57 58 59 60 61 62 63 64 65 66 67 68 69 70
Age
Cum
ulat
ive
Prob
abili
ty
Source: Authors' calculations from the HRS.Note: Estimates are restricted to men who were not retired at age 54.
1933–37(Silent Generation)
1943–47(Baby Boom)
Figure 16. Hazard Rate of Ending Employment and Describing Oneself as Retired,Women, 1933–37 and 1943–47 Birth Cohorts
0%
5%
10%
15%
20%
25%
30%
35%
55 56 57 58 59 60 61 62 63 64 65 66 67 68 69 70
Age
Haz
ard
Rat
e
Source: Authors' calculations from the HRS.Note: Estimates are restricted to women who were not retired at age 54.
1933–37(Silent Generation)
1943–47(Baby Boom)
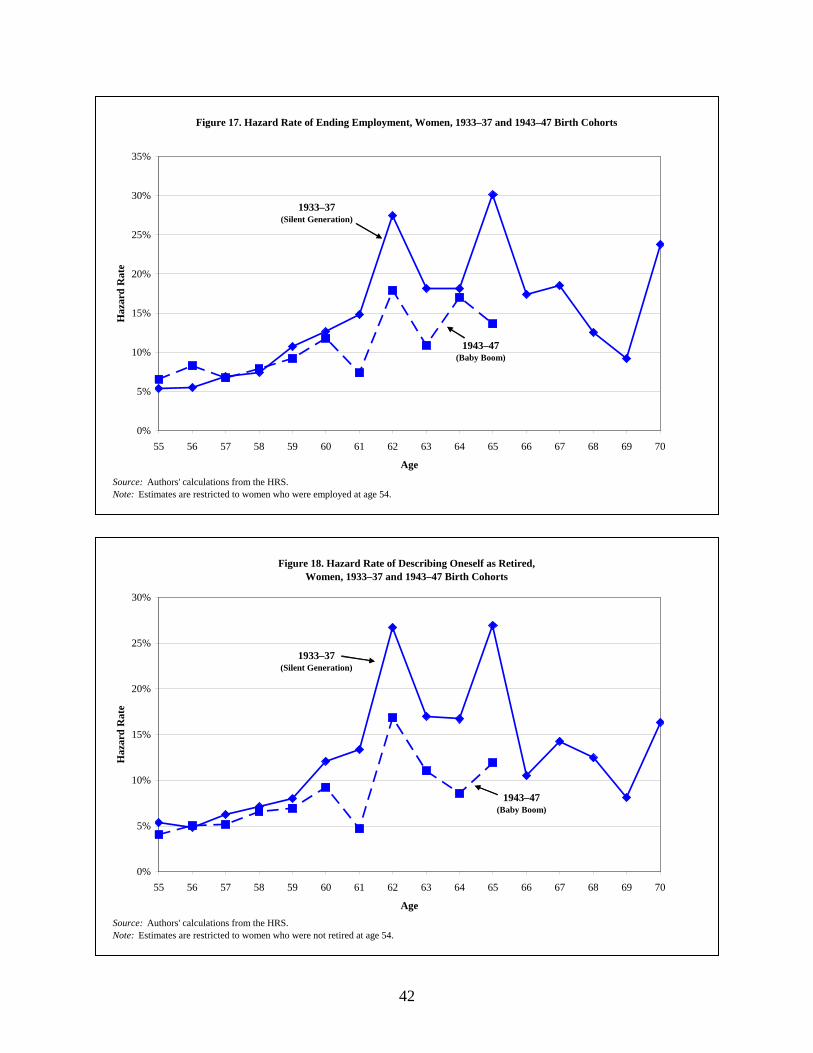
42
Figure 17. Hazard Rate of Ending Employment, Women, 1933–37 and 1943–47 Birth Cohorts
0%
5%
10%
15%
20%
25%
30%
35%
55 56 57 58 59 60 61 62 63 64 65 66 67 68 69 70
Age
Haz
ard
Rat
e
Source: Authors' calculations from the HRS.Note: Estimates are restricted to women who were employed at age 54.
1933–37(Silent Generation)
1943–47(Baby Boom)
Figure 18. Hazard Rate of Describing Oneself as Retired,Women, 1933–37 and 1943–47 Birth Cohorts
0%
5%
10%
15%
20%
25%
30%
55 56 57 58 59 60 61 62 63 64 65 66 67 68 69 70
Age
Haz
ard
Rat
e
Source: Authors' calculations from the HRS.Note: Estimates are restricted to women who were not retired at age 54.
1933–37(Silent Generation)
1943–47(Baby Boom)

43
Figure 19. Cumulative Probability of Remaining at Work and Not Yet Describing Oneself as Retired,Women, 1933–37 and 1943–47 Birth Cohorts
0%
10%
20%
30%
40%
50%
60%
70%
80%
90%
100%
54 55 56 57 58 59 60 61 62 63 64 65 66 67 68 69 70
Age
Cum
ulat
ive
Prob
abili
ty
Source: Authors' calculations from the HRS.Note: Estimates are restricted to women who were working and not retired at age 54.
1933–37(Silent Generation)
1943–47(Baby Boom)
Figure 20. Cumulative Probability of Remaining at Work,Women, 1933–37 and 1943–47 Birth Cohorts
0%
10%
20%
30%
40%
50%
60%
70%
80%
90%
100%
54 55 56 57 58 59 60 61 62 63 64 65 66 67 68 69 70
Age
Cum
ulat
ive
Prob
abili
ty
Source: Authors' calculations from the HRS.Note: Estimates are restricted to women who were employed at age 54.
1933–37(Silent Generation)
1943–47(Baby Boom)

44
Figure 21. Cumulative Probability of Not Yet Descibing Oneself as Retired,Women, 1933–37 and 1943–47 Birth Cohorts
0%
10%
20%
30%
40%
50%
60%
70%
80%
90%
100%
54 55 56 57 58 59 60 61 62 63 64 65 66 67 68 69 70
Age
Cum
ulat
ive
Prob
abili
ty
Source: Authors' calculations from the HRS.Note: Estimates are restricted to women not retired at age 54.
1933–37(Silent Generation)
1943–47(Baby Boom)
Figure 22. Cumulative Probability of Remaining at Work and Not Yet Describing Oneself as Retired, by Education, Men, 1933–37 and 1943–47 Birth Cohorts
0%
10%
20%
30%
40%
50%
60%
70%
80%
90%
100%
54 55 56 57 58 59 60 61 62 63 64 65 66 67 68 69 70
Age
Cum
ulat
ive
Prob
abili
ty
1933-37 Not HS grad1933-37 Attended college1943-47 Not HS grad1943-47 Attended college
Source: Authors' calculations from the HRS.Note: Estimates are restricted to men and women who were working and not retired at age 54.

45
Figure 23. Cumulative Probability of Remaining at Work and Not Yet Describing Oneself as Retired, by Education, Women, 1933–37 and 1943–47 Birth Cohorts
0%
10%
20%
30%
40%
50%
60%
70%
80%
90%
100%
54 55 56 57 58 59 60 61 62 63 64 65 66 67 68 69 70
Age
Cum
ulat
ive
Prob
abili
ty
1933-37 Not HS Grad1933-37 Attended College1943-47 Not HS Grad1943-47 Attended College
Source: Authors' calculations from the HRS.Note: Estimates are restricted to men and women who were working and not retired at age 54.

46
Table 1. Differences in Social Security Provisions by Birth Year
1913-15 1916 1917 1933 1934 1935-36 1937 1943-47
Year turned age 62
Full retirement age (FRA)Share of full retired worker benefits paid at age 62Share of full spousal benefits paid at age 62
Annual delayed retirement credit for working at age 66
Benefits if begin collecting at age 67, relative to benefits if begin collecting at age 621
Ages subject to retirement earnings test
1975-77
65
80%
75%
1.0%
127.5%
62-70
1978
65
80%
75%
3.0%
130.0%
62-70
1979
65
80%
75%
3.0%
132.5%
62-70
1995
65
80%
75%
5.5%
138.8%
62-66
1996
65
80%
75%
5.5%
138.8%
62-65
1997-98
65
80%
75%
6.0%
140.0%
62-65
1999
65
80%
75%
6.5%
141.3%
62-65
2005-09
66
75%
70%
8.0%
144.0%
62-66
Source: Authors' calculations.Note: 1. This calculation shows the impareach age 62.
ct of delayed claiming, under the assumption that beneficiaries do not work once they

47
Table 2. Characteristics of Men and Women Working and Not Retired at Age 49, 1913-17 and 1933-37 Birth Cohorts (%)
1913-17 1913-17(G.I. Gen) (G.I. Gen)
EducationDid not complete high school 47.1 12.9 ** 38.9 10.4 **High school graduate 31.1 33.6 32.6 38.8 **Some college 18.6 53.5 ** 26.4 50.8 **Missing 3.2 0.0 2.1 0.0
Race and ethnicityNon-Hispanic white 88.9 82.5 ** 91.6 84.8 **African American 6.3 8.8 6.6 10.2 **Hispanic 4.1 5.2 1.5 3.8 **Other 0.8 3.5 ** 0.3 1.1 **
Marital Status at Age 67-71Married 79.9 82.4 42.7 59.6 **Not married 20.1 17.6 57.3 40.4 **
Health-Related Work Limitation at Age 67-71Yes 40.2 24.8 ** 37.5 17.4 **No 59.8 75.2 ** 62.5 82.6 **
Observations 679 1,039 427 844
Source: Authors' estimates from the SIPP, matched to administrative earnings records.
** differs significantly from the value for the earlier cohort (p < .05)
WomenMen
* differs from the value for the earlier cohort (.05 < p < .10)
(Silent Gen) (Silent Gen)1933-37 1933-37

48
Table 3. Characteristics of Men and Women Employed at Age 54, 1933-37 and 1943-47 Birth Cohorts
Men Women1933-1937
(Silent Gen.)1943-1947(Boomers)
1933-1937 1943-1947(Silent Gen.) (Boomers)
Education (%)Did not complete high schoolHigh school graduateSome college, less than 4 yearsBachelor's degree or more
Race (%)Non-Hispanic whiteAfrican AmericanHispanic Other
Married (%)
Health-related work limitation (%)
Fair or poor health (%)
Access to retiree health insurance (%)
Pension coverage (%)Defined benefit planDefined contribution plan onlyNone
Earnings ($2008)MeanMedian
Household wealth, excluding housing ($2008)MeanMedian
Zero or Negative Wealth (%)
N
21.035.719.523.8
83.18.85.82.3
85.1
11.0
13.1
46.8
37.931.530.5
58,37947,424
302,55388,524
5.9
1519
9.2 **33.323.4 *34.1 **
82.27.87.12.7
83.8
6.2 **
9.9 **
34.5 **
40.135.024.8 **
60,78251,060
279,38898,473
4.9
652
19.044.719.217.1
82.610.74.72.1
67.2
9.1
13.4
31.6
33.625.540.8
29,20325,293
232,18669,871
7.9
1309
8.4 **34.0 **30.3 **27.4 **
81.79.16.5 *2.7
66.9
10.5
14.1
26.9 **
29.2 *33.4 **37.4
37,247 **30,393 **
240,84176,590
7.8
853
Source : Authors' estimates from 1992-2008 waves of the Health and Retirement Study (HRS).
Notes : The sample was restricted to noninstitutionalized adults age 55 to 59 in 1992 and age 55 to 59 in 2002 who were working at baseline and were observed for six years or until they stopped working. Characteristics were measured at survey baseline.* differs from the value for the earlier cohort (.05 < p < .10)** differs significantly from the value for the earlier cohort (p < .05)

49
Table 4. Estimated Marginal Effects on the Likelihood of Retirement for Men in the 1933-37 and 1943-47Birth Cohorts, Under Alternative Retirement Definitions
Describe Oneself as Stop Work and Stop Work Retired Retired
1933-37 1943-47 1933-37 1943-47 1933-37 1943-47(Silent G.) (Boomers) (Silent G.) (Boomers) (Silent G.) (Boomers)
Education
Did not complete high school 0.011 0.039 -0.005 0.091* -0.008 0.054 (0.018) (0.036) (0.021) (0.050) (0.016) (0.040)
[Reference: High school graduate] — — — — — —
Some college, fewer than 4 years 0.006 0.012 0.000 -0.006 0.005 -0.006 (0.019) (0.026) (0.022) (0.029) (0.017) (0.024)
Bachelor's degree or more -0.073** -0.009 -0.081** -0.047* -0.058** -0.027 (0.016) (0.025) (0.018) (0.027) (0.014) (0.022)
Race
African American -0.027 0.017 -0.015 0.063 -0.026 0.009 (0.020) (0.035) (0.026) (0.051) (0.018) (0.033)
Hispanic -0.032 -0.068** -0.047* -0.092** -0.037* -0.087** (0.025) (0.026) (0.028) (0.028) (0.020) (0.021)
Other -0.034 -0.034 -0.044 -0.088* -0.017 -0.061 (0.039) (0.048) (0.041) (0.049) (0.034) (0.043)
[Reference: Non-Hispanic white] — — — — — —
Married -0.062** 0.000 -0.043 0.030 -0.024 0.032 (0.024) (0.027) (0.027) (0.028) (0.020) (0.022)
Health-related work limitation 0.094** 0.090** 0.075** 0.031 0.048** 0.033 (0.028) (0.039) (0.031) (0.040) (0.023) (0.032)
Fair or poor health 0.078** 0.069** 0.075** 0.149** 0.052** 0.116**(0.023) (0.034) (0.027) (0.048) (0.021) (0.040)
Retiree health insurance offered 0.060** 0.050** 0.048** 0.019 0.039** 0.031 (0.016) (0.021) (0.018) (0.023) (0.014) (0.020)
Pension coverageDefined benefit plan 0.084** 0.054** 0.105** 0.086** 0.085** 0.079**
(0.018) (0.022) (0.020) (0.026) (0.016) (0.021)
Defined contribution plan only -0.020 -0.021 -0.012 -0.024 -0.012 -0.029 (0.015) (0.021) (0.017) (0.024) (0.013) (0.019)
[Reference: None] — — — — — —
Log of previous wave's earnings -0.003 -0.000 -0.006** -0.001 -0.003* -0.001 ($2008) (0.002) (0.003) (0.002) (0.003) (0.002) (0.002)
(continued)

50
Table 4. (continued)
1933-37 1943-47 1933-37 1943-47 1933-37 1943-47(Silent G.) (Boomers) (Silent G.) (Boomers) (Silent G.) (Boomers)
Log of previous wave's household wealth (excluding housing) ($2008) 0.015** -0.006 0.020** 0.006 0.016** 0.001
(0.004) (0.006) (0.005) (0.007) (0.004) (0.006)
Zero or negative household wealth (excluding housing) in previous year 0.324** -0.037 0.288** 0.035 0.278** 0.009
(0.089) (0.060) (0.102) (0.101) (0.096) (0.072)
Age
[Reference: 55] — — — — — —
56 -0.069** 0.003 -0.038 0.001 -0.051* 0.009 (0.027) (0.048) (0.039) (0.056) (0.027) (0.052)
57 -0.006 -0.032 0.027 -0.007 0.016 0.022 (0.031) (0.038) (0.041) (0.047) (0.033) (0.047)
58 0.030 -0.008 0.072* -0.017 0.046 0.030 (0.033) (0.042) (0.043) (0.047) (0.035) (0.050)
59 0.070** 0.042 0.115** 0.045 0.096** 0.073 (0.034) (0.043) (0.044) (0.050) (0.037) (0.050)
60 0.225** 0.147** 0.299** 0.149** 0.247** 0.163**(0.046) (0.059) (0.055) (0.068) (0.052) (0.068)
61 0.290** 0.226** 0.356** 0.292** 0.323** 0.265**(0.050) (0.067) (0.057) (0.078) (0.056) (0.080)
62 0.232** 0.041 0.282** 0.126 0.236** 0.158* (0.064) (0.067) (0.075) (0.091) (0.070) (0.093)
63 and older 0.287** 0.105 0.396** 0.149* 0.365** 0.202**(0.078) (0.078) (0.082) (0.087) (0.085) (0.095)
N 3258 1508 2651 1184 3232 1320
Mean of dependent variable 0.202 0.174 0.219 0.188 0.166 0.151
Chi-squared (25) 296.161 94.446 245.224 98.915 280.813 98.966
Pseudo R-squared 0.101 0.067 0.105 0.090 0.112 0.088
Source : Authors' estimates from 1992-2008 waves of the Health and Retirement Study (HRS).
* 0.05 < p < 0.1** p < 0.05
Note : The table reports marginal effects estimated from discrete-time hazard models, in which the dependent variable equaled one if the respondent stopped working, retired, or both stopped working and retired by the next wave (zero otherwise). Standard errors are shown in parentheses. The sample was restricted to noninstitutionalized men age 55 to 59 in 1992 and age 55 to 59 in 2002 who were working at baseline. They were observed for up to six years until they retired or dropped out of the sample.
Stop WorkDescribe Oneself as
RetiredStop Work and
Retired

51
Table 5. Estimated Marginal Effects on the Likelihood of Retirement for Women in the 1933-37 and 1943-47Birth Cohorts, Under Alternative Retirement Definitions
1933-37 1943-47 1933-37 1943-47 1933-37 1943-47(Silent G.) (Boomers) (Silent G.) (Boomers) (Silent G.) (Boomers)
Education
Did not complete high school -0.013 0.051 -0.035* 0.028 -0.024 0.023 (0.022) (0.039) (0.020) (0.034) (0.017) (0.030)
[Reference: High school graduate] — — — — — —
Some college, fewer than 4 years -0.007 -0.005 -0.012 0.002 -0.008 0.005 (0.022) (0.024) (0.021) (0.023) (0.018) (0.020)
Bachelor's degree or more 0.010 0.001 0.023 -0.007 0.023 -0.012 (0.025) (0.026) (0.025) (0.025) (0.022) (0.022)
Race
African American 0.004 0.068** -0.003 0.063* -0.011 0.049* (0.023) (0.034) (0.021) (0.034) (0.018) (0.029)
Hispanic -0.024 0.116** -0.048 0.096** -0.052** 0.087** (0.033) (0.046) (0.029) (0.041) (0.023) (0.038)
Other -0.061 0.085 -0.042 -0.015 -0.058 -0.033 (0.055) (0.077) (0.053) (0.064) (0.041) (0.049)
[Reference: Non-Hispanic white] — — — — — —
Married 0.056** 0.036* 0.052** 0.020 0.044** 0.019 (0.018) (0.021) (0.017) (0.020) (0.015) (0.017)
Health-related work limitation 0.083** 0.182** 0.111** 0.164** 0.059** 0.145**(0.032) (0.040) (0.030) (0.038) (0.025) (0.034)
Fair or poor health 0.104** 0.052* 0.103** 0.044 0.084** 0.021 (0.029) (0.028) (0.028) (0.028) (0.025) (0.024)
Retiree health insurance offered 0.045** 0.031 0.029 0.047** 0.026* 0.040**(0.019) (0.022) (0.018) (0.022) (0.015) (0.019)
Pension coverageDefined benefit plan -0.021 0.004 0.006 0.022 0.009 0.022
(0.018) (0.023) (0.018) (0.022) (0.015) (0.019)
Defined contribution plan only -0.048** -0.077** -0.023 -0.065** -0.013 -0.055**(0.018) (0.020) (0.018) (0.019) (0.016) (0.017)
[Reference: None] — — — — — —
Log of previous wave's earnings -0.009** -0.002 -0.009** -0.002 -0.004 -0.000 ($2008) (0.003) (0.003) (0.003) (0.003) (0.002) (0.002)
Log of previous wave's household wealth (excluding housing) ($2008) 0.012** 0.000 0.016** 0.013** 0.012** 0.013**
(0.005) (0.006) (0.005) (0.006) (0.004) (0.005)
Stop WorkDescribe Oneself as
RetiredStop Work and
Retired
(continued)

52
Table 5. (continued)
1933-37 1943-47 1933-37 1943-47 1933-37 1943-47(Silent G.) (Boomers) (Silent G.) (Boomers) (Silent G.) (Boomers)
Zero or negative household wealth (excluding housing) in previous year 0.153** -0.046 0.174** 0.087 0.132* 0.111
(0.077) (0.060) (0.080) (0.091) (0.069) (0.091)
Age
[Reference: 55] — — — — — —
56 0.020 -0.004 0.070 0.085 0.068 0.060 (0.046) (0.048) (0.055) (0.069) (0.052) (0.063)
57 0.098** -0.006 0.099** 0.088 0.119** 0.093* (0.045) (0.040) (0.050) (0.055) (0.051) (0.054)
58 0.140** 0.106** 0.190** 0.183** 0.200** 0.179**(0.046) (0.048) (0.054) (0.065) (0.055) (0.063)
59 0.153** 0.100** 0.195** 0.153** 0.188** 0.140**(0.044) (0.043) (0.051) (0.056) (0.051) (0.054)
60 0.312** 0.113** 0.361** 0.255** 0.366** 0.217**(0.052) (0.053) (0.060) (0.072) (0.062) (0.069)
61 0.408** 0.201** 0.498** 0.338** 0.473** 0.301**(0.052) (0.057) (0.055) (0.073) (0.060) (0.072)
62 0.365** 0.163** 0.404** 0.315** 0.421** 0.322**(0.068) (0.073) (0.075) (0.088) (0.077) (0.087)
63 and older 0.466** 0.255** 0.543** 0.388** 0.577** 0.413**(0.069) (0.081) (0.067) (0.091) (0.066) (0.089)
N 2826 1893 2696 1815 3070 2008
Mean of dependent variable 0.241 0.213 0.218 0.188 0.187 0.167
Chi-squared (25) 231.006 125.172 282.090 125.567 278.289 124.950
Pseudo R-squared 0.076 0.064 0.103 0.079 0.096 0.075
Source : Authors' estimates from 1992-2008 waves of the Health and Retirement Study (HRS).
* 0.05 < p <0.1** p < 0.05
Note: The table reports marginal effects estimated from discrete-time hazard models, in which the dependent variable equaled one if the respondent stopped working, retired, or both stopped working and retired by the next wave (zero otherwise). Standard errors are shown in parentheses. The sample was restricted to noninstitutionalized women age 55 to 59 in 1992 and age 55 to 59 in 2002 who were working at baseline. They were observed for up to six years, until they retired or dropped out of the sample.
Stop WorkDescribe Oneself as
RetiredStop Work and
Retired

53
Table 6. Incidence of Work Transitions Between Ages 50 and 69 for Men and Women Not Retired at Age 49, by Sex and Birth Cohort (%)
Men Women
First Transition Later Transitions1913-17 1933-37
(G.I. Gen) (Silent Gen.)1913-17 1933-37
(G.I. Gen) (Silent Gen.)
None (never retire)
Partially Retire None (remain partially retired)Move from partial to full retirement and never return to workUnretire at some pointOtherTotal
Fully Retire None (remain fully retired)Unretire at some pointOtherTotal
Number of observations
5.8
7.7
9.714.7
0.732.8
51.14.95.4
61.3
679
5.7
12.1 ***
11.618.1 *
3.7 ***45.4 ***
34.3 ***7.5 **7.0
48.9 ***
1,039
2.1
2.9
7.314.3
0.825.3
60.17.84.6
72.6
427
6.8 ***
6.7 ***
10.5 **21.5 ***
2.6 ***41.3 ***
37.4 ***7.76.8 *
51.9 ***
844
Source: Authors' calculations from the SIPP, matched to administrative earnings records.
Note: The sample was restricted to adults who were working full-time (or nearly full-time) at age 49. Workers were classified as having retired when they experienced a significant drop in their earnings (partially retired) or first received zero earnings in a calendar year (fully retired). Asterisks indicate that the value differed significantly from the value for the 1913-17 cohort (* .05 < p < .10; ** .01 < p < .05; *** p < .01).
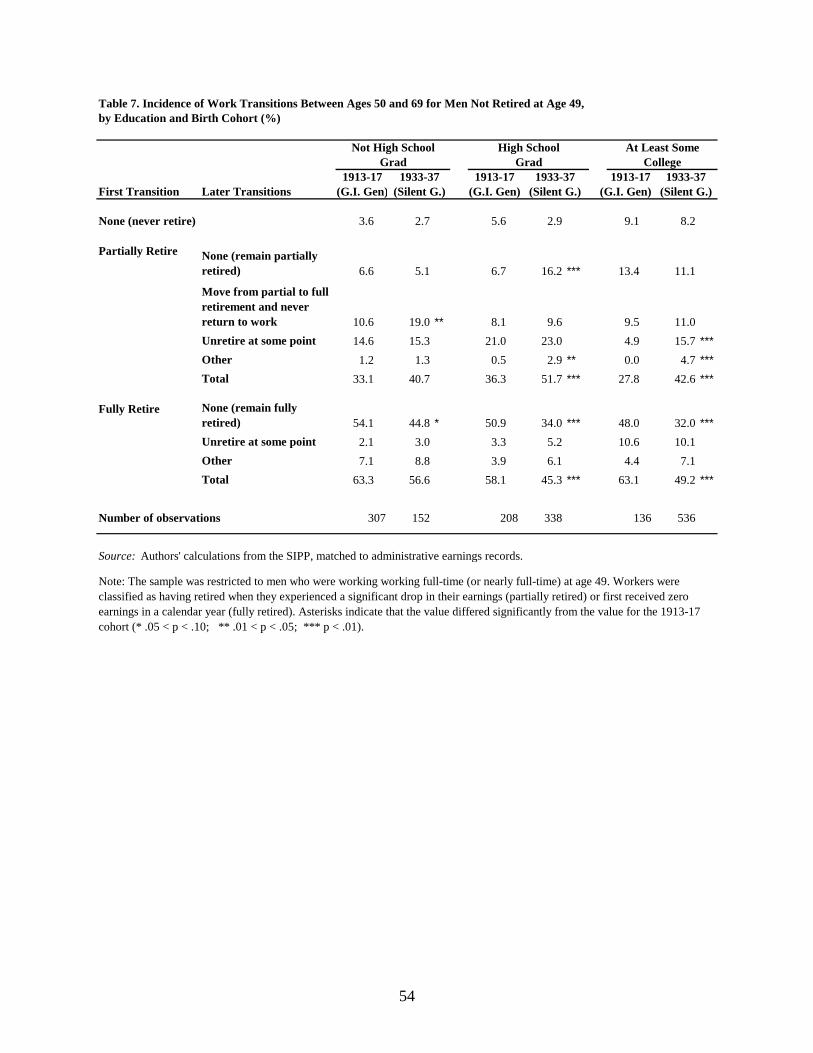
54
Table 7. Incidence of Work Transitions Between Ages 50 and 69 for Men Not Retired at Age 49, by Education and Birth Cohort (%)
Not High School High School At Least SomeGrad Grad College
1913-17 1933-37 1913-17 1933-37 1913-17 1933-37First Transition Later Transitions (G.I. Gen) (Silent G.) (G.I. Gen) (Silent G.) (G.I. Gen) (Silent G.)
None (never retire) 3.6 2.7 5.6 2.9 9.1 8.2
Partially Retire None (remain partially retired) 6.6 5.1 6.7 16.2 *** 13.4 11.1
Move from partial to full retirement and never return to work 10.6 19.0 ** 8.1 9.6 9.5 11.0Unretire at some point 14.6 15.3 21.0 23.0 4.9 15.7 ***Other 1.2 1.3 0.5 2.9 ** 0.0 4.7 ***Total 33.1 40.7 36.3 51.7 *** 27.8 42.6 ***
Fully Retire None (remain fully retired) 54.1 44.8 * 50.9 34.0 *** 48.0 32.0 ***Unretire at some point 2.1 3.0 3.3 5.2 10.6 10.1Other 7.1 8.8 3.9 6.1 4.4 7.1Total 63.3 56.6 58.1 45.3 *** 63.1 49.2 ***
Number of observations 307 152 208 338 136 536
Source: Authors' calculations from the SIPP, matched to administrative earnings records.
Note: The sample was restricted to men who were working working full-time (or nearly full-time) at age 49. Workers were classified as having retired when they experienced a significant drop in their earnings (partially retired) or first received zero earnings in a calendar year (fully retired). Asterisks indicate that the value differed significantly from the value for the 1913-17 cohort (* .05 < p < .10; ** .01 < p < .05; *** p < .01).

55
Table 8. Incidence of Work Transitions Between Ages 50 and 69 for Women Not Retired at Age 49, by Education and Birth Cohort (%)
Not High School High School At Least SomeGrad Grad College
1913-17 1933-37 1913-17 1933-37 1913-17 1933-37First Transition Later Transitions (G.I. Gen) (Silent G.) (G.I. Gen) (Silent G.) (G.I. Gen) (Silent G.)
None (never retire) 4.7 3.8 0.0 2.9 *** 1.1 10.3 ***
Partially Retire None (remain partially retired) 0.0 2.6 * 2.0 10.4 *** 6.9 4.6
Move from partial to full retirement and never return to work 9.1 14.3 9.6 6.3 2.4 13.0 ***Unretire at some point 21.0 29.1 10.0 20.9 *** 9.2 20.3 ***Other 0.0 0.0 0.0 5.4 2.9 1.1Total 30.1 46.0 *** 21.7 43.0 *** 21.4 39.1 ***
Fully Retire None (remain fully retired) 54.2 42.6 ** 61.3 39.9 *** 67.5 34.4 ***Unretire at some point 6.9 1.4 ** 10.3 8.8 6.7 8.2Other 4.1 6.3 6.7 5.4 3.2 8.0 **Total 65.1 50.2 ** 78.3 54.1 *** 77.5 50.6 ***
Number of observations 164 125 139 296 103 418
Source: Authors' calculations from the SIPP, matched to administrative earnings records.
Note: The sample was restricted to women who were working full time (or nearly full time) at age 49. Workers were classified as having retired when they experienced a significant drop in their earnings (partially retired) or first received zero earnings in a calendar year (fully retired). Asterisks indicate that the value differs significantly from the value for the 1913-17 cohort (* .05 < p < .10; ** .01 < p < .05; *** p < .01).

56
RECENT WORKING PAPERS FROM THE CENTER FOR RETIREMENT RESEARCH AT BOSTON COLLEGE
Spousal Health Shocks and the Timing of the Retirement Decision in the Face of Forward-Looking Financial Incentives Courtney Harold Van Houtven and Norma B. Coe, June 2010 Incorporating Employee Heterogenity Into Default Rules for Retirement Plan Selection Gopi Shah Godi and Colleen Flaherty Manchester, May 2010 Accurately Measuring Health Over the Life Course Fabian Lange and Doug McKee, May 2010 Getting to the Top of Mind: How Reminders Increase Saving Dean Karlan, Margaret McConnell, Sendhil Mullainathan, and Jonathan Zinman, April 2010 The Shrinking Tax Preference for Pension Savings: An Analysis of Income Tax Changes, 1985-2007 Gary Burtless and Eric Toder, March 2010 Social Security, Benefit Claiming and Labor Force Participation: A Quantitative General Equilibrium Approach Selahattin İmrohoroğlu and Sagiri Kitao, March 2010 How Much Is Enough? The Distribution of Lifetime Health Care Costs Anthony Webb and Natalia Zhivan, February 2010 Impact of Immigration on the Distribution of American Well-Being Gary Burtless, December 2009 Actual and Anticipated Inheritance Receipts Norma B. Coe and Anthony Webb, December 2009 Will Automatic Enrollment Reduce Employer Contributions to 401(k) Plans Mauricio Soto and Barbara A. Butrica, December 2009 How Seniors Change Their Asset Holdings During Retirement Karen Smith, Mauricio Soto, and Rudolph G. Penner, December 2009
All working papers are available on the Center for Retirement Research website (http://crr.bc.edu) and can be requested by e-mail ([email protected]) or phone (617-552-1762).