Word recognition skill and academic success across ...
24
M. Harrington & T. Roche 76 Word recognition skill and academic success across disciplines in an ELF university setting Michael Harrington University of Queensland, Australia Thomas Roche 1 Southern Cross University College, Australia Previous research (Harrington & Roche, 2014) showed that the Timed Yes/No Test (a measure of vocabulary size and response speed) is an effective tool for screening undergraduate students at risk of failure in English-as-a-Lingua-Franca (ELF) university settings. This study examines how well performance on the test predicts grade point averages across different academic disciplines in one of those contexts, an ELF university in Oman. First year students (N= 280) from four academic disciplines (Humanities, IT, Business and Engineering) completed Basic and Advanced versions of the Timed Yes/No Test. The predictive validity of word recognition accuracy (a proxy for size) and response time measures on GPA outcomes were examined independently and in combination. Two patterns emerged. Word accuracy was a better predictor of academic performance than response time for three of the groups, Engineering the exception, accounting for as much as 25% of variance in GPA. Response time accounted for no additional unique variance in the three groups after accuracy scores were accounted for. In contrast, accuracy was not a significant predictor of GPA for the Engineering group but response time was, accounting for 40% of the variance in academic performance. The findings are related to the use of the Timed Yes/No Test as a reliable and cost-effective screening tool in Post Enrolment Language Assessment (PELA) applications in ELF settings. Key words: vocabulary size, recognition speed, academic performance, screening, academic English 1 Michael Harrington, School of Languages & Comparative Cultural Studies, University of Queensland, St Lucia 4072, Queensland, Australia. E-mail: [email protected].
Transcript of Word recognition skill and academic success across ...

M. Harrington & T. Roche
76
Word recognition skill and academic success across
disciplines in an ELF university setting
Michael Harrington
University of Queensland, Australia
Thomas Roche1
Southern Cross University College, Australia
Previous research (Harrington & Roche, 2014) showed that the
Timed Yes/No Test (a measure of vocabulary size and response
speed) is an effective tool for screening undergraduate students
at risk of failure in English-as-a-Lingua-Franca (ELF) university
settings. This study examines how well performance on the test
predicts grade point averages across different academic
disciplines in one of those contexts, an ELF university in Oman.
First year students (N= 280) from four academic disciplines
(Humanities, IT, Business and Engineering) completed Basic
and Advanced versions of the Timed Yes/No Test. The
predictive validity of word recognition accuracy (a proxy for
size) and response time measures on GPA outcomes were
examined independently and in combination. Two patterns
emerged. Word accuracy was a better predictor of academic
performance than response time for three of the groups,
Engineering the exception, accounting for as much as 25% of
variance in GPA. Response time accounted for no additional
unique variance in the three groups after accuracy scores were
accounted for. In contrast, accuracy was not a significant
predictor of GPA for the Engineering group but response time
was, accounting for 40% of the variance in academic
performance. The findings are related to the use of the Timed
Yes/No Test as a reliable and cost-effective screening tool in
Post Enrolment Language Assessment (PELA) applications in
ELF settings.
Key words: vocabulary size, recognition speed, academic
performance, screening, academic English
1 Michael Harrington, School of Languages & Comparative Cultural Studies, University of Queensland, St Lucia 4072,
Queensland, Australia. E-mail: [email protected].
Papers in Language Testing and Assessment Vol. 3, Issue 2, 2014 77
Introduction
The past two decades have witnessed a substantial growth in the number of
English-medium programs offered by universities in countries where English is
used as a foreign or second language (L2). From 2002 to 2007 the number of
English-medium programs tripled in European universities (Wächter &
Maiworm, 2008), with a 2011 UNESCO report noting that English had become
the most prevalent language of instruction in universities globally (Tilak, 2011).
The spread of English medium instruction has been abetted by the increasing
institutional emphasis on research publications and international rankings
which are heavily biased toward research reported in English, as well the
perceived quality of tertiary programs from traditional English speaking
countries. The latter has acted as a driver for Asian nations such as the
Philippines and Malaysia to develop English-medium university programs,
often in partnership with universities in English L1 countries (Bashir, 2007;
Kirkpatrick, 2011). The Arab Gulf states provide a particularly salient example
of this trend, with roughly 40 branch campus universities from Britain,
Australia and America established in the United Arab Emirates and Qatar alone
between 2000 and 2007 (Weber, 2011). These settings, where speakers from a
range of L1 backgrounds use English to communicate with each other, are
increasingly referred to as English-as-a-Lingua-Franca (ELF) settings (Jenkins,
2007; Kirkpatrick, 2011).
We recognise that the use of the term ELF is not without its critics. Some
question the relevance of distinguishing ELF contexts from traditional English
as a Second Language (ESL) contexts like those involving foreign students
studying in Australia, especially for assessment purposes (Elder & Davies, 2007;
see also Swan, 2012 and related exchanges). However, we believe the ELF
setting presents conditions, processes and outcomes that differ distinctively
from the traditional ESL setting. In the ELF university students’ English skills
are typically developed, maintained and used within an educational
community (staff and students) consisting of mainly English L2 users, in a
setting where English has limited use in the wider-society beyond the
university. As a result, English proficiency levels in ELF university contexts are
usually much lower than in universities in traditional English-speaking
countries (i.e. ESL contexts). This is reflected in typically lower English
language requirements for ELF universities in general and for the site of this
study in particular (e.g. Oman Academic Accreditation Authority, 2008; Roche
& Harrington, 2013). Students in these settings are at risk of academic failure in
both individual subjects and entire degree programs, with negative
consequences for the individual student, the institution, and the larger society
M. Harrington & T. Roche
78
(Berman & Cheng, 2001; Coleman, 2006). The presence of large numbers of such
at-risk students can also have a substantial impact on teaching and learning
outcomes for other students. This is evident both in programs where there is a
mix of L1 and L2 users and those where students and teachers share the same
native cultural and linguistic background (Cheng, Myles, & Curtis, 2004;
Terraschke & Wahid, 2011). It is important to note that at-risk students have
typically met the university entry requirements for English language
proficiency. As such, the institution presumably has some responsibility for the
language-related difficulties these individuals might encounter post-enrolment
(Fox, 2005; Tonkyn, 1995).
Adequate English proficiency is crucial for academic success in ELF university
programs. The ability to read texts, understand lectures, participate in class
discussions, sit exams and write assignments demands a significant level of
skill in academic and communicative English (Baik & Greig, 2009; Evans &
Morrison, 2011). But while English language proficiency is generally assumed
to play a major role in academic performance, evidence for a direct link is
mixed. A number of studies have reported a substantial relationship between
English proficiency and academic performance (Barton & Neville-Barton, 2003;
Laufer, 1992; Loewen & Ellis, 2004), while others report lesser, or no, link
between the two (Bayliss & Raymond, 2004; Graham, 1987; Kerstjens & Nery,
2000; Oliver, Vanderford, & Grote, 2012). For example, Kerstjens & Nery (2000)
found only a weak relationship between Grade Point Average (GPA) and
overall performance on International English Language Testing System (IELTS)
tests by English L2 students at a Canadian university. Only the IELTS Reading
scores accounted for any significant variance in GPA, and only for one of the
two groups of undergraduate business students examined. The inconsistent
findings may be due in part to the use of overly general measures of academic
English proficiency, especially a single standardised measure like an overall
IELTS score. This has prompted some to suggest that the link between language
proficiency and academic performance may be better established by using
measures of discrete academic English skills, like vocabulary, academic reading
or writing, as predictors of academic success (Bayliss & Raymond, 2004;
Graham, 1987). The equivocal findings may also be related to limitations in the
GPA as a reliable measure of academic success. This is discussed below.
The risks posed to academic success by inadequate English skills are being
addressed with increasing urgency in traditional ESL countries like Australia
and New Zealand, where English L2 students are a significant presence in all
education sectors. One response has been the development of Post-
Enrolment/Entry Language Assessment (PELA) schemes in which matriculated
students undergo testing to identify linguistically at-risk students. Individuals

Papers in Language Testing and Assessment Vol. 3, Issue 2, 2014 79
so identified are then provided with English support (Dunworth, 2009; Murray,
2010, 2011; Read, 2008). A leading PELA scheme is the Diagnostic English
Language Needs Assessment (DELNA) developed by Elder and colleagues (Elder,
Bright, & Bennett, 2007; Elder & Knoch, 2009; Elder & von Randow, 2008). The
DELNA instrument is administered in two stages. Students are first screened
on-line to identify those likely to be at risk. These individuals are then invited to
undergo more systematic diagnostic testing that assesses specific language
needs in listening, reading and writing. The validity and effectiveness of the
instrument has been reported in the studies cited above.
The study here considers PELA in an ELF setting (Elder & Davies, 2007; Roche
& Harrington, 2013). It will focus on English word recognition skill as a
predictor of academic outcomes with potential use as part of a PELA scheme.
Word recognition skill consists of vocabulary size (Laufer & Nation, 1995;
Nation, 2006), and speed of word recognition (Harrington, 2006; Shiotsu, 2001,
2009). Both aspects play a critical role in comprehension (Perfetti, 2007) and
correlate highly with L2 reading (Koda, 2005, 2007; Nassaji, 2003) and writing
(Snellings, Van Gelderen, & De Glopper, 2002). Vocabulary size thresholds in
particular have been linked to various domains of L2 performance and used
widely in L2 vocabulary assessment and instruction (Milton, 2009; Nation,
2006). Interest in speed of recognition has traditionally been limited to the
laboratory but there is growing interest in recognition speed as a measurable
index of L2 lexical proficiency (Harrington, 2006; Miralpeix & Meara, 2010;
Pellicer-Sánchez & Schmitt, 2012). Although the focus on discrete word
recognition skill is admittedly narrow, we believe it warrants attention as part
of a broader PELA application. This is due both to its fundamental importance
for fluent performance as well as the relative ease with which it can be
measured and interpreted. The latter is of particular utility in ELF settings like
the one examined here (Bernhardt, Rivera, & Kamil, 2004).
In this study individual differences in English word recognition skill are
related to the GPA of students from four academic disciplines, Humanities,
Computing/IT, Business and Engineering. These disciplines vary in the
academic language demands made on the student and thus provide a
potentially informative comparison of the role of word recognition skill in
academic performance in different academic areas. GPA is one of the most
readily recognised and widely used indicators of academic achievement
(Mulligan, Oliver, & Rochecouste, 2012). It does, however, have limitations as a
measure of academic achievement (Sadler, 2009). It can be affected by a range
of factors, including variation across different courses of study, grading
practices of particular professors, institutional policy and practice, and learner
background (Bayliss & Raymond, 2004). Despite these acknowledged
M. Harrington & T. Roche
80
limitations GPA is a readily understood and universally used measure of
academic performance that enjoys a high degree of face validity.
The present study builds on published research that examined the link between
academic English proficiency and GPA in cross-discipline EFL university
(Harrington & Roche, 2014) and college (Roche & Harrington, 2013) settings in
the Sultanate of Oman. In the university study the word recognition skill
measures were compared with reading and writing measures as predictors of
GPA. Writing was found to be the best predictor (r = .54) with word recognition
skills (.31) and reading (.31) also stable predictors of GPA outcomes. Although
overall correlations between Academic English proficiency and GPA were
examined in that study, the possible effect of academic discipline on this
relationship was not considered. The variable effect of academic discipline on
the link between language proficiency and academic performance has been
demonstrated in previous research (Alderson & Urquhart, 1985; Elder et al.,
2007; Usó-Juan, 2006). The current study will examine the link between GPA
and word recognition skill as measured by word test accuracy (a measure of
size) and response time performance. Tested are undergraduate ELF students
from four faculties that differ in the English language demands made in the
discipline.
Three research questions are addressed:
1. How sensitive are word test accuracy scores as predictors of GPA by
faculty?
2. How sensitive are word test response times as predictors of GPA by
faculty?
3. Does the combination of accuracy and response time measures
provide a more powerful predictor of GPA across the faculties than
each measure considered alone?
The study
Participants and setting
First-year undergraduate students (N = 280) took part in the study. They were
drawn from four faculties: Humanities (n = 143); Computing (n = 51); Business
(n = 54); and Engineering (n = 32). Participation was voluntary. The participants
were L1 Arabic speakers and none had lived in an English speaking country for
any period of time. All had completed the university’s general foundation
program immediately prior to entry into their first undergraduate semester.
Female students make up over 80% of the sample, reflecting university

Papers in Language Testing and Assessment Vol. 3, Issue 2, 2014 81
enrolment patterns. The study was carried out in accordance with the
university’s ethical guidelines, with students providing informed consent
before taking part in the study.
Materials
Word recognition skills
The Timed Yes/No Test (Harrington & Carey, 2009) was used to measure word
recognition skill. The on-line test consists of a mix of word and nonword items
presented one at a time on a computer screen. The learner indicates via
keystroke whether the presented item is known. Word items are sampled from
a range of frequency-of-occurrence bands ranging from the very high to lower
frequency words. The nonword items consist of phonologically possible words
and are included to control for guessing (Meara & Buxton, 1987; Mochida &
Harrington, 2006).
Two versions of the test were completed by all participants. An Advanced
version consisted of words drawn from the Vocabulary Levels Test (VLT)
(Nation, 2001), a widely used measure of recognition vocabulary. The test
consists of four frequency levels comprised of the two thousand (2K), three
thousand (3K), five thousand (5K) and ten thousand (10K) most frequent word
bands. A Basic version contained word items from the 1K, 2K, 3K and 5K levels
drawn from the British National Corpus and sourced from the LexTutor
website, www.lextutor.com.ca (Cobb, 2013; Cubit, 2013). Taken together the
versions represent a range of frequency level with a bias toward higher
frequency items. See Roche & Harrington (2013) for details. Both versions
consist of 100 items comprised of 72 words and 28 nonwords. Different items
were used in the respective tests. The 72 words consist of 18 words, at each of
the four frequency levels. Accuracy (a measure of size) and speed of response
measures were collected for each item. It should be noted the items in the
respective frequency levels in the VLT (Nation, 2001) do not correspond in all
cases to the equivalent frequency values in the BNC, due to the hybrid nature of
the VLT development (Nation, 2006). However, the differences are small and
the use of the VLT items provides a means for comparison with the widely used
VLT. Accuracy was indexed by the Corrected for Guessing (CFG) score,
calculated by the overall number of words correctly identified minus the overall
number of nonwords incorrectly identified (Mochida & Harrington, 2006).
Speed of response for individual items was measured from the time an item
appeared on the screen until the student pressed the key. Each item remained
on the screen for 5000 milliseconds (5 seconds), after which it timed out if there
was no response. Timed out items were treated as incorrect responses.

M. Harrington & T. Roche
82
Despite the simple Yes/No recognition format, performance on the test
correlates highly (r = .7-.8) with traditional multiple-choice measures of
vocabulary skill (Meara & Buxton, 1987), including the VLT (Mochida &
Harrington, 2006). The use of frequency-of-occurrence statistics as the basis for
item selection provides an objective index for comparisons across learners and
settings, and the test format has been shown to be an effective measure of
vocabulary size across English L2 learners from a variety of L1s (Milton, 2009).
The two versions of the Timed Yes/No Test were administered and scored
using LanguageMAP, a web-based testing program, www.languagemap.com.
The administration of the test is simple and scoring automatic.
Grade-point average (GPA)
Data were collected in the second semester. The cumulative GPA at the end of
the semester was used as the academic performance criterion. The study
examined a homogenous cohort of L1 Arab students from a single institution,
thereby ensuring a degree of consistency in the GPAs used. The GPAs were
provided with the students’ permission by the Registrar’s Office of the
university.
Procedure
Data collection took place during the 13th and 14th weeks of the 15-week
semester. The tests were administered by the second author and collaborating
staff. Testing was done toward the end of the semester due to curriculum
restrictions. All testing was done in a computer lab in sessions lasting
approximately 20 minutes. Instructions in Modern Standard Arabic were given
in written form and were also read aloud by an Omani research assistant.
Participants were warned they would be penalised for clicking “Yes” for
nonwords. They were also told that each item would appear on the screen for
only 5 seconds, after which it would disappear and the item counted as
incorrect. Participants were instructed to work as quickly and accurately as
possible. In addition to being an additional window on proficiency, the
inclusion of response time demands discouraged strategic and reflective
processing on the part of the students, thus providing a more direct measure of
vocabulary skill (Lee & Chen, 2011). Participants took a set of practice items
before beginning the test.
Mean differences in word recognition skill (accuracy and response time) by
item, condition and faculty were first analysed using SPSS MANOVA. The
predictive power of the vocabulary measures was then assessed using
hierarchical regression.

Papers in Language Testing and Assessment Vol. 3, Issue 2, 2014 83
Results and Discussion
Reliability measures for the tests are first presented, followed by the descriptive
and inferential statistics.
Test instrument reliability
Reliability for the vocabulary measures was calculated using Cronbach’s alpha
(Cohen, 1988), a measure of internal consistency. Reliability for the word and
nonword items was calculated separately, as the two sets are assumed to
represent different dimensions of knowledge (DeVellis, 2003). Reliability
coefficients for the word and nonword items were in the .8 - .9 range for both
the accuracy and response time measures. Timed-out items constituted less
than 1% of the data. As was the case in earlier studies (Harrington & Carey,
2009; Roche & Harrington, 2013), the 5000 ms time for each trial limit resulted in
few values beyond the minimum standard deviation cut-off (2.5-3 SDs)
typically used in screening response time data (Jiang, 2012). Thus it was not
necessary to treat outliers in a separate data-screening step. This is an
advantage, as the need for elaborate data screening procedures makes the
measure less useful for class and program-based testing, particularly in settings
like the current one. Raw response times were log-transformed to make the data
more normally distributed for the statistical analyses. Non-transformed means
are presented for ease of discussion.
Test performance
The descriptive statistics for the vocabulary measures are given in Table 1. All
test measures were screened for normality. Skew and kurtosis values were well
within normal range for the size and log-transformed response time measures
(Field, 2009): for the Advanced vocabulary size, Skew = -.06; Kurtosis = .246; for
Basic vocabulary size, -.086, .015; for Advanced vocabulary response time, .464,
-.057; and for Basic vocabulary response time, .351, -.395.
Table 1. Descriptive Statistics for Vocabulary Tests and Grade Point Average by Faculty.
Humanities
(n = 143)
Computing
(n = 51)
Business
(n = 54)
Engineering
(n = 32)
TOTAL
(N = 280)
Advanced Vocabulary
Accuracy Mean 25.24 19.67 28.57 24.19 24.75
SD 13.29 12.48 11.22 11.89 12.85
RT Mean 1789 1802 1553 1658 1731
SD 422 448 395 259 423
False alarm Mean 29.78 35.50 25.59 29.02 29.93
SD 16.16 13.47 13.10 15.35 15.36

M. Harrington & T. Roche
84
Basic Vocabulary
Accuracy Mean 45.81 41.40 40.48 45.27 43.92
SD 13.11 11.96 12.58 14.29 13.03
RT Mean 1769 1704 1734 1612 1732
SD 441 422 421 374 448
False alarm Mean 24.24 26.89 24.54 20.31 24.39
SD 11.37 10.61 11.29 12.90 11.46
Combined Vocabulary
Accuracy Mean 35.52 30.54 34.53 34.34 33.35
SD 11.59 9.09 9.17 10.69 10.33
RT Mean 1779 1753 1644 1635 1732
SD 396 381 294 290 336
False alarm Mean 27.18 31.58 23.81 25.33 27.13
SD 12.59 10.72 10.85 12.47 11.71
Grade-point average
Mean 2.34 2.23 2.44 1.91 2.29
SD 0.79 1.13 0.88 1.14 0.93
RT = response time
Both versions of the test included nonwords as a control for guessing. The level
of guessing is reflected in the false alarm rate, which is the percentage of
incorrect “Yes” responses to the nonword items. The false alarm rate is high
when compared to previous research in non-ELF settings, where it has ranged
from 5% (Harrington & Carey, 2009; Mochida & Harrington, 2006) to 20%
(Beeckmans, Eyckmans, Janssens, Dufranne, & Van de Velde, 2001; Cameron,
2002). There may be several reasons for the relatively high rate. In some cases
test-takers may have genuinely mis-identified a nonword as a known word.
However, others may not have understood the task or may not have been
paying attention, neither of which are related to vocabulary skill. In relation to
understanding task demands, instructions were piloted in the development
phase on small groups, with modifications made to minimise potential
misunderstandings. This included providing instructions in spoken and written
Arabic. Two test administrators, including the second author, were also present
during the test sessions to clarify the procedures if needed. Motivation is also a
concern. The participants were all volunteers and received no credit or other
rewards for participating. The amount of attention an individual gives to a task
is closely related to motivation, which may be limited in low-stakes testing like
this. Testing outcomes here had little bearing on student learning goals, which
may have resulted in less than optimal performance by individuals (Read,
2008). Alternatives to the use of nonwords to control for guessing have been
proposed elsewhere (Eyckmans, 2004; Shillaw, 1996). They include the use of an
animacy judgement task (Segalowitz & Frenkiel-Fishman, 2005), random
Papers in Language Testing and Assessment Vol. 3, Issue 2, 2014 85
follow-up questions requiring an item to be defined or translated, or even
dispensing with any kind of test for guessing (Eyckmans, 2004).
Mean accuracy performance on the Basic version was just over 40% and mean
response time around 1700 milliseconds (ms). For the Advanced version mean
accuracy and response time performance was just under 25% and also 1700 ms,
respectively. The overall accuracy difference between the two tests was
statistically significant (all tests two-tailed), dependent t(279) = -22.19, p < .001, r
= .38, while the response time means were not, dependent t(279) = .081, p = .936.
Accuracy performance on the Advanced items is lower than that reported in
previous research with English L2 users in Australia. Mean scores for Australia-
based L2 learners ranged from accuracy scores of 44% and 1592 ms for
Intermediate English language program students, to 63% and 1574 ms for
Advanced language program students, and up to 82% and 962 ms for
international university students (Harrington & Carey, 2009). In particular, the
students here scored significantly lower than their L2 counterparts studying in
Australian universities (Mochida & Harrington, 2006).
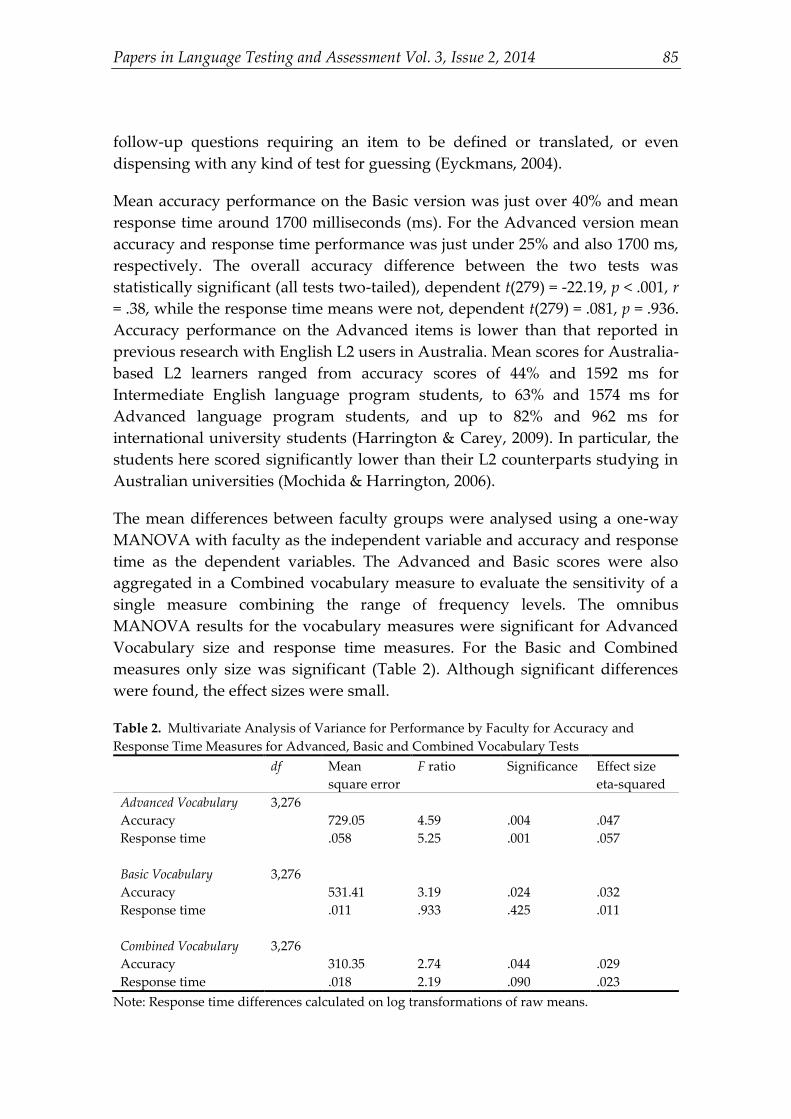
The mean differences between faculty groups were analysed using a one-way
MANOVA with faculty as the independent variable and accuracy and response
time as the dependent variables. The Advanced and Basic scores were also
aggregated in a Combined vocabulary measure to evaluate the sensitivity of a
single measure combining the range of frequency levels. The omnibus
MANOVA results for the vocabulary measures were significant for Advanced
Vocabulary size and response time measures. For the Basic and Combined
measures only size was significant (Table 2). Although significant differences
were found, the effect sizes were small.
Table 2. Multivariate Analysis of Variance for Performance by Faculty for Accuracy and
Response Time Measures for Advanced, Basic and Combined Vocabulary Tests
df Mean
square error
F ratio Significance Effect size
eta-squared
Advanced Vocabulary 3,276
Accuracy 729.05 4.59 .004 .047
Response time .058 5.25 .001 .057
Basic Vocabulary
3,276
Accuracy 531.41 3.19 .024 .032
Response time .011 .933 .425 .011
Combined Vocabulary
3,276
Accuracy 310.35 2.74 .044 .029
Response time .018 2.19 .090 .023
Note: Response time differences calculated on log transformations of raw means.
M. Harrington & T. Roche
86
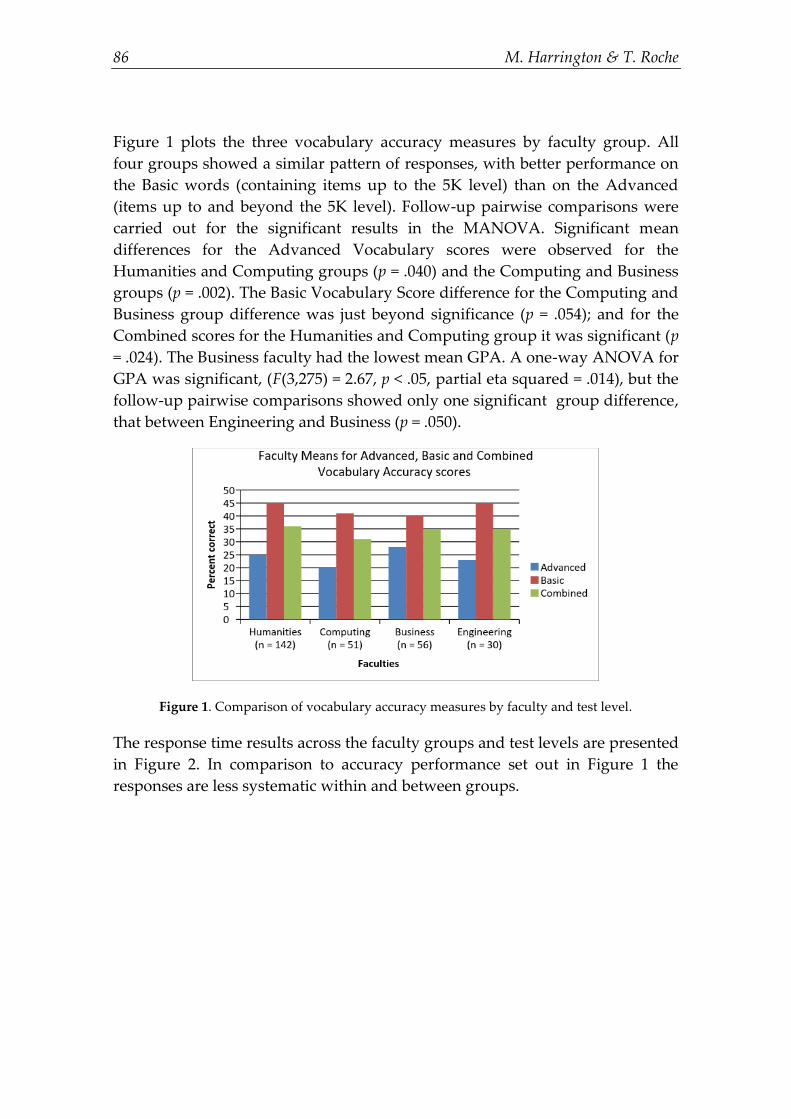
Figure 1 plots the three vocabulary accuracy measures by faculty group. All
four groups showed a similar pattern of responses, with better performance on
the Basic words (containing items up to the 5K level) than on the Advanced
(items up to and beyond the 5K level). Follow-up pairwise comparisons were
carried out for the significant results in the MANOVA. Significant mean
differences for the Advanced Vocabulary scores were observed for the
Humanities and Computing groups (p = .040) and the Computing and Business
groups (p = .002). The Basic Vocabulary Score difference for the Computing and
Business group difference was just beyond significance (p = .054); and for the
Combined scores for the Humanities and Computing group it was significant (p
= .024). The Business faculty had the lowest mean GPA. A one-way ANOVA for
GPA was significant, (F(3,275) = 2.67, p < .05, partial eta squared = .014), but the
follow-up pairwise comparisons showed only one significant group difference,
that between Engineering and Business (p = .050).
Figure 1. Comparison of vocabulary accuracy measures by faculty and test level.
The response time results across the faculty groups and test levels are presented
in Figure 2. In comparison to accuracy performance set out in Figure 1 the
responses are less systematic within and between groups.

Papers in Language Testing and Assessment Vol. 3, Issue 2, 2014 87
Figure 2. Vocabulary response time by faculty and test level.
Performance on the Advanced word items was fastest for the Business group
and slowest for the Computing group. For the Humanities and Engineering
groups mean response times for the Advanced vocabulary items were also
slower, though the difference between the Advanced and Basic items was much
smaller than that for the accuracy scores. Only the mean response time
differences between groups for the Advanced word measures reached statistical
significance in the initial MANOVA. The follow up pairwise comparisons
showed only two to be significant: Humanities and Business (p = .001), and
Computing and Business (p = .008). There is a noticeable mean response time
difference between the Humanities and Engineering groups, with the latter
group over 100 msec faster, but this difference was not statistically significant.
In general the response time measures showed greater variability and thus were
less sensitive discriminators of performance for either group or condition.
The word recognition measures as predictors of GPA
Bivariate correlations for the word recognition measures and GPA for the
overall measures are reported in Table 3 and for the faculty groups in Table 4.
For the overall responses both accuracy and response time showed weak to
moderate correlations with GPA ranging from a weak correlation with
Advanced Vocabulary Response time, (r = -.13) to a medium strength
correlation for Combined Accuracy (r = .35). The correlations are comparable to
those reported in Elder, et al. (2007) who examined DELNA performance and
GPA in a New Zealand university. In that study the correlation between
reading scores and GPA was .41, and writing and GPA was .23. Across the two
semesters of data collection the test scores moderately correlated with GPA:
listening (r = .35); reading (.41); and writing (.24) in that study.
1400145015001550160016501700175018001850
Humanities(n = 142)
Computing(n = 51)
Business(n = 54)
Engineering(n = 32)
Mill
ise
con
ds
Faculties
Faculty Means for Advanced, Basic and Combined Response Time scores
Advanced
Basic
Combined

M. Harrington & T. Roche
88
Table 3. Overall Bivariate Correlations for GPA and Vocabulary Measures
N = 280
Ad
van
ced V
ocab
ulary
Accu
racy
Ad
van
ced V
ocab
Ad
van
ced
Vo
cabu
lary R
espo
nse
Tim
e
Basic V
ocab
ulary
Accu
racy
Basic V
ocab
Resp
on
se Tim
e
Co
mb
ined
Accu
racy
Co
mb
ined
Resp
on
se Tim
e
Grade Point Average .33*** -.13* .25*** -.16** .35** -.17**
Advanced Vocab
Accuracy -22*** .38*** -.16** .83*** -.22 ***
Advanced Vocab RT -.13* .48** -.22*** .86***
Basic Vocab
Accuracy -.25*** .83*** -.22***
Basic Vocab RT -.25** .86**
Combined Accuracy -.27***
Pearson’s Product-Moment correlation: * significant at the p < 0.05 level; ** significant at the p
< .01 level; *** significant at the p < .001 level, (all 2-tailed).
Elder et al. (2007) examined performance by faculty and found the correlation
between overall proficiency score and GPA the strongest for the Education
faculty students (r = .47), followed by Architecture (.44), Business (.35), Arts
(.32), and a noticeably weaker correlation for Science faculty students (.16). All
correlations were statistically significant (pp. 36-7). A similar pattern was
evident here, with the strongest significant correlations between word skill and
GPA correlations for the Humanities group (.50) for the Combined Accuracy,
and the weakest (-.17) for the Combined Response Time scores, respectively.
The Engineering group was distinctive in that accuracy scores did not correlate
with GPA but the response time did (Combined score -.67). Although lack of
significance for the accuracy correlations (around .20) may be due to the smaller
Engineering sample size (n = 32), the pattern is unusual. The strength of
correlations is sensitive to the range of scores compared, but there is no
discernible pattern for the strong response time correlations by the Engineering
students.

Papers in Language Testing and Assessment Vol. 3, Issue 2, 2014 89
Table 4. Bivariate Correlations for GPA and Vocabulary Measures by Faculty Group
Vocabulary Scores
Advanced Basic Combined
Accuracy RT Accuracy RT Accuracy RT
Humanities
(n=143) r .44 -.12 .47 -.24 .50 -.20
sig .000 .153 .000 .003 .000 .021
Computing
(n=51) r .24 .08 .16 .09 .27 .11
sig .092 .564 .274 .526 .059 .445
Business
(n=54) r .33 -.17 .06 -.09 .24 -.19
sig .014 .196 .654 .506 .080 .157
Engineering
(n=32) r .23 -.47 .11 -.60 .20 -.67
sig .220 .003 .576 .000 .297 .000
RT = Response time; r = Pearson’s Product-Moment correlation; sig = significance.
The response time scores were generally less sensitive to differences in GPA,
both overall and across the different faculties. This may be due in part to a
trade-off between accuracy and speed by some the participants. However, the
overall correlation between accuracy and GPA was r = -.25, the inverse
correlation indicating no systematic speed-accuracy trade-off. A follow up
analysis of accuracy score-response time correlations for the Engineering group
for the three test scores yielded similar values: Advanced, -.26; Basic, -.21; and
Combined, -.23. It may also reflect differences in the amount of attention given
to the task by individual participants. Although instructed to work as quickly
as possible, it may be that some were less attentive to the speeded part of the
task.
The results suggest the word recognition measures are of comparable
sensitivity to the more comprehensive DELNA instrument in terms of general
predictive power. However, the comparison between the two groups must be
qualified. The New Zealand study is in an ESL setting involving learners of
generally higher proficiency than the participants here. As noted above, first

M. Harrington & T. Roche
90
year undergraduate students are admitted to Omani English-medium programs
with an IELTS score of 5.0 (Oman Academic Accreditation Authority, 2008) as
opposed to entry level requirements of IELTS 6.0 and above in Australian and
New Zealand universities. The Elder et al. (2007) sample was also larger
(Semester 1, N = 761; Semester 2, N = 1052).
Combining accuracy and response time measures as predictors of GPA
When considered independently the accuracy (reflecting size) measures
provided a more robust predictor of GPA performance than response time. Of
interest here is whether the two measures together provide a more sensitive
predictor of individual differences in GPA outcomes than either alone. In one
respect the two measures reflect different dimensions of proficiency, with
accuracy responses indexing knowledge and response speed the efficiency with
which that knowledge can be accessed. However, given the functional
importance of both size and speed in performance, the demonstration of a
composite effect of the two measures on performance differences will provide a
more dynamic approach to characterising vocabulary, and possibly other
language skills, the contribute to fluent performance. Hierarchical regression
analyses were used to assess the sensitivity of the significant accuracy and
response time findings reported above as combined predictors of GPA. Table 5
gives the results for the overall group, the Humanities and Engineering groups.
In all models GPA is the criterion variable and accuracy and response time are
entered as ordered predictor variables.
Table 5. Hierarchical Regression Analyses of Vocabulary Measures with GPA for Overall,
Humanities and Engineering Groups
OVERALL (N=280) R2 Change in
R2 B SEB Β
Advanced
Step 1 Accuracy .111 .029 .005 .320*
Step 2 Response time .116 .004 -.577 .503 -.066
Basic
Step 1 Accuracy .064 .016 .004 .228*
Step 2 Response time .075 .011 -.893 .499 -.106
Combination
Step 1 Accuracy .125 .029 .005 .331*
Step 2 Response time .132 .007 -.877 .584 -.087
HUMANITIES (n= 143)
Advanced
Step 1 Accuracy .164 .024 .005 .397*
Step 2 Response time .166 .001 -.298 .597 -.039

Papers in Language Testing and Assessment Vol. 3, Issue 2, 2014 91
Basic
Step 1 Accuracy .217 .026 .005 .435**
Step 2 Response time .229 .011 -.850 .531 -.111
Combination
Step 1 Accuracy .246 .033 .005 .482*
Step 2 Response time .248 .002 -.357 .616 -.045
ENGINEERING (n= 32)
Advanced
Step 1 Accuracy .067 .015 .016 .153
Step 2 Response time .241 .174 -5.213 2.024 -.430*
Basic
Step 1 Accuracy .006 -.003 .012 -.037
Step 2 Response time .371 .364 -.850 .531 -.615*
Combination
Step 1 Accuracy .039 .004 .005 .294
Step 2 Response time .445 .406 2.045 -.357 -.656*
* Significant at the p < 0.001 level, (two-tailed)
For the Overall scores the model R2 value for the Combination scores was .14
and for the Humanities .25, or explaining between 14% and 25% of the variance
respectively. In comparison, the IELTS Reading scores reported in Kerstjens &
Nery (2000, p. 95) accounted for only 8% of the GPA variance, and Elder et al
2007 measures account for 12% to 18%. Although all these results leave a
significant amount of variance unexplained, the fact that the word recognition
measures alone can account for a quarter of the differences in the Humanities
GPA scores suggests these measures can play a useful role in assessment.
The overall results show that despite several significant bivariate correlations,
response time differences accounted for very little additional variability in GPA
scores for three of the four faculty groups. For the Engineering group alone the
response time measures added a significant amount of variance accounted for
(R2 = .406 for the Combined scores) but for this group accuracy was not a
significant predictor. The lack of additional variance accounted by response
time is in contrast to previous work in ESL (Harrington & Carey, 2009) and EFL
settings (Harrington & Roche, 2014; Roche & Harrington, 2013).

M. Harrington & T. Roche
92
Conclusions and implications
This study examined the role that individual differences in word recognition
skill plays in predicting GPA in students across four academic disciplines that
make varying demands on academic language proficiency. The predictive
validity of word recognition accuracy (a proxy for size) and response time for
GPA outcomes was examined both independently and in combination. Word
accuracy was a better predictor of academic performance than response time
overall and a particularly strong predictor of GPA for the Humanities group.
This may be due to the greater contribution that language-based assessments
make to grades in the Humanities discipline (e.g., persuasive writing and oral
presentations). Note that Engineering had the weakest correlation between
accuracy and GPA of the four groups, despite mean accuracy scores that were
comparable to Humanities. Performance on the Advanced vocabulary items
was the best predictor for three of the four faculty groups. It is likely that the
inclusion of more difficult items extended the range of scores, which in turn
increased the strength of the correlation. The differences in group sizes may
also be a contributing factor. For the significantly larger Humanities group
alone GPA was predicted by performance on all three word accuracy measures
(Advanced, Basic and Combined). This is despite the similarity across three of
the groups on the Basic and Combination Accuracy measures (mean and SD)
and comparable variability in GPA. The Engineering group had the lowest GPA
and was the only group in which accuracy and GPA did not correlate. Again, it
may be the case that the language-intensive nature of assessments and grading
plays a role in the differences between the Humanities group and others.
Response time patterns were less stable, with considerable variability within
and between groups. The Engineering group was relatively fast and accurate,
while the Business group was also fast but relatively inaccurate. The
Humanities group had the highest accuracy and slowest response time means
means, suggesting a speed-accuracy trade-off. However, there was a negative
bivariate correlation between accuracy and response for the Combined scores
for the group (around - .30) did not indicate a systematic attempt to improve
performance by slowing down. This pattern held for all the groups. The
moderately negative correlations do not mean trade-offs in speed and accuracy
are entirely absent, but they do indicate these trade-offs are not systematic. As
indices of proficiency the measures should ideally reflect optimal performance
in both domains. This ideal is not met here but the respective correlations do
indicate that both measures can provide some insight into an individual’s word
recognition skill.

Papers in Language Testing and Assessment Vol. 3, Issue 2, 2014 93
Also of interest was the combination of accuracy and response measures as
predictors of GPA. Previous research has shown that response time can explain
additional variance in L2 performance differences over and above accuracy.
This was not the case here. Accuracy and response times predicted GPA
differences separately in specific conditions but in combination failed do so. The
incorporation of response time measures in the Timed Yes/No Test has been
proposed as a means to measure lexical access, a foundation of fluent language
performance. Previous research has established the usefulness of including time
measures (mean response time and variability) in proficiency assessment, and
the question remains open as to why response played the limited role it did
here for three of the groups - and had such a strong effect on performance by
the Engineering group.
The participants’ L1 may also have played a role in the results. Arabic L1
students have been shown to have greater difficulty with English spelling and
word processing than proficiency equivalent English L2 learners from other L1
backgrounds (Fender, 2008; Milton, 2009; Ryan & Meara, 1991; Saigha &
Schmitt, 2012). Skilled performance on the Timed Yes/No test requires
knowledge of both spelling and word meaning, with poor performance on both
the words and nonwords (the latter conforming to English spelling rules)
attributable, in part, to English spelling skill. Whether this was an issue here is
an issue further investigation.
A primary motivation for this study was the evaluation of the Timed Yes/No
Test as a tool to measure academic English language skill in ELF tertiary
settings. The tool has potential as a cost-effective and reliable means to identify
students at relatively broad but still useful levels of English word skill. These
levels can in turn be related to academic English performance in key domains of
formal language and academic performance. This screening function is
particularly important at the early stages to identify students who may be
academically at risk due to language proficiency shortcomings.
The Timed Yes/No Test has significant practical advantages as such a screening
tool. It is quick to complete, requires less staffing resources to administer and,
importantly for ELF settings like the one considered here, needs fewer English
proficient staff to score and interpret. Test administration is also less
burdensome for the student, providing in 10-15 minutes results which
demonstrate comparable reliability to those reported for the more time
intensive skills-based tests such as DELNA. The use of frequency-based
vocabulary size measures also provides an objective, context-independent
measure of L2 vocabulary knowledge.
M. Harrington & T. Roche
94
The response time measures reported here were relatively insensitive to faculty
differences, but the inclusion of timed responses may have advantages beyond
performance measurement alone. Individual variation in response times can
indicate whether the test taker is engaged in the task or even cheating (Lee &
Chen, 2011). It also lessens the scope for the use of reflective strategies when
responding, providing a more direct measure of learner knowledge. Test-taker
motivation is a pervasive problem with low-stakes tests in general (Read, 2008)
and the addition of speed component may provide some inducement for users
to attend to the task more closely than would otherwise be the case. Again,
these are issues for further investigation.
Acknowledgements
This research was supported by a grant from the Omani Research Council
[Grant number ORG SU HER 10 003] and support from the Office of the Deputy
Vice-Chancellor (International), University of Queensland, Australia.
The authors
Michael Harrington is a Senior Lecturer in Second Language Acquisition in the
School of Languages & Comparative Cultural Studies at the University of
Queensland, Australia. He has published in areas including lexical processing
and the measurement of L2 vocabulary skills.
Thomas Roche is the English Language Program Coordinator of the Southern
Cross University College, Australia and an Associate Professor at Sohar
University, Oman. His research interests are in L2 language testing and English
for Academic Purposes.
References
Alderson, J. C., & Urquhart, A. (1985). The effect of students’ academic
discipline on their performance on ESP reading tests. Language Testing, 2,
192–204.
Baik, C., & Greig, J. (2009). Improving the academic outcomes of undergraduate
ESL students: the case for discipline–based academic skills programs.
Higher Education Research and Development, 28(4), 401–416.
Barton, B., & Neville–Barton, P. (2003). Literacy and mathematics learning for non-
native speakers. Paper delivered in Department of Applied Language

Papers in Language Testing and Assessment Vol. 3, Issue 2, 2014 95
Studies and Linguistics, University of Auckland, Auckland, New
Zealand, October, 2003. Retrieved from http://citeseerx.ist.psu.edu.
Bashir, S. (2007). Trends in international trade in higher education: implications and
options for developing countries education working papers series. Washington:
World Bank.
Bayliss, D., & Raymond, P. M. (2004). The link between academic success and
L2 proficiency in the context of two professional programs. The Canadian
Modern Language Review / La revue canadienne des langues vivantes, 61(1),
29–51.
Beeckmans, R., Eyckmans, J., Janssens, V., Dufranne, M., & Van de Velde, H.
(2001). Examining the Yes–No vocabulary test: Some methodological
issues in theory and practice. Language Testing, 18(2), 235–274.
Berman, R., & Cheng, L. (2001). English academic language skills: perceived
difficulties by undergraduate and graduate students, and their academic
achievement. Canadian Journal of Applied Linguistics, 4(1), 25–40.
Bernhardt, E., Rivera, R. J., & Kamil, M. L. (2004). The practicality and efficiency
of web–based placement testing for college-level language programs.
Foreign Language Annals, 37(3), 356–366.
Cameron, L. (2002). Measuring vocabulary size in English as an additional
language. Language Teaching Research, 6(2), 145–173.
Cheng, L., Myles, J., & Curtis, A. (2004). Targeting language support for non-
native English–speaking graduate students at a Canadian university.
TESL Canada Journal/Revue TESL du Canada, 21(2), 50–71.
Cobb, T. (2013). Web Vocabprofile. An adaptation of Heatley & Nation’s (1994)
Range. Retrieved 28 June, 2013, from http://www.lextutor.ca/vp/.
Cohen, J. (1988). Statistical power analysis for the behavioural sciences (2nd ed.).
Hillsdale, NJ: Lawrence Erlbaum.
Coleman, J. A. (2006). English–medium teaching in European higher education.
Language Teaching, 39(1), 1–14.
Cubit. (2013). Web Vocabprofile. An adaptation of Heatley & Nation’s (1994)
Range. Retrieved 28 June, 2013, from http://www.lextutor.ca/vp/.
DeVellis, R. (2003). Scale development: Theory and applications. Thousand Oaks,
CA: Sage Publications.
Dunworth, K. (2009). An investigation into post–entry English language
assessment in Australian universities. Journal of Academic Language and
Learning, 3(1), A1–A13.

M. Harrington & T. Roche
96
Elder, C., Bright, C., & Bennett, B. (2007). The role of language proficiency in
academic success: perspectives from a New Zealand university.
Melbourne Papers in Language Testing, 12(1) 24–28.
Elder, C., & Davies, A. (2007). Assessing English as lingua franca. Annual Review
of Applied Linguistics, 26, 283–304.
Elder, C., & Knoch, U. (2009). Report on the development and trial of the
Academic English Screening Test (AEST). Technical report. Melbourne:
University of Melbourne.
Evans, S., & Morrison, B. (2011). Meeting the challenges of English–medium
higher education: The first–year experience in Hong Kong. English for
Specific Purposes, 30(3), 198–208.
Elder, C., & von Randow, J. (2008). Exploring the utility of a web–based English
language screening tool. Language Assessment Quarterly, 5(1), 173–194.
Eyckmans, J. (2004). Measuring receptive vocabulary size. Utrecht: LOT.
Fender, M. (2008). Spelling knowledge and reading development: Insights from
Arab ESL learners. Reading in a Foreign Language, 20(1), 19–42.
Field, A. (2009). Discovering statistics using SPSS (3rd ed.). London: Sage.
Fox, J. (2005). Rethinking second language admission requirements: Problems
with language–residency criteria and the need for language assessment
and support. Language Assessment Quarterly, 2(1), 85–115.
Graham, J., C. (1987). English language proficiency and the prediction of
academic success. TESOL Quarterly, 21, 505–521.
Harrington, M. (2006). The lexical decision task as a measure of L2 lexical
proficiency. EUROSLA Yearbook, 6, 147–168.
Harrington, M., & Carey, M. (2009). The on-line Yes/No test as a placement
tool. System, 37, 614–626.
Harrington, M., & Roche, T. (2014). Post–enrolment language assessment for
identifying at–risk students in English-as-a-Lingua-Franca university
settings. Journal of English for Academic Purposes, 15, 37–47.
Huibregtse, I., Admiraal, W., & Meara, P. (2002). Scores on a yes–no vocabulary
test: correction for guessing and response style. Language Testing, 19(2),
227–245.
Jenkins, J. (2007). English as a Lingua Franca: attitude and identity. Oxford, UK:
Oxford University Press.
Jiang, N. (2012). Conducting reaction time research in second language studies.
London: Routledge.
Kerstjens, M., & Nery, C. (2000). Predictive validity in the IELTS Test: A study
of the relationship between IELTS scores and students’ subsequent
Papers in Language Testing and Assessment Vol. 3, Issue 2, 2014 97
academic performance. In R. Tulloch (Ed.), International English Language
Testing System Research Reports 2000 (Vol. 3, pp. 85–108). Canberra,
Australia: IELTS Australia.
Kirkpatrick, A. (2011). Internationalization or Englishization: medium of instruction
in today's universities. Centre for Governance and Citizenship, The Hong
Kong Institute of Education.
Koda, K. (2005). Insights into second language reading: A cross–linguistic approach.
New York: Cambridge University Press.
Koda, K. (2007). Reading and language learning: Cross–linguistic constraints on
second language reading development. Language Learning, 57(1), 1–44.
Laufer, B. (1992). Reading in a foreign language: How does L2 lexical
knowledge interact with the reader’s general academic ability? Journal of
Research in Reading, 15(2), 95–103.
Laufer, B., & Nation, P. (1995). Vocabulary size and use: Lexical richness in L2
written production. Applied Linguistics, 16(3), 307–322.
Lee, Y. H., & Chen, H. (2011). A review of recent response–time analyses in
educational testing. Psychological Test and Assessment Modelling, 53(3),
359–379.
Loewen, S., & Ellis, R. (2004). The relationship between English vocabulary skill
and the academic success of second language university students. New
Zealand Studies in Applied Linguistics, 10, 1–29.
Meara, P., & Buxton, B. (1987). An alternative to multiple choice vocabulary
tests. Language Testing, 4(2), 142–154.
Milton, J. (2009). Measuring second language vocabulary acquisition. Bristol,
England: Multilingual Matters.
Miralpeix, I, & Meara, P. (2010). The written word. Retrieved 14 January, 2014,
from http://www.lognostics.co.uk/vlibrary.
Mochida, A., & Harrington, M. (2006). The Yes–No test as a measure of
receptive vocabulary knowledge. Language Testing, 23, 73–98.
Mulligan, D., Oliver, R., & Rochecouste, J. (2012). English language growth after
university entry. International Journal of Educational Research, 53, 1–8.
Murray, N. (2010). Considerations in the post–enrolment assessment of English
language proficiency: Reflections from the Australian context. Language
Assessment Quarterly, 7(4), 343–358.
Murray, N. (2011). Widening participation and English language proficiency: a
convergence with implications for assessment practices in higher
education. Studies in Higher Education, 38(2), 299–311.
DOI:10.1080/03075079.2011.580838

M. Harrington & T. Roche
98
Nassaji, H. (2003). Higher-level and lower-level text processing skills in
advanced ESL reading comprehension. Modern Language Journal, 87(2),
261–276.
Nation, I. S. P. (2001). Learning vocabulary in another language. Cambridge, UK:
Cambridge University Press.
Nation, I. S. P. (2006). How large a vocabulary is needed for reading and
listening? The Canadian Modern Language Review/La Revue canadienne des
langues vivantes, 63(1), 59–82.
Oman Academic Accreditation Authority. (2008). The Oman Academic Standards
for General Foundation Programmes. Retrieved 29 October, 2012, from
http://www.oaaa.gov.om/Docs/GFP%20Standards%20FINAL.pdf.
Oliver, R., Vanderford, S., & Grote, E. (2012). Evidence of English language
proficiency and academic achievement of non-English-speaking
background students. Higher Education Research & Development, 31(4),
541–555.
Pellicer–Sánchez, A., & Schmitt, N. (2012). Scoring Yes–No vocabulary tests:
Reaction time vs. nonword approaches. Language Testing, 29(4), 489–509.
Perfetti, C. (2007). Reading ability: Lexical quality to comprehension. Scientific
Studies of Reading, 11(4), 357–383.
Read, J. (2008). Identifying academic language needs through diagnostic
assessment. Journal of English for Academic Purposes, 7(3), 180–190.
Roche, T., & Harrington, M. (2013). Recognition vocabulary knowledge as a
predictor of academic performance in an English-as-a-foreign language
setting. Language Testing in Asia, 3(12), 133–144.
Ryan, A., & Meara, P. (1991). The case of the invisible vowels: Arabic speakers
reading English words. Reading in a Foreign Language, 7(2), 531–540.
Sadler, D., R. (2009). Grade integrity and the representation of academic
achievement. Studies in Higher Education, 34(7), 807–826.
Saigha, K., & Schmitt, N. (2012). Difficulties with vocabulary word form: The
case of Arabic ESL learners. System, 40, 24–36.
Segalowitz, N., & Frenkiel–Fishman, S. (2005). Attention control and ability
level in a complex cognitive skill: attention–shifting and second language
proficiency. Memory & Cognition, 33, 644–653.
Shillaw, J. (1996). The application of Rasch modeling to Yes/No vocabulary
tests. Vocabulary Acquisition Research Group. Retrieved 10 June, 2009, from
http://www.lognostics.co.uk/vlibrary/index.htm.
Papers in Language Testing and Assessment Vol. 3, Issue 2, 2014 99
Shiotsu, T. (2001). Individual differences in L2 word recognition speed: a
measurement perspective. Bulletin of the Institute of Foreign Language
Education Kurume University, 8, 63–77.
Shiotsu, T. (2009). Reading ability and components of word recognition speed:
The case of L1–Japanese EFL learners. In Z. H. Han & N. J. Anderson
(Eds.), Second language reading research and instruction: Crossing the
boundaries (pp. 15–39). Ann Arbor, MI: The University of Michigan Press.
Snellings, P., Van Gelderen, A., & De Glopper, K. (2002). Lexical retrieval: An
aspect of fluent second language production that can be enhanced.
Language Learning, 52(4), 723–754.
Swan, M. (2012). ELF and EFL: are they really different? Journal of English as a
Lingua Franca, 1-2, 379-389.
Terraschke, A., & Wahid, R. (2011). The impact of EAP study on the academic
experiences of international postgraduate students in Australia. Journal of
English for Academic Purposes, 10(3), 173–182.
Tilak, J. B. G. (2011). Trade in Higher Education: The role of the General
Agreement on Trade in Services (GATS) Fundamentals of Educational
Planning (Vol. 95, pp. 154). Paris: UNESCO.
Tonkyn, A. (1995). English proficiency standards for overseas students: Who
needs what level? Journal of International Education, 6(3), 37–61.
Usó-Juan, E. (2006). The Compensatory Nature of Discipline–Related
Knowledge and English–Language Proficiency in Reading English for
Academic Purposes. The Modern Language Journal, 90(2), 210–227.
Wächter, B., & Maiworm, F. (2008). English–taught programmes in European higher
education. The picture in 2007. Bonn: Lemmens (ACA Papers on
International Cooperation in Education).
Weber, A. S. (2011, May 5-7). Politics of English in the Arabian Gulf. Paper
presented at the 1st International Conference on Foreign Language
Teaching and Applied Linguistics Proceedings, Sarajevo. Retrieved 21
June, 2013 from
http://eprints.ibu.edu.ba/13/1/FLTAL%202011%20Proceed%C4%B1ngs%
20Book_1_p60-p66.pdf.


![Event-related potential (ERP) correlates of face ...€¦ · recognition across multiple expressions [10], face recognition, and discrimination [11–14]; therefore, such children](https://static.fdocuments.net/doc/165x107/6088bc6693aa842fe275e265/event-related-potential-erp-correlates-of-face-recognition-across-multiple.jpg)

![Face recognition across pose A review - Griffith University · Face recognition across pose with assistance of 3D models Generic shape-based methods Cylindrical 3D pose recovery [26]](https://static.fdocuments.net/doc/165x107/5dd10ddad6be591ccb63ff24/face-recognition-across-pose-a-review-griffith-university-face-recognition-across.jpg)