WOONASQUATUCKET RIVER DAM REMOVAL … remova ofl the fiv dame s (Risin Sugn Dam, Paragon Dam,...
26
Superfund Records Center SITE: Cfcva-:a r ..u. BREAK: . l"l-£ OTHER: a-i6-4N I RHODE ISLAND FLOOD PLAIN MANAGEMENT SERVICES SDMS DocID 273451 WOONASQUATUCKET RIVER DAM REMOVAL FLOOD STUDY PROVIDENCE, RHODE ISLAND September 2000 US Army Corps of Engineers New England District
Transcript of WOONASQUATUCKET RIVER DAM REMOVAL … remova ofl the fiv dame s (Risin Sugn Dam, Paragon Dam,...
Superfund Records Center SITE: Cfcva-:ar..u. BREAK: . l" l -£ OTHER: a-i6-4N I
RHODE ISLAND FLOOD PLAIN MANAGEMENT SERVICES
SDMS DocID 273451
WOONASQUATUCKET RIVER DAM REMOVAL FLOOD STUDY PROVIDENCE, RHODE ISLAND
September 2000
US Army Corps of Engineers
New England District
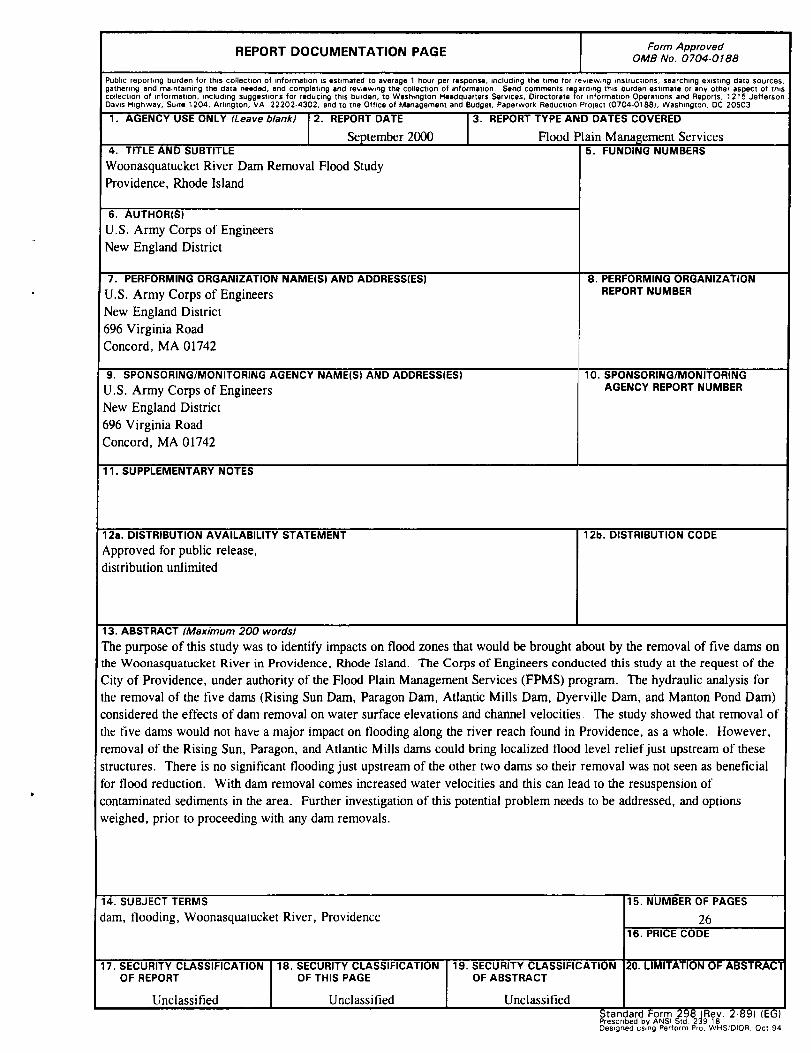
Form ApprovedREPORT DOCUMENTATION PAGE OMB No. 0704-0188
Public reporting burden for this collection of information is estimated to average 1 hour per response, including the time for reviewing instructions, searching existing data sources gathering and maintaining the data needed, and completing and reviewing the collection of information. Send comments regarding this burden estimate or any other aspect of this collection of information, including suggestions for reducing this burden, to Washington Headquarters Services, Directorate for information Operations and Reports, 1215 Jefferson Davis Highway, Suite 1204, Arlington, VA 22202-4302, and to the Office of Management and Budget, Paperwork Reduction Project 10704-01861, Washington, DC 20503.
1. AGENCY USE ONLY (Leave blank) 2. REPORT DATE 3. REPORT TYPE AND DATES COVERED
September 2000 Flood Plain Management Services 4. TITLE AND SUBTITLE 5. FUNDING NUMBERS
Woonasquatucket River Dam Removal Flood Study Providence, Rhode Island
6. AUTHOR(S)
U.S. Army Corps of Engineers New England District
7. PERFORMING ORGANIZATIONNAME(S) AND ADDRESS(ES) 8. PERFORMING ORGANIZATION REPORT NUMBERU.S. Army Corps of Engineers
New England District
696 Virginia Road
Concord, MA 01742
9. SPONSORING/MONITORING AGENCY NAME(S) AND ADDRESS(ES) 10. SPONSORING/MONITORING AGENCY REPORT NUMBERU.S. Army Corps of Engineers
New England District
696 Virginia Road
Concord, MA 01742
11. SUPPLEMENTARY NOTES
12a. DISTRIBUTION AVAILABILITY STATEMENT 12b. DISTRIBUTION CODE
Approved for public release,
distribution unlimited
13. ABSTRACT (Maximum 200 words)
The purpose of this study was to identify impacts on flood zones that would be brought about by the removal of five dams on the Woonasquatucket River in Providence, Rhode Island. The Corps of Engineers conducted this study at the request of the City of Providence, under authority of the Flood Plain Management Services (FPMS) program. The hydraulic analysis for he removal of the five dams (Rising Sun Dam, Paragon Dam, Atlantic Mills Dam, Dyerville Dam, and Manton Pond Dam)
considered the effects of dam removal on water surface elevations and channel velocities. The study showed that removal of he five dams would not have a major impact on flooding along the river reach found in Providence, as a whole. However,
removal of the Rising Sun, Paragon, and Atlantic Mills dams could bring localized flood level relief just upstream of these structures. There is no significant flooding just upstream of the other two dams so their removal was not seen as beneficial for flood reduction. With dam removal comes increased water velocities and this can lead to the resuspension of contaminated sediments in the area. Further investigation of this potential problem needs to be addressed, and options weighed, prior to proceeding with any dam removals.
14. SUBJECT TERMS 15. NUMBER OF PAGES
dam, flooding, Woonasquatucket River, Providence 26 16. PRICE CODE
17. SECURITY CLASSIFICATION 18. SECURITY CLASSIFICATION 19. SECURITY CLASSIFICATION 20. LIMITATION OF ABSTRACT OF REPORT OF THIS PAGE OF ABSTRACT
Unclassified Unclassified Unclassified Standard Form 298 (Rev. 2-89) (EG)Prescribed by ANSI Std. 232399 18 Designed using Perform Pro,WHS/DIOR, Oct 94
WOONASQUATUCKET RIVER DAM REMOVAL FLOOD STUDY PROVIDENCE. RHODE ISLAND
TABLE OF CONTENTS
Paragraph Subject Page
1 PURPOSE AND SCOPE 1
2 AUTHORITY 1
3 DESCRIPTION OF STUDY AREA
a. General 1 b. Rising Sun Dam 2 c. Paragon Dam 2 d. Atlantic Mills Dam 2 e. Dyerville Dam 2 f. Manton Pond Dam 3 g. Climatology 3
4 STUDY PROCEDURES
a. General 3 b. Dam Removal Alternatives 3 c. HEC-RAS Analysis 4
5 RESULTS
a. General 5 b. Rising Sun Dam 5 c. Paragon Dam 6 d. Atlantic Mills Dam 6 e. Dyerville Dam 7 f. Manton Pond Dam 8
6 SUMMARY 8
REFERENCES 11
WOONASOUATUCKET RIVER DAM REMOVAL FLOOD STUDY PROVIDENCE. RHODE ISLAND
LIST OF PLATES
Plate Title
1 Woonasquatucket River, Providence, RI Dams Investigated
2 Water Surface Profiles at Rising Sun Dam
3 Channel Velocity Profiles at Rising Sun Dam
4 Water Surface Profiles at Paragon Dam
5 Channel Velocity Profiles at Paragon Dam
6 Water Surface Profiles at Atlantic Mills Dam
7 Channel Velocity Profiles at Atlantic Mills Dam
8 Water Surface Profiles at Dyerville Dam
9 Channel Velocity Profiles at Dyerville Dam
10 Water Surface Profiles at Manton Pond Dam
11 Channel Velocity Profiles at Manton Pond Dam
11
WOONASQUATUCKET RIVER DAM REMOVAL FLOOD STUDY PROVIDENCE. RHODE ISLAND
1. PURPOSE AND SCOPE
The purpose of this study is to identify impacts on flood zones that would be brought about by the removal of five dams on the Woonasquatucket River. The scope of the study consists of a quantitative description of the hydrologic effect of removing these dams. The characteristics evaluated are flood elevation and channel velocity. This report presents hydrologic data comparing existing flood characteristics to those expected with the dams removed. Sections included are a description of the study area, study procedures, results and a summary.
2. AUTHORITY
The U.S. Army Corps of Engineers (ACOE), New England District, was requested by the City of Providence, Rhode Island to evaluate the effect of dam removals on flooding issues along the Woonasquatucket River. The study was conducted under the ACOE's Flood Plain Management Services (FPMS) program. The FPMS program is authorized under Section 206 of the Flood Control Act of 1960 (PL-86-645).
3. DESCRIPTION OF STUDY AREA
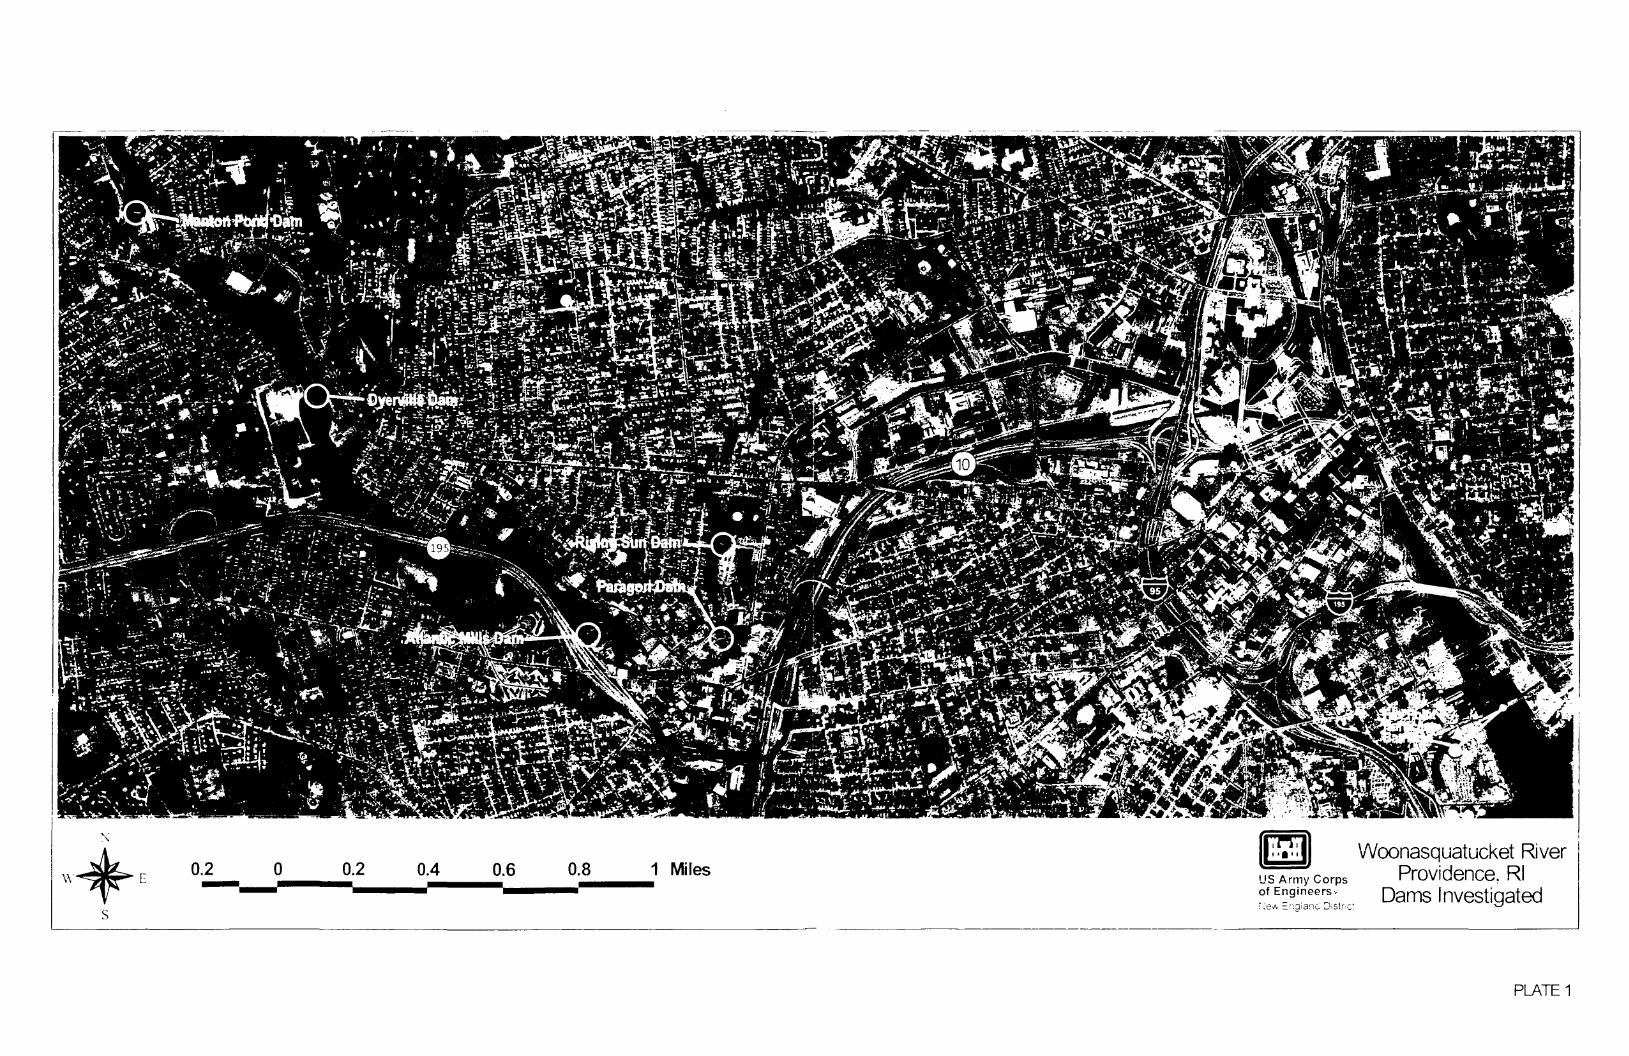
a. General. The study area (refer to Plate 1 for dam locations) is on the Woonasquatucket River in Providence County, Rhode Island. Three of the dams considered, the Rising Sun Dam, the Paragon Dam and the Atlantic Mills Dam, are located within the City of Providence. The other two, the Dyerville Dam and the Manton Pond Dam, are on the portion of the river that serves as the corporate boundary between Providence and Johnston, Rhode Island.
The river section analyzed encompasses an area from the corporate boundary between North Providence and Providence, where the river flows through Manton Pond, to a point approximately 0.07 miles upstream of where Interstate 95 crosses overhead, in downtown Providence. From the upper to lower ends of this reach, the channel bottom falls approximately 62 feet at an overall average rate of 14.4 feet per mile. Beyond the study area, the Woonasquatucket River continues through downtown Providence, where it joins the Moshassuck River to form the Providence River, which flows through the Fox Point Hurricane Barrier and Providence Harbor.
Within the study area, the Woonasquatucket River flows through heavily developed lands. Buildings or floodwalls often bound the channel, with local roads and highways nearby. The 4.29 miles of river that were analyzed flow under twenty bridges and two buildings.
The drainage area of the river above the study area, measured at the North Providence/Providence corporate limits (approximately 0.13 miles upstream of the Manton Pond Dam), is 43.8 square miles. The drainage area increases by 4.0 square miles (47.8 square miles total) as the river flows through the reach containing the five dams investigated and on to the Atwells Avenue crossing, approximately 0.46 miles downstream of the Rising Sun Dam.
b. Rising Sun Dam. The most downstream dam on the Woonasquatucket River is located between the Valley Street and Delaine Street crossings, 2.90 miles upstream of the Fox Point Hurricane Barrier. The general hydraulic characteristics of the dam were determined to be a 97.3 foot spillway width, an 8.7 foot fall from centerline spillway crest to toe, and a centerline spillway crest elevation of 16.4 feet (NGVD 29). These hydraulic characteristics were based on a survey performed in December 1998.
c. Paragon Dam. This dam is located 0.26 miles upstream of the Rising Sun Dam, between the Delaine Street and lower Manton Avenue crossings. The general hydraulic characteristics of the dam were determined to be a 95.4 foot spillway width, a 5.6 foot fall from centerline spillway crest to toe, and a centerline spillway crest elevation of 21.8 feet (NGVD 29). These hydraulic characteristics were based on a survey performed in December 1998.
d. Atlantic Mills Dam. This dam is located 0.49 miles upstream of the Paragon Dam, between the lower Manton Avenue and lower Route 195 crossings. The general hydraulic characteristics of the dam were determined to be a 100.0 foot spillway width, an 11.1 foot fall from centerline spillway crest to toe, and a centerline spillway crest elevation of 32.3 feet (NGVD 29). Flashboard has been used to increase the height of the spillway across 63 feet of its width (including the centerline), leaving 37 feet of spillway at a crest elevation of only 31.3 feet (NGVD 29). These hydraulic characteristics were based on a survey performed in December 1998.
e. Dverville Dam. This dam is located 1.19 miles upstream of the Atlantic Mills Dam, between the Glenbridge Avenue and upper Manton Avenue crossings. The general hydraulic characteristics of the dam were assumed to be a 107 foot spillway width, a 5.1 foot fall from centerline spillway crest to toe, and a centerline spillway crest elevation of 51.8 feet (NGVD 29). No current survey data for this dam was available during this study. Therefore, these hydraulic characteristics were based on Federal Emergency Management Agency (FEMA) flood insurance study (FIS) data that was first reported in November 1976, and then updated in April 1980. It has been reported that this dam was breached some time ago. The information used for calculations in this study represents the dam's pre-breach condition. Thus, any change in flood characteristics predicted from the removal of this dam must be taken as the maximum change possible (refer to Section 5.e).
f. Manton Pond Dam. The last dam before the Providence/North Providence corporate boundary is located 0.76 miles upstream of the Dyerville Dam, between the upper Manton Avenue crossing and the corporate limits. The general hydraulic characteristics of the dam were determined to be an 82 foot spillway width, a 5.5 foot fall from centerline spillway crest to toe, and a centerline spillway crest elevation of 63.9 feet (NGVD 29). No current survey data for this dam was available during this study. Therefore, these hydraulic characteristics were based on FEMA FIS data that was first reported in November 1976, and then updated in April 1980. Observations made during an ACOE inspection in April 1999 confirmed that the general features and dimensions of this dam have remained unchanged. Comparison of the ACOE inspection findings to the FEMA data used here shows general agreement.
g. Climatology. The area has a variable climate, and frequently experiences periods of heavy precipitation produced by local thunderstorms and larger weather systems of tropical and extratropical origin. The area lies in the path of the prevailing "westerlies" which generally travel across the country in an easterly or northeasterly direction, producing frequent weather changes. The climate is characterized as moderate, and the mean annual temperature is 50.4 degrees Fahrenheit (°F). Temperatures range from an average 27.9 °F in January to an average of 72.7 °F in July. The average yearly precipitation (water equivalent) is 45.5 inches.
4. STUDY PROCEDURES
a. General. This section discusses the methods and assumptions used in the study of the removal of the five Woonasquatucket River dams in Providence, Rhode Island. The existing dams, crossings, and river were hydraulically modeled with multiple flow rates to determine water surface elevations and velocities for a range of events. Two removal alternatives were then modeled to determine corresponding water elevations and velocities. The results of each of the removal alternatives were compared to the results of the existing conditions to determine the effects that dam removals will have on the peak water surface elevations and velocities along the river.
b. Dam Removal Alternatives. Two alternatives were modeled and compared to the existing conditions. The first was a partial removal that could be part of a plan to keep accumulated sediments behind the dam stabilized. The full dam removal option included a new gradual channel slope in the vicinity of the dam. Neither alternative assumed channel widening as a possibility; just removal of the dam structure. The two removal alternatives are described below.
(1) Partial Dam Removal. This alternative included the removal of that portion of the dam which is exposed to upstream flow. The remainder of the dam would be left in place to help stabilize sediments behind the dam. This option is of particular interest where contaminated sediments are concerned. Further investigation would be needed, prior to implementation of this alternative, to determine the possibility of sediment re
suspension or methods to prevent re-suspension, and other protective measures as required. For purposes of this study, it was assumed that the existing channel topography could be maintained by some means after the removal of the upper portion of the dam. The results of the modeling of this option are not provided in the profiles included on Plates 2 through 11 of this report, but are considered in the discussion of results. This is due to the fact that these results usually approximate either the existing profiles, or the profiles predicted for complete dam removal (see below).
(2) Complete Dam Removal. This alternative involved removal of the entire dam structure. Once the dam is removed, any sediment that had accumulated behind it would be more susceptible to re-suspension in the water column, if left in place. Pre-dam removal dredging and channel stabilization must be considered in order to avoid natural redistribution of sediments. For purposes of this study, it was assumed that a gradual channel slope could be stabilized between approximately 50 feet downstream and 250 feet upstream of the dam location. The existence of any bedrock in the area may alter grading plans. This alternative is depicted in the profiles included on Plates 2 through 11, since it provides the maximum expected change in flood levels of the two options.
c. HEC-RAS Analyses. The ACOE's Hydrologic Engineering Center's River Analysis System (HEC-RAS) computer model was used to conduct steady flow analyses. Input for the model included boundary conditions, flow regime, loss coefficients,
structure characteristics, and cross section geometry. Outputs from the model, of importance to this study, include computed water surface elevations and channel velocities.
It has been reported that under normal flow conditions, tidal influence from Providence Harbor extends to the downstream side of the Rising Sun Dam. This influence would be insignificant for freshwater flood levels such as those considered in this study, due to the influence of the Fox Point Hurricane Barrier. The barrier is operated to minimize the impact of the tide on upstream flood levels which exceed approximately 4 feet NGVD. Since the lowest flood elevation considered at the Rising Sun Dam is above 15 feet NGVD, no significant impact on freshwater flood levels from tidal action is expected at the site.
River geometry and structure information was obtained from a combination of existing FEMA FIS data and new survey data collected in December 1998. The 1998 survey was conducted to update the FEMA FIS data; providing more detail at points of interest from the Valley Street crossing up to the Glenbridge Avenue crossing. This survey included three of the dams of interest, the Rising Sun, Paragon, and Atlantic Mills Dams.
Water surface elevations of flows of selected recurrence intervals were computed through the use of the HEC-RAS software. The analysis was started approximately 0.07 miles upstream of the Interstate 95 crossing, or midway between the Fox Point Hurricane
Barrier and the lowest modeled removal, the Rising Sun Dam. Computations were carried out over 4.29 miles of the river, ending at the corporate boundary between Providence and North Providence, approximately 0.13 miles upstream of the highest modeled removal, the Manton Pond Dam.
Multiple flows were used to calibrate the HEC-RAS model, representing conditions predicted for the 10-year, 50-year, 100-year and 500-year peak discharges. These conditions were based on those used for the FEMA FIS. Since much of the study area has remained the same from the time of that previous study, flood levels predicted then were used to calibrate the new model. For purposes of discussion in this report, results predicted for the 10-year and 100-year flood events are presented, being representative of moderate and significant flood events which could reasonably be expected in the foreseeable future.
5. RESULTS
a. General. The findings of this study are that removal of none of the five dams will have a far-reaching impact on flood levels. However, the Rising Sun Dam, Paragon Dam and Atlantic Mills Dam removals all have the potential to provide localized relief in the areas just upstream of their locations. Each removal has been found to cause a localized flood reduction, and the removal of no dam has any flood reduction effect in the same reach as another.
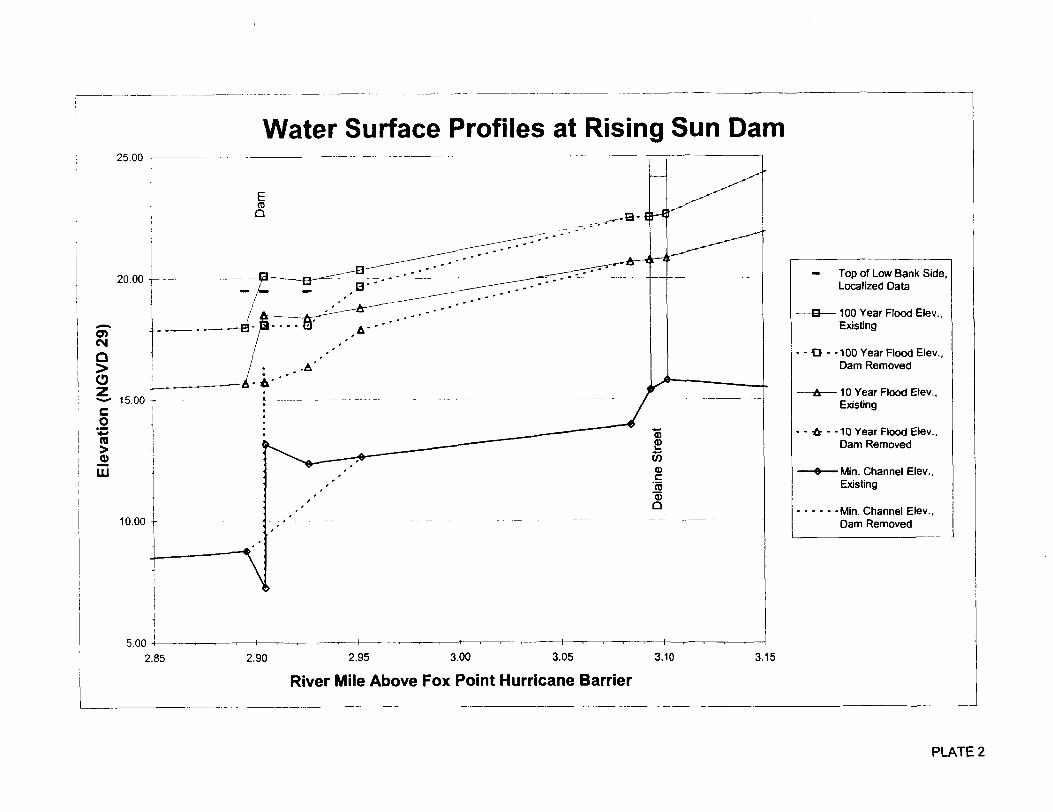
b. Rising Sun Dam. The result of removing the Rising Sun Dam on flooding would be of some significance only in the area found immediately upstream of the dam. In this vicinity, the river channel under existing conditions contains the 10-year flood, so any out-of-bank flood reduction achieved would be for statistically less frequent events. The 100-year flood, which effects an area on the east bank under existing conditions, will be contained within the river channel near the dam (for total dam removal) However, this reduction will diminish proceeding upstream. Existing and post-removal flood levels will be the same at the Delaine Street crossing.
(1) Water Surface Elevations. Plate 2 shows a comparison of the existing 10 and 100-year flood profiles to those calculated when the dam is removed and the channel graded as shown. It can be seen that the benefit of dam removal would be a 2 to 3 foot decrease in flood levels at the dam location. However, this improvement diminishes to a foot or less within 0.05 miles of the dam, becoming insignificant approximately 0.10 miles upstream.
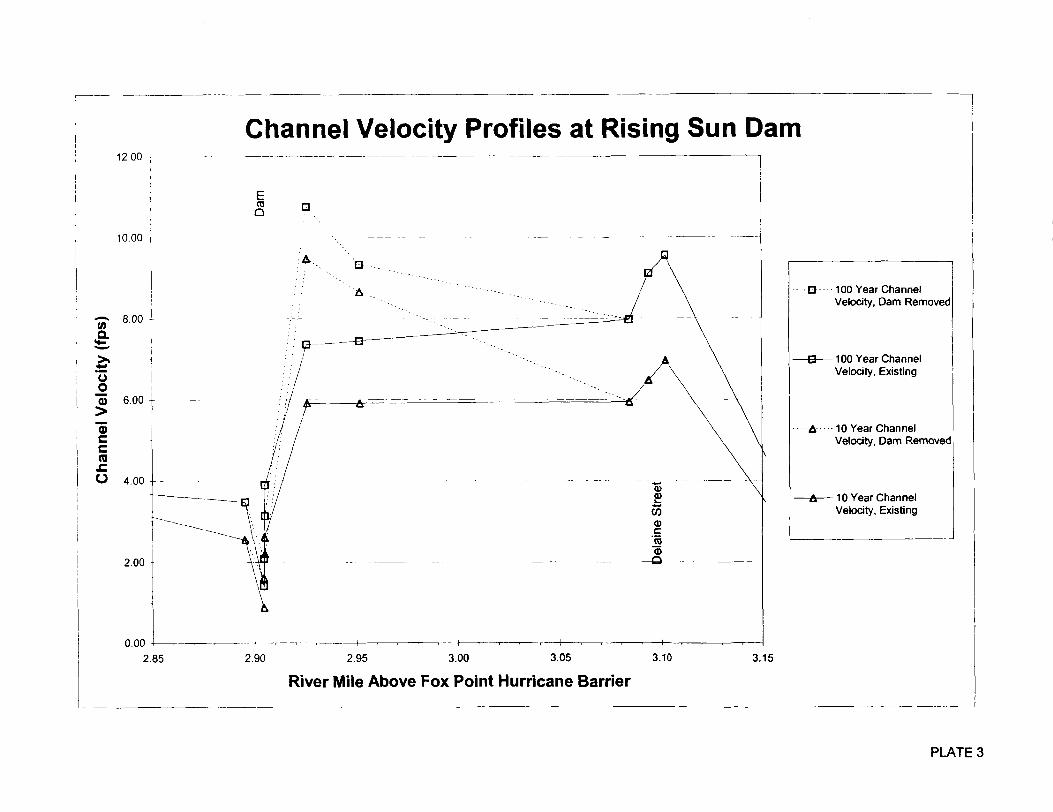
(2) Channel Velocities. Plate 3 relates the change in channel velocity for the same events as mentioned above. An increase in velocity results from the dam removal, rising by more than 3 feet per second (fps) in a reach about 0.02 miles upstream of the dam location. This increase will raise the concern over sediment re-suspension and erosion impacts, particularly since the new velocity may exceed 10 fps during the 100
year event.
(3) Removal Options. When calculations were made for a partial dam removal (refer to Section 4.b), it was found that similar decreases in flood levels would be achieved without the channel being graded as assumed for the complete removal (the case examined above). This means that the flood level drop described above can be approached even if the channel is not graded. Similar channel velocities were found regardless of which option was used.
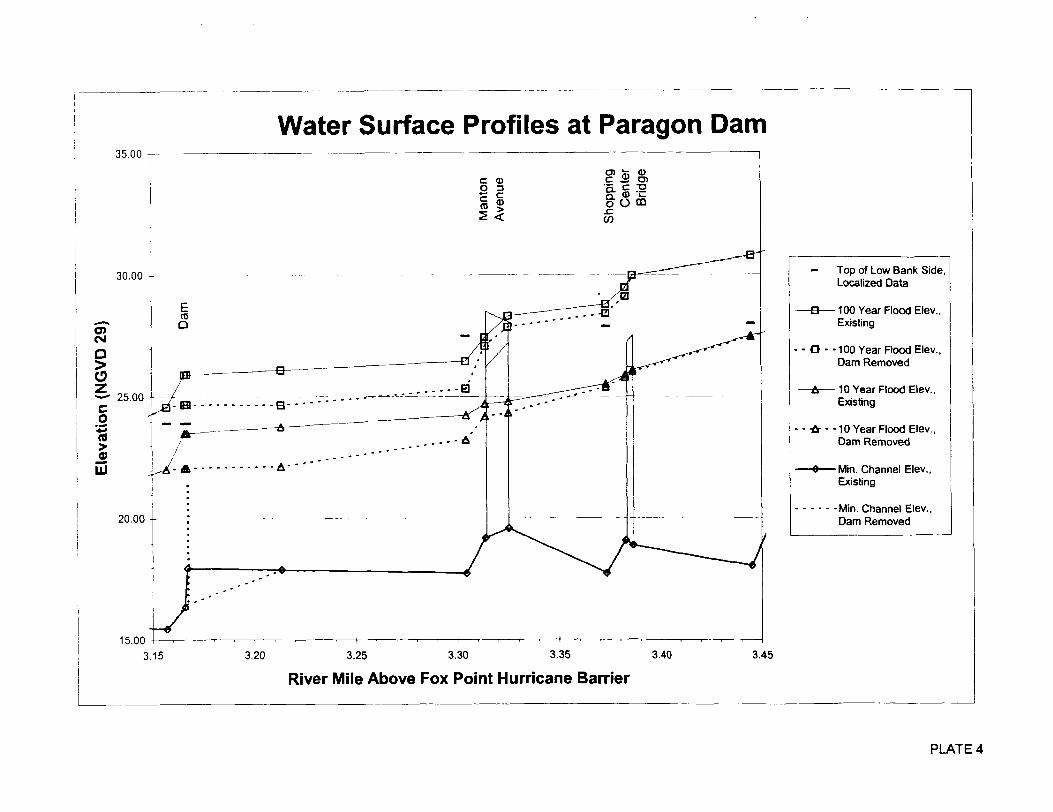
c. Paragon Dam. The greatest impact on flooding from the removal of the Paragon Dam would be found between the dam location and the nearby upstream Manton Avenue crossing. Although the 10-year flood is already contained within the river channel, the decrease in flood levels would lessen the impact of the 100-year flood over both banks. Flood reduction for the 100-year event would be seen across nearby short stretches of San Soucci and Valley Streets.
(1) Water Surface Elevations. Plate 4 shows a comparison of the existing 10 and 100-year flood profiles to those calculated when the dam is removed and the channel graded as shown. It can be seen that the benefit of dam removal would be an approximately 1 to 1.5 foot decrease in flood levels from the dam location to a point within 0.01 miles of the Manton Avenue crossing.
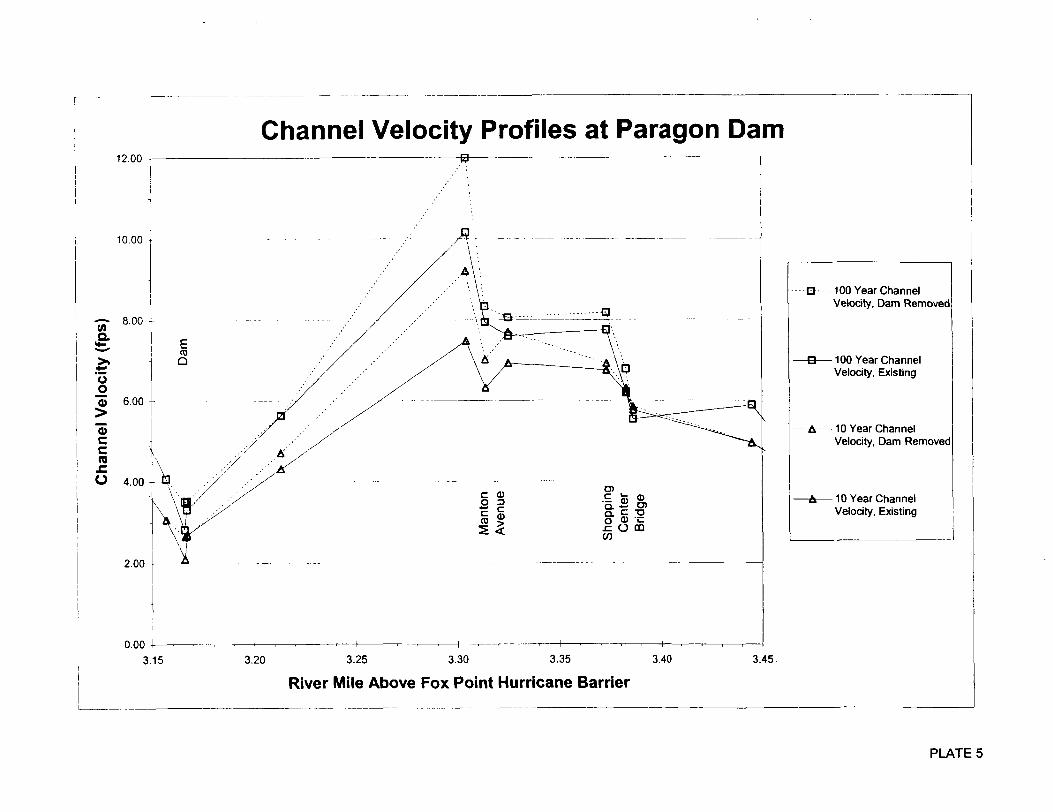
(2) Channel Velocities. Plate 5 relates the change in channel velocity for the same events as mentioned above. An increase in velocity results from the dam removal, rising by approximately 2 fps in a reach just downstream of Manton Avenue, but elsewhere the change is insignificant. This higher velocity will raise the concern over sediment re-suspension and erosion impacts, particularly since this reach experiences one of the highest channel velocities in the study area, with or without the dam in place.
(3) Removal Options. When calculations were made for a partial dam removal (refer to Section 4.b), it was found that similar decreases in flood levels would be achieved without the channel being graded as assumed for the complete removal (the case examined above). This means that the flood level drop described above can be approached even if the channel is not graded. Without the grading, the channel velocity increase described would be lessened by approximately 0.5 fps.
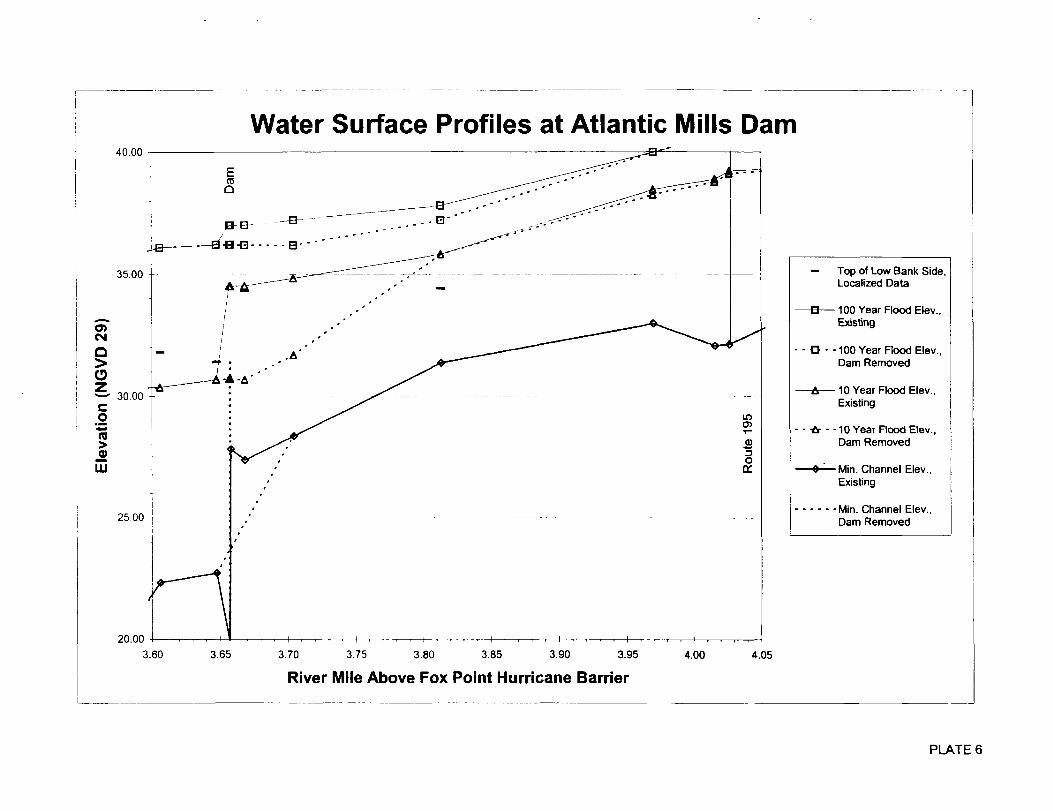
d. Atlantic Mills Dam. The area north of the Atlantic Mills Dam, on the northeast bank of the river, sees more frequent flooding than any other area effected by the dams investigated in this study. If the dam were removed, the 10-year flood would then be contained throughout most of this reach, and the 100-year flood impact would be lessened.
(1) Water Surface Elevations. Plate 6 shows a comparison of the existing 10 and 100-year flood profiles to those calculated when the dam is removed and the channel
graded as shown. It can be seen that the biggest benefit of dam removal would be a 4 foot decrease in the 10-year flood level at the dam location. Continuing upstream from the dam about 0.15 miles from the dam, the 10-year flood gradually returns to existing levels, while the 100-year flood maintains an approximately 1 foot decrease. Above this point, flood level improvements are minimal.
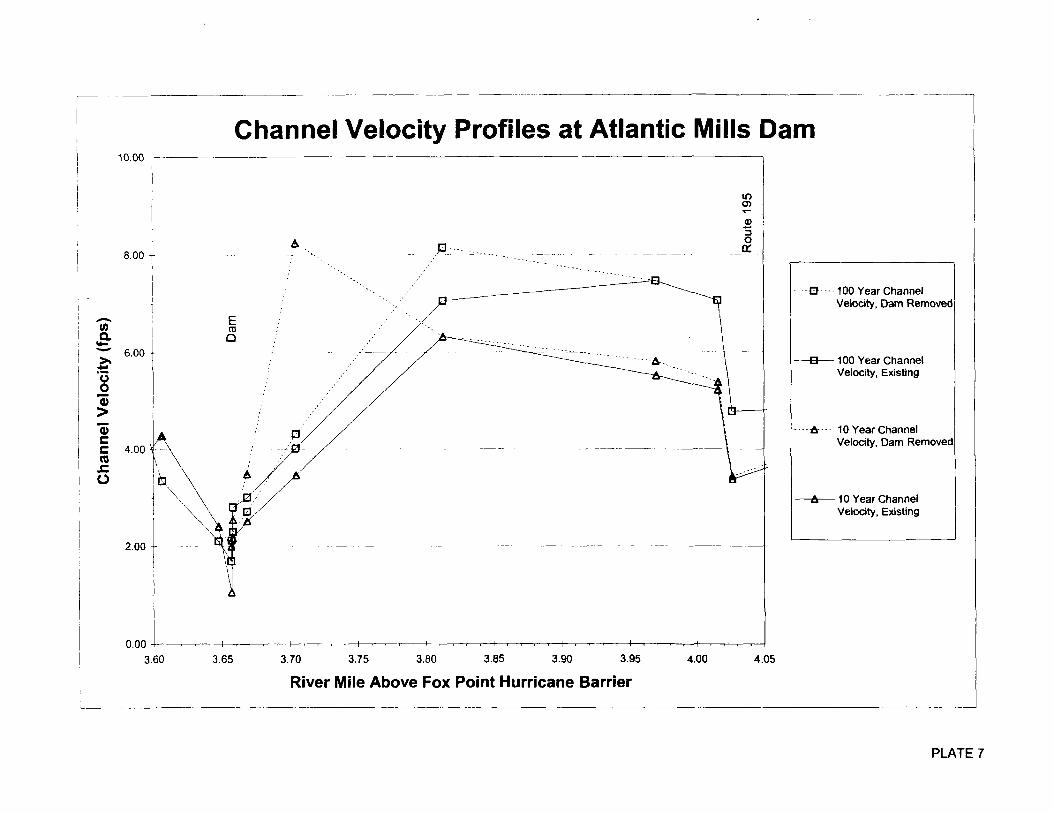
(2) Channel Velocities. Plate 7 relates the change in channel velocity for the same events as mentioned above. A significant increase in velocity results from the dam removal during the 10-year flood, more than doubling to over 8 fps just above the dam location. This increase will raise the concern over sediment re-suspension and erosion impacts. The 100-year flood does not cause a similar problem because the floodplain (outside the river channel) handles a considerable portion of the flow, and there is only a minor reduction in 100-year flood elevations.
(3) Removal Options. When calculations were made for a partial dam removal (refer to Section 4.b), it was found that similar decreases in flood levels would be achieved without the channel being graded as assumed for the complete removal (the case examined above). This means that the flood level drop described above can be approached even if the channel is not graded. The result of maintaining the existing channel topography on channel velocity would be to achieve a more gradual increase without as drastic a change in one area.
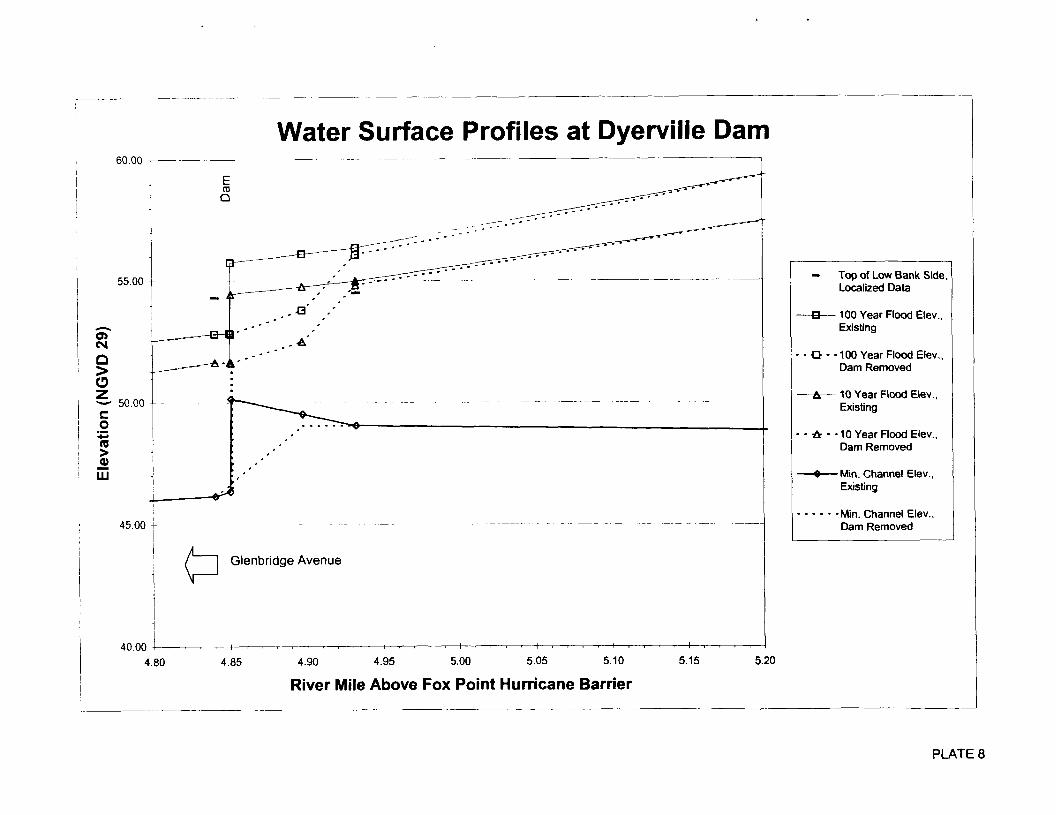
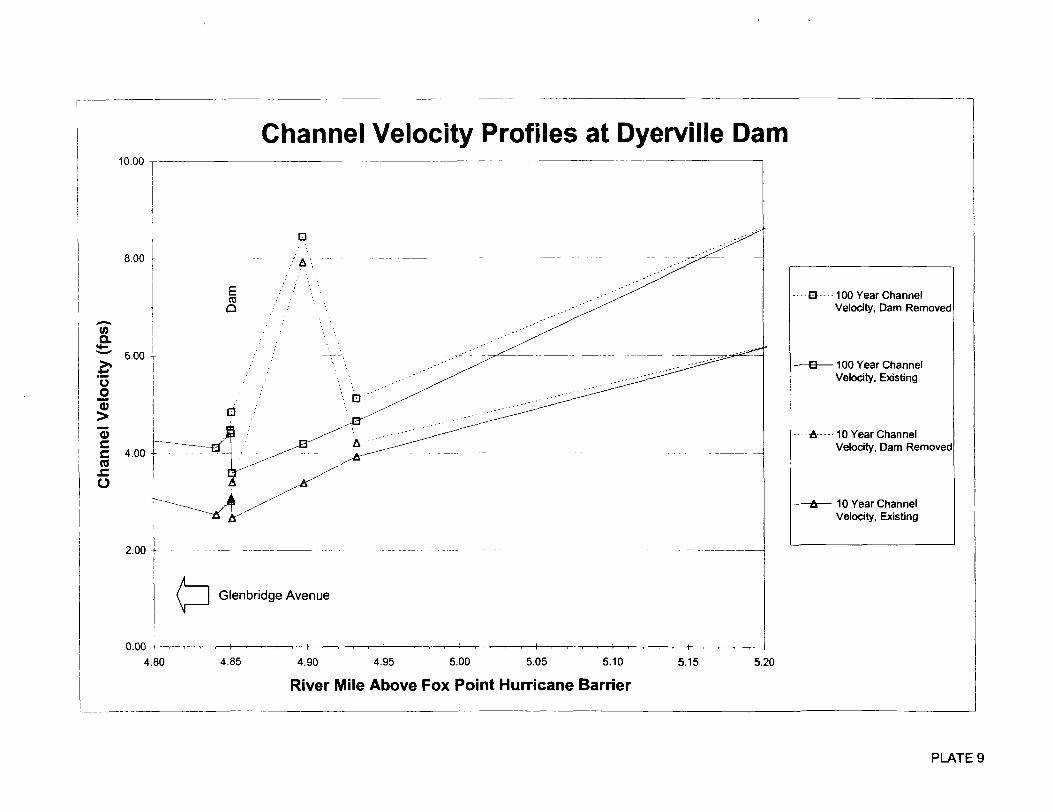
e. Dyerville Dam. The maximum result (refer to Section 3.e) of removing the Dyerville Dam on flooding would be of some significance only in the area found immediately upstream of the dam location. In this vicinity, the floodplain does not extend far, so lower flood levels will not effect an appreciable area.
(1) Water Surface Elevations. Plate 8 shows a comparison of the existing 10 and 100-year flood profiles to those calculated when the dam is removed and the channel graded as shown. It can be seen that the benefit of dam removal would be an approximately 3 foot decrease in flood levels at the dam location. However, this improvement becomes insignificant within 0.1 miles upstream.
(2) Channel Velocities. Plate 9 relates the change in channel velocity for the same events as mentioned above. An increase in velocity results from the dam removal, at least doubling to approximately 8 fps in a reach about 0.05 miles upstream of the dam location. This increase will raise the concern over sediment re-suspension and erosion impacts.
(3) Removal Options. When calculations were made for a partial dam removal (refer to Section 4.b), it was found that similar decreases in flood levels would not be achieved without the channel being graded as assumed for the complete removal (the case examined above). Although partial removal does allow improvement (about half of that seen from complete removal), the flood level drop described above can not be ful ly
7
approached if the channel is not graded. Without the grading, the channel velocity increase described would be lessened by approximately 1.5 fps during the more common 10-year flood, and approximately 0.5 fps during the 100-year flood.
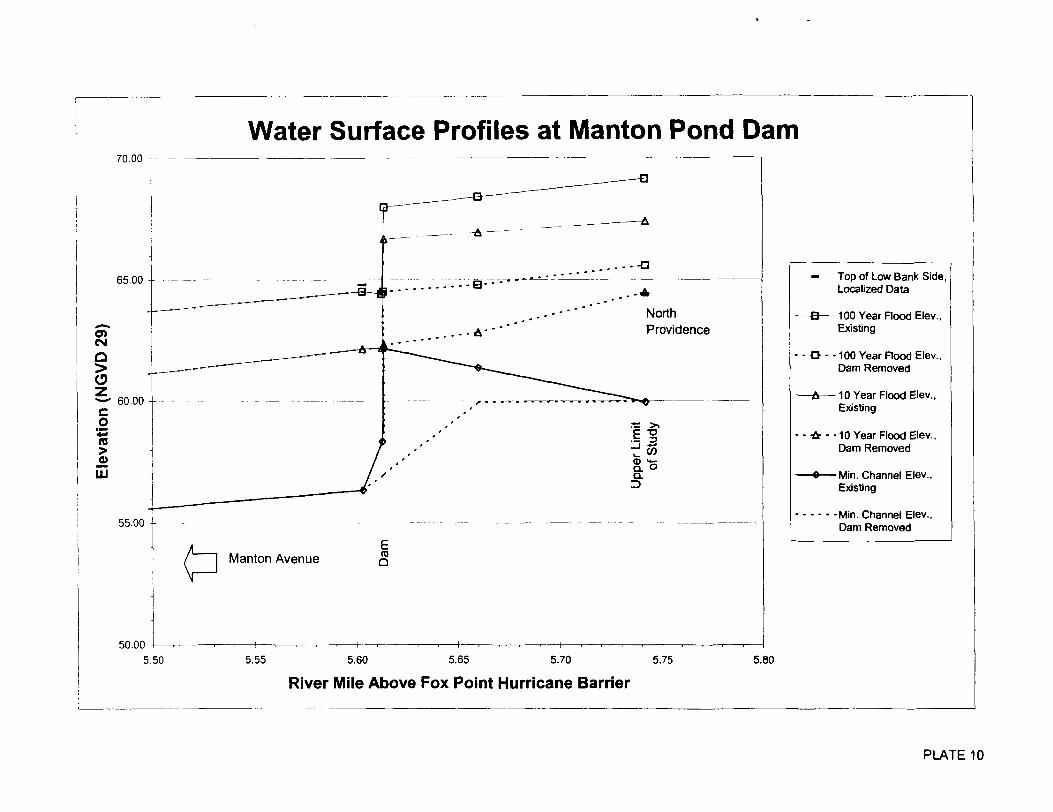
f. Manton Pond Dam. The effect of removing the Manton Pond Dam on flood levels in Manton Pond would carry into North Providence, beyond the upper boundary of this study. In this vicinity, the floodplain does not extend far, so lower flood levels will not effect an appreciable area. The full extent of the impact on the pond, within and beyond this study's limits, should be considered before any work is proposed.
(1) Water Surface Elevations. Plate 10 shows a comparison of the existing 10 and 100-year flood profiles to those calculated when the dam is removed and the channel graded as shown. It can be seen that the benefit of dam removal would be an approximately 3.5 to 4.5 foot decrease in flood levels at the dam location. This change diminishes some, but is still significant, towards the upper study limit. The effect would likely carry further upstream than for other dams considered in this study, particularly during less frequent floods (such as the 100-year event).
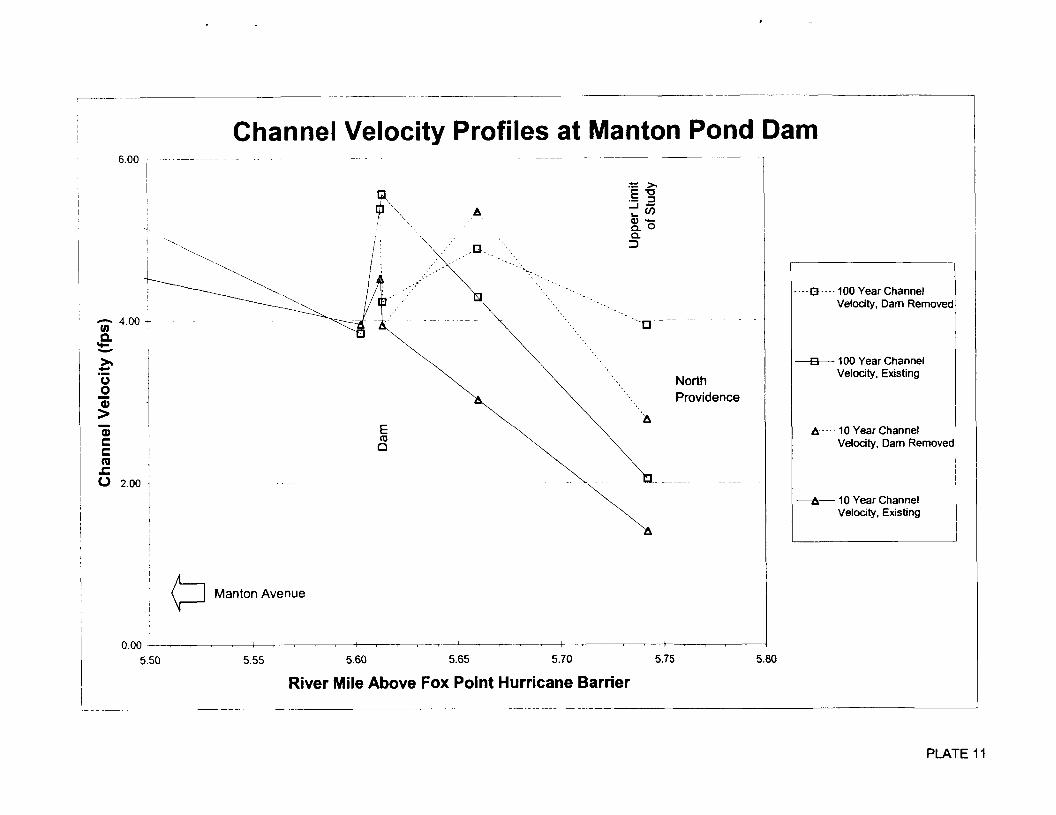
(2) Channel Velocities. Plate 11 relates the change in channel velocity for the same events as mentioned above. The resulting increased velocities predicted upstream of the dam (continuing above the upper study limit) would be lower than those expected at the other dams. However, this change will possibly still raise the concern over sediment re-suspension and erosion impacts due to the relative increase in magnitude of velocity. Since the existing velocities through Manton Pond are low compared to the rest of the study area, smaller particles are likely to have settled in the sediments and would be more susceptible to re-suspension.
(3) Removal Options. When calculations were made for a partial dam removal (refer to Section 4.b), it was found that similar decreases in flood levels would not be achieved without the channel being graded as assumed for the complete removal (the case examined above). This means that the flood level drop described above would only be approached if the channel is graded. Without the grading, the channel velocity would be greater in this instance (higher than anywhere within the study area), due to a decrease in head of approximately4 feet over a short distance. Since the Manton Pond Dam is located at a point where the river channel suddenly constricts and drops in elevation, grading the channel serves to provide a gradual drop in velocities such as those shown on Plate 11.
6. SUMMARY
The hydraulic analysis for the removal of five dams on the Woonasquatucket River considered the effects of dam removal on water surface elevations and channel velocities. The HEC-RAS model was used to analyze the existing conditions and potential removal scenarios. The study showed that removal of the five dams would not have a major
8
impact on flooding along the river reach found in Providence, as a whole. However, removal of three dams could bring localized relief just upstream of those dam locations. Each removal can be regarded as an independent measure, as effects were not found to be cumulative at any point.
Of the five dams investigated, the three most downstream locations stand to gain appreciable local flood relief through dam removal. It was found that removal of the Rising Sun Dam, Paragon Dam and Atlantic Mills Dam would lessen the impact of rare, but expected events such as the 100-year flood. Of these three, only the Atlantic Mills Dam area experiences difficulty with more frequent occurrences that could be effected, such as the 10-year flood, and thus would be the dam removal site to see relief most often. The dropping of flood levels caused by the removal of the Dyerville Dam or the Manton Pond Dam were determined to provide less benefit since the 10 and 100-year floods do not cause extensive flooding beyond the river channel in these areas.
The trade off for achieving lower flood levels by removing a dam is that channel velocities will rise. Expected increased velocity through a reach requires consideration of the need to prevent sediment re-suspension, bank erosion, and wall/foundation undermining. One concern is that re-suspended solids will settle somewhere downstream, raising the channel bed at that location. Also, re-suspended sediments expose any contaminants they may contain to the water column where they can potentially be released, or resettle with the sediments in a new area, thus facilitating the migration of the contaminant. Further investigation of this potential problem needs to be addressed, and options weighed, prior to proceeding with any dam removals.
When two different removal options were considered at each site, it was seen that the assumed channel grading was not always necessary to approach the flood level decreases that were predicted. If it is determined to be desirable to maintain the existing river bed geometry surrounding a dam after its removal, potential flood level improvements at the Rising Sun Dam, Paragon Dam, and Atlantic Mills Dam would not be significantly effected by this decision. This is beneficial when considering options to handle sediments that have accumulated behind a dam. A plan that would include stabilizing sediments at these sites is thus worth investigating. Determination of bedrock existing at dam locations, or in the upstream reach, would aid in stabilization efforts, and would impact any grading plans.
There are other considerations that are beyond the scope of this study. The draining effect on pooled waters during normal flow conditions could significantly effect existing habitat, particularly at Manton Pond. There is a potential to create flooding caused by ice jams at former dam locations, where the channel geometry narrows and changes are made from a steep slope to one more gradual. Cost effectiveness should also be considered, weighing flood damages prevented against the cost of the removal, which could include expenses for the removal or stabilization of sediments.
An alternative (or additional) measure to dam removals that could be considered is channel improvements along the Woonasquatucket River. Widening or deepening the channel may be an option, particularly where sediments have been building up. The formation of islands has been noted, for example, near the Pleasant Valley Parkway crossing. Since much of the area along the river is developed, areas where channel widening is possible may be limited.
10
REFERENCES
Coler & Colantonio, Incorporated, Hydrodynamic Modeling Site Survey, Woonasquatucket River, Providence, Rhode Island, Norwell, MA, December 31,1998.
Federal Emergency Management Agency (FEMA), Flood Insurance Study - City of Providence, Rhode Island, Providence County, April 15, 1986.
Federal Emergency Management Agency (FEMA), Flood Insurance Study - Town of North Providence, Rhode Island, Providence County, September 30, 1993.
U.S. Army Corps of Engineers, HEC-RAS River Analysis System, User's Manual, Hydrologic Engineering Center, Davis, CA, April 1997.
U.S. Army Corps of Engineers, Woonasquatucket River Dam Investigations, Rhode Island, New England District, Concord, MA, August 1999.
11
Woonasquatucket River us Army corps Providence, Rl of Engineers, Dams Investigated
c! ^
PUVTE1
25.00
Water Surface Profiles at Rising Sun Dam
20.00 — Top of Low Bank Side, Localized Data
O)W Q
O
O "̂ ra _« UJ
15.00
—B— 100 Year Flood Elev., Existing
- -Q--100 Year Flood Elev., Dam Removed
—A— 10 Year Flood Elev., Existing
••• f t • -10 Year Flood Elev., Dam Removed
0 Min. Channel Elev., Existing
10.00 -Min. Channel Elev., Dam Removed
5.00 2.85 2.90 2.95 3.00 3.05
River Mile Above Fox Point Hurricane Barrier
3.10 3.15
PLATE 2
12.00
Channel Velocity Profiles at Rising Sun Dam
100 Year Channel Velocity, Dam Removed
-100 Year Channel Velocity, Existing
-A 10 Year Channel Velocity, Dam Removed
-10 Year Channel Velocity, Existing
0.00
2.85 2.90 2.95 3.00 3.05 3.10 3.15
River Mile Above Fox Point Hurricane Barrier
PLATE 3
35.00
Water Surface Profiles at Paragon Dam
30.00 — Top of Low Bank Side, Localized Data
0> (M O
1 C O
I fl> Hi
25.00 -
-Q—100 Year Flood Elev., Existing
• O • -100 Year Flood Elev., Dam Removed
-A— 10 Year Flood Elev., Existing
•& - -10 Year Flood Elev., Dam Removed
0 Mm. Channel Elev., Existing
20.00 -•Mm. Channel Elev., Dam Removed
15.00 3.15 3.20 3.25 3.30 3.35
River Mile Above Fox Point Hurricane Barrier
3.40 3.45
PLATE 4
12.00
Channel Velocity Profiles at Paragon Dam
D 100 Year Channel Velocity, Dam Removed
-100 Year Channel Velocity, Existing
A 10 Year Channel Velocity, Dam Removed
-10 Year Channel Velocity, Existing
3.20 3.25 3.30 3.35
River Mile Above Fox Point Hurricane Barrier
3.40 3.45
PLATES
40.00
Water Surface Profiles at Atlantic Mills Dam
— Top of Low Bank Side, Localized Data
B— 100 Year Flood Elev., Existing
-0 - -100 Year Flood Elev., Dam Removed
A— 10 Year Flood Elev., Existing
-•fr --10 Year Flood Elev., Dam Removed
0 Min. Channel Elev., Existing
-Min. Channel Elev., Dam Removed
20.00 3.60 3.65 3.70 3.75 3.80 3.85 3.90 3.95
River Mile Above Fox Point Hurricane Barrier
4.00 4.05
PLATE 6
10.00
Channel Velocity Profiles at Atlantic Mills Dam
Q 100 Year Channel Velocity, Dam Removed
-100 Year Channel Velocity, Existing
A 10 Year Channel Velocity, Dam Removed
-10 Year Channel Velocity, Existing
0.00 3.60 3.65 3.70 3.75 3.80 3.85 3.90 3.95 4.00 4.05
River Mile Above Fox Point Hurricane Barrier
PLATE 7
60.00
Water Surface Profiles at Dyerville Dam
— Top of Low Bank Side, Localized Data
-Q— 100 Year Flood Elev., Existing
O--100 Year Flood Elev., Dam Removed
-A— 10 Year Flood Elev., Existing
• A- • • 10 Year Flood Elev., Dam Removed
0 Min. Channel Elev., Existing
-Min. Channel Elev., Dam Removed
4.85 4.90 4.95 5.00 5.05 5.10 5.15 5.20
River Mile Above Fox Point Hurricane Barrier
PLATES
10.00
Channel Velocity Profiles at Dyerville Dam
•B 100 Year Channel Velocity, Dam Removed
-100 Year Channel Velocity, Existing
A 10 Year Channel Velocity, Dam Removed
-10 Year Channel Velocity, Existing
0.00 4
4.80 4.85 4.90 4.95 5.00 5.05 5.10 5.15 5.20
River Mile Above Fox Point Hurricane Barrier
PLATE 9
70.00
Water Surface Profiles at Manton Pond Dam
65.00 — Top of Low Bank Side, Localized Data
—Q—100 Year Flood Elev., Existing
Q - - O - - 1 0 0 Year Flood Elev., Dam Removed
c o
"•5flj
_0> UJ
60.00 - —£—10 Year Flood Elev., Existing
- A - -1 0 Year Flood Elev., Dam Removed
—«—Min. Channel Elev., Existing
55.00 -Min. Channel Elev., Dam Removed
50.00
5.50 5.55 5.60 5.65 5.70
River Mile Above Fox Point Hurricane Barrier
5.75 5.80
PLATE 10
Channel Velocity Profiles at Manton Pond Dam 600
m •»Q. O Q.
4.00
100 Year Channel Velocity, Dam Removed
£• 'o ~v
North Providence
-100 Year Channel Velocity, Existing
"3 c c re .c O 2.00
A 10 Year Channel Velocity, Dam Removed
-10 Year Channel Velocity, Existing
Manton Avenue
0.00 5.50 5.55 5.60 5.65 5.70
River Mile Above Fox Point Hurricane Barrier
5.75 5.80
PLATE 11


![CYBER DAM DAM- DAM-G70 DAM- DAM-F650 XG7000 XG5000 … · 2018-04-23 · r.e.m. Everybody Hurts [エヴリバディ・ハーツ] 4713-17 - - - - - - - Aaron Tveit/Eddie Redmayne/Students/Les](https://static.fdocuments.net/doc/165x107/5fa47dec8818c41c2e34b804/cyber-dam-dam-dam-g70-dam-dam-f650-xg7000-xg5000-2018-04-23-rem-everybody.jpg)