WOOLWORTHS - ENGEN. IS A STRATEGIC ALLIANCE FEASIBLE? …
74
WOOLWORTHS - ENGEN. IS A STRATEGIC ALLIANCE FEASIBLE? By Greig Jansen Submitted in partial fulfillment of the requirements for the degree of Masters of Business Administration Supervisor The Graduate School of Business Faculty of Management University of Natal (Durban) Prof E. Thomson 15 September 2003
Transcript of WOOLWORTHS - ENGEN. IS A STRATEGIC ALLIANCE FEASIBLE? …

WOOLWORTHS - ENGEN. IS A STRATEGIC ALLIANCE FEASIBLE?
By Greig Jansen
Submitted in partial fulfillment of the requirements for the degree of
Masters of Business Administration
Supervisor
The Graduate School of Business
Faculty of Management University of Natal (Durban)
Prof E. Thomson 15 September 2003

11
CONFIDENTIALITY CLAUSE
To whom it may concern
Re: confidentiality clause
Due to the strategic importance of this research it would be appreciated if the content remain confidential and not be circulated for a period of ten years
Sincerely
Greig Jansen 15 September 2003

III
DECLARA TION
I, Greig Michael Jansen, hereby declare that this study dissertation is my own
original work and that all sources have been accurately reported and
acknowledged, and that this document has not previously in its entirety or in
part been submitted at any university in order to obtain an academic
qualification.
G.M. Jansen
2003
096443 11 September

IV
ACKNOWLEDGEM ENTS
I wish to thank Professor Elza Thomson of the Graduate School of Business for
her guidance and her encouragement. I would also to thank the management of
Woolworths and Engen for their open support in providing me with information. I
would also like to thank Craig and Caroline for their support.

v
ABSTRACT
The ability to grow market share in a saturated market is often difficult if that
market is stable. In a country that has an economy that is not performing,
growth of a company is often vital so as to allow the prosperity of a company.
One such way to grow is for the company to form strategic alliances with other
companies that are strong where the other company is week and in so doing
stimulate a competitive advantage.
In retail store outlets and location play an important role in competitive
advantage by creating" new markets" , and if these new markets could
increase the companies existing market share, then this results in a win - win
situation for the company. Often moving into new markets involves risks as it
is the unknown.
By making a move to sell product in two pilot project Woolworths- Engen
forecourt stores, Woolworths are moving into a market where they can sell a
product group HMR's (home meal replacements) where currently they have
no close competitors , thus capitalizing. This move is heralded However as
this is a totally new format of selling, Woolworths need to ascertain if brand
integrity will be affected and whether such a project is more than just a good
idea.
It was found the NPV's and IRR's ( the way Woolworths evaluate projects and
project feasibility) from a Woolworths perspective were both extremely
positive. From Engen's position, this initiative brought about a substantial
increase in both petroleum and food store sales for the two pilot projects,
comparable with those figures prior to the pilot projects launch.
Woolworths as a company were very interested in the qualitative results
conducted by an independent consultant, as they were concerned about
maintaining brand integrity. This fear was not founded as the survey done by
actual customers shopping the pilot project stores show that customer
confidence over Woolworths brand integrity was not affected. Instead
customers enjoyed the convenience.

VI
The strength of this Alliance is that both members have brought to the part
aspects where the other member currently does not perform. Woolworths
bring their good food and strong brand name linked with market dominance
and Engen bring their immense outlet network, and prime locations. I.e. the
strategic fit between these two corporates is extremely strong. All parties
involved in this venture namely Woolworths, Engen Head Office and the
petroleum station dealer benefit financially from this initiative.

VII
TABLE OF CONTENT
CONFIDENTIALITY CLAUSE
DECLARATION
ACKNOWLEDGEMENT
ABSTRACT
TABLE OF CONTENT
CHAPTER 1: INTRODUCTION
1.1 Introduction
1.2 background and context
1.3 Motive for the Study
1.4 Value of the Study
1.5 Problem Statement
1.6 Objectives
1.7 Limitations of the study
1.8 Structure
1.9 Summary
CHAPTER 2:A LITERATURE REVIEW
2.1 Strategic Competition
2.2 Strategic Alliances
Page
ii
iii
iv
v
vii
1
2
3
4
4
5
5
5
6
8
12
CHAPTER 3: THE RESEARCH DESIGN AND METHODOLOGY
3.1 Sample and Sampling Technique
3.2 Design and Analytical Technique
3.3 Feasibility
3.4 Sustainability
3.5 Data Analysis Techniques
CHAPTER 4: OBSERVATIONS AND FINDINGS
4.1 Introduction
4.2 Findings
4.3 Observations Discussed
23
23
23
24
24
25
27
34

Vll)
4.4 Summary 39
CHAPTER 5: RECOMMENDATIONS AND CONCLUSIONS 40
CHAPTER 6: BIBLIOGRAPHY 44
APPEDESES
Appendix A
Appendix B
Appendix C
Appendix 0-
Appendix E
Appendix F
Current Business Model: Financials
Current Business Model: Financials-revised
Meadowridge Sales 2001-2002
Meadowridge Sales.2002-2003
Orange Street Sales 2001-2002
Orange Street Sales 2002-2003

IX
LIST OF TABLES
Table 2.1: Comparison of Traditional Management style vs. new style 18
Table 4.1: Original Feasibility based on sales ofR70 000 22
Table 4.2. Sales based at Current Scenario to ascertain current IRR and NPV of project 30
Table.4.3 Table showing Orange Street vs. Meadowridge customer Profile and Findings 32

x
LIST OF FIGURES
Figure 2.1: Forces driving Industry Competition
Figure 2.2 Dimensions of Strategic Alliances
9
18

CHAPTER1: INTRODUCTION
1.1. Introduction
The world of retail is a cutthroat business showing great inelasticity to the
economy and spending power of the consumer. In South Africa, the retail
industry is a relatively saturated industry with a fair percentage of customer
loyalty being driven by convenience and price/value. As the majority of retailers
are posting losses at the end of the previous financial years (2000, 2001 , 2002),
there is a constant battle between retailers to gain market share from each other.
Retailers that traditionally have served the upper tier LSM groups face the
biggest challenge in respect to gaining market share in South Africa under its
current economical conditions . One such blue chip retailer is Woolworths, whose
management have risen to the challenge by searching for new niche or existing
markets that they can enter into.
Woolworths currently enjoys majority market share in the convenience meal or
home meal replacement (HMR) market. Bearing this in mind and linking this to
the customers want for convenience, what if Woolworths offered HMR's and
convenience in the form of easily accessible long trading hour outlet stores?
Better still what if Woolworths offered their products at sites where people were
destined to stop anyway, say at a petrol station. Would this be a feasible venture
in terms of both qualitative and quantitative (such as brand integrity) factors?
Would it be sustainable, and which petroleum company should Woolworth's form
a strategic alliance with?
If this proved successful not only could this result in a new market, but this could
also result in greater market share in Woolworths current trading market as these
stores could capture new customers who because of misconceptions could
previously not have been exposed to Woolworths product.

2
This study focuses on the Woolworths decision to enter into this new market
segment and tries to identify whether this is a profitable sustainable project that
will give the company the long term edge over its competitors, and how best to
set th is up with a petroleum company such as Engen.
1.2 Background and Context
In 1999 there were 2330 small outlet stores in South Africa (980 forecourt stalls)
as opposed to 662 large outlets. Growth in small stores had been tracking at 16
% per annum as opposed to a 0.1 % decline in large stores. The current small!
convenience store market is currently estimated at approximately R35 billion,
with the size of these stores ranging from 65m2 to 250m2. During the same time
period the growth in forecourts grew by 23%, with 65 % of these forecourt
customers dedicating themselves to one particular small store. Surveys have
tended to indicate that customers visit these forecourt stores on average 18
times per month, with 25% of the customers purchases being non petrol. Surveys
have also demonstrated that customers regard convenience and value for money
as the most important reason for choosing a convenience store. If this formula
could be perfected, the successful party would have an extremely lucrative
business on their hands. This point is made more prominent by the fact that 80%
of convenience stores are open 24 hours a day, with the remainder trading from
06:00hr to 23:00hr.
Convenience stores in the UK stock between 2500 and 3000 lines, although this
is extremely large in S.A. terms , a general model can be drawn from this. UK
stores concentrate mainly on 4 product areas: treats and gifts, top up, HMR and
news agency. Hot food is also available in 98% of UK convenience stores. Select
is the fourth largest sandwich retailer in the UK behind Tesco, Boots and M&S.
Why look at Engen as a potential partner? Engen currently has the largest
network in S.A. with a 31 % share of the fuel market ( 1450 sites) [35% with the

3
addition of Zennex]. Engen also has the largest convenience network ( 40% )
with 372 shops. Engen currently has capital resources in place for projects and
expansion. In addition Engen have the flexibility for proactive decision making,
offering a basket of brands and exclusive projects ( e.g. ticket web ). Engen
currently command a brand equity of R12 Billion . Engen also own the sites with
the Franchisees paying a rental- hence more control over the end process.
For this new venture to be a success, Woolworth's brand integrity must be
maintained, and the correct locations must be chosen for the proposed sites.
1.3 Motive for the study
The motive of the study was generated to ascertain if there is merit for a
company such as Woolworths who operate in a fairly unique sector of the retail
market to form a strategic alliance with a company that operates in the lower end
of the market segment . Especially one where retail is a secondary focus, taking
its energies away from its core business.
In addition, to ascertain whether the move into this market segment of
convenience food outlets is feasible (considering both quantitative and qualitative
variables), with a company such a Woolworths who strength has been built
around its brand integrity looking at forming an alliance with a petroleum country
It needs to be tested whether this project is sustainable and not just a good idea
worth trailing ; and if so how best to set up a structure between these two
companies?
In so doing, it is hoped that conclusions drawn from this study can be
recommended to management, ultimately leading to an increase in market share.

4
1.4. Value of the Study
There are many components that contribute to the outcome of the Woolworths
Engen initiative. This study hopes to pull all those components together to
present a clear picture of the positive ness of such a venture for all parties
concerned. Often when companies evaluate projects, if the projects responsible
for driving the project are passionate, they would want to see the project
succeed. This study hopes to give an unbiased report with conclusions on the
venture undertaken by Woolworths and Engen
1.5. Problem Statement
Traditionally retailers have traded during normal working hours (9 am to 5 pm).
These limited trading hours have negative consequences for retailers and
customers and potential customers. For customers; shopping has usually been
restricted to normal trading hours, making it difficult for customers who hold down
a 9am to 5pm job to buy merchandise. This is especially the case of people who
work unusual and/or extended hours for example staff who work on shifts such
as hospital , shipping and milling staff. From the retailers' perspective, these are
new customers who potentially have the need for their goods, but do not have
access to them through factors beyond their control. The challenge for the
retailer is access. The retailer needs to trial offering this customer access to their
goods without having to undergo a huge capital investment.
The retailer is further challenged by what format these goods should be offered
in to the customer, bearing in mind that convenience is the overriding factor
determining these customers shopping habits. Lastly, will such a venture bring
financial reward or will it result in a "white elephant" scenario. Is it feasible for
Woolworths to move away from trading in traditional stores and traditional trading
hours, to one of convenience, where a product is traded twenty four hours a day?
Will sell ing products from a forecourt store be sustainable in the long term, both

5
from a brand integrity perspective and from a financial perspective? What type of
agreement should exist between the two companies in terms of control , bearing
in mind the contribution to total sales this new venture will attract and the
overriding bid for Woolworths to maintain brand integrity at all costs?
1.6 Objectives
• To ascertain whether it feasible for Woolworths to look for new markets in
the convenience longer trading hours stores.
• To ascertain whether selling product from a forecourt store is sustainable
in the long term, as people will prefer to shop full line stores.
• To ascertain whether Engen is the best petroleum company in S.A. to
form a joint strategic alliance with in terms of strategic fit.
• 1.7. Limitations to the study
Most of the figures and statistics had to be obtained from highly sensitive and
highly confidential documents . This put a limitation on the amount of data
available and the form that the data was presented. In most cases only relevant
figures were released and not whole financial feasibility studies. This has
presented a challenge in terms of creating a strong thread of overlapping
evidence in proving the success of the Woolworths- Engen initiative. However as
is evident in this study, there is still overwhelming evidence to prove the success
of this strategic alliance. Much of the evidence presented does not have the
reports listed in this study to back up the data. Reason being due to the
sensitivity of the information, only certain information was released and not the
whole documents .
1.8. Structure
Chapter 2 talks about the theory behind competition dealing in today's business
markets and how important it is to know what is going on around you . It goes on

6
further to discuss that in order to survive in today's cutthroat world of competition ,
a company needs to look for a competitive advantage it can hold over its
competitors. Once such way to create a relatively cost effective and quick
advantage is by forming an alliance with another company that is strong where
the other company is weak. From there it discusses the fit for an alliance and the
things to consider when forming an alliance. The possible problem areas of
alliances are also included as well as guidelines to consider when choosing an
alliance partner. Chapter 3 discusses how the data and information was collected
and analyzed, including the use of an external consultant. And Chapter 4
presents the finding and discusses the observations noted through examining the
various forms of information. It also gives an introduction to a few facts
necessary to understand before looking at the data. In Chapter 5,
recommendations are made and conclusions drawn.
1.9. Summary
in the world of retail, companies are continually looking for ways they can create
a competitive advantage over their competitors. One way Woolworths have tried
to do this is by capitalizing on the growing trend among consumers for
convenience and have formed an alliance with Engen. The purpose of this
alliance is to test two pilot project concept stores. These stores are mini market
"cubbys" .found within an existing Engen Quick Shop. The products Woolworths
would sell in such a "cubby" would predominantly be the HMR's (home meal
replacements)- an area where Woolworths currently enjoy market dominance.
However because the Woolworths business has been built on brand integrity , the
numbers are not enough to prove that this concept is viable for Woolworths.
Rather brand integrity needs to be maintained and the numbers need to be good .

7
From the results, it can be seen that both criteria are met and all parties involved,
namely Woolworths, Engen and the dealer benefit from the venture.
Infact this is an avenue for Woolworths to attract new customers to their full line
stores.

8
CHAPTER 2: A LITERATURE REVIEW
2.1 Strategic Competition
In the business world today it is very rare to come across a company that has the
monopoly over a certain industry. Rather in most instances most industries are
ruled and governed by a oli~opoly of large corporates that wrestle their might
against each other in order to try gain a larger segment or market share of the
industry they are in, and in so doing allowing for great profits and a greater return
to the companies shareholders.
In order for a company to perform in this arena it is imperative for a company to
understand their competit ive situation and how competitive advantage might be
achieved (Michael Porter, 1980).
In order to achieve this business' need to have an effective strategy. According to
Porter, " the aims of a firm's strategy are to decide its goals and the means by
which they can be achieved". In deciding these goals and means, managers
must take into account internal factors such as the companies' skills, resources
and values , and external factors, including opportunities and threats in the
business and industry environment. Porter (1997) argues that a business without
a clear strategy would have no basis on which to integrate its activities and
achieve consistency between its various functions and units.
Porter (1997)puts the strategic business decisions of the individual firms in the
context of economic forces. These forces are derived from the industry within the
company operates or from even further- the business environment as a whole.
These forces affect companies' costs, the prices it can charge and its sales and
profits. Many if not all of these factors or forces affect all of the competitors in an
industry and limit the average profitability within it. The focus on an individual
company strategy is therefore how to achieve and sustain above average
retums- plainer said , "how to bend the forces of competition in its favour".
In order to understand the threats and opportunities in a industry, it is essential to
be clear about its scope, the forces that drive competition within it, its potential for

9
profitability and how all these are changing. Porter (1997) proposes a "structural
analysis of industries", using a tool commonly called the Five Forces Model (see
fig 2.1.)
Potential Entrants
threat of new entrants
...--___ ----1Bargaining power
suppliers
Industry Competitors
existing firms
threat of substitute roducts or service
substitutes
Figure 2.1: Forces Driving Industry Competi tion
Bargaining power
buyers
in so doing derive a competitive strategy, which would be constantly revisited , so
as to minimize the threats and maximize the opportunities in the industrial arena
within which they operate.
Further evidence for strengthening the argument that companies need to derive a
competitive strategy is once again given by Michael Porter (1997). In today's

10
business world, Porter(1997) believes that there are 3 main misconceptions,
which in recent times has led companies to not focus on competitive strategy in
its entirety. These include a "new dogma" based on the belief that competitors
can quickly replicate any market position. Competitive advantage is therefore
only temporary. Such beliefs he contends , lead companies down the route to
mutually destructive competition . The second is that the search for operational
effectiveness has spawned many management techn iques, like outsourcing,
TQM and re-engineering . As a result, "bit by bit almost imperceptibly,
management tools have taken the place of strategy." Thus, " the root of the
problem is the failure to distinguish between operational effectiveness and
strategy." Operational effectiveness involves doing similar activities better than
competitors . Strategic positioning on the other hand involves performing different
activities or doing the same thing but in different ways. Porter does not dispute
the value of operational effectiveness. Infact he states that constant improvement
in this area is critical for achieving superior profitability. His contention is that few
companies can compete successfully over any length of time on the basis of
operational effectiveness. And he states two reasons for this; firstly "best
practice" now spreads quickly because can imitate management techniques. This
has been accelerated and reinforced by consultants who working across the
industry employ the same techniques across companies. And secondly
"competit ive convergence"- strategies converge as rivals benchmark the same
companies , imitate each other's improvements and increasingly outsource the
same activities (often to the same third parties). Porter(1997) warns that this last
approach tends down a road of a series of races down identical paths that no
one can win .
The third is that after a decade of restructuring and cost -cutting, many
companies are tuming their attention to growth . Too often, efforts to grow blur
uniqueness, create compromises, reduce fit and ultimately undermine
competitive advantage . In fact the growth imperative is hazardous to strategy.

11
Strategy is concerned with defining and then communicating the companies'
unique position, making trade offs and forging fit among activities.
According to Porter(1997), companies can only outperform competitors if they
can establish a sustainable difference. This difference should enable the
company to offer greater value for customer or to offer the same value at a
cheaper cost, or both. The differences between companies can be attributable to
the different activities that companies perform or go through which ultimately
adds up to the costs incurred as well as the value delivered. Thus in broad terms
"activities then are the basic units of competitive advantage.
Competitive strategy is about being different. It requires a choice to either
perform the same activities and competitors but do them differently or perform a
different set of activities in its entirety. This seems to be the only way of offering a
"unique mix of value". If a company does not set out to do this then the
companies ' strategy "is nothing more than a marketing slogan that will not
withstand competition".
So far from the literature we can conclude that in order for a company to be
successful it needs to have a strong competitive strategy in place. This
competitive strategy should include a combination of being different of offering
seNices of products that differ from the competit ion or both. The key being in the
difference. Companies aim to handle competitive forces successfully, to achieve
superior profits and to establish a position that is defendable in the long run.
Porter lists three "generic strategies" that a company could use.
1. Overall cost leadership- delivering acceptable quality so as to merit at
least average prices but at the lowest cost.
2. Differentiation- seNing customer needs uniquely so as to merit premium
prices by selecting added cost in areas producing high added value.
3. Focus- selecting a limited target market in terms of customer group,
product range , geography, or vertical integration . Competitive advantage

12
comes from serving the selected market more efficiently or effectively or
both.
Porter argues that companies are most likely to succeed if they focus on one
of these generic strategies as each strategy require different capabilities and
are supported by different organization structures and culture. Bearing this all
in mind Porter wams, "that competitive advantage is ultimately gained through
a firms activities , not through devising strategic goals."
What does it take to build a sustainable strategic position? Porter argues forcibly
that rather than extend a strategic position, companies should deepen it. Become
more distinctive, tighten the fit and improve communication with customers who
should value what is offered. It is no answer to chase "easy" growth by adding
new products or services without adequate strategic screening or targeting new
customers and markets where the company has little to offer. Instead managers
should find where and how the existing set of activities could offer things that
"rivals would find impossible or costly to match".
2.2 Strategic Alliances
On such way that a company can achieve a competitive advantage or create a
difference from its competition is by creating a strategic alliance with another
company. Broadly defined, a strategic alliance is any relationship between
companies involving a sharing of common destinies. Basically it is an agreement
between two or more partners to share knowledge or resources , which could be
beneficial to all parties involved (Vyas, Shelbum and Rogers, 1995). Murray and
Mahon (1993) provide a stronger definition- a strategic alliance is a coalition of
two or more organizations to achieve strategically significant goals and objectives
that are mutually beneficial. "Mutually beneficial " does not however imply
equality of benefits, but does signify that all parties to the alliance receive benefit
from it in proportion to contributions made.

13
Strategic alliances can be either very simple or very complex. They could simply
involve the sharing of marketing resources and/or technology, or in contrast
involve several companies across several continents. These companies might in
tum be linked with other organizations in separate alliances. This giving the net
result of a maze of intertwined companies, which may be competing with each
other in several product areas. However each alliance is unique (or in some
instances joint venture), like a fingerprint and there can be no exact prescription
for success (Antidote, 1997).
As a result of the maturation of several trends of the 1980's- intensified foreign
competition, shortened production cycles , soaring capital investment costs , and
the ever growing demand for new technologies- alliances have become an
attractive strategy (Vyas et aI1995) .
Alliances are forged along a variety of dimensions. Looking at these alliances
along these dimensions helps understand the motivation behind this trend and
help look at a few factors critical to their success.
Alliances can take place inter or intra industry. The companies wanting to protect
their 'turf' in and industry usually motivate Intra industry alliances. As was the
case where three US auto makers formed an alliance to develop an efficient
electric battery for an electric car so as to combat the threat of foreign (Japanese
or European) competition and prevent the loss of US market share to imports,
(Shan, 1990) brought about by policy change in the US where a certain
percentage of cars in the state of Califomia had to be pollution free by the year
2000.
Intra- industry alliances are usually motivated by a pooling of expertise to create
synergies. Such as the case between the Dupont (chemical giant)/Merck
(pharmaceutical giant) alliance. Merck wanted to speed up the costly process of
bringing products to market and Dupont wanted to establish itself as a player in
the pharmaceutical market. Merck brought its market rights to certain products
and established skills in bringing products to commercial fruition , while Dupont

14
brought its productive discovery capabilities along with imaging- agent's business
experience into the alliance (Huston, 1991).
Area of alliance is also important, as many companies have found great
advantage in forming alliances with companies operating in different countries
such as the case of the US automakers forming alliances with foreign
manufactures. This has allowed for the blunting of foreign competition into their
local markets (Hamil , Doz and Prahalad , 1989).
In some instances alliances are built of relationships or better-said relationship
constitutes the next dimension of strategic alliances. In this instance the alliance
is often between a company and its supplier. This is usually brought about
because the supplier is a known quantity for the company, with the relationship
facilitating terms of agreement, resulting in a high level of trust built on past
business transactions. An example of comes from the computer hardware
industry. Intel Corp. (USA) and NMB Semiconductor Co. (Japan) have supplied
each other for many years with a variety of electronic items. However it was only
once they teamed up to build a semiconductor foundry in Japan that these
companies really boomed. Intel had an assured source of high quality memory
chips and NMB had access to Intel's world wide sales and marketing network,
and area where they had previously been weak (Kuhn, 1989).
The influence of market related factors and technology also motivate these
alliances. Factors that determine the nature of these alliances include:
distribution channels (going around entry barriers); synergy (to pool resources,
increase efficiency, share expertise, reduce cost, increase market share, and
become more competitive) and sourcing raw materials (Lapedus, 1993; Valigra ,
1991 ).
One lesson that companies everywhere are learning is that no one company is
big and strong enough to do everything on their own. Companies form alliances
to allow them to build up in some of the areas mentioned above where they are
currently not that strong- exposing them to competition or competitors . In so
15
doing - allowing the companies a relatively quick and cost effective method of
bridging that gap. E.g. Caterpillar Inc. (USA) and Mitsubishi (Japan) have
decided to combine their production of forklift trucks and in so doing expect to
benefit from joining forces rather than compete against each other for market
share.
This move will bump them up to the number three spot of forklift producers in the
world (Capon and Glazer, 1987; Dambrot, 1990; Gross and Neuman, 1989).
Linked to this some alliances are driven by the state of technology. What often
happens is either recently matured technology (and available for application) or
technology that is in its embryonic state (needing additional R&D) form the basis
of strategic alliances. Companies wanting to create an immediate competitive
advantage will seek alliances in new but readily available technologies
commonly called technology transfer, while those who want to remain at the
cutting edge of technology and plan for long term growth tend to form alliances
with companies whose technology is in the embryonic stage.
An example of technology transfer is the booming market of GPS (global
positioning system) hand held instruments. The technology was developed for
the military, but has been exploited by the commercial market for civilian use
(Kanter, 1990; kogut, 1991 ; Pisano 1990).
An example of companies forming alliances to make use of technology in its
embryonic stage is most commonly seen in the computer industry and the
pharmaceutical industry.
According to Vyas et al 1995, fusion of technologies is the last dimension
considered in the formation of strategic alliances. One of the partners may
contribute the specific knowledge of a process (assembly, miniaturization,
coating etc), which is critical to gain competitive advantage or to even create the
final product.
The alliance between Smith Kline (USA) and Kubota (Japan) is a case in point.
Kubota , Japans largest producer of agricultural machinery, shipped in 1988 from
a new facility its first mini-supercomputer, one of the most advanced in the world.

16
The design chips were all American. Kubota used its superb assembly know-how
to produce a high quality product (Kodama, 1992; Kogut, 1988).
As all trends point toward cooperation as a fundamental growing force in
business, the world has never been so interdependent as it is now. In the past
decade the number of new business alliances has about doubled each year, and
this trend seems set to accelerate in the future (Lapedus, 1991).
In order for strategic alliances to be successful it may be necessary to institute a
few changes within a company. Management style is one such change. Table 2.1
gives a clear comparison between traditional management ways and a new form
of management style required to run a company involved in strategiC alliances.
Govemment can play apart by reassessing its tax and anti-trust laws to facilitate
co-operative ventures. Japanese and South Korean governments have taken a
lead in such facilitating efforts . Through the Japan External Trade Organization
(JETRO) , trade missions representing selected product areas travel the world
seeking new partnerships. The South Korean government plans to set up a $10
million fund to expand efforts for industrial links with US companies . The Trade,
Industry and Energy Ministry has tapped two business groups, the Korean
Foreign Traders Association and the Federation Of Korean Industries to raise
cash for the funds over five years (Wall Street Journal, 1993).
Cultural differences often create dilemmas when it comes to ensuring the
success of strategiC alliances, especially between Asian and Western
companies . For example, Asian companies place their employees interests
ahead of the shareholder's interests, while western companies place their
shareholders interests above all else. Such differences can cause serious conflict
over investment and dividend decisions. Language barriers can add to the
frustration , although English is becoming a common intemationallanguage. In
the end however management learning is the key to lowering cultural barriers .

17
Vyas et al (1995) came up with a Strategic Alliance Model (Fig 2.2) , which
identifies the steps and variables involved in the working of a strategic alliance.
According to the model, the first step in developing the strategic alliance is to
scan the environment for opportunities. This includes the company's own SWOT
(strengths, weaknesses, opportunities and threats) analysis.
A clear understanding of its strengths and opportunities, allows the firm to set its
short
and long term objectives , while the analysis of weaknesses and threats provides
direction to look for allowances. These may include competitors, suppliers or
other companies, which could provide the needed strengths. These companies
constitute the group with alliance potential (GWAP).
The Model is broken up into segments and give a clear path how a company
should go about a strategic alliance.
The critical path as shown in the mode is given by SWOT Analysis to Goal
compatibility to Barriers to Success the final net result a Successful Strategic
Alliance.

Traditional style
Total control over resources to achieve objectives
Enterprise structure: "closed system"
Conflict resolved through hierarchy when other means fail
Corporate culture:
Success based on competition
Emphasis on secrecy of operation
Focus on generating internal resources/ know
howltechnologies to maintain/ create competitive
advantage
"Not invented here" (NIH) syndrome common weakness
Internal stereotypes "us-they" at various levels of workforce
may persist
Enterprise structure of "closed" may lead to workforce
behaviour such as "turf protection", accepting status quo,
etc.
Value/importance of good communication is not obvious
because of functional organisation
Fear of failure
Alliance often viewed as a threat (reduced control/power,
loss of job, hence resisted or at worse rejected
Slow to react to changes
Short-term perspective : to reduce cost, avoid investment
and move manufacturing to offshore where labour cost is
low
No specific programs to seek out alliances and make them
successful
Table 2.1. Comparison of traditional management style
versus New Style.
New style
Shared/ distributed control
"Open system"
Absence of such a "hierarchy" in the alliance.
Heavy dependence on negotiation skills
Success based on cooperation. Competitors regarded as
potential strategic resources
Need for sharing of information with partners
Using alliances as a strategic leverage to procure
resources to maintain/ create competitive advantage
NIH discouraged. Identifies need for new mind set.
Encourages search for better ideas beyond corporate
boundaries
Such stereotypes are discouraged with specific actions
such as training, open communications, team-building
efforts at all levels of workforce
Rethinking , relearning, adopting new ideas,
experi mentation to do better to avoid the trap of
yesterday's wisdom
Value of formal and informal communications is stressed.
Cross-functional approach to management builds collective
understanding
Failure tolerated and expected to lead to new insights
Alliance viewed as a strategic tool
Permits rapid and flexible response to changes
Long-term view: develop long-term objective for gaining
access to newly acquired capabilities
Specific programmes to broaden the experience and
education of the workplace. Mutual learning and mutual
dependence encouraged through formal training and
informal networking.

19
The company should perform similar SWOT analyses for its major GWAP firms
to help negotiate the strategic alliances.
Goal compatibility: .. .f-
SWOT short-term and long-
analysis term amount alliance I Barriers to success I
Synergy among partners : • Failure to r ... one is strong where the f- understand
Scanning the ..
other is weak and adapt
environment ~
"new style"
for of
opportunities -. managemen
A~ t (table 1)
• Failure to Value chain: clear learn and understanding of what
~ understand value each partners will cultural bring to the alliance differences
SWOT Lack of iron-analysis of •
GWAP firms clad
(external) commitment to succeed Balancing contributions of
partners in product ~ ..
development, manufacturing and marketing
Figure 2.2. Dimensions of strategic alliances
~
The model identifies four critical issues in order for the alliance to be a success:
1. Goal compatibility ; short term and long term among alliance partners.
Without such compatibility, the alliance partners may pull in different
directions
2. Synergy among partners; one is strong where the other is weak. This is
the major reason for and the advantage of the alliance. The partnership is
Successfl
strategic
alliance

20
efficient, effective and as a result much more competitive compared to
each alliance partner performing the similar task individually.
3. Value chain ; clear understanding of what value each partner will bring to
the alliance is the foundation on which trust and relationships are built for
future success.
4. Balancing contributions of partners in the areas of product development,
manufacturing, and marketing are necessary so that no one partner
dominates the alliance. Absence of such a balance result in the take over
of the weaker partner by the dominant firm or a short-term relationship ,
usually resulting in breaking the alliance without achieving its full potential.
Vyas (1995) go on to state that there also tend to be three major generic barriers
to successful strategic alliances. These include:
1. Lack of total commitment to succeed. Often the individuals who originally
negotiated or implemented the initial alliance agreement may change due
to promotions, transfers, retirement or terminations. Continuity of total
commitment for the alliance is needed at all levels in the organization
without which the alliance will fail t reach its full potential.
2. Failure to understand and leam the cultural differences. Not only do the
cultural differences exist among intemational firms seeking to form
alliances, but also corporate cultures may be different among firms from
the same country . Flexibility and leaming are the greatest tools in
overcoming this barrier.
3. The failure to understand and adapt to "new style" management as
detailed in Table1 . The adaptation of a new style of management requires
a change in corporate culture, which must be initiated and nurtured from
the top .
Although many authors have written about the motives for forming alliances
(Devlin and Bleakley, 1988; Murray and Mahon, 1993; Porter and Fuller, 1986;
Ring and Van de Ven, 1992), Lorange et al (1992) find that when it comes to
21
retail there are four generic motives for forming alliances: as a defense; to catch
up; to remain or to restructure. Murray and Mahon (1993) believe that alliances in
retail occur in response to two underlying motivations: a "defensive" instinct to
survive or an "offensive" desire to achieve competitive advantage.
In summary, objectives for forming alliances can be divided into two main groups.
Namely, alliances that are used as an efficient way to expand strategic
capabilities, and those used as a means of market control by reducing
competition.
Thus for retail , alliances in this sector could be classes as competitive alliances.
This is because the role of the alliance is primarily strategic in focus and the role
of the alliance is to increase members' effectiveness in the market. This would be
one of the key driving motivating factors in Woolworth's decision to search for a
strategic alliance partner.
In addition to considering the joint venture consumer products companies that
should perform well through a recession are those with strong retail partnerships,
leading brands, relevant innovation, resources to support those brands and lean
cost structures (Woolworth's have the majority of these). Those companies that
will succeed will be able to maintain and grow as retailers expand, at the
expense of weaker brands (Lynch 2002) or as a result of a move into new
markets.
In this modem age, with our interdependence growing towards a unified market,
building stronger domestic and international business is a commercial necessity.
The trend toward strategic alliance is clear; it is not a passing fad. Deregulation ,
the emergence of regional trading blocs , the ease of technology transfer, and the
internationalization of markets have prompted firms to look at each other in a
different light- as allies rather that adversaries.
When valuing a project the Net present value of that project is often calculated to
ascertain the present day value that the project will add . The NPV is calculated at
the interest rate the company expects/need to get back on the project to make it
viable . NPV is a good method to use as it takes into consideration the time value

22
of money (Amold 1998). Intemal rate of retum is also a popular method as it is
easy to understand. Both methods should more or less give the same answer.
Amold , 1998 lists the pros and cons of using each method .

23
CHAPTER 3 RESEARCH DESIGN AND METHODOLOGY
3.1 Sample and Sampling Technique
The sampling frame will be the financial statements for the last year for the two
pilot projects currently up and running in Cape town- namely the site in Orange
Street and the sight in Meadow ridge. The sampling frame used to measure the
quantitative variables took the form of those customers stopping at the forecourt .
The size of this population was 84. This population was sampled on the actual
forecourt site within the store, once they had made a purchase so as to account
for the "Hawthom Effect".
3.2 Design and Analytical Techniques
The research design has taken the form of a case study. There will be no control
group and the qualitative, and quantitative variables will be sampled at a specific
point in time (the qualitative by means of an experience survey) . The quantitative
variables will be analyzed using financial indicators such as Net Present Value
(NPV) and Internal rate of Retum (IRR) over a fixed period of time. There will be
two approaches to the information, 1. From a Woolworths approach 2. From an
Engen approach.
3.3 Feasibility
Data to be collected for the feasibility study will be via a semi- structured
questionnaire, through an interview. An outside consultant will conduct the
interview. The study is a cross sectional study with the candidates being
interviewed systematically. The researcher being independent and unbiased will
not be able to manipulate the variables. The above applies to the collection of
qualitative data. The quantitative data will be collected via the pilot projects
financial figures for every month since initiation. The quantitative results For

24
Woolworths will be based off a proposed NPV and IRR model with projected
sales vs. Actual sales once average sales data has been collected . From an
Engen perspective the Quantitative and qualitative merge in a feasibility study.
Sustain ability will be based on results prior to the initiative, and there after
monitored on a monthly basis. Sustainability will measure both inter and intra -
business units.eg. Both food shop and petrol sales.
3.4Sustainability
The Net Present Value and Internal Rate of Return will be calculated using
formula found in the International Management textbook. Figures used for these
Equations will come from company Financial Statements and from the financial
statements of the two pilot projects.
Data to be collected on which petroleum company to go in with and how best to
structure the control will come from secondary data. This data will be made up of
data from the A. C Nielson Report, and company documents. Secondary data will
also be collected from company archives and structure reports , as well as post
implementation reviews. This data has been presented in the background to the
case study.
3.5 Data Analysis Techniques
Data obtained from the feasibility will be analyzed using parametric techniques.
Quantitative data will be analyzed using financial formulae based on NPV and
IRR. Data collected from AC Nielson (and partnership) will be analyzed using
parametric techniques.
25
CHAPTER 4 OBSERVATIONS AND FINDINGS
4.1. Introduction
The concept of having a±. 11 m2 Woolworths mini market "cubby" integrated as
part of the ±. 50/60 m2 quick shop has proved extremely viable for the two
partners involved. The "cubbys" offer includes the HMR's and take away
convenience food . It also includes those items often forgotten e.g. the meat for a
braai , or salad stuff or even pudding . The core fundamental behind the range that
the shop carries is convenience. This obviously also extends into the convenient
shopping hours. From looking at the peak hours of trade, it was seen that the two
stores had slightly different peak trading hours due to the locality they find
themselves in . Orange Street, which is situated in town has peak trading hours
around 5-6pm. While Meadowridge which is situated in near Constantia in a
residential suburb has peak trading hours from 5:30 pm to 7:30 pm. Both stores
have a spike in sales over the lunch time period, with Orange Street selling more
than double what Meadowridge sells over lunch. (see Appendix G). All site
identification has occurred between or has been cited by Woolworths and Engen
HO.
Other sites selected for future development include:
Durban
Lagoon Service Station
Palm Service Station
Cape Town
Sonnendal
Vinyard
Athlone RD, Durban North
Rinaldo RD, Glen Hills
Hendrick Verwoerd Drive
Main Rd Newlands

Johannesburg
William Nicol
Bryanston
Mimosa
Brentel Motors
26
William Nicol, Fourways
Peter Place, Bryanston
OF Malan Drive, Blackheath
Andries pretorius St, Edenvale
Role out plans are dependant on the success of the pilot projects and the
confidence in the maintenance of brand integrity by the dealer.
This also applies to the dealer selection and all the Capex for construction of a
site suitable for a Woolworths-Engen initiative is picked up 100% by Engen. HO.
Capex for the equipment needed in these stores is picked up by the dealer.
The pricing of the good sold in these stores has been kept the same as the
prices in the Woolworths full line stores so as to not to disrupt customers
expectations when they shop the full stores
Currently these mini-markets are run by the dealer and his staff that have had
limited exposure to Woolworths and their protocols. This obviously being a
concern for Woolworths and their brand integrity. However documents have
recently been completed which list clearly defined controls necessary to protect
the Woolworths customer experience and these include:
• Hygiene disciplines
• Sell-by disCiplines
• Cold chain disciplines
• Quality control disciplines
• Return pol icy
• Tilling service and procedures
• Customer care
These control documents are in the process of being handed over to the Engen
body and the Engen dealers.
27
The buying, selling and procurement IT systems are currently Engen systems,
which extract the information to provide Woolworths the sales and waste figures
on a daily basis via the web from the dealer. All financial information is web
enabled allowing Woolworths to better understand their customer buying
patterns. All IT systems and set up has to comply with the minimum
specifications set out by Woolworths.
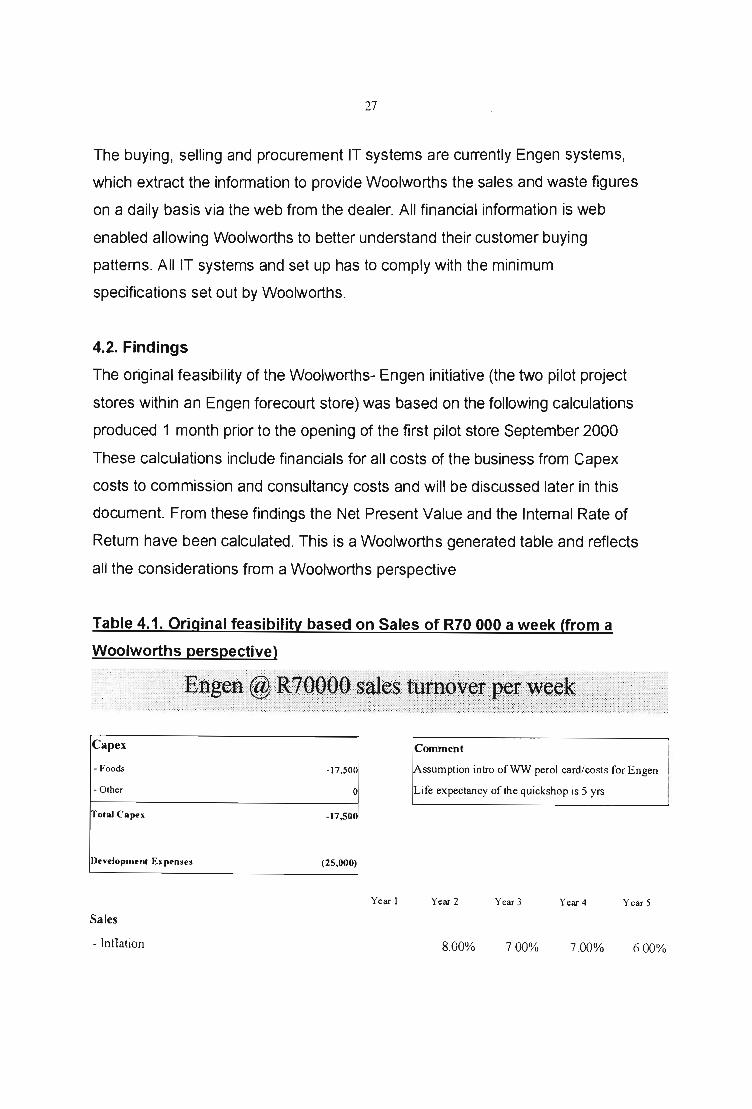
4.2. Findings
The Original feasibility of the Woolworths- Engen initiative (the two pilot project
stores within an Engen forecourt store) was based on the following calculations
produced 1 month prior to the opening of the first pilot store September 2000
These calculations include financials for all costs of the business from Capex
costs to commission and consultancy costs and will be discussed later in this
document. From these findings the Net Present Value and the Internal Rate of
Return have been calculated. This is a Woolworths generated table and reflects
all the considerations from a Woolworths perspective
Table 4.1. Original feasibility based on Sales of R70 000 a week (from a
Woolworths perspective)
Capex
- Foods
- Other
Total Capu
l)evelopment Ex penses
Sales
- Inllation
-17,500
o
-17,500
(25,000)
Year I
ssumption intro ofWW perol card/costs fo r E ngen
L ife ex pectancy of the quickshop is 5 yrs
Year 2 Year 3 Year 4 Year 5
8.00% 700% 7 00% 6.00%

28
- Average week ly sale R70,OO03,640,000 3,93 1,200 4,206,384 4,500,83 1 4,770 ,881
- Sales Excl. V A T 11 %3,279,279 3,541,622 3,789,535 4,054,803 4,298,091
- Waste 0.00% 0 0 0 0 0
- Shrinkage 0.00% 0 0 0 0 0
Maximum Sales 3,279,279 3,54 1,622 3,789,535 4,054,803 4,298,091
Cost of Sales 32.00% 2,229,910 2,408,303 2,576,884 2,757 ,266 2,922 ,702
Revenue
- Commission (PM) 10.15% 226,336 244,443 26 1,554 279,862 296,654
- Contribution to promotion 0.00% 0 0 0 0 0
- Supplier rebate 1.00% 36,400 39,3 12 42,064 45,008 47,709
- Supplier marketing al10wance 0.25% 5,575 6,021 6,442 6 ,893 7,307
Total Revenue 7.37% 268,31 1 289 ,775 310,060 33 1,764 35 1,670
Operating Expenses
Intl ation 8.00% 700% 600% 600%
- Travel Budget Fixed costs -4,444 -4,800 -5,135 -5,444 -5,770
- People costs Fixed costs -33 ,500 -36, 180 -38,7 13 -41,035 -43,497
- Marketing cost Fixed costs -1,777 -1 ,919 -2,054 -2 ,177 -2,307
- Replacement visuals Fixed costs -5,000 -5,400 -5,778 -6,125 -6 ,492
- Stock loss (shorts & overs) 0.00% 0 0 0 0 0
- Audit Costs Fixed costs -8,000 -8,640 -9,245 -9,799 - 10,387
- Swel l allowance - stock damages 0.05% -1,1 15 -1 ,204 -1 ,288 -1 ,366 -1,448
- Debtors Book Costs Settlement 0.25% -5,575 -6,021 -6,442 -6,893 -7,307
o o o o o Total Expenses -59,4 11 -64 ,164 -68,655 -72 ,839 -77 ,209
Profit Before Tax 208,900 225 ,6 12 24 1,405 258 ,925 274,46 1

29
Taxation 30 .00% -62,670 -67 ,684 -72,42 1 -77 ,678 -82,338
Net Profit 146,230 157,928 168,983 181,248 192,122
Return on Sales % (After Tax) 5.85% 5.85% 5.85% 5.87% 5.87%
Sales Transfer 8.00% -262,342 -283 ,330 -303 ,163 -324,384 -343 ,847
Margin 750% -19676 -2 1250 -22737 -24329 -25789
Adj usted Net Profit 126554 136679 146246 1569 19 166334
Ad,iusted ROS % (After Tax) 5.07% 5.07% 5.07% 5.08% 5.08%
Note:
Sales = cost o f sales plus revenue
Set up costs accounted for in cash flow only
Discounted Cash Flow (NPV) R478,971.37
Year 1 Year 2 Year 3 Year 4 Year 5
IRR 592.74 % 704.87% 717.57% 719.18% 719.39%
Cash Flow - 17,500 121 ,230 157,928 168,983 181,248 192, 122
Cost of Cap ital 18%
EPS 912000000 0.00016 0.000 17 0.0001 9 0.000 20 0.00021
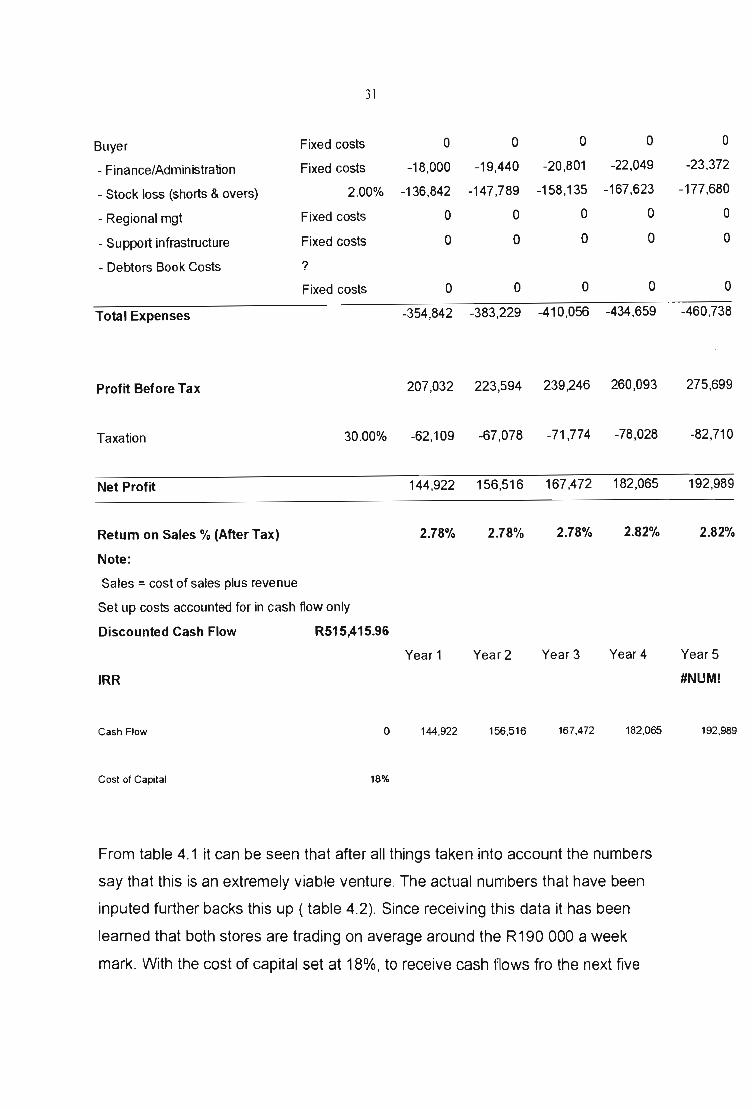
Table 4.2 uses the same costing structure but differs in the spreadsheet above
as in the sales calculation, the actual sales as per last week have been inputted
to show a real life analysis of how from a Woolworths perspective, the initiative is
currently tracking. Note in both tables a relatively low inflation rate, reflective of
the actual economy.

30
Table 4.2. Sales based at Current Scenario to ascertain current IRR and
N PV .of project.
Capex Comment
- Foods 0 Assumption intro ofWW perol card/costs for Engen
- Other 0 Life expectancy of the quickshop is 5 yrs
Total Capex 0
Set Up Cost
Year 1 Year 2 Year 3 Year 4 Year 5
Sales
- Inflation 8.00% 7.00% 7.00% 6.00%
- Average weekly sale R150,000 7,800,000 8,424,000 9,013,680 9,644,638 10,223,316
- Sales Excl. VAT 11% 6,842,105 7,389,474 7,906,737 8,460,208 8,967,821
- Waste 0.00% 0 0 0 0 0
- Shrinkage 0.00% 0 0 0 0 0
Maximum Sales 6,842,105 7,389,474 7 ,906,737 8,460,208 8,967,821
Cost of Sales 32.00% 4,652,632 5,024,842 5,376,581 5,752,942 6,098,118
Revenue
- Commision 1 10.15% 472,242 510,021 545 ,723 583 ,924 618,959
- Contribution to promotion 0.00% 0 0 0 0 0
- Supplier rebate 1.00% 78,000 84,240 90,137 96 ,446 102,233
- Supplier marketing allowance 0.25% 11 ,632 12,562 13 ,441 14,382 15,245
Total Revenue 7.20% 561,874 606,824 649,301 694,752 736,437
Operating Expenses
Inflation 8.00% 7.00% 6.00% 6 .00%
- Travel Budget 0 0 0 0 0 - Greg Smith Fixed costs -200,000 -216,000 -231 ,120 -244 ,987 -259,686
31
Buyer Fixed costs 0 0 0 0
- Finance/Administration Fixed costs -18,000 -19,440 -20,801 -22,049
- Stock loss (shorts & avers) 2.00% -136,842 -147,789 -158,135 -167,623
- Regional mgt Fixed costs 0 0 0 0
- Support infrastructure Fixed costs 0 0 0 0
- Debtors Book Costs ?
Fixed costs 0 0 0 0
Total Expenses -354,842 -383,229 -410 ,056 -434 ,659
Profit Before Tax 207,032 223,594 239,246 260,093
Taxation 30.00% -62,109 -67,078 -71,774 -78,028
Net Profit 144,922 156,516 167,472 182,065
Return on Sales % (After Tax) 2.78% 2.78% 2.78% 2.82%
Note:
Sales = cost of sales plus revenue
Set up costs accounted for in cash flow only
Discounted Cash Flow R515,415.96
Year 1 Year2 Year3 Year 4
IRR
Cash Flow o 144,922 156,516 167,472 182,065
Cost of Capital 18%
From table 4.1 it can be seen that after all things taken into account the numbers
say that this is an extremely viable venture. The actual numbers that have been
inputed further backs this up ( table 4.2). Since receiving this data it has been
learned that both stores are trading on average around the R 190 000 a week
mark. With the cost of capital set at 18%, to receive cash flows fro the next five
0
-23,372
-177,680
0
0
0
-460,738
275,699
-82,710
192,989
2.82%
YearS
#NUM!
192,989

32
years as presented above, numbers wise , prove once again the viability of this
venture. The Actual observations of the IRR's and the NPV's are mentioned
below.
Because Woolworths business has not only been built on the number, but also
on the brand ; the survey submitted by the independent consultant is weighted
equal if not more than the numbers in determining the viability of the project.
Table 5.3. Summarizes the findings from the independent consultant who probed
the qualitative aspects of the initiative as well as the probe into the customer
profile. The findings are listed per pilot store, as each store has different
attributes, customer responses stemming from different customers. In addition in
the table there is a general section that list general comments from the
customers .
Table 4 .. 3. Table showing Orange street Vs Meadowridge customer profile
and findings:
Orange Street Meadowridge
• Young age profile 25-34years • Profile mature and affluent (35-
and 18-24 years 49 years)
• High % male customers • Mostly professional , pensioners
• Occupation: managerial, sales and entrepreneurs
and entrepreneurial • Education: std 10 (older profile)
• Majority claim to have either a and postgraduates.
diploma or a degree • Mostly married people with
• Origin: majority city bowl children in primary and
• Estimated 45 %new customers secondary school
• Existing Woolworths shoppers • Origin: Meadowridge,
shop at V&A and Century City kreupelbosch , Constantia
• They shop here for • They shop here mainly for
convenience. Quick in and out- convenience, quick in an out
33
convenience. Quick in and out- shopping. Parking not a
one stop shop 24 hours a day problem. It is perceived as a one
• Most customers frequent the stop shopping experience 24
store three times a week hours a day
• The customers love the concept; • Frequency of shop- three to five
the whole experience is times a week
definitely not degrading. • The customer loves the new
Woolworths brand intact concept and is a positive
• The till area and trained staff a shopping experience, not
major problem-not Woolworths degrading to the brand.
standards
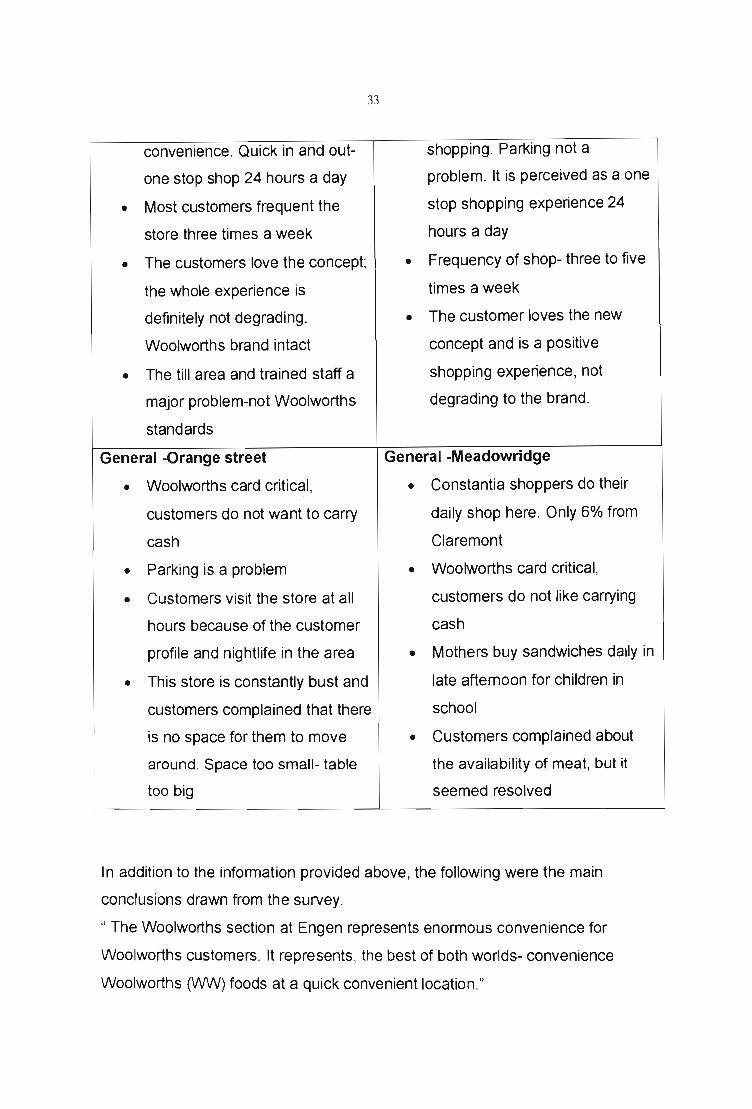
General -Orange street General -Meadowridge
• Woolworths card critical, • Constantia shoppers do their
customers do not want to carry daily shop here. Only 6% from
cash Claremont
• Parking is a problem • Woolworths card critical,
• Customers visit the store at all customers do not like carrying
hours because of the customer cash
profile and nightlife in the area • Mothers buy sandwiches daily in
• This store is constantly bust and late afternoon for children in
customers complained that there school
is no space for them to move • Customers complained about
around. Space too small- table the availability of meat, but it
too big seemed resolved
In addition to the information provided above, the following were the main
conclusions drawn from the survey.
" The Woolworths section at Engen represents enormous convenience for
Woolworths customers. It represents, the best of both worlds- convenience
Woolworths (WW) foods at a quick convenient location."

34
" the two current locations have brought such joy and delight to customers and
they speak so highly of these, that removing them would result in anarchy. The
feelings were very strong in this regard."
"However, the customer opinion confirmed that the following issues are of vital
importance:
• We must ensure that the Engens we choose are clean, hygienic and
managemenU location are in line with WN principles.
• We must continue to offer the "convenient foods" and not sell a range that
we are unable to maintain.
• We must improve availability
• We must continue to keep prices the same as lour stores 0NW). Many
customers have been introduced to WN because of their exposure in
these stores and are "surprised at the excellent prices".
A comment quoted from one customer, helps Woolworths to understand from a
qualitative point of view just how viable the venture is .
" I always though Woolworths was expensive. Now that I've realized what good
value the prices are, I shop at the Engen and have begun shopping at
Woolworths traditional stores."
Although there are obviously concerns, the overriding feeling from the numbers
and the survey conducted on customers shopping the store tend to indicate that
this venture is extremely viable and forms part of a strong competitive advantage
strategy that would be hard to replicate in the short term.
4.3. Observations discussed
Apon delving into the research, it was found that there were three role players
that participate in this alliance, namely Woolworths, Engen Head Office (HO) and
the Engen Dealer. Although there are three role players involved, from a high

35
level approach the Engen dealer and the Engen HO have been grouped as one.
Thus the feasibility study has been conducted for Woolworths vs. Engen.
Although this is the case , on the ground level, there was also work done in
deriving a model where all role players benefited.
To combat or try and gain the upper hand in the game of retail , Woolworths has
come up with a strategy, which has been generically named "The Difference".
This strategy is a competitive one and has been aimed at outperforming the
competition in the race for market share and ultimately sales and profit. From the
literature it can be seen that this strategy of differentiation involves serving
customer needs uniquely so as to merit premium prices by selectively adding
cost in areas producing high added value (Porter, 1998). This applies to all
aspects of the business and covers all of Woolworths functions and operations ,
from food development, to financial services to new micro store design to store
format. (Although on a trolley full of goods Woolworths is no more than between
2 - 4% more than the competition, this from recent research conducted).
In line with this thinking Woolworths has implemented these two trial stores (or
"cubby" concepts within the Engen forecourt store) and has been extremely
successful as the results reflect. In any alliance it is critical that all members
benefit, otherwise there would be no use in forming an alliance and this is
certainly the case . From an Engen perspective, Engen has benefited
tremendously from this alliance.
Each member has brought their unique strengths into the equation, which has
resulted in a synergy, ultimately resulting in an extremely positive outcome for all
parties concerned. Woolworths have brought their absolute dominance of HMR
(home meal replacements, their innovative good food and strong brand following .
Engen has brought their distribution network, its 1400 outlets in prime sites and
their dominance in the petroleum industry (petroleum sales- 31 %share in the
current market-Engen).

36
This alliance that has materialized between these two corporate giants has been
born from the realization that the formal unmeasured forecourt food market is
currently worth R46.5bn (Nielsen 2003). For Woolworths this represents a sector
of the market that has been previously uncaptured, and for Engen, this
represents the opportunity to gain a larger share in this market by attracting more
customers into their stores and possibly having a spin off on their primary
business-namely petroleum sales. The second reason that has attracted
Woolworths to this alliance is the second half of the Woolworths food strategy,
which is on of convenient foods. Engen has given Woolworths the tools and
format to trial marketing their product in a 24 hour trading environment.
If we look at the figures drawn from tables 5.1&5.2, it can be seen from a
Woolworths quantitative pOint of view this project is extremely feasible. From the
original scenario where sales were R70 000 a week, the net present value (NPV)
of the project was given at R478971 .37 (the life of the project taken over 5
years). From an internal rate of return (IRR) this scenario yielded in yr 1
R121230, and in yr 5 R192122. These figures being highly in favour of the
project. When we submit the actual sales scenario of on average R150 000, the
NPV of the project comes out at R515415.96 and the IRR for yr 1 is R144922
and for yr 5 R192989. In order for the project to be viable the net present value
has to be has to be a positive number. From the results the NPV is hugely
positive.
Because it is important to Woolworths to protect their brand integrity at all costs,
it is necessary to evaluate the qualitative date, before deciding overall if this
project is viable. From the data collected from the customer survey, and market
research in the trial stores: 40%of the people who shopped there did not
previously shop in Woolworths stores, 60%believe that 24 hour shopping is very
important, 32%shop daily at Engen Woolworths and 52% of the customers who
shopped Orange street store were males. (According to Nielsen 70% of
customers who shop our stores are female) . In addition customers loved the
experience and convenience of shopping a "24hour Woolworths store" and felt

37
that this did not detract from the Woolworths brand in any way. (This being
important as Woolworths in essence are giving Engen their product to sell , and
rely on Engen personal to maintain protocol; necessary in protecting the brand
integrity of Woolworths food).
What does this all mean? In essence Woolworths have picked up a new
customer base that are being exposed to the Woolworths Brand. In so doing
Woolworths have created the opportunity to attract new customers into their full
line stores. The fact that such a high percentage of customers commented on the
importance of 24 hour trading and hence convenience highlights the
attractiveness to entering this market. The high percentage of male customers
once again allows for exposure of the Woolworths brand to a customer segment
that traditionally has a low percentage of buyers.
From An Engen perspective, the feasibility is based on both their primary and
secondary markets, namely petroleum and shop sales. From the figures for
Orange street store (Appendix E and F), it can be seen that the food shop sales
went from R439667 per month prior to launch of the new store (Average 11
months prior to December 2000) to R2203527 (March 2003) , which represents a
500% upliftment in food store sales. The petroleum sales for the same period
went from 526993 litres per month (2000) to 799615 litres (2002) to 795497 litres
(2003), which represents a 51 % and 0% upliftment respectively.
Meadow ridge performed in a similar way, (Appendix C and D) seeing an
upliftment in sales in both their primary and secondary markets. In the food
market, the 11-month sales average prior to the store opening (September 2001)
went from R722758 per month (September 2003) to R1759175 (March 2003).
This represents a 214% upliftment in sales. The petroleum sales for the same
period went from 456012 litres per month (August 2003) to 701449 litres(March
2002) to 730606 litres (March 2003). This represents an upliftment of 53% and 4
% respectively.

38
Thus in both stores, the sales of both their primary and secondary markets has
increased significantly. The number of customers through the stores also
increased. This was measured by the comparing the number of shop
transactions in the stores to the figures in for August 2003. In Orange Street the
%upliftment in shop transactions was 13%, and Meadowridge showed an
upliftment of 16% in transactions.
The last piece of the puzzle is to ensure that all three parties in the alliance,
namely Woolworths, Engen HO and the Dealer collectively and individually find
the alliance profitable. From the current business model financials for the dealer
(Appendix A)can be seen that if a product retails for R100, R70.00 is paid to the
supplier for the product, the Woolworths wholesale buying margin equates to
R7 .11 and the retail buying margin from the dealer is R22.89. in effect this means
the dealer receives R22.89 before expenses. Once expenses have been
deducted and Engen HO have deducted their R4.00 commission, the dealer is
left with a net contribution of R3.61 .
From a Woolworths side (Appendix 8) Woolworths receive R7.11. Once
deducting expenses, listed as depot shrinkage, swell allowance, other cost to
produce, debtor and procurement costs, the net contribution comes out at R3.99.
However Woolworths require a minimum net contribution of R4.50 to cover
corporate overheads. In order to compensate for this difference Woolworths can
propose that the dealer pays for his goods seven days from the date of delivery
via direct debit. In essence what this does to the figures is allow RO.81 to be
deducted from the debtors expense, resulting in a net contribution of R4.80.
The commission the dealer pays to Engen HO is to pay for the investment of the
infrastructure and administration costs. The cost to build a Woolworths-Engen
shop comes in around the R1 .6mill mark. The dealer contributes R400 000 to
Capex, which is depreciated over five years and Engen HO pick up the remaining
amount. Summarizing this all parties benefit from this financially .

39
4.4. Summary
In summary, the numerical results strongly indicated that all partied benefit from
this project, venture. However since brand integrity means so much to
Woolworths as it forms the basis of their business, the survey conducted by the
independent consultant was weighted more important. This was so as
Woolworths did not want to damage their existing reputation by tarnishing their
brand. The results from the survey, indicate that brand integrity is in place and
that customers would literally revolt if Woolworths decided that this was not
feasible, as this concept has brought a new level of convenience to the
customers lives.

40
CHAPTER 5:RECOMMENDATIONS AND CONCLUSIONS
Based on the findings of this investigation, the following conclusions are drawn:
1. In order for a company to prosper in today's economic climate it is
imperative that the company be aware of its surroundings. One of the
simplest methods of doing this is to conduct a SWOT analysis, which
sums up the strengths, weaknesses, opportunities and threats that relate
to the company. Once this has been concluded those trouble areas can be
focuses on.
2. A threat facing just about every company is the threat of competition.
Competition comes in many forms and from many different sources.
Porters Five Forces Model show us that competition is not just merely the
companies one is in competition with, but rather that there are other forces
such as substitutes and the collective power of large suppliers and buyers
that can influence competition. Competition can cause loss in market
share and ultimately loss in profits and shareholders value .
3. One way to combat this competition is by creating a strategic competitive
advantage. The work strategic implies that the aim of this is to gain an
advantage over ones competitors, but also to derive a sustainable solution
that will last longer than one trading season. One way of doing this is by
looking to form strategic alliances with companies that are strong where
your company is weak, or where your company has relatively little
expertise or assets. This is the case with the Woolworths-Engen initiative.
4. From market research customers want convenience food. This extends
further down the line than food that can be cooked in the microwave in
less than 5 minutes , and extend to the accessibility of this food .
Woolworths , the market leaders in HMR's (home meal replacements)

41
have the right profile product, but traditional have traded in stores that
keep regular office hours. Engen who have market share of the petroleum
market, have accessible sites that trade 24 hours a day and had fairly
recently moved into the secondary business for them- the Engen Quick
Shop. By combining the two one arrives at a winning business formula.
5. The strength of the Woolworths-Engen initiative is that the two members in
the alliance have common goals - to grow their primary businesses, they
have a synergy fit, they clearly understand the value that each member
brings to the table and they have balanced the contribution of the partners
in the areas of the product. And the success of this has been built on
these foundations.
6. The extremely positive NPV figures show that from Woolworths
quantitatively, this venture is extremely viable. From the qualitative
research it seems that Woolworths fears of maintaining brand integrity
have not been founded as customer relish the shopping experience.
However it should be noted that the introduction of the Woolworths card
paying system in these shops are essential and will most likely attract a
higher ACP (average customer purchase). By changing payment terms to
seven days, Woolworths will be able to exceed their minimum net
contribution to cover corporate overheads by reducing their risk to debtors.
Woolworths can learn from analyzing the sales in these Woolworths -
Engen stores linked to the buying patterns of certain geographic regions
and can incorporate this learning into some of their full line stores found in
the same geographic location. Woolworths can also run promotions in
these stores to attract customers to their full line stores in order to raise
their ACP. This venture is certainly a competitive advantage as there is no
other retailer in the South African market that can compete with
Woolworths HMR's.
U96443

42
Woolworths by strong product innovation have created a strong category
of food, and by marketing this product in a 24 hour trading store,
Woolworths are exposing potential customers to their brand that these
customers would not normally shop.
By choosing Engen as a strategic alliance, Woolworths have given their
project the best possible chance of success, due to Engens market
dominance and situation of their petrol station. From Engens perspective,
the fact that they offer a strong well recognized sought after brand in their
quick shops has been a huge competitive advantage for two reasons.
One, Engen is offering a unique service and convenience to the
customers that shop petroleum at their sites. Creating a draw card for
customers to shop at Engen sites, not only those particular pilot project
sites, but also their additional petroleum sites. The offer of Woolworths at
an Engen site results in a return appeal for the customers to that specific
site, evident in the increase in petroleum sales and the increase in the
total food shop takings. The second reason is that because the
Woolworths brand is synonymous with quality and affluence, the initiative
tends to upgrade the status of the petroleum station, or in other words
strengthens the brand of the petroleum station. An attraction to the
customer to further boost this venture is the security of the location,
especially after hours.
In order to ensure brand integrity, Woolworths need to have trained the
dealer and his staff in Woolworth's protocols and Woolworth 's culture. One
possible way of doing this is by offering a program by which the Engen
personal would attend a programme made up of two aspects. The first
would be a series of interactive lectures laying down the foundations of
Woolworths, and the second would be a two-week attachment for the
people concerned in a current Woolworth's store. Woolworths could go
one step further, by ensuring that these Woolworths-Engen sites were

43
audited one a year. Mystery shoppers could be used to ascertain if the
correct disciplines and Woolworth's ethos were being followed.
7. It can be noted however that there is a factor, that if not present would
result in these ventures not being a success and that is location.
Woolworths and Engen need to choose sites that are convenient for
people to stop at .i.e. on the major routes in, out and around town. Within
eyesight of peoples normal commuting routes. Linked to this there must
be adequate parking available for customers.
8. The two pilot projects prove that this form of strategic alliance is
successful and beneficial to the two members concerned. As the sites role
it, it would be recommended that the teams responsible for running this
venture resit and rework the numbers in terms of commissions and buying
margins to ensure that at the end of the day the benefit goes to the
customer. That is what will ensure the sustainability of this venture.

44
CHAPTER 6: BIBLIOGRAPHY
Arnold, G. 1998. Corporate Financial Management. Pitman Publishing. GB p 56-
92
Brito, D and Gottlieb, J. 2001 . A joint venture requires more than a joint vision.
Washington Business Journal. March 2001
Buckley, A. 2000. Multinational Finance- 4th Ed. Prentice Hall.England.p 378,
409-440
Cooper, D and Schindler P. 2001 . Business Research Methods-]'h Ed. McGraw
Hill. Singapore. p 88, 132,160, 226, 256
Capon, N and Glazer R. (1987) , "Marketing and technology: a strategic co
alignment", Journal of marketing, Vol 51 p 1 - 14
Dambrot, S.M (1990), "Foreign alliances that make sense", Electronic Business,
September 3 p 68-71
Devlin, G and Bleakley, M. (1988), "Strategic alliances -guidelines for success",
Long Range Planning, Vol21 No. 5 P 18-23
Gross, T and Neuman, J. (1989),"Strategic alliances, vital in global marketing",
Marketing News, Vol 23 No.13 P 6-8
Hamil , G., Doz, Y.L. and Prahalad, C.K. (1989) ,"Collaborate with competitors- and
win ", Harvard Business Review, January to February, p 133
Huston, P. (1991) , " When two companies capitalize on each others strengths",
Medical Marketing and Media, February, p 16-25

45
Kanter, R.M. (1990), "When giants lea m cooperative strategies", Planning
Review Vol. 18 No. 1 P 15-22
Kodama, F. (1992),"Technology fusion and the new R&D", Harvard Business
Review, July- August, p 70 -78
Kogut, B. (1988), "joint ventures: theoretical and empirical perspectives",
Strategic Management Journal , Vol. 9, p 319-32
Kuhn, R.L. (1989), "Japanese-American strategic alliances", Journal of Business
Strategy, March- April, p 51-3
Lapedus, M (1993), "Alliances boost sales", Electronic Business News, May 3,
p41
Lorange, P., Roos, J. and Bronn, P.S. (1992), " Building successful strategic
alliances", Long Range Planning, Vol. 25 No. 6 P 10-17
Lynch, K 2002. 'Leading Brands, A key For Consumer Product Companies in
2002 . Financial Times. January 2002
Murray, E.A. and Mahon, J.F. (1993),"Strategic alliances: gateway to the new
Europe?", Long Range Planning, Vol. 26 No. 4 P 102-11
Pisano, G. (1990), " the R&D boundaries of the firm: an empirical analysis",
Administrative Science Quarterly, Vol. 35 p 153-76
Porter, M.E. and Fuller, N.B. (1986), "Coalitions and global strategy", in Porter,
M.E. (Ed.), Competition in Global Industries, Harvard Business School Press,
Boston, MA

46
Ring, P.S. and Van De Ven, A.H. (1992),"Structuring co-operative relationships
between organizations", Strategic Management Joumal, Vol. 13,p 483-98
Shan, W. (1990),"The empirical analysis of organizational strategies by
entrepreneurial high-technology firms", Strategic Management Journal, Vol. 11 p
129-39
Valigra, L. (1991} ,"Fuji-Xerox: example worth copying", Asian Business, January,
p 29
Vyas, N.M. , Shelbum, W.L. and Rogers, D.C. (1995} ,"An analysis of strategic
alliances: forms, functions and framework", Journal of Business and Industrial
Marketing, Vol. 10 No. 3 P 47-60
The Antidote Issue 4 (1997), "Remember Competitive Strategy? Remember
Michael Porter?"
The Antidote Issue 16 (1998), "Strategy according to Michael Porter"
Confidential Business Documents and Reports.
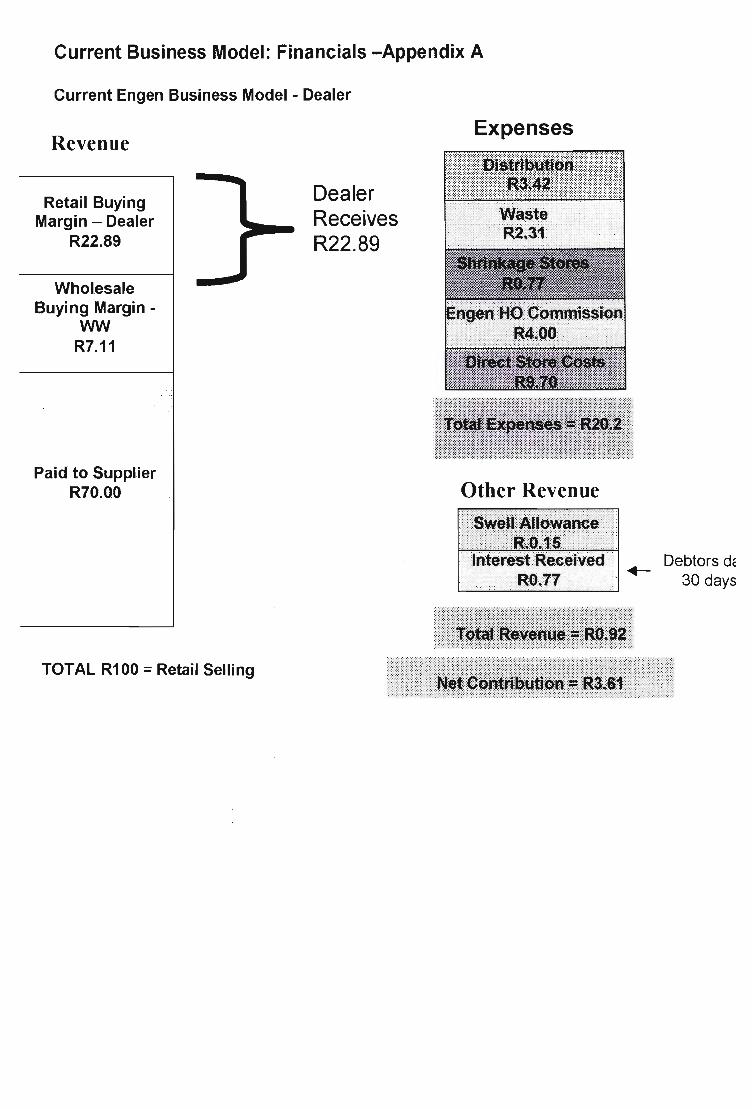
Current Business Model: Financials -Appendix A
Current Engen Business Model - Dealer
Revenue
Retail Buying Margin - Dealer
R22.89
Whol.esale Buying Margin -
WW R7.11
Paid to Supplier R70.00
TOTAL R100 = Retail Selling
Dealer Receives R22.89
Expenses
Other Revenue
Debtors de .--30 days
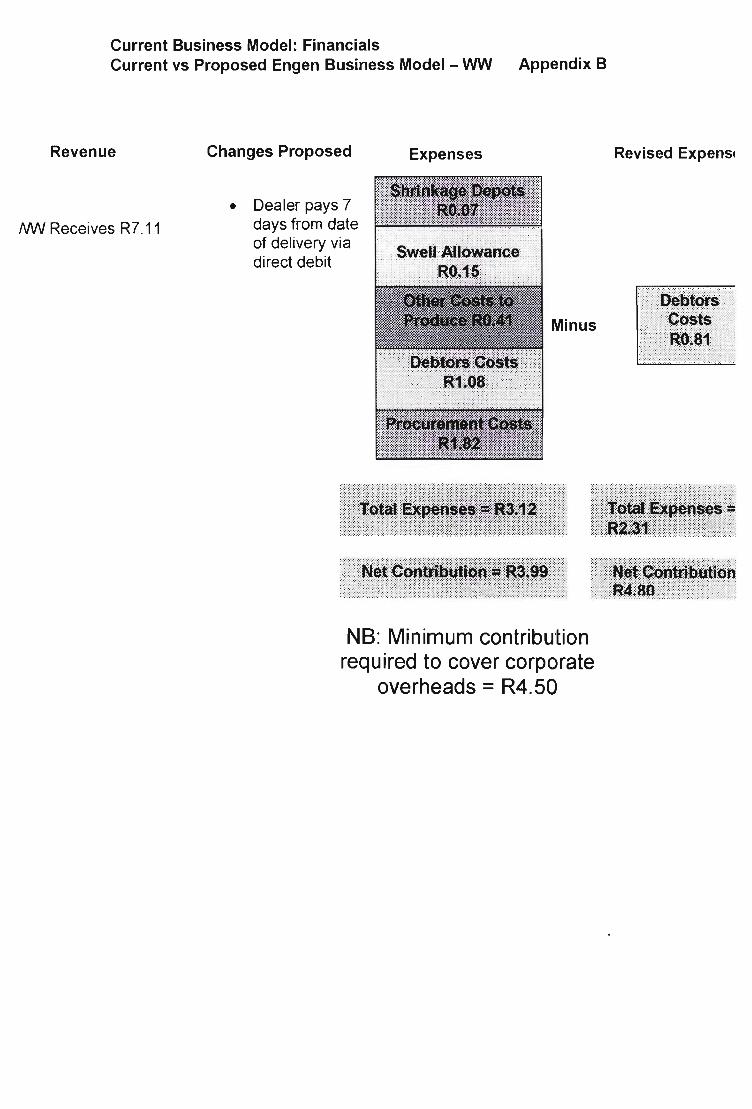
Current Business Model: Financials Current vs Proposed Engen Business Model - WW Appendix B
Revenue
/WIJ Receives R7.11
Changes Proposed
• Dealer pays 7 days from date of delivery via direct debit
Expenses
Minus
NB: Minimum contribution required to cover corporate
overheads = R4.50
Revised Expensl
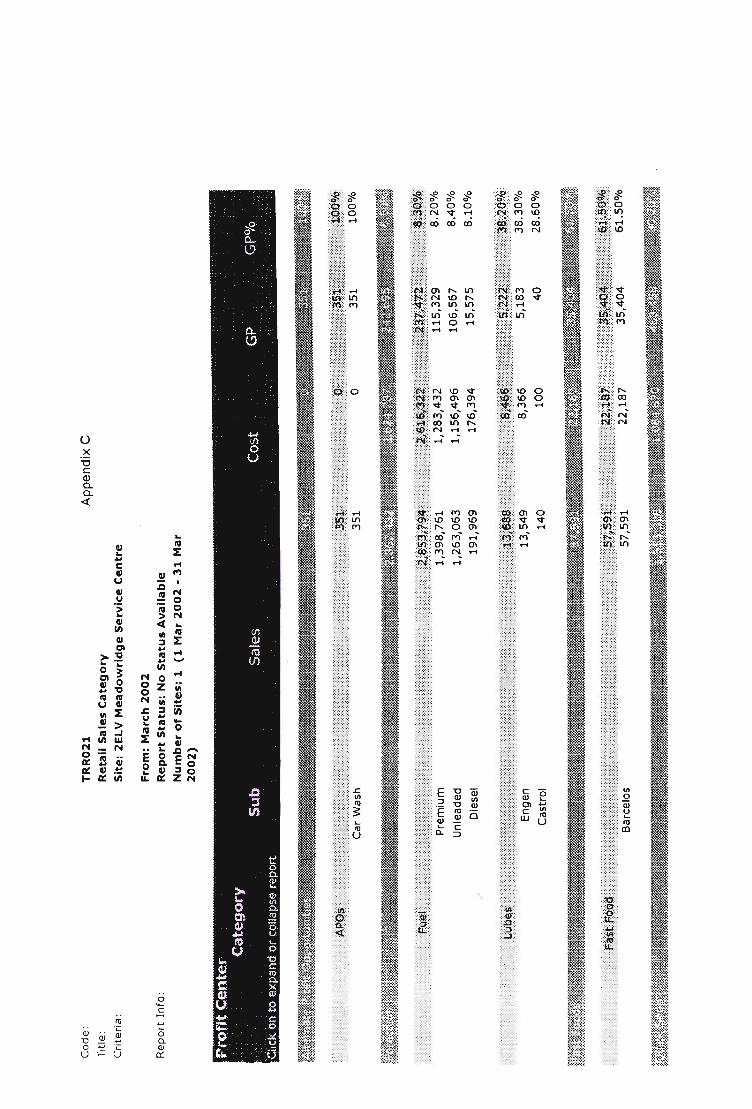
Code :
Tit le:
Cri t eria:
Re port Info :
TRR021
Retail Sales Category Site: 2ELV Meadowridge Service Centre
From: March 2002
Report Status: No Status Available
Number of Sites: 1 (1 Mar 2002 - 31 Mar 2002)
Appendix C
Profjt Center Category
_' . Sub Sales "lick on to expand or collapse report Cost GP GP%
Car Wash 351 o 351 100%
rf.)il~~:;l~~~j!;~j:!I:~::~~!~~~Jft.~r.il[I*-i.};Ii._lllf~tlrX_~II~.If{i!~~~f~Jl~~f&~~t~iw.rt1~~ti~lf~'illi_~m~iffii~1W~~1f:!i~Itrill
Premium 1,398,761
Unleaded 1, 263,063
Diesel 191,969
Engen 13,549
Castrol 140
1,283,432
1,156,496 176,394
8,366
100
115,329
106,567 15,575
5,183
40
8.20%
8.40% 8.10%
38.30%
28.60%
m~:m~:m:::11.;;~I(~f.~::::ffi~1~f~E~!!.ili~llillir.~!f~w:~~~_.wt.~~It_~lf.i!~BIf~fJ~TtriflJlJllflil~fiI]fJ.1f~1~
Barcelos 57,591 22,187
m~:~m£~il~~~I;~mi.i:r;~t.JI~~l~*m1ftWI~I~fi"~W~j,lIlli.mlli~.;~~~I.[m:f[~;~*~f1~f~irtt!~1;fill~if~!t11fff.~fqi~~~f..~~~.J~E~i!f,~l~~l~~;rt3~m:%ij~
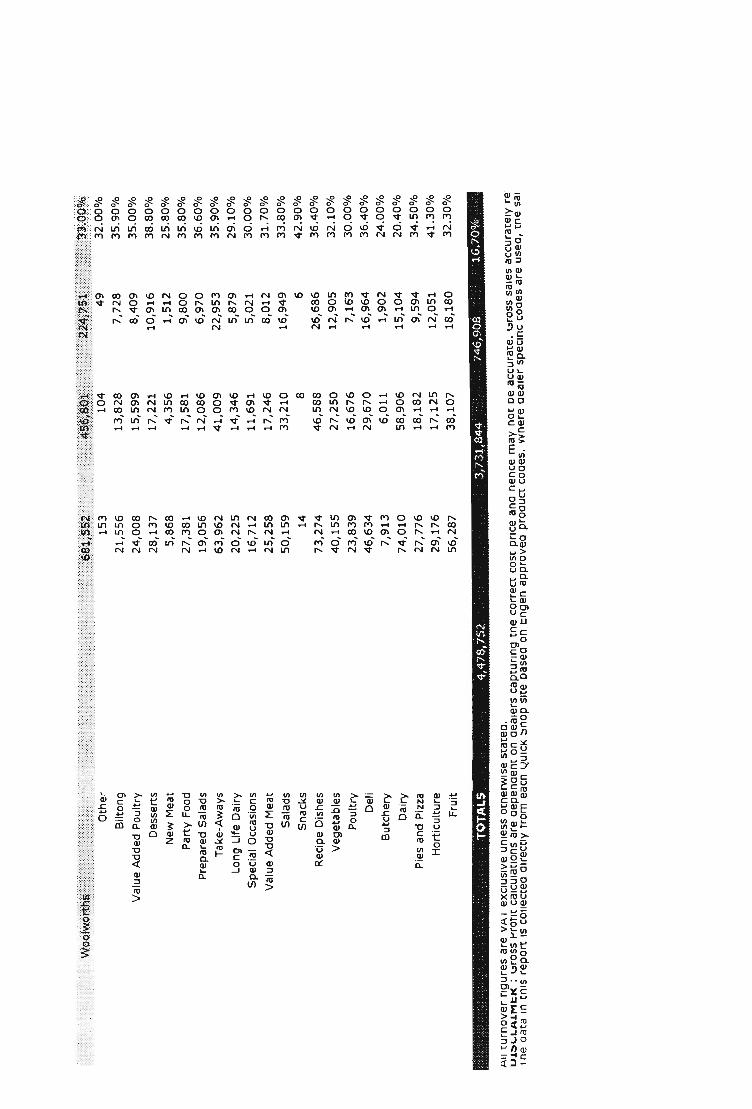
Other 153 104 49 32.00%
Biltong 21,556 13,828 7,728 35 .90%
Value Added Poultry 24,008 15,599 8,409 35.00%
Desserts 28,137 17,221 10,916 38.80%
New Meat 5,868 4,356 1,512 25.80%
Party Food 27,381 17,581 9,800 35.80%
Prepared Salads 19,056 12,086 6,970 36.60%
Take-Aways 63,962 41,009 22,953 35 .90%
Long Life Dairy 20,225 14,346 5,879 29.10%
Special Occasions 16,712 11,691 5,021 30.00%
Value Added Meat 25,258 17,246 8,012 31.70%
Salads 50,159 33,210 16,949 33.80%
Snacks 14 8 6 42.90%
Recipe Dishes 73,274 46,588 26,686 36.40%
Vegetables 40,155 27,250 12,905 32.10%
Poultry 23,839 16,676 7,153 30.00%
Oeli 46,634 29,670 16,964 36.40%
Butchery 7,913 6,011 1,902 24.00%
Dairy 74,010 58,906 15,104 20.40%
Pies and Pizza 27,776 18,182 9,594 34.50%
Horticulture 29,176 17,125 12,051 41.30%
Fruit 56,287 38,107 18,180 32.30%
TOTAl.S 4,478,752 3,731,844 746,908 16.70%
All turnover ngures are VA I exclusive untess omerwlse stateo . Ul::'l..LA1Mt:K : I..:Jross t-'rom calculations are oepenoent on aealers captUring me correct COSt price ana nence may not oe accurate. I..:Jross sales accuratelY re I ne oata In mls report IS cOlleCtea OIrectty rrom eacn I..lUICK ~nop site casea on t:ngen approvea proouct coaes. vvnere oealer speclnc cooes are useo, me sal

MONTH ¥Tb Mar-02 Apr 2001 to Mar 2002
%Con - Sales Sales Cost GP GPO/o %(00 - Sales
100% 1,553 o 1,553 100% 100%
: ?' .• " .•.••• ·· .• i •••• ?. :: •... \ .(./.. . .t !~;§9~4 : ::;;: .. {. \............::) ~t~i9~~9i.~ \)i/ .··}:m:: •• :: ~1y~?~i~f.Mm:.m::{ .:'; .::::·:::: i~~:i§;:tgt·:::::I:::::: .::::::·::.: : : :: ·: : ~8,p,24,::::: : ··:':: :..::\\·: :.:.::.··:/:·.:·:::: ...•.. :·:·: ~i;?Pf(~ . 49 .00% 15,418,827 14,166,926 1,251,901 8.10% 44 .30%
6.70%
99 .00%
1.00%
100%
9,867,722
1,919,479
129,307
1,056
510,897
9,055,135
1,757,260
83,931
756
207,897
812,587 8.20%
162,219 8 .50%
45,376
300
303,000
35.10%
28.40%
59 .30%
56.70%
36 .30%
7.10%
99.20%
0 .80%

0 .00% 356 249 107 30.10% 0 .00%
3 .20% 57,255 39,264 17,991 31.40% 1.00%
3 .50% 64,269 42,159 22,110 34.40% 1.20%
4 .10% 74,571 45,954 28,617 38.40% 1.40%
0 .90% 14,731 11,080 3,651 24.80% 0.30%
4 .00% 71,289 46,805 24,484 34.30% 1.30%
2.80% 51,064 32,859 18,205 35.70% 0.90%
9.40% 157,847 102,601 55,246 35.00% 2.90%
3.00% 54,772 39,665 15,107 27.60% 1.00%
2.50% 31,170 22,057 9,113 29.20% 0.60%
3 .70% 66,211 45,741 20,470 30.90% 1.20%
7.40% 128,075 85,154 42,921 33.50% 2 .30%
0 .00% 27 16 11 40.70% 0 .00%
10.80% 194,470 125,059 69,411 35.70% 3.50%
5.90% 105,091 72,075 33,016 31.40% 1.90%
3 .50% 63,523 44,517 19,006 29.90% 1.20%
6.80% 128,384 82,120 46,264 36.00% 2 .30%
1.20% 21,504 16,037 5,467 25.40% 0 .40%
10.90% 196,929 158,731 38,198 19.40% 3.60%
4 .10% 72, 514 47,708 24,806 34.20% 1.30%
4.30% 77,647 46,016 31 ,631 40.70% 1.40%
8.30% 165,167 113,881 51,286 31.10% 3.00%
41,476,519 35,178,343 6,298,176 15.20%
Tlect all transactions processeo . es Inrormatlon IS summanzea as I...ategory "IVIISCellaneOUS". I ne "IVIISCel laneous t-'roaucts " report toY Site) liStS tnese proaucts. t:ngen Will oe perrormlng a Site cleanup to ensure
( .j:

Code:
Title:
Cri t eria :
Re port Info :
Profit Center Category
Cilck 00 to expand or collapse report
TRR021 Retail Sales Category Site: 2ELV Meadowridge Service Centre
From: March 2003 Report Status: No Status Available Number of Sites: 1 (1 Mar 2003 - 31 Mar 2003)
Appendix D
Sub Sales Co~l GP GP%
,~W : : ;,: !~I~ntiim!;i;;1;i@in;;1!lmil;;MMffiJ;il;~mi;;iJiil;m;i;i;;ili;;li1iil~ljii!AiWtjlii1@l11il~,il1il;;;i~@if,fr.~i;Mlliif!~MJ;m~iilim@l~l~i;i;;l;;l%it1f>iii!hs;i~mlf i@ J; , ill , ""'~@;£':!m~~~r!ffl.lffl'~l gHib!t4~,r- lt~~
Car Wash 562 0 562 100%
Tyres 92 65 27 l~ . .JUU/o
9W#: Premium 1,336,282 1,216,958 119,324 8 .90%
Unleaded 1,654,133 1,505,075 149,058 9.00%
Diesel 251,799 229,487 22,312 8 .90%
Is~1 (:() ··:.: : :'::::::.:: : ~f!!t Engen 14,563 9,836
Castrol 91 62 29 31.90%
} -c -c et C :;; c

MTN Virtual 22,476 18,675 3,801 16.90%
Vodacom Virtual 41,964 36,269 5,695 13.60%
Cell - C Virtual 4, 337 3,644 693 16.00%
Telkom Virtual Voucher 18,044 16,221 1,823 10.10%
Below the line 7,118 4,543 2,575 36.20%
Biltong
~!~~ .) )> ::: ::, ' ~~'#,~:::::: :U:, (,,:: ?@~;~j7:,: U:::)::}~~8Ig~ 19,692 12,620 7,072 35.90%
Value Added Poultry 22,971 14,503 8,468 36.90%
Desserts 32,095 20,118 11,977 37.30%
New Meat 11,631 9,620 2,011 17.30%
Party Food 21,941 14,051 7,890 36.00%
Prepared Salads 22,246 14,088 8,158 36.70%
Take-Aways 91 , 280 59,427 31,853 34 .90%
Long Life Dairy 24,853 17,653 7,200 29.00%
Special Occasions 13,376 9,430 3,946 29.50%
Value Added Meat 26,528 18,714 7,814 29.50%
Salads 47,899 31,725 16,174 33.80%
Recipe Dishes 94,424 61,002 33,422 35.40%
Vegetables 43,019 28,896 14,123 32.80%
Poultry 23,807 18,290 5,517 23.20%
Deli 58,082 36,785 21 ,297 36 .70%
Butchery 7,618 6,573 1,045 13.70%
Dairy 96,408 76,675 19,733 20.50%
Pies and Pizza 27,413 18,141 9,272 33.80%
Horticulture 27,843 16,553 11 ,290 40 .50%
Fruit 60,731 40,300 20,431 33 .60%
TOTALS 5,077,967 4,205,940 872,027 17.20%
All turnover ngures are VA I exclusive unless omerwlse stateo. UJ.:::t~LAJ.Mt:1( : uross .-ront calculations are oepenaent on aealers captunng me c:orrec:t C:OSt pnc:e ana nenc:e may not ce ac:c:urate. uross sales ac:curatelY re' I ne oata In tnlS report IS cOlleCtea olrectly rrom eacn l.c!UICK ::>nop site casea on t:ngen approvea proaUct coaes. vvnere aea ler specific cooes are usea, tne sal

MONTH YTD Mar-03 Apr 2002 to Mar 2003
%Coo - Sales Sales Cost GP GP% %Con - Sales
;;;t%~ili;li;~!i;iiii
8,038 o 8,038 100%
100% 714 461 253 35.40% 100%
' .F. :··:· : ::· ;:)r::· ·:::·:·:::~ff;§gf&::::::::::::::::::::::::::::::::::::::::::::::~1!:~'~f!ZP U:·:::: · .::::::: ::· :·:::::::::~~~§~i:9~7:::::::::::f·::::.:::::::::·:::::J~lt9i9tit::::::::::::::::::::::::::::::::::: :::: ~~9RW. ::::I::::·::::::::::::::::::::::::·::::::::::::::n:::::::::::::I::::.::::::i2i§9f4{ 41.20% 15,134,198 13,935,132 1,199,066 7 .90% 44.10%
51.00% 16,699,985 15,371,155
7.80% 2,501,987 2,289,810
99.40%
0.60% 150,853
997
98,630
704
1,328,830
212,177
52,223 293
8.00% 48.60%
8.50% 7.30%
34.60% 99.30%
29.40% 0.70%
C <.

25.00%
46.60%
4.80%
20.00%
100%
184,396
334,915
26,503
137,854
26,727
155,266
289,272
22,264 123,653
5,989
29, 130 45,643
4,239 14,201
20,738
2.50% 241,166 152,293 88,873 3.00% 215,347 135,812 79,535
4.10% 369,010 227,249 141,761
1.50% 88,617 70,950 17,667 2.80% 249,994 159,618 90,376
2.90% 237,235 148,950 88,285
11.80% 798,063 518,511 279,552
3.20% 238,961 169,947 69,014 1.70% 28,669 20,199 8,470 3.40% 263,978 185,976 78,002
6 .20% 502,071 329,854 172,217
12.20% 994,499 649,903 344,596
5.60% 490,473 331,483 158,990
3 .10% 254,743 184,811 69,932
7.50% 539,116 342,772 196,344
1.00% 73,403 61,211 12,192
12.50% 956,818 774,927 181,891
3.50% 330,965 220,094 110,871
3.60% 353,711 210,415 143,296
7.80% 572,582 387,865 184,717
15.80%
13.60%
16.00% 10.30%
77.60%
36.90%
36 .90%
38.40%
19.90% 36.20%
37.20%
35 .00% 28.90% 29.50% 29.50%
34.30%
34.70%
32.40%
27.50%
36.40%
16.60% 19.00%
33.50%
40.50%
32.30%
53,212,419 44,574,101 8,638,318 16.20%
20.60%
37 .50% 3.00%
15.40%
84.20%
3.10%
2.80% 4.70%
1.10% 3.20%
3 .00%
10.20%
3.10% 0.40% 3.40%
6.40%
12.80%
6.30%
3.30%
6.90%
0 .90% 12.30%
4.20%
4.50% 7.30%
nect all transactions processea . es Inrormaclon IS summanzea as L.ategorylvllscellaneous·. I ne 'Ivllscellaneous I"roaucts ' report lOY Site} liStS tnese prooucts. t:ngen Will oe perrormlng a Site cleanup to ensure
o ~

Code :
Title :
Cr iteria :
Report Info :
Profit Center Category
Click on to expand or collap:,(' rf?port
TRR021
Retail Sales Category
Site: 2ENA Oranje Service Centre
From: March 2002
Report Status: No Status Available
Number of Sites: 1 (1 Mar 2002 - 31 Mar 2002)
Appendix E
Sub Sales Cost GP GP%
i'ifW~qi!t:llW~~~~1 ~li~i.~4r~~killW~W_.:t.
' , $ , " j $l~ii%niiiiiiiWiiYiiiiliii:iiiiiiiiiPiinii;iin;?i;i,i;";';;'i;'ii;iill"v.J%;-lOii'ii~";'@;';i''''!ii;;i;@;s--;H;''''''N;i;, :iiM ,,,,i~""@;;;~;u mu IMi@i%i,ii"i%ii@iii'iS" 1'iiiij@'m ' NN ~, , ,~~!W"",,;;;'w;,~mb,~;<;,,@%;;iifi;<id;;i;";;ii,,;';ii;;'i;';w;;;im'iiii<;;i~~iW<i;;%;'iikiiWi;i;;;;;<;,;;M~~h;N% ; J!i0}%i~~iH(liLN;,tii;;',;;;i;;;<i&;;i;::~i;,9i!,,!, ~iiwx '-i; ;/ , m
Other
Tyres
Premium
Unleaded
Diesel
Engen
Barcelos Pizza Den
193 273
1,619,088
1,249,629
146,788
12,312
122,168 14,693
121
163
1,483,459
1,140,557
136,643
8,553
51,461 8,927
n 110
135,629
109,On
10,145
3,759
70,707 5,766
37.30% 40.30%
8.40%
8 .70%
6.90%
30.50%
57.90% 39.20%
~~~~)-"~"'~~'S..~~'~~.(i;l~~~l~''''''' .. _a::::;'6'~ ?z?jIMk.1;~~wllliWi~' '. . ' . : ~ , ; ,' ., , .. , '. x. " •. ~ ,. ~ . ~ . ", • • ~*, "" k~

Vegetables 40,402 27,522 12,880 31.90%
Poultry 20,475 12,972 7,503 36 .60%
Deli 45,625 28,677 16,948 37 .10%
Butchery 10,227 8, 588 1,639 16.00%
Dairy 65,755 50,428 15,327 23.30%
Pies and Pizza 23,528 15,428 8,100 34.40%
Horticulture 22,023 13, 117 8,906 40.40%
Fruit 61,685 41,907 19,778 32 .10%
TOTALS 5,008,42G 4,075.373 933,053 18 .60%
1-111 turnover ngures are VJ.\ I exclusive unless otnerwlse stateo . U.l:t\"LA.lMt:1< : ~ross ",ront calCUlations are oepenoent on oealers capturing me correct COSt price ana nence may not oe accurate. ~ross sales accuratelY re' I ne aa ta In tnlS report IS cOllectea alrectlY rrom eacn \.(UICK ::.nop Site oaseo on ~ngen approveo proouct cooes. vvnere oealer speclTlc cooes are useo, tne sal
rr

MONTH YTD Mar-02 Apr 2001 to Mar 2002
%Con - Sales Sales Cost GP GP% %Con • Sales
H-Rlf%i~ ~. ', ' A~. di~i'piiYiniOO:%%iiii;7if;i!WWiii;'i;;i'ii;~F;i:$~iii;;"$iA1ji<I~Wi;,~H;iiiii@i~i'f;)W;i~;i;bi;;;!;;';iir;%i;i;iq4~g,~;;;n;;pi;;;;~' 'NiW.;.;,LibWdilWiMi/i;NimiliiiiiWWiii~~
, , l%w"; .;i><" ;';'1fL,. ;,,,.;;,,;;;;w;;<,;h;;;,,·;,;,,;';;i;i;,,it,,m.,,iiimrd,5';;;;;;,i;';;;;;;;;;,;;M';i;, :MJi"h;;M;;;;;i'iitd~;i<',i;i;', . ",;";;«;;Mi';;;;,,,. Jl N~m ";;";,m%wil;5';i;,M;';;",;"",;";h"" ",,,, ,
41.40%
58.60% 859
499 557
306
302
193
35.20%
38.70%
63.30% 36.70%
::: '.:::.::::.::::;:; :'. i: ,::: .~~liqX~!:::!::!:::!!:!!:!:!:!!:!::!!::!:::!!! !:!!:!::!!:·g~~~t~f:§§?:::·:;::::;:;::.:·:':!::··:!: ;l~j:~~;~1~ :! :· :!!!!.:::!U:::.::!:!::!:::!!:::if~l:f~9~I:::::·!:!:'!:!:::!!!:!:':!!!::!!~~§~w.:::::::::::::::: : :::;":.::: '?:: :I·:!:: .. ::\!:!::~2;§9%~:
m'i~;~llI' m~~iimmillr ~:-;.::::::~~:::. " ::::~~:k'".:L~~?::: *~>.".::~.:~<:~~.t::>X'.(~ .. '
53.70% 18,126,453 16,591,371 1, 535,082 8.50% 60.70%
41.40% 10,345,293 9,446,649 898,644 8 .70% 34.60% 4 .90% 1,405,112
100% 109,247
:_il;i;!l;;mil@!@;iill
89.30% 10.70%
1,161,725 147,202
1,280,929
73,527
636,024 57,927
124,183
35,720
525,701
89,275
8 .80%
32 .70%
45.30% 60.60%
4.70%
100%
88.80% 11.20%

5.20% 111,912 76,745 35, 167 31 .40% 1.60% 2 .60% 57,743 37,757 19,986 34 .60% 0 .80% 5.90% 130,774 83,146 47,628 36.40% 1.90% 1 .30% 26,370 21,491 4,879 18.50% 0.40% 8.50% 179,812 140,438 39, 374 21 .90% 2 .60% 3.00% 61 ,921 41,082 20,839 33 .70% 0.90% 2.80% 61,996 37,662 24,334 39.30% 0.90%
7 .90% 178,718 123,701 55,017 30.80% 2.60%
47,986,195 40,007,415 7,978,780 16.60%
rlee r all rrans acclons processea . es Inror rnarlon IS summarlzea as Lategory "IVIISCellaneous . I ne "IVIISCellaneous ",roaucts" report: lOY Site) liStS mese proaucts. t:ngen Will De pelTormlng a Site cleanup to ensure

Code :
Titl e:
Criteria :
Repo rt Info :
::'rofit Center CategOry
TRR021
Retail Sales Category Site: 2ENA Oranje Service Centre
From: March 2003
Report Status: No Status Available
Number of Sites: 1 (1 Mar 2003 - 31 Mar 2003)
Appendix F
..... Sub Sales ""lick on to expand or collap$e n::port Cost GP GP%
Other
Tyres
105
34
65
21
40
13
38.10%
38.20%
~~:~q~~'-'''~l~~~t.~~:?-~m'@~~~j::?~m~m;:~il'~:w'::1_::::;i1m~ill!*;mM§oormIDmllfflmff._· ;~r.~mm,mfu'%~~;:;;"':R=_!lf4fW~>"i~li'JW __ ruWr.mtW~~ ~~~~~~~~t~~~~!a:~~;?JM~~~.m::1Mf-M:j~1:«'$« w . • :!.~~~~~ r~ . .r->~fuf~?~~~:~~Jf . ... _d~u~~i ~ ? . ' ~ ::~'lf~:t::X~ .. :~~:::
w11~~~~lili~~f~~1%1i~1~~~i~ff~~I,._
Premium
Unleaded
Diesel
Engen
Barcelos
Fish Fryer
Pizza Den
1,574,510
1,673,727
200,009
13,488
124,097 9,250
8,659
1,419,827
1, 512,363
183,665
9,750
41 ,631 3,685
3,953
154,683
161,364
16,344
3,738
82,466 5,565
4,706
9 .80%
9.60%
8.20%
27.70%
66 .50% 60 .20% 54.30%

Biltong 35,977 23,110 12,867 35.80% Value Added Poultry 20,983 13,372 7,611 36 .30%
Desserts 39,035 24,204 14,831 38 .00% New Meat 10,855 8,957 1,898 17.50%
Party Food 34,386 21,712 12,674 36.90% Prepared Salads 30,356 19,039 11,317 37.30%
Take-Aways 183,138 119,233 63,905 34.90% Long Life Dairy 35,598 24,913 10,685 30.00%
Value Added Meat 22,476 15,756 6,720 29.90% Salads 55,956 36,705 19,251 34.40%
Recipe Dishes 109,225 70,021 39,204 35.90% Vegetables 40,388 26,690 13,698 33.90%
Poultry 22,182 16,374 5,808 26.20% Deli 44,138 27,956 16,182 36 .70%
Butchery 7,507 6,595 912 12.10% Dairy 88,533 68,142 20,391 23 .00%
Pies and Pizza 13,829 9,127 4,702 34 .00% Horticulture 21,530 13,016 8,514 39 .50%
Fruit 55,611 36,730 18,881 34.00%
TOTALS 5,807,405 4,656,762 1,150(643 19.80%
All turnover ngures are VA I exclusive unless omerwlse StateD. UJ.::>~LAJ.MI:K : uross !"ront calculations are DepenDent on aealers captunng me correct COSt pnce ana nence may not oe accurate. uross sales accuratelY rene I ne Data In rnls report IS cOllectea DireCtlY rrom eacn I.;!UICK ;:,nop Site oaseD on t:ngen approvea proauct CODes. vvnere aealer speclrlc coaes are usea, tne sales

MONTH ·YTD Mar-03 Apr 2002 to Mar 2QQJ
%Con - Sales Sales Cost GP GP% %Con • Sales
75.50% 24 .50%
45.70%
48 .50%
5.80%
100%
1,893
1,845
17,949,350
16,622,323
1,928,246
164,120
1,197
1,127
23,029,627
17,682,647 1,784,757
105,135
696
718
-5,080,277
-1,060,324
143,489
58,985
36.80%
38.90%
0 .00%
0 .00%
7.40%
35.90%
50 .60%
49.40%
49.20%
45 .50% 5.30%
100%
!:~:~j@:1::::i:i.:::~!::ri:~:!~1~m~~.~;i¥Jtmilt~lU~.t_\.'J¥ __ a~ff{;W_.~_Eu~1
87.40%
6.50%
6 .10%
1,444,312 90,436
132,151
503,465 36,778
72,865
940,847 53,658
59, 286
65.10% 59 .30%
44.90%
86.60% 5.40% 7 .90%

4 .10% 391,078 246,236 144,842 37.00% 4.50%
2.40% 225,998 141,486 84,512 37.40% 2.60%
4 .50% 402,363 245,568 156,795 39.00% 4 .60%
1.20% 92,291 73,627 18,664 20.20% 1.10%
3 .90% 339,529 215,072 124,457 36 .70% 3.90%
3.50% 330,668 206,102 124,566 37.70% 3.80%
21 .00% 1,525,274 988,609 536,665 35 .20% 17 .60%
4.10% 356,764 248,857 107,907 30.20% 4.10%
2 .60% 232,040 160,035 72,005 31.00% 2.70%
6 .40% 508,501 331,231 177,270 34.90% 5.90%
12 .50% 1,245,071 804,279 440,792 35.40% 14.30%
4.60% 460,960 309,932 151,028 32.80% 5.30%
2 .50% 229,399 158,806 70,593 30 .80% 2.60%
5.10% 428,323 269,802 158,521 37.00% 4.90%
0.90% 83,063 70,463 12,600 15.20% 1.00%
10.20% 796,094 615,124 180,970 22.70% 9 .20%
1.60% 207,355 138,189 69,166 33.40% 2.40%
2 .50% 262,125 154,518 107,607 41.10% 3.00%
6.40% 571,505 382,861 188,644 33.00% 6.60%
59,768,908 57,613,153 2,155,755 3.60%
Ct all transactions processea. Inrormatlon IS summanzea as I...ategorylvllscellaneous·. I ne 'IVllscellaneous I"roaucts' report toy Site) liStS mese proaucts. t:ngen Will De perrormlng a Site cleanup to ensure