Wood Visions, Berlin, 2001 Wood— the only renewable material ! by Ed Pepke Forest Products...
36
F A O Wood Visions, Berlin, 2001 Wood— the only renewable material ! by Ed Pepke Forest Products Marketing Specialist UNECE & FAO, Geneva
-
Upload
mildred-shavonne-booth -
Category
Documents
-
view
215 -
download
1
Transcript of Wood Visions, Berlin, 2001 Wood— the only renewable material ! by Ed Pepke Forest Products...

FAO Wood Visions, Berlin, 2001
Wood—the only renewable material !
by Ed Pepke
Forest Products Marketing Specialist
UNECE & FAO, Geneva

FAO Wood Visions, Berlin, 2001
Topics of presentation
• Demand: European wood consumption trends and analysis
• Supply: Do we have enough wood to support growing consumption?
• Vision for increasing consumption• Discussion

FAO Wood Visions, Berlin, 2001
Purpose of presentation
• To provide foundation for our conference
• To stimulate thinking and ideas
• To generate discussion

FAO Wood Visions, Berlin, 2001
My challenge to you...
Although I will be presenting historical trends,
do not let the past limit your vision of the future.
In the words of Mr. Thomas Watson, Chairman of IBM in 1943, and a man of vision:

FAO Wood Visions, Berlin, 2001
“I think there is a world market for maybe five
computers.”
--Mr. Thomas Watson,
Chairman of IBM, 1943
(at that time IBM was making punch-card calculators)

FAO Wood Visions, Berlin, 2001
Forest products market segments
• Sawnwood
• Panels
• Roundwood
• Not included: pulp, paper or value-added products

FAO Wood Visions, Berlin, 2001
UN Economic Commission for Europe region
• Europe (focus of this presentation)
• North America
• Commonwealth of Independent States (CIS)
FAO Wood Visions, Berlin, 2001
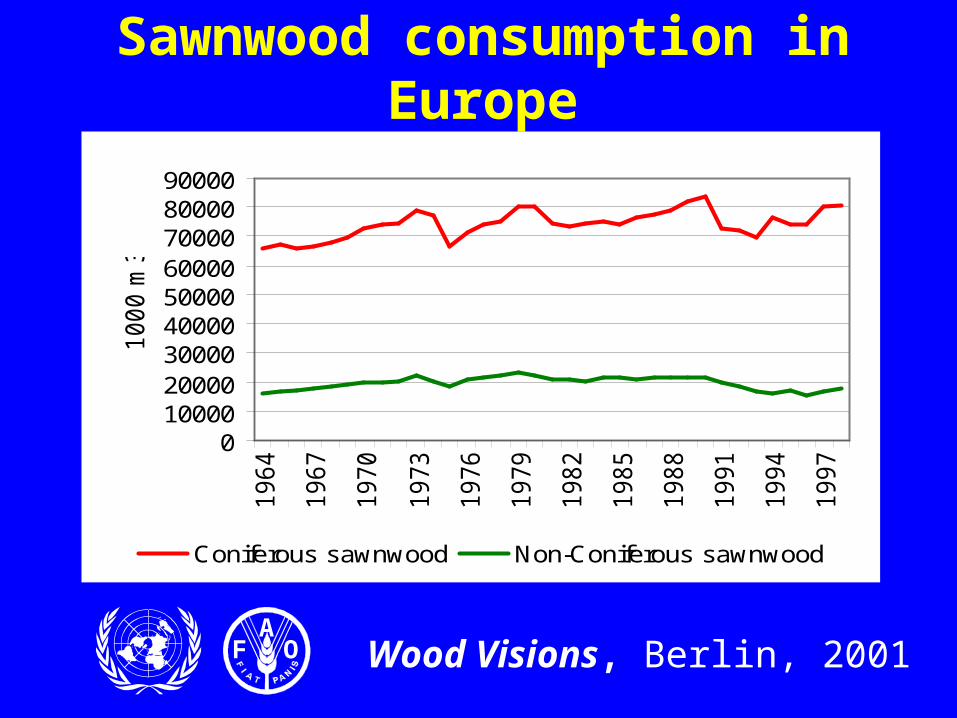
Sawnwood consumption in Europe
0100002000030000400005000060000700008000090000
1964
1967
1970
1973
1976
1979
1982
1985
1988
1991
1994
1997
1000 m
3
Coniferous sawnwood Non-Coniferous sawnwood
FAO Wood Visions, Berlin, 2001
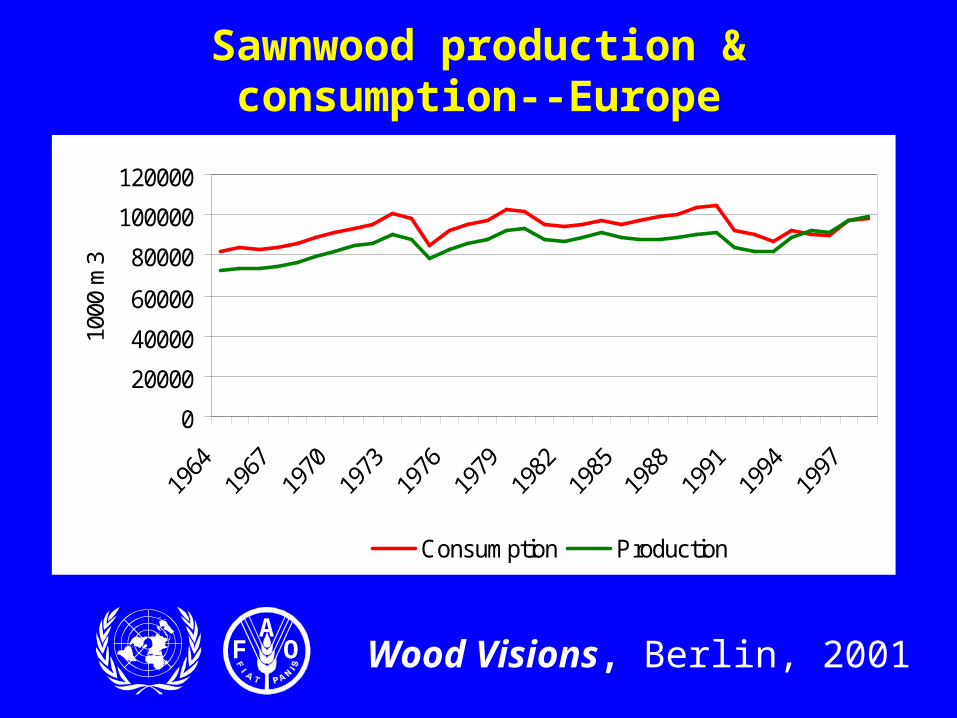
Sawnwood production & consumption--Europe
0
20000
40000
60000
80000
100000
120000
1000
m3
Consumption Production

FAO Wood Visions, Berlin, 2001
Sawnwood production in N. America
0
20000
40000
60000
80000
100000
120000
140000
160000
1964
1967
1970
1973
1976
1979
1982
1985
1988
1991
1994
1997
1000 m
3
Coniferous sawnwood Non-Coniferous sawnwood

FAO Wood Visions, Berlin, 2001
Sawnwood production in CIS
0
20000
40000
60000
80000
100000
120000
1967
1969
1971
1973
1975
1977
1979
1981
1983
1985
1987
1989
1991
1993
1995
1997
1000
m3
Coniferous Non-coniferous

FAO Wood Visions, Berlin, 2001
Sawnwood exports -- Europe
05000
10000150002000025000300003500040000
1964
1967
1970
1973
1976
1979
1982
1985
1988
1991
1994
1997
1000 m
3
Coniferous sawnwood Non-Coniferous sawnwood

FAO Wood Visions, Berlin, 2001
Sawnwood exports -- N. America
0
10000
20000
30000
40000
50000
60000
1 4 7 10 13 16 19 22 25 28 31 34
1000
m3
Coniferous Non-coniferous

FAO Wood Visions, Berlin, 2001
Sawnwood exports -- CIS
0
1000
2000
3000
4000
5000
6000
7000
8000
9000
1964
1967
1970
1973
1976
1979
1982
1985
1988
1991
1994
1997
1000 m
3
Coniferous sawnwood Non-Coniferous sawnwood

FAO Wood Visions, Berlin, 2001
Sawnwood imports -- Europe
0
5000
10000
15000
20000
25000
30000
35000
1964
1967
1970
1973
1976
1979
1982
1985
1988
1991
1994
1997
1000 m
3
Coniferous sawnwood Non-Coniferous sawnwood

FAO Wood Visions, Berlin, 2001
Sawnwood trade -- Europe
0
10000
20000
30000
40000
50000
1000
m3
Exports Imports

FAO Wood Visions, Berlin, 2001
Panels consumption in Europe
0
5000
10000
15000
20000
25000
30000
35000
400001
96
4
19
66
19
68
19
70
19
72
19
74
19
76
19
78
19
80
19
82
19
84
19
86
19
88
19
90
19
92
19
94
19
96
19
98
10
00
m3
Particle board Plywood Fibreboard

FAO Wood Visions, Berlin, 2001
Panels production in N. America
0
5000
10000
15000
20000
25000
30000
1964
1967
1970
1973
1976
1979
1982
1985
1988
1991
1994
1997
1000 m
3
Particle board Plywood Fibreboard

FAO Wood Visions, Berlin, 2001
Panels production in CIS
0
1000
2000
3000
4000
5000
6000
7000
8000
9000
1964
1967
1970
1973
1976
1979
1982
1985
1988
1991
1994
1997
1000 m
3
Particle board Plywood Fibreboard

FAO Wood Visions, Berlin, 2001
Roundwood consumption in Europe
050000
100000150000200000250000300000350000
1000
m3
Industrial roundwood (wood in the rough)
Fuelwood, including wood for charcoal

FAO Wood Visions, Berlin, 2001
Industrial roundwood consumption in Europe
0
50000
100000
150000
200000
1964
1967
1970
1973
1976
1979
1982
1985
1988
1991
1994
1997
1000 m
3
Pulpwood (round & split) Other industrial roundwood
Sawlogs and veneer logs

FAO Wood Visions, Berlin, 2001
Utilization of roundwood in Europe
0
50000100000
150000200000
250000300000
350000400000
450000
1964
1967
1970
1973
1976
1979
1982
1985
1988
1991
1994
1997
1000
m3
equi
vale
nt
Wood pulp Saw nw ood Wood-based panels

FAO Wood Visions, Berlin, 2001
Utilization of roundwood in N. America
0100000200000300000400000500000600000700000800000900000
1964
1967
1970
1973
1976
1979
1982
1985
1988
1991
1994
1997
1000
m3
equi
vale
nt
Wood pulp Sawnwood Wood-based panels

FAO Wood Visions, Berlin, 2001
Utilization of roundwood in CIS
0
50000
100000
150000
200000
250000
300000
1964
1966
1968
1970
1972
1974
1976
1978
1980
1982
1984
1986
1988
1990
1992
1994
1996
1998
1000
m3
equi
vale
nt
Wood pulp Sawnwood Wood-based panels
FAO Wood Visions, Berlin, 2001
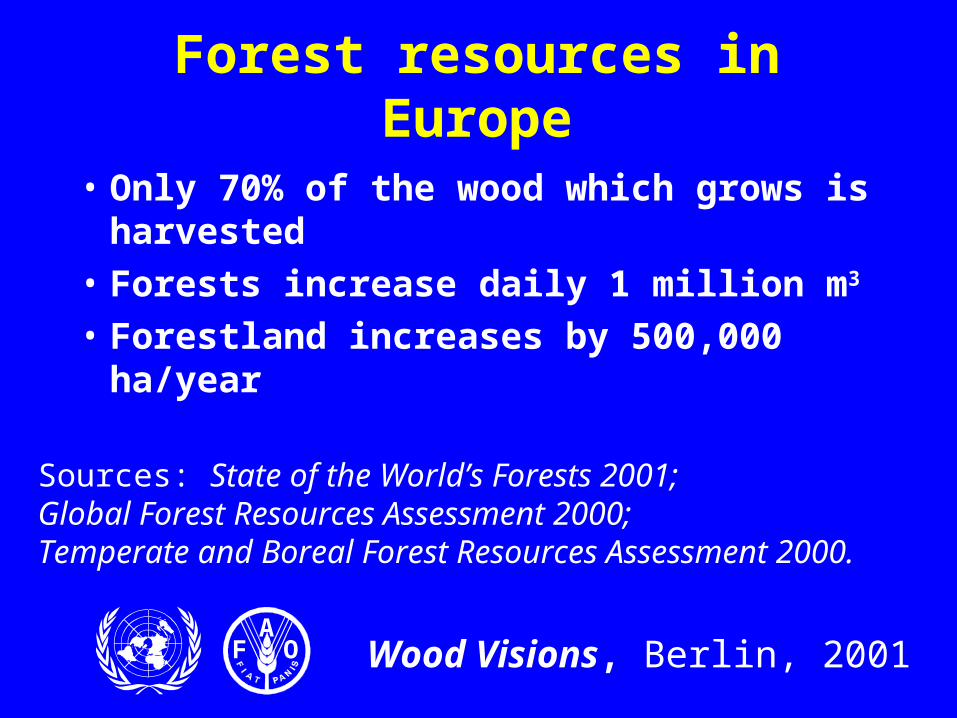
Forest resources in Europe
• Only 70% of the wood which grows is harvested
• Forests increase daily 1 million m3
• Forestland increases by 500,000 ha/year
Sources: State of the World’s Forests 2001; Global Forest Resources Assessment 2000; Temperate and Boreal Forest Resources Assessment 2000.

FAO Wood Visions, Berlin, 2001
Forest resources: growing stock
010000200003000040000500006000070000
Europe(41)
NorthAmerica
CIS
Growing Stock
Net AnnualIncrementFellings
Mil
l ion
m3
Source: TBFRA 2000.

FAO Wood Visions, Berlin, 2001
Forest resources: NAI vs. fellings
0
500
1000
Europe (41) N. America CIS
Net Annual Increment Fellings
Mil
l ion
m3
Source: TBFRA 2000.

FAO Wood Visions, Berlin, 2001
Forest resources: NAI vs. fellings
Fellings as % of NAI
Europe-41 59
EU-15 64
Nordic countries 72
Baltic countries 50
Central & eastern Europe 56
Russia 16
North America 79
Source: TBFRA 2000.

FAO Wood Visions, Berlin, 2001
Forest resources: NAI vs. fellings
Fellings as % of NAI
Russia 16
Poland 53
Germany 55
Austria 67
Sweden, Finland, United States 74-75
Portugal 85
Canada 94
Source: TBFRA 2000.

FAO Wood Visions, Berlin, 2001
Forest resources summary
• Removals considerably below growth• Wide variance in utilisation rates of NAI • Growing stock increasing in Europe• Oversupply compared to demand for
wood• Increasing alternative demands on forests

FAO Wood Visions, Berlin, 2001
Growing too much wood?
Not enough wood products demand?
What are the solutions?

FAO Wood Visions, Berlin, 2001
Grow the wood markets.
• Guarantee that today’s wood products meet consumers’ needs
• Develop new products to meet evolving needs
• Develop new markets for wood products (substitute for non-renewable materials)

FAO Wood Visions, Berlin, 2001
How can we grow the wood markets?
• Through coordinated, international promotion programs• For example, the FAO-ECE Forest Communicators
Network creates a positive image of the forest and forest industries sector by:– networking among members– identifying key common messages and concepts, and– promoting the building of PR capacity.
FAO Wood Visions, Berlin, 2001
How can we grow the wood markets?
• Current network of 120 forest communicators from 29 countries of the UNECE region, representing both governments and the private sector.
• Participation open to all sharing common objectives.
• More information about activities at: http://www.unece.org/trade/timber/pr/pr.htm

FAO Wood Visions, Berlin, 2001
My Wood Visions
• Increasing development of a wood culture in Europe, like that in the Nordic Countries, North America and Japan
• Internationally coordinated promotional programmes
• Forest and forest industry sector working together

FAO Wood Visions, Berlin, 2001
Questions?
Discussion