Wood Pellet Project - US Wood Markets Report - 2011 at 19 Pages
19
Woody Biomass as a Forest Product Wood Supply and Market Implications October 2011 Commissioned by: National Alliance of Forest Owners Washington, D.C. 200011 www.nafoalliance.org Conducted by: Forisk Consulting Athens, GA 30604 www.forisk.com Principal Investigators: Brooks Mendell, Ph.D., [email protected] Amanda Hamsley Lang, [email protected] Tim Sydor, Ph.D., [email protected]
-
Upload
alex-eucare -
Category
Documents
-
view
219 -
download
0
Transcript of Wood Pellet Project - US Wood Markets Report - 2011 at 19 Pages

8/3/2019 Wood Pellet Project - US Wood Markets Report - 2011 at 19 Pages
http://slidepdf.com/reader/full/wood-pellet-project-us-wood-markets-report-2011-at-19-pages 1/19
Woody Biomass as a Forest Product
Wood Supply and Market Implications
October 2011
Commissioned by:
National Alliance of Forest Owners
Washington, D.C. 200011
www.nafoalliance.org
Conducted by:
Forisk Consulting
Athens, GA 30604
www.forisk.com
Principal Investigators:
Brooks Mendell, Ph.D., [email protected]
Amanda Hamsley Lang, [email protected]
Tim Sydor, Ph.D., [email protected]

8/3/2019 Wood Pellet Project - US Wood Markets Report - 2011 at 19 Pages
http://slidepdf.com/reader/full/wood-pellet-project-us-wood-markets-report-2011-at-19-pages 2/19
1
Executive Summary
This report explores potential wood market impacts from increased use of woody biomass to produce
energy. The United States has an established forest products industry that uses wood to produce widely-used consumer products, such as paper and packaging, and building materials, including oriented strand
board (OSB), plywood, and lumber. One concern raised in policy debates is that increased demand of
woody biomass for energy will cause changes in forest management that will reduce forest extent and
availability for existing uses, public benefits and environmental gains. Another concern is that increased
use of wood for energy will affect wood prices and forest management strategies for wood raw
materials for established industries, including paper and building products.
To address potential supply and market impacts from increased use of wood for energy, Forisk
Consulting examines how the current forest industry evolved over time and the impact of new market
entrants on market dynamics. For example, from 1999 to 2009, paper and paperboard productiondeclined by 19% as the digital age and falling economy reduced paper consumption. As the paper
industry declined, however, another industry expanded: OSB and particleboard, which uses the same
type of raw materials as pulp and paper mills. Increases in wood use by OSB plants in the 2000s
partially offset decreased wood use by the pulp and paper sector.
Total forest growing stock on timberlands has been increasing in the United States. Despite historic
timber market expansion for paper and lumber markets in the 1990s and the growth of a new industry
(OSB), the forest products industry did not deplete raw material supplies. In fact, the overall volume in
the forest has increased. For example, total forest growth net of removals increased by 101% from
1986 –
2006 in the South. Softwood growth net of removals on private timberlands in the South
increased by 97% from 2006-2009. Recent increases in net growth in the South are due primarily to
declining markets for forest products since 2005.
The estimates of aggregate raw material availability from the Billion Ton Update published recently by
the Department of Energy are more than sufficient to meet estimated demand from bioenergy in
2021/2022, without including any conventional pulpwood. However, project-specific assessments
continue to rely on localized analysis of wood supplies, wood demand, raw material prices, and relevant
wood bioenergy projects.
The Billion Ton Update estimates that sufficient volumes of woody biomass supplies will be available
at low (<$20 per green ton) price levels. This makes it unlikely that foreseeable bioenergy demand will
displace conventional pulpwood markets on a large scale. There is insufficient evidence to suggest a
regional or national shift in pulpwood markets, especially given the modest outlook for the pulp and
paper sector for the next 10 years. Given the expected lower levels of wood use by the pulp and paper
sector, some portion of the pulpwood supply will likely be available for bioenergy uses, assuming
sufficiently robust market prices.
8/3/2019 Wood Pellet Project - US Wood Markets Report - 2011 at 19 Pages
http://slidepdf.com/reader/full/wood-pellet-project-us-wood-markets-report-2011-at-19-pages 3/19
2
Forisk Consulting also conducted an analysis to determine how much woody biomass markets in the
South must evolve to affect landowner decisions with respect to harvest rotations. Forecasted pine
pulpwood prices in the South in 2016 would have to increase from $11.47 per ton to higher than chip-
n-saw prices of $17.09 per ton for landowners to be economically indifferent between a pulpwood-
dominated forest and a sawtimber-dominated forest. Across the South, bioenergy demand would have
to increase 435% by 2016, from an expected 22 million green tons a year to 120 million green tons per
year, for pine pulpwood prices to reach $17.09/ton. This level of bioenergy demand in the region by
2016 is extremely unlikely. In comparison, the forest industry in the South consumed 103.3 million green
tons of pulpwood in 2010. Biomass energy wood use will have to be high enough for a sustained period
to maintain high pine pulpwood prices to cause a shift in landowner behavior. At the same time,
competing higher-valued product prices would have to remain at prices low enough to incent switching
from pulpwood to sawtimber rotations. Once established, these prices would have to remain
economically feasible for over 23 years to incent multiple pulpwood rotations on the same property.
Overall, the analysis suggests that a significant shift from sawtimber to pulpwood rotations in the
South is highly improbable.
About Forisk Consulting
Forisk provides research and educational services to executives and analysts making decisions related to
timber REITs, timberlands, and wood-using energy and manufacturing facilities. Forisk specializes in
understanding and quantifying local wood and timber markets throughout the United States.
About the National Alliance of Forest Owners (NAFO)
NAFO is an organization of private forest owners committed to advancing federal policies that promote
the economic and environmental values of privately-owned forests at the national level. NAFO
membership encompasses more than 80 million acres of private forestland in 47 states. Working forests
in the U.S. support 2.5 million jobs.
8/3/2019 Wood Pellet Project - US Wood Markets Report - 2011 at 19 Pages
http://slidepdf.com/reader/full/wood-pellet-project-us-wood-markets-report-2011-at-19-pages 4/19
3
Introduction and Purpose
High gasoline prices, legislation to regulate greenhouse gas (GHG) emissions from fossil fuels, and
national security concerns from importing US petroleum supplies motivate interest in domestic
renewable energy. According to the US Energy Information Administration (EIA) in 2010, renewable
energy accounts for around 8% of total US energy use, just below that provided by nuclear energy
facilities in 2009. Biomass, defined as organic matter derived from living or previously living organisms,
is one source of renewable energy. Woody material, food waste, agricultural residues, and crops such as
corn all qualify as biomass. This report explores potential wood market impacts from increased use of
woody biomass to produce energy.
The United States has an established forest products industry that uses wood to produce widely-used
consumer products, such as paper and packaging, and building materials, including oriented strand
board (OSB), plywood, and lumber. One concern raised in policy debates is that increased demand of
woody biomass for energy will cause changes in forest management that will reduce forest extent and
availability for existing uses and public benefits, including environmental gains. Another concern is that
increased use of wood for energy will affect wood prices and forest management strategies for wood
raw materials for established industries, including paper and building products. We address these
concerns in this paper. We begin with an introduction of bioenergy markets and potential wood use. We
also review current wood using industries to set the stage for a discussion of wood supplies and
potential market effects of biomass use.
Developing bioenergy end-markets in the United States include electricity, pellets, and liquid fuels.
Forisk Consulting began tracking bioenergy projects in 2008. Since that time, the media has been
overwhelmed with announcements of new bioenergy projects, and in recent months, press coverage of project failures. Forisk uses a two-part screening methodology to estimate projects that are likely to
succeed. Projects in the most likely case have a technology that is proven at commercial scale and have
met multiple project development milestones. Screening of operating and announced bioenergy
projects in the US highlight the relatively modest, overall impact expected in nation-wide wood demand.
Total announced demand for wood bioenergy projects as of August 2011 approximates 134 million
green tons by 2021 (Figure 1), while likely demand approaches 70 million green tons.
Developing biomass projects often state that their primary feedstocks will be by-products of forestry
operations. These include logging residues, mill residues, land-clearing debris from residential
developments, and tree trimmings from parks and street trees. Most of these resources are deemed“underutilized”; they have no primary purpose and are often left in the woods, burned or disposed at
landfills at cost. Despite these claims, some in the forest industry are concerned that emerging biomass
facilities will use the same wood that pulp and paper mills use to make paper products. Mill residues are
already used to make pulp, paper, and particleboard in many areas. Also, distribution systems for
logging residues or urban tree waste at a large scale vary by location.

8/3/2019 Wood Pellet Project - US Wood Markets Report - 2011 at 19 Pages
http://slidepdf.com/reader/full/wood-pellet-project-us-wood-markets-report-2011-at-19-pages 5/19
4
Figure 1. Total Announced versus Screened (Expected) Demand from Wood Using Bioenergy Projects
in the United States, 2011-2021
Source: Wood Bioenergy US, August 2011 Issue
Existing wood industries use two primary categories of forest products as raw materials: pulpwood and
sawtimber. Paper producers and OSB producers use pulpwood, the lower-valued category of timber
product from small diameter (6-9 inches) and/or low quality trees. Lumber and plywood manufacturers
use sawtimber, a timber product from large diameter, superior quality trees (12-14 inches of diameter
and up) to make building materials. An intermediate product, chip-n-saw, is from mid-sized trees (9-13
inches in diameter) and is used to make small dimension lumber and chips for fuel or paper production.
A rectangular piece is cut from the center of a chip-n-saw log for lumber while the outer slabs are
chipped.
Bioenergy projects primarily target mill and forest residues, debris and other byproducts. Some projects
also target low value trees from forest thinnings or pulpwood material as a feedstock.
Wood Markets and Timber Supplies
The US forest products industry: 50 years of change
To address potential supply and market impacts from increased use of wood for energy, we look at how
the current forest industry evolved over the past 50 years. Critical shifts have occurred. For example, in
1964, the paper industry produced 39.4 million tons of paper and paperboard (Figure 2). Production
soared until 1999 when it peaked at 97.7 million tons, more than doubling production in 35 years. Then
the industry began to contract. From 1999 to 2009, paper and paperboard production declined by 19%
to 79.4 million tons as the digital age and falling economy reduced paper consumption. As the paper
Electricity
Pellet
Liquid Fuels
-
20
40
60
80
100
120
140
160
M i l l i o n G r e e n T o n s o f W o o d
Expected Demand from all projects

8/3/2019 Wood Pellet Project - US Wood Markets Report - 2011 at 19 Pages
http://slidepdf.com/reader/full/wood-pellet-project-us-wood-markets-report-2011-at-19-pages 6/19
5
industry declined, however, another industry expanded: OSB and particleboard, which uses the same
type of raw materials as pulp and paper mills. OSB and particleboard provided a lower-cost substitute
for plywood as a building product. Production increased in the 1990s and 2000s to peak in 2006 at 22.3
million cubic meters of OSB/particleboard production (Figure 3). Increases in wood use by OSB plants in
the 2000s partially offset decreased wood use by the pulp and paper sector.
Figure 2. US Paper and Paperboard Production
Source: FAO
Figure 3. US Particleboard and OSB Production
Source: FAO
Lumber markets have also changed over the past 50 years. Housing starts effectively drive lumber
production (Figures 4 and 5); the timing and strength of the lumber market recovery depends directly on
the recovery of housing starts. From 1991 to 2005, housing starts doubled from 1.0 million to 2.0
million. Lumber production followed suit with housing starts: from 1991 to 2005, lumber production
0
20
40
60
80
100
120
M i l l i o n t o n s o f p a p e r a n d p a p e r b o a r d
0
5
10
15
20
25
M i l l i o n m 3 o f p a r t i c l e b o a r d a n d O S B

8/3/2019 Wood Pellet Project - US Wood Markets Report - 2011 at 19 Pages
http://slidepdf.com/reader/full/wood-pellet-project-us-wood-markets-report-2011-at-19-pages 7/19
6
increased by 19%. When housing markets fell after 2005 so did lumber production; US softwood lumber
production declined by nearly 40% from 2005 to 2010.
Figure 4. Housing starts in US (annual rate)
Source: US Census
Figure 5. US Softwood Lumber Production1
Source: FAO
Timber supplies are sufficient and continue to growTotal forest growing stock on timberlands has been increasing in the United States. Forest growing
stock refers to the inventory of standing trees of merchantable size in a forest. While total growing stock
1 Detailed analysis of hardwood was omitted due to the lack of comparable historic data on hardwood demand by
region. For reference, in 2010, total US lumber production totaled 34.5 billion board feet. Hardwood lumber
production was 9.6 billion board feet, or 28% of US lumber production in 2010.
0.0
0.5
1.0
1.5
2.0
2.5
1
9 6 1
1
9 6 3
1
9 6 5
1
9 6 7
1
9 6 9
1
9 7 1
1
9 7 3
1
9 7 5
1
9 7 7
1
9 7 9
1
9 8 1
1
9 8 3
1
9 8 5
1
9 8 7
1
9 8 9
1
9 9 1
1
9 9 3
1
9 9 5
1
9 9 7
1
9 9 9
2
0 0 1
2
0 0 3
2
0 0 5
2
0 0 7
2
0 0 9
M i l l i o n U n i t s
0
10
20
30
40
50
60
70
80
M i l l i o n m 3 o f l u m b e r
8/3/2019 Wood Pellet Project - US Wood Markets Report - 2011 at 19 Pages
http://slidepdf.com/reader/full/wood-pellet-project-us-wood-markets-report-2011-at-19-pages 8/19
7
is a measure of all of the forest volume, forest managers do not consider all of it available for use. The
forest growing stock, or inventory, is equivalent to the principal associated with capital investments.
The forest is an endowment which produces annual wood flows for use.
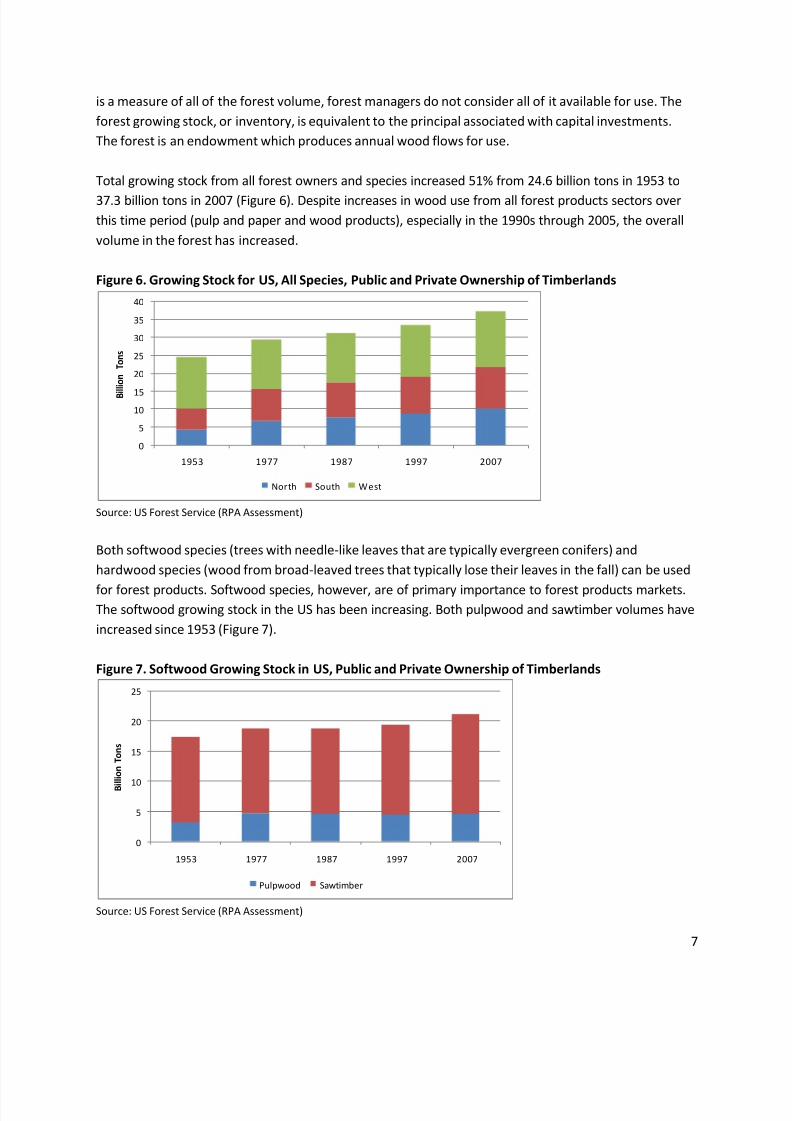
Total growing stock from all forest owners and species increased 51% from 24.6 billion tons in 1953 to
37.3 billion tons in 2007 (Figure 6). Despite increases in wood use from all forest products sectors over
this time period (pulp and paper and wood products), especially in the 1990s through 2005, the overall
volume in the forest has increased.
Figure 6. Growing Stock for US, All Species, Public and Private Ownership of Timberlands
Source: US Forest Service (RPA Assessment)
Both softwood species (trees with needle-like leaves that are typically evergreen conifers) and
hardwood species (wood from broad-leaved trees that typically lose their leaves in the fall) can be used
for forest products. Softwood species, however, are of primary importance to forest products markets.The softwood growing stock in the US has been increasing. Both pulpwood and sawtimber volumes have
increased since 1953 (Figure 7).
Figure 7. Softwood Growing Stock in US, Public and Private Ownership of Timberlands
Source: US Forest Service (RPA Assessment)
0
5
10
15
20
25
30
35
40
1953 1977 1987 1997 2007
B i
l l i o n
T o n s
North South West
0
5
10
15
20
25
1953 1977 1987 1997 2007
B i l l i o n T o n s
Pulpwood Sawtimber

8/3/2019 Wood Pellet Project - US Wood Markets Report - 2011 at 19 Pages
http://slidepdf.com/reader/full/wood-pellet-project-us-wood-markets-report-2011-at-19-pages 9/19
8
The maximum, potential forest supplies are indicated by the annual growth of the forest since the
previous year. Forest removals are the volumes harvested each year. Forest growth net of removals
gives an idea of how removals compare to supplies. Forest growth net of removals has been positive in
the US but has varied by region over time (Figure 8). Net growth by region has fluctuated over time
based on market dynamics and, in some cases, public policy (e.g., federal land management,
Conservation Reserve Program). In all cases aggregate net growth of all species and ownerships over
time has remained positive.
Figure 8. US Forest Growth Net of Removals, All Species, Public and Private Ownership of Timberlands
Source: US Forest Service (RPA Assessment)
In the 1990s paper and paperboard production reached its highest levels, OSB production was high and
increasing, and lumber production was rising. It was a time of high demand for forest products. The
Conservation Reserve Program (CRP), a federal program which helped incentivize conservation through
tree planting and other practices, took hold in the 1980s and led to additional forest supplies in the late
1990s and 2000s. In addition, changes in forest management strategies and improved growth from
forest plantations accelerated forest growth on industrial and institutional lands. Net growth continued
to increase as forest products markets started a downward trend in 2005, and by 2006 forest growth net
removals was at a record 448 million tons in the US.
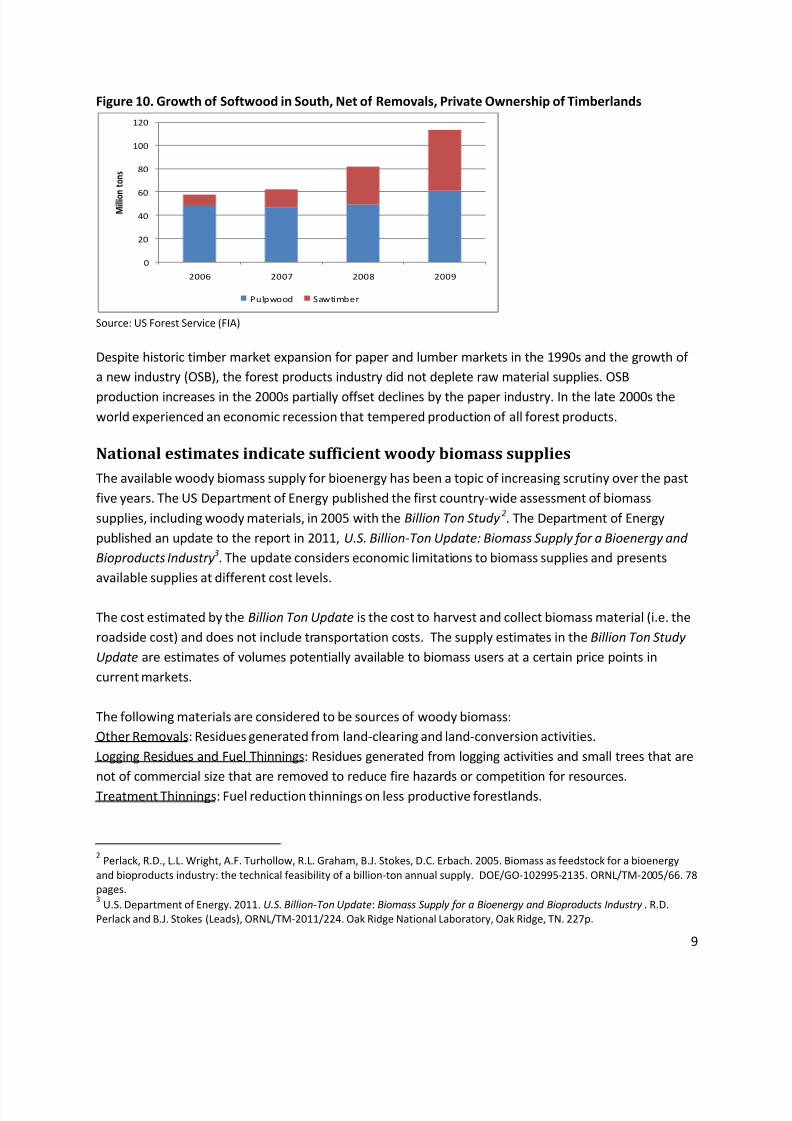
US South: Recent trend of increasing timber supplies
We focus on the South for a closer look at trends over the past five years. Even with low net growth
levels in the South in the mid-1990s, softwood growing stock on private timberlands increased steadily
since 1991, and has shown overall increases in volume from 1975 to 2009 of 21%. Growth of softwood
on private timberlands net of removals has been positive and increasing from 2006-2009 (Figure 10).
Total softwood growth net of removals on private timberlands in the South increased by 97% from
2006-2009. Recent increases in net growth in the South are due primarily to declining markets for
forest products since 2005.
0
50
100
150
200
250
300
350
400
450
500
1976 1986 1996 2006
M i l l i o n T o n s
North South West
8/3/2019 Wood Pellet Project - US Wood Markets Report - 2011 at 19 Pages
http://slidepdf.com/reader/full/wood-pellet-project-us-wood-markets-report-2011-at-19-pages 10/19
9
Figure 10. Growth of Softwood in South, Net of Removals, Private Ownership of Timberlands
Source: US Forest Service (FIA)
Despite historic timber market expansion for paper and lumber markets in the 1990s and the growth of
a new industry (OSB), the forest products industry did not deplete raw material supplies. OSB
production increases in the 2000s partially offset declines by the paper industry. In the late 2000s the
world experienced an economic recession that tempered production of all forest products.
National estimates indicate sufficient woody biomass supplies
The available woody biomass supply for bioenergy has been a topic of increasing scrutiny over the past
five years. The US Department of Energy published the first country-wide assessment of biomass
supplies, including woody materials, in 2005 with the Billion Ton Study 2. The Department of Energy
published an update to the report in 2011, U.S. Billion-Ton Update: Biomass Supply for a Bioenergy and
Bioproducts Industry 3. The update considers economic limitations to biomass supplies and presents
available supplies at different cost levels.
The cost estimated by the Billion Ton Update is the cost to harvest and collect biomass material (i.e. the
roadside cost) and does not include transportation costs. The supply estimates in the Billion Ton Study
Update are estimates of volumes potentially available to biomass users at a certain price points in
current markets.
The following materials are considered to be sources of woody biomass:
Other Removals: Residues generated from land-clearing and land-conversion activities.
Logging Residues and Fuel Thinnings: Residues generated from logging activities and small trees that are
not of commercial size that are removed to reduce fire hazards or competition for resources.
Treatment Thinnings: Fuel reduction thinnings on less productive forestlands.
2 Perlack, R.D., L.L. Wright, A.F. Turhollow, R.L. Graham, B.J. Stokes, D.C. Erbach. 2005. Biomass as feedstock for a bioenergy
and bioproducts industry: the technical feasibility of a billion-ton annual supply. DOE/GO-102995-2135. ORNL/TM-2005/66. 78
pages. 3 U.S. Department of Energy. 2011. U.S. Billion-Ton Update: Biomass Supply for a Bioenergy and Bioproducts Industry . R.D.
Perlack and B.J. Stokes (Leads), ORNL/TM-2011/224. Oak Ridge National Laboratory, Oak Ridge, TN. 227p.
0
20
40
60
80
100
120
2006 2007 2008 2009
M i l l i o
n t o n s
Pulpwood Sawtimber
8/3/2019 Wood Pellet Project - US Wood Markets Report - 2011 at 19 Pages
http://slidepdf.com/reader/full/wood-pellet-project-us-wood-markets-report-2011-at-19-pages 11/19
10
Unused Mill Residue: Residues produced during mill manufacturing operations that are not used for
higher value products.
Urban Wood Waste: Yard and tree trimmings, containers and packaging, and construction and
demolition debris.
Conventional Pulpwood: Wood that has a commercial value as pulpwood but is used as an energy
feedstock because of competitive market conditions.
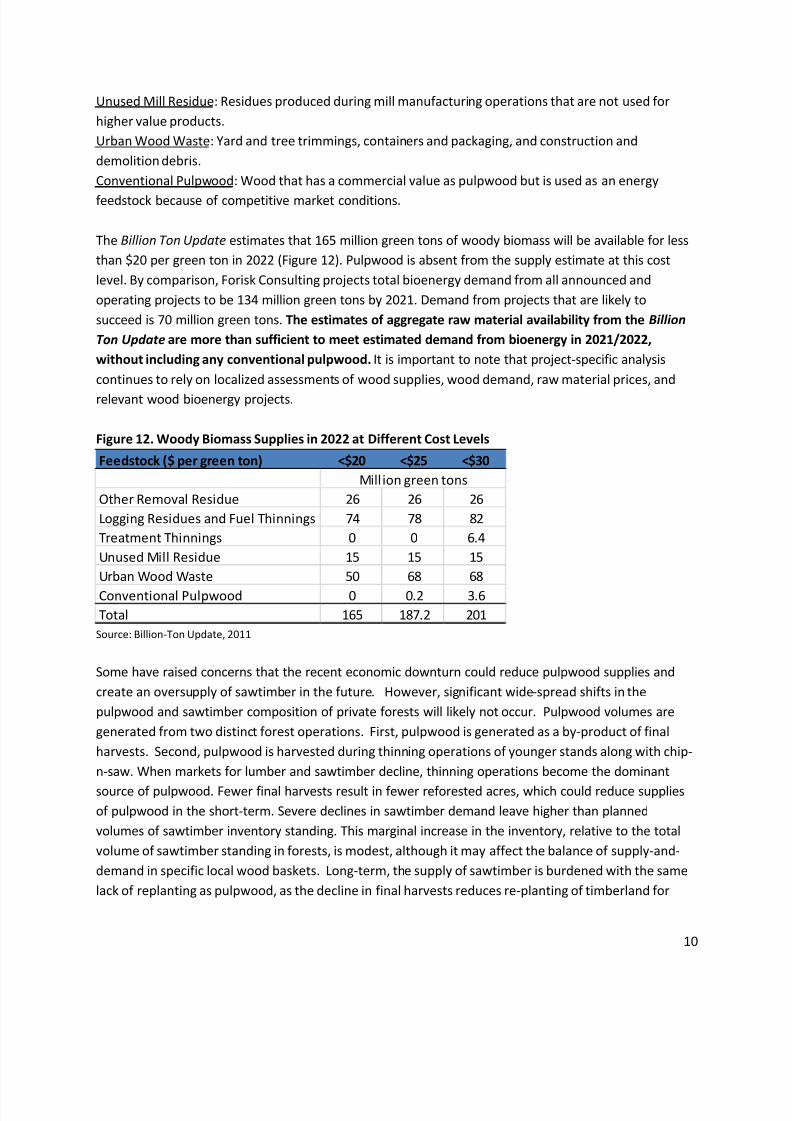
The Billion Ton Update estimates that 165 million green tons of woody biomass will be available for less
than $20 per green ton in 2022 (Figure 12). Pulpwood is absent from the supply estimate at this cost
level. By comparison, Forisk Consulting projects total bioenergy demand from all announced and
operating projects to be 134 million green tons by 2021. Demand from projects that are likely to
succeed is 70 million green tons. The estimates of aggregate raw material availability from the Billion
Ton Update are more than sufficient to meet estimated demand from bioenergy in 2021/2022,
without including any conventional pulpwood. It is important to note that project-specific analysis
continues to rely on localized assessments of wood supplies, wood demand, raw material prices, and
relevant wood bioenergy projects.
Figure 12. Woody Biomass Supplies in 2022 at Different Cost Levels
Source: Billion-Ton Update, 2011
Some have raised concerns that the recent economic downturn could reduce pulpwood supplies and
create an oversupply of sawtimber in the future. However, significant wide-spread shifts in the
pulpwood and sawtimber composition of private forests will likely not occur. Pulpwood volumes are
generated from two distinct forest operations. First, pulpwood is generated as a by-product of final
harvests. Second, pulpwood is harvested during thinning operations of younger stands along with chip-
n-saw. When markets for lumber and sawtimber decline, thinning operations become the dominant
source of pulpwood. Fewer final harvests result in fewer reforested acres, which could reduce supplies
of pulpwood in the short-term. Severe declines in sawtimber demand leave higher than planned
volumes of sawtimber inventory standing. This marginal increase in the inventory, relative to the total
volume of sawtimber standing in forests, is modest, although it may affect the balance of supply-and-
demand in specific local wood baskets. Long-term, the supply of sawtimber is burdened with the same
lack of replanting as pulpwood, as the decline in final harvests reduces re-planting of timberland for
Feedstock ($ per green ton) <$20 <$25 <$30
Other Removal Residue 26 26 26
Logging Residues and Fuel Thinnings 74 78 82
Treatment Thinnings 0 0 6.4
Unused Mill Residue 15 15 15
Urban Wood Waste 50 68 68
Conventional Pulpwood 0 0.2 3.6
Total 165 187.2 201
Mill ion green tons
8/3/2019 Wood Pellet Project - US Wood Markets Report - 2011 at 19 Pages
http://slidepdf.com/reader/full/wood-pellet-project-us-wood-markets-report-2011-at-19-pages 12/19
11
future harvests. While unlikely to have sweeping market effects for the country, supply and demand
impacts on the local level could occur.
In short, data and analysis project both robust wood raw material demand from traditional forest
industry manufacturers and the potential to satisfy demand from viable wood bioenergy applications.
Local raw material availability and pricing will be dictated by local market conditions.
Displacement of Current Wood Markets
Large-scale displacement of current wood markets for pulpwood and
sawtimber is extremely unlikely
Forest owner responses to market changes are always of interest to forest economists, wood using mills
and timberland investors. Previous research finds that timber markets gradually achieve or return to
market equilibriums by adjusting to changes in prices, supplies, rotation ages and harvest levels 4.
Forestland owners consistently make decisions with respect to long-term economics and appear to not
feel compelled or obligated to satisfy third-party targets (i.e. for energy production or to sell wood to
new bioenergy plants) unless the economics make sense. In a white paper commissioned by NAFO,
Clutter et al. (2010), revisit this research to model forest owner behavior in light of evolving bioenergy
markets and conclude “…landowner responses clearly increase supply and decrease raw materials costs
in the long-run…”5
The Billion Ton Update estimates that sufficient volumes of woody biomass supplies will be available
at low (<$20 per green ton) price levels. This makes it unlikely that foreseeable bioenergy demand will
displace conventional pulpwood markets on a large scale. As pulpwood has an existing market,
bioenergy users will compete with pulp and paper mills for pulpwood-sized raw materials based on
price. Bioenergy project developers typically prefer to purchase waste material with few or no markets
than compete with an existing industry in the marketplace. Some projects, however, require clean
material with a traceable supply chain. These projects will compete with local forest industry mills and
could impact pulpwood prices in local markets. Despite these localized effects, there is a lack of
evidence to suggest a regional or national shift in pulpwood markets, especially given the modest
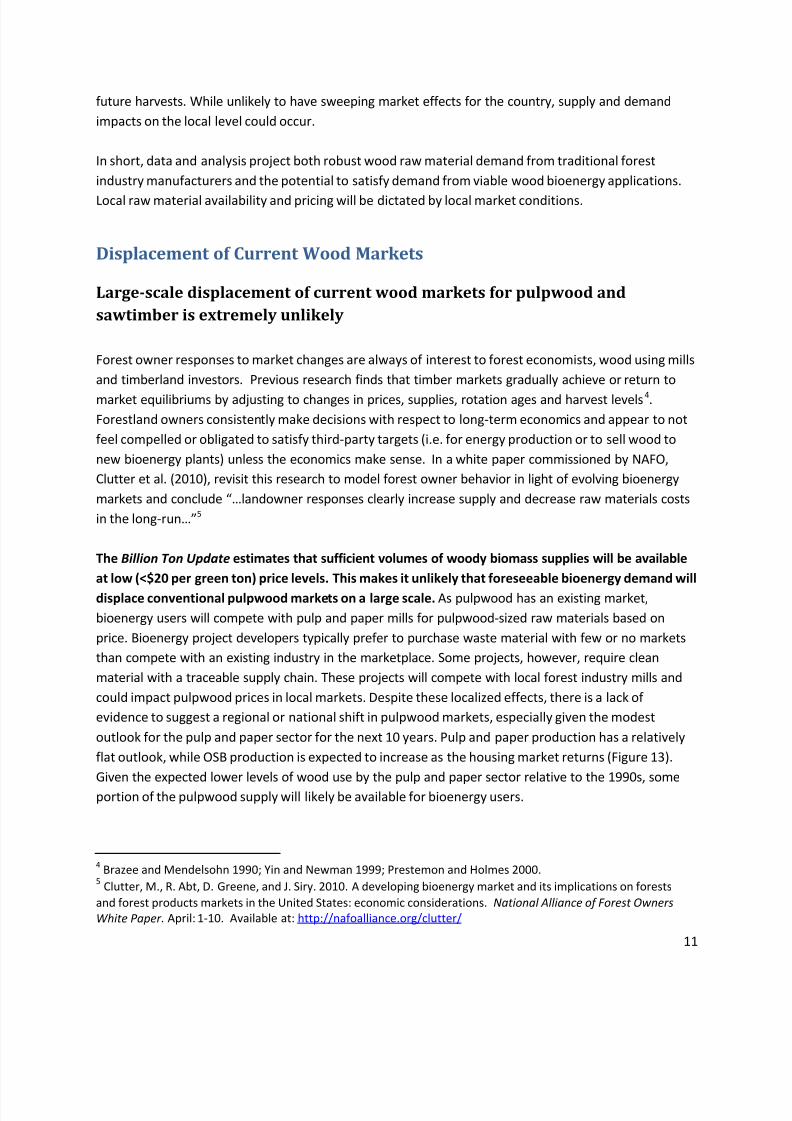
outlook for the pulp and paper sector for the next 10 years. Pulp and paper production has a relatively
flat outlook, while OSB production is expected to increase as the housing market returns (Figure 13).
Given the expected lower levels of wood use by the pulp and paper sector relative to the 1990s, some
portion of the pulpwood supply will likely be available for bioenergy users.
4Brazee and Mendelsohn 1990; Yin and Newman 1999; Prestemon and Holmes 2000.
5 Clutter, M., R. Abt, D. Greene, and J. Siry. 2010. A developing bioenergy market and its implications on forests
and forest products markets in the United States: economic considerations. National Alliance of Forest Owners
White Paper . April: 1-10. Available at: http://nafoalliance.org/clutter/
8/3/2019 Wood Pellet Project - US Wood Markets Report - 2011 at 19 Pages
http://slidepdf.com/reader/full/wood-pellet-project-us-wood-markets-report-2011-at-19-pages 13/19
12
Forisk Consulting conducted an analysis to determine how much woody biomass markets in the South
must evolve to affect landowner decisions with respect to harvesting and rotations. Forisk used a two-
step approach and specific scenarios to answer this question. First, we estimated a South-wide average
pine pulpwood price at which landowners are economically indifferent between managing for
sawtimber and managing for pulpwood. Second, we estimated the wood volume for bioenergy markets
required to raise the pine pulpwood price to this level. A detailed description of the methods is in
Appendix A.
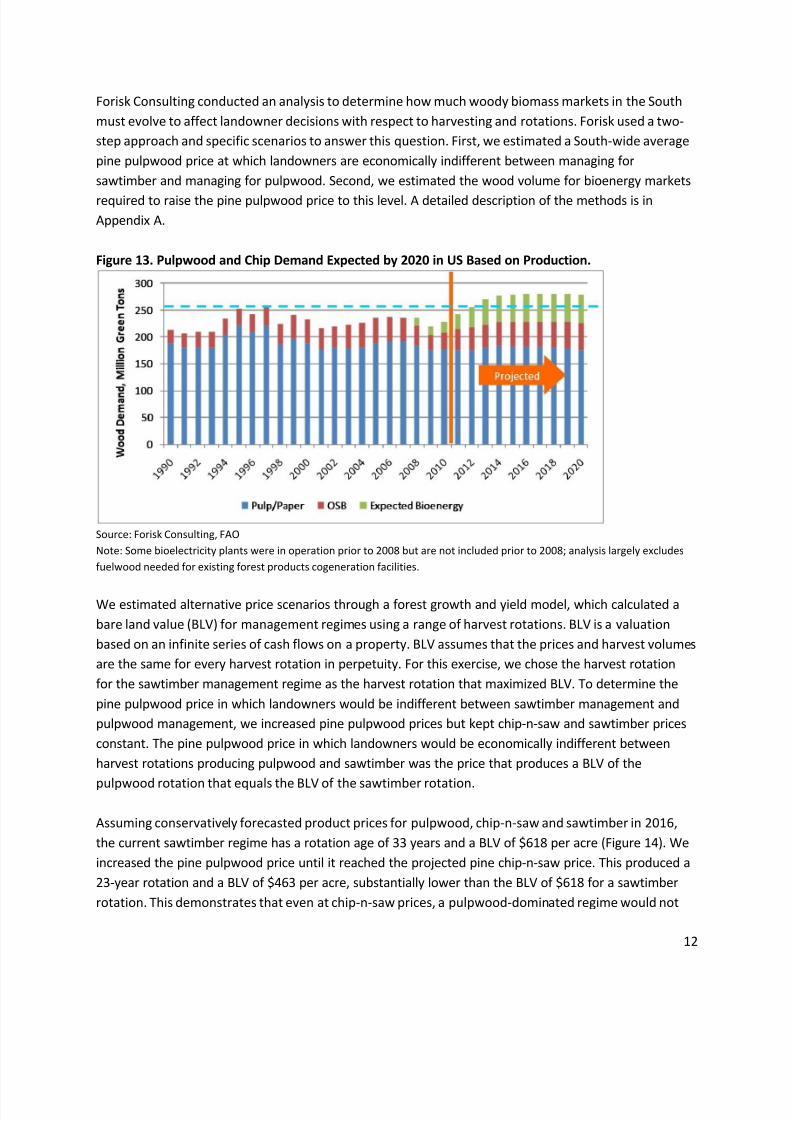
Figure 13. Pulpwood and Chip Demand Expected by 2020 in US Based on Production.
Source: Forisk Consulting, FAO
Note: Some bioelectricity plants were in operation prior to 2008 but are not included prior to 2008; analysis largely excludes
fuelwood needed for existing forest products cogeneration facilities.
We estimated alternative price scenarios through a forest growth and yield model, which calculated a
bare land value (BLV) for management regimes using a range of harvest rotations. BLV is a valuation
based on an infinite series of cash flows on a property. BLV assumes that the prices and harvest volumes
are the same for every harvest rotation in perpetuity. For this exercise, we chose the harvest rotation
for the sawtimber management regime as the harvest rotation that maximized BLV. To determine the
pine pulpwood price in which landowners would be indifferent between sawtimber management and
pulpwood management, we increased pine pulpwood prices but kept chip-n-saw and sawtimber prices
constant. The pine pulpwood price in which landowners would be economically indifferent between
harvest rotations producing pulpwood and sawtimber was the price that produces a BLV of the
pulpwood rotation that equals the BLV of the sawtimber rotation.
Assuming conservatively forecasted product prices for pulpwood, chip-n-saw and sawtimber in 2016,
the current sawtimber regime has a rotation age of 33 years and a BLV of $618 per acre (Figure 14). We
increased the pine pulpwood price until it reached the projected pine chip-n-saw price. This produced a
23-year rotation and a BLV of $463 per acre, substantially lower than the BLV of $618 for a sawtimber
rotation. This demonstrates that even at chip-n-saw prices, a pulpwood-dominated regime would not

8/3/2019 Wood Pellet Project - US Wood Markets Report - 2011 at 19 Pages
http://slidepdf.com/reader/full/wood-pellet-project-us-wood-markets-report-2011-at-19-pages 14/19
13
return the same value per acre as the traditional sawtimber regime. Pulpwood prices must exceed chip-
n-saw prices in 2016 for landowners to be economically indifferent between pulpwood and sawtimber
harvest rotations. Forecasted pine pulpwood prices in the South in 2016 would have to increase from
$11.47 per ton to higher than $17.09 per ton for landowners to be economically indifferent between a
pulpwood-dominated forest and a sawtimber-dominated forest.
Figure 14. Scenario 1: PST vs. PPW Break-Even Scenario
Forisk’s forecasted pine pulpwood price in 2016 is $11.47 per ton, but landowners require more than
$17.09 per ton to change management regimes, assuming all other factors and conditions remain
constant. To determine the market pull needed to reach even a $17.09 per ton pulpwood price, we
examined the volume of bioenergy demand needed to reach this price.
Across the South, bioenergy demand would have to increase 435% by 2016, from an expected 22 million
green tons a year to 120 million green tons per year6, for pine pulpwood prices to reach $17.09/ton. This
level of bioenergy demand in the region by 2016 is extremely unlikely. In comparison, the forest industry
in the South consumed 103.3 million green tons of pulpwood in 2010. Overall, the analysis suggests
that a significant shift from sawtimber to pulpwood rotations in the South is highly improbable.
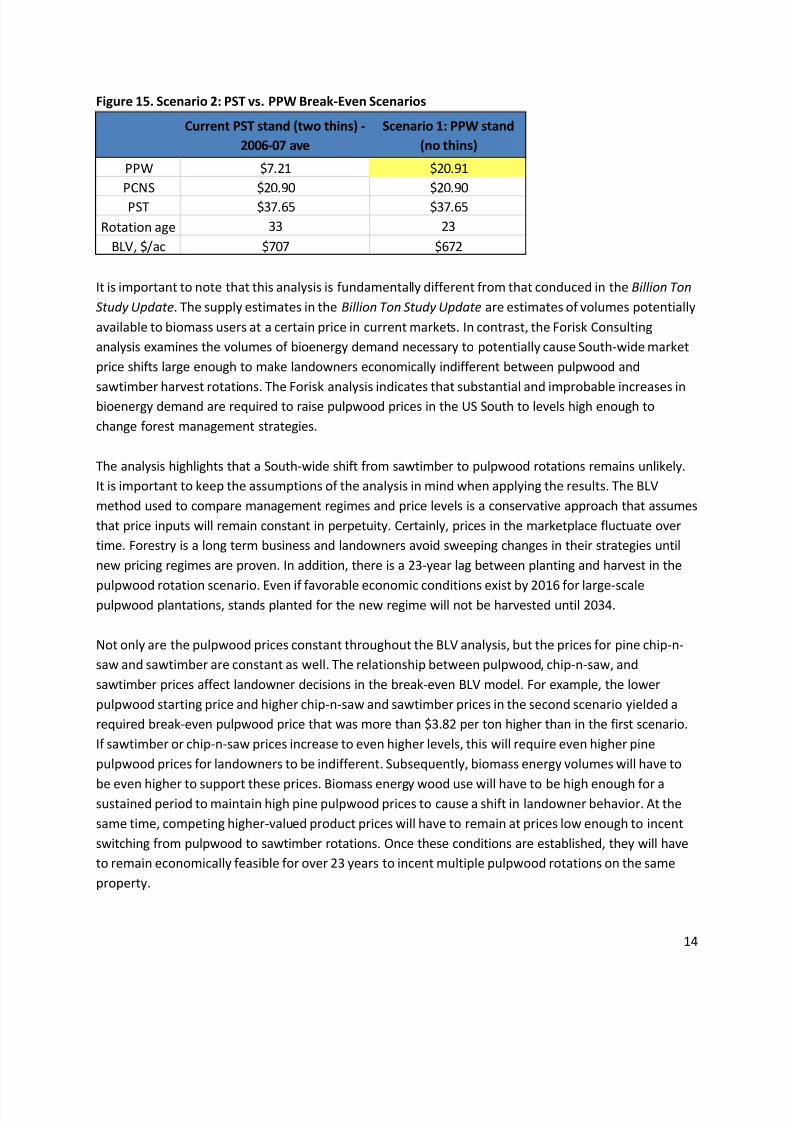
Next, we modeled a price scenario to represent pre-recession product prices for pulpwood, chip-n-saw,
and sawtimber. We used average prices from 2006-2007 for the South as inputs. In this scenario, the
current sawtimber regime has a rotation age of 33 years with a BLV of $707 per acre (Figure 15). Again,
the pulpwood price needs to be higher than the chip-n-saw price for the BLV of the two regimes to
match. Even with pulpwood prices at $20.91 per ton, the pine pulpwood rotation yields a lower value
per acre than the traditional sawtimber rotation. Compared with average prices from 2006-2007,
pulpwood prices would have to exceed $20.91 per ton for landowners to be economically indifferent
between a pulpwood-dominated forest and a sawtimber-dominated forest.
South-wide, likely bioenergy demand for pulpwood would have to increase 669%, from 22 million green
tons per year to 173 million green tons per year, to potentially raise the average pine pulpwood price to
a minimum of $20.91 per ton. This outcome is even more improbable than the outcome in the first
scenario.
6The wood volumes in the forest management analysis are volumes of roundwood or chips from the forest. The
estimates do not include wood volumes from mill residues or urban sources.
PST stand (two
thins) - 2016
Scenario 1: PPW stand
(no thins)
PPW $11.47 $17.09
PCNS $17.09 $17.09
PST $30.79 $30.79
Rotation age 33 23
BLV, $/ac $618 $463
8/3/2019 Wood Pellet Project - US Wood Markets Report - 2011 at 19 Pages
http://slidepdf.com/reader/full/wood-pellet-project-us-wood-markets-report-2011-at-19-pages 15/19
14
Figure 15. Scenario 2: PST vs. PPW Break-Even Scenarios
It is important to note that this analysis is fundamentally different from that conduced in the Billion Ton
Study Update. The supply estimates in the Billion Ton Study Update are estimates of volumes potentially
available to biomass users at a certain price in current markets. In contrast, the Forisk Consulting
analysis examines the volumes of bioenergy demand necessary to potentially cause South-wide market
price shifts large enough to make landowners economically indifferent between pulpwood and
sawtimber harvest rotations. The Forisk analysis indicates that substantial and improbable increases inbioenergy demand are required to raise pulpwood prices in the US South to levels high enough to
change forest management strategies.
The analysis highlights that a South-wide shift from sawtimber to pulpwood rotations remains unlikely.
It is important to keep the assumptions of the analysis in mind when applying the results. The BLV
method used to compare management regimes and price levels is a conservative approach that assumes
that price inputs will remain constant in perpetuity. Certainly, prices in the marketplace fluctuate over
time. Forestry is a long term business and landowners avoid sweeping changes in their strategies until
new pricing regimes are proven. In addition, there is a 23-year lag between planting and harvest in the
pulpwood rotation scenario. Even if favorable economic conditions exist by 2016 for large-scalepulpwood plantations, stands planted for the new regime will not be harvested until 2034.
Not only are the pulpwood prices constant throughout the BLV analysis, but the prices for pine chip-n-
saw and sawtimber are constant as well. The relationship between pulpwood, chip-n-saw, and
sawtimber prices affect landowner decisions in the break-even BLV model. For example, the lower
pulpwood starting price and higher chip-n-saw and sawtimber prices in the second scenario yielded a
required break-even pulpwood price that was more than $3.82 per ton higher than in the first scenario.
If sawtimber or chip-n-saw prices increase to even higher levels, this will require even higher pine
pulpwood prices for landowners to be indifferent. Subsequently, biomass energy volumes will have to
be even higher to support these prices. Biomass energy wood use will have to be high enough for asustained period to maintain high pine pulpwood prices to cause a shift in landowner behavior. At the
same time, competing higher-valued product prices will have to remain at prices low enough to incent
switching from pulpwood to sawtimber rotations. Once these conditions are established, they will have
to remain economically feasible for over 23 years to incent multiple pulpwood rotations on the same
property.
Current PST stand (two thins) -
2006-07 ave
Scenario 1: PPW stand
(no thins)
PPW $7.21 $20.91
PCNS $20.90 $20.90
PST $37.65 $37.65
Rotation age 33 23
BLV, $/ac $707 $672

8/3/2019 Wood Pellet Project - US Wood Markets Report - 2011 at 19 Pages
http://slidepdf.com/reader/full/wood-pellet-project-us-wood-markets-report-2011-at-19-pages 16/19
15
Glossary
BF, board foot: unit of volume to measure lumber in US and Canada; 1 foot wide x 1foot long x 1 inch
thick.
Cellulosic ethanol: ethanol produced from cellulose, the structural component of the cell walls of plants.
Tree material contains cellulose.
Chips: small pieces of wood used for fuel or to make pulp or certain engineered wood products. Chips
are produced either as a residual by-product from wood waste in sawmills or plywood mils, or produced
from pulpwood at pulp mills or chip mills specifically for the purpose of pulp or other manufacturing
processes.
Chip-n-saw: timber product from mid-sized trees (9-13 inches at DBH) that makes small dimension
lumber and chips for fuel or paper production. A rectangular piece is cut from the center of a chip-n-sawlog for lumber while the outer slabs are chipped.
DBH, diameter at breast height: diameter of a tree 4.5 feet above the ground. Commonly used as a
measure of tree size.
Growing stock: existing trees growing for timber production; specifically cubic foot volume in trees five
inches DBH or larger from a one foot stump to a four inch top diameter.
Hardwood: wood from broad-leaved or angiosperm trees that typically lose their leaves in the fall in
temperate zones. Oak (Quercus), ash (Fraxinus), elm (Ulmus), and maple ( Acer ) are examples of
hardwoods.
Logging residues: unused portions of growing-stock trees cut or killed by tree harvesting activities
(logging) and left in the woods.
Lumber: wood products sawn to a standard thickness by cutting a log on two or four sides. In North
America, softwood lumber is classified as boards, dimension, or timbers based on thickness categories.
Boards are lumber less than 2 inches in nominal thickness; dimension is material 2 to 5 inches thick, and
timbers are pieces 5 inches or thicker.
OSB, oriented strand board: a type of engineered structural panel made from low-value wood raw
material; strands, or long chips, of wood are glued together in a specific orientation to form panels. OSB
is used in construction and directly competes with plywood.
Pulpwood: timber product from small diameter (6-9 inches DBH) and/or low quality trees used for fuel
or paper production.
Renewable Portfolio Standard (RPS): state-level mandates that require a certain percentage of
electricity generated in a state to be from renewable sources.

8/3/2019 Wood Pellet Project - US Wood Markets Report - 2011 at 19 Pages
http://slidepdf.com/reader/full/wood-pellet-project-us-wood-markets-report-2011-at-19-pages 17/19
16
Residues: bark and woody materials that are generated in primary wood-using mills when roundwood
products converted to other forest products. Examples of residues include edgings, sawdust, shavings
and pulp screenings. Also includes bark residues and wood residues (both coarse and fine materials),
but excludes logging residues.
Roundwood: a segment of a felled tree of no particular length that has a round cross-section. The term
usually refers to raw material cut logs or tree-length logs being delivered to a forest products mill.
Sawtimber: timber product from large diameter trees (12-14 inches at DBH and up) of good quality used
to make lumber.
Softwood: wood from gymnosperms, trees with needle-like leaves that are typically evergreen conifers.
Pine (Pinus), spruce (Picea), and hemlock (Tsuga) are softwoods.
Starts, housing starts: the number of residential houses that undergo initial construction over some
time period. A start in construction is the start of foundation excavation.
Structural panel: a building material made from layers of veneer (plywood) or layers of glued wood
strips (OSB).
Stumpage: value of standing trees “on the stump”; price of the trees that a landowner receives from a
timber sale.
Timberland: forestland that is growing or can grow trees at a rate of twenty cubic feet per acre per year
for industrial use.
Thinning: the harvesting of a designated number or density of trees in a stand to improve stand health
and to give the remaining, higher potential trees the opportunity for additional growth.
Tops: wood of a tree above the merchantable height. It includes the usable material in the uppermost
stem.

8/3/2019 Wood Pellet Project - US Wood Markets Report - 2011 at 19 Pages
http://slidepdf.com/reader/full/wood-pellet-project-us-wood-markets-report-2011-at-19-pages 18/19
17
Appendix A: Methodology for Pine Pulpwood Break-Even Analysis
Step 1: Determine a South-wide average pine pulpwood break-even price, a price at which
landowners are economically indifferent between a sawtimber rotation and a pulpwood rotation.
To determine a break-even pine pulpwood stumpage price for Southern timberland owners, we
calculated break-even investment returns from an example of a current pine sawtimber-driven rotation
and an alternative pine pulpwood rotation. Two management regimes for Loblolly Pine in the South
were assessed:
The current management regime (a sawtimber strategy) has two thinnings (at ages 16 and age
23), is an average Loblolly pine plantation in the South, and has a site index of 65.
The alternative rotation (a pulpwood strategy) is modeled on the same stand as the current
management scenario in South with a site index of 65. The alternative rotation has no thinnings
and is a pulpwood-heavy rotation.
We modeled two price scenarios to examine the effects of different starting markets:
Scenario 1: starting assumptions (i.e. current regime) for prices were from the Forisk stumpage
price forecasts for pine pulpwood and sawtimber. Starting prices were assumed to be the prices
in the forecasts in the year 2016 for the South.
Scenario 2: designed to represent “normal” markets, or pre-recession market prices for
sawtimber and other products. Pine chip-n-saw and sawtimber prices were assumed to be
constant for the current regime and alternative scenario. The starting assumptions (i.e. current
regime) for prices were the average prices for sawtimber, chip-n-saw, and pulpwood from
Timber Mart-South for 2006-2007 for the South.
We estimated alternative price scenarios through a forest growth and yield model , which calculated a
bare land value (BLV) for management regimes using a range of harvest rotations. A BLV is a valuation
based on an infinite series of cash flows on a property. BLV assumes that the prices and harvest volumes
are the same for every harvest rotation in perpetuity. For this exercise, we chose the harvest rotation
for the current sawtimber management regime as the harvest rotation that maximized BLV. To
determine the break-even pine pulpwood price, we increased pine pulpwood prices keeping chip-n-saw
and sawtimber prices constant. The break-even pine pulpwood price was the price that maximized the
BLV of the pulpwood rotation at a BLV equal to that of the sawtimber rotation.
Step 2: Estimate the wood volume for bioenergy markets required to raise the pine pulpwood price tothe break-even level.
To determine the additional volume required to raise the pulpwood price to the break-even price, we
used the break-even price as a price ceiling in the Forisk Forecast pine pulpwood model. The portion of
the projected pulpwood demand expected to come from the bioenergy sector is then increased to reach
the ceiling pine pulpwood stumpage price. Forisk assesses emerging bioenergy projects using

8/3/2019 Wood Pellet Project - US Wood Markets Report - 2011 at 19 Pages
http://slidepdf.com/reader/full/wood-pellet-project-us-wood-markets-report-2011-at-19-pages 19/19
18
technological viability and project milestones as criteria. The volume of bioenergy wood use in the price
forecast model needed to raise the price to the pulpwood break-even point is assumed to come from
projects that pass Forisk’s screening criteria.