Wood Energy in New Hampshire - SUNY ESF Energy in New Hampshire Sarah Smith UNH Cooperative...
22
Wood Energy in New Hampshire Sarah Smith UNH Cooperative Extension NH Division of Forests and Lands 210 Nesmith Hall, 131 Main Street Durham, NH (603) 862-2647 [email protected]
Transcript of Wood Energy in New Hampshire - SUNY ESF Energy in New Hampshire Sarah Smith UNH Cooperative...

Wood Energy in
New HampshireSarah Smith
UNH Cooperative ExtensionNH Division of Forests and Lands210 Nesmith Hall, 131 Main Street
Durham, NH(603) 862-2647

NH is 84% Forested

Trend of Forest Land Cover in New Hampshire1600-2005
0102030405060708090
100
16001800
18201840
18601880
19001920
19401960
19802000
Tot
al L
a nd
Source: UNH Cooperative Extension

Number of Harvests per County
County 2000 2001 2002 2003 2004Belknap 244 218 213 192 202Carroll 436 338 349 322 372Cheshire 355 290 321 306 339Coos 379 313 313 314 367Grafton 667 612 533 521 597Hillsboro 497 424 378 375 377Merrimack 571 555 484 441 494Rockingham 262 296 248 207 251Strafford 172 146 112 113 145Sullivan 264 229 258 265 283Total 3847 3421 3209 3056 3427
Source: NH Dept. of Revenue Administration
Note: These numbers reflect # of harvest not the size. For example a timber harvest in Coos County may be 10,000 acres and one in Strafford County. 20 acres.

Hardwood Pulp20%
Whole Tree Chips 30%
Fuel Wood 5%
High Grade Wood 35%
Softwood Pulp 10%
Products from the Forest
Source: NH Division of Forests and Lands

4/’05 – 3/’06 Harvest Information
County Harvest # Whole Tree Chips Pulpwood Fuelwood SawlogsTons Tons Tons 1000 board ft.
Belknap 202 48,872 37,795 2,457 10,815Carroll 372 72,542 100,156 2,609 19,980Cheshire 339 49,529 60,179 8,247 23,240Coos 367 125,757 503,534 4,980 47,535Grafton 597 170,425 190,079 5,985 33,982Hillsboro 377 117,150 42,970 8,334 27,051Merrimack 494 142,571 69,653 6,882 31,413Rockingham 251 60,823 24,429 5,137 12,437Strafford 145 38,871 17,474 3,486 9,413Sullivan 283 35,890 30,413 3,907 13,717 Totals 3427 862,430 1,076,682 52,024 229,583
Information source: NH Division of Forests and Lands

New Hampshire Lumber ProductionHistory
Source: NH Division of Forests and Landsand USDA, Forest Service
0
100
200
300
400
500
600
700
800
MM
BF
1907 1932 1952 1960 1972 1982 1995 2000 2001 2002 2003 2004 2005 2006# of mills - - 500 175 100 128 100 95 85 75 70 65 60 60

• Roundwood (firewood)• Pellets (from sawdust, paper or chips)• Chips
- whole tree from the woods- bole chips from the woods or chipping plants- pulp quality chip from sawmill or chipping plant- chips from other sources of clean wood – pallets
Wood Fuel Supply

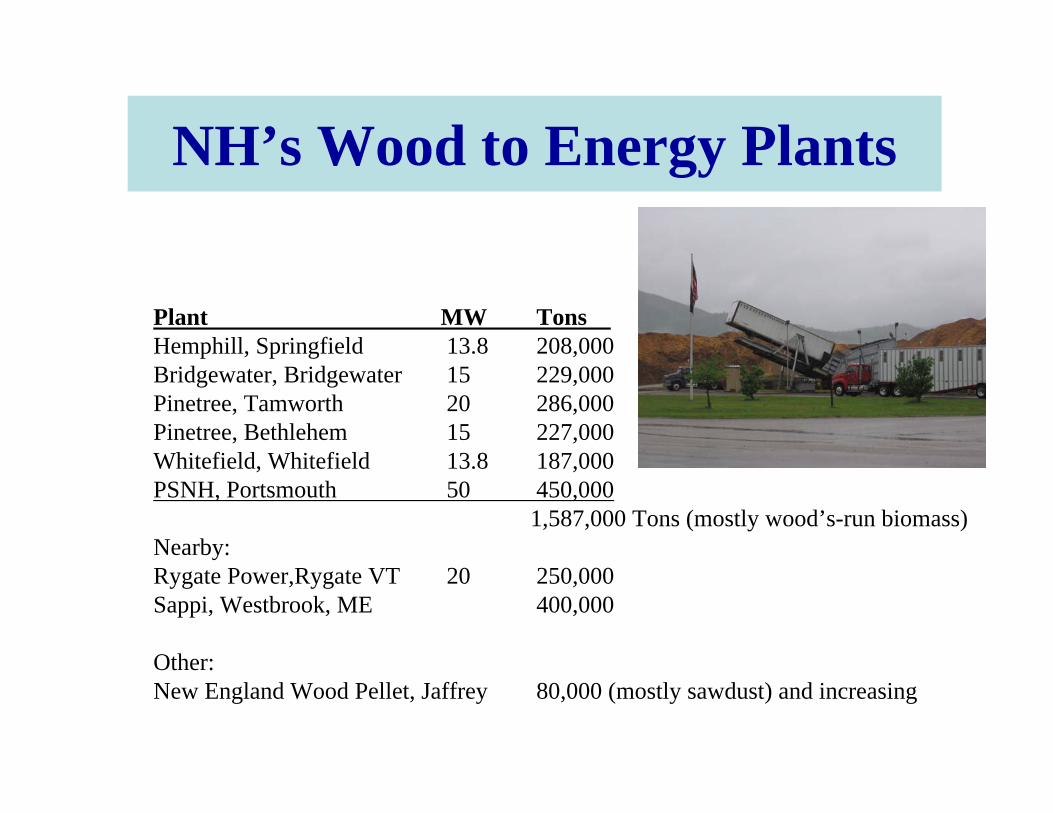
Plant MW Tons Hemphill, Springfield 13.8 208,000Bridgewater, Bridgewater 15 229,000Pinetree, Tamworth 20 286,000 Pinetree, Bethlehem 15 227,000Whitefield, Whitefield 13.8 187,000PSNH, Portsmouth 50 450,000
1,587,000 Tons (mostly wood’s-run biomass)Nearby:Rygate Power,Rygate VT 20 250,000Sappi, Westbrook, ME 400,000
Other:New England Wood Pellet, Jaffrey 80,000 (mostly sawdust) and increasing
NH’s Wood to Energy Plants

NH Wood Energy Plants – Smaller, heat onlyCrotched Mountain, Greenfield, NH 12MMBtu, Messersmith


WOOD FUEL COMPARISON:
Best Applications for Woodchips
• Larger facilities
• Where fuel cost savings are very important
• Larger schools (more than 40,000 sq. ft.)
• Where there is room for: new boiler room, fuel storage bin, tractor-trailer access
• In/near forested areas with an active forest products industry

Hanover High School187,000 sq. ft.$63,000 savings
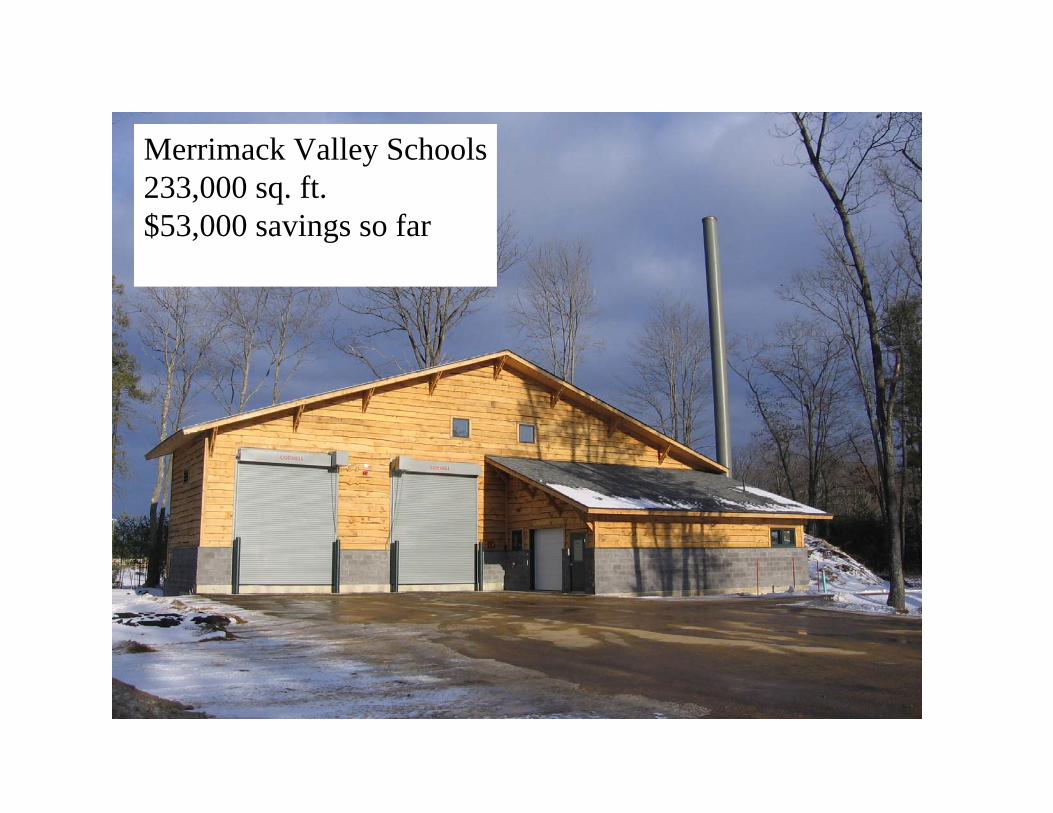
Merrimack Valley Schools233,000 sq. ft.$53,000 savings so far


Typical Messersmithinstallation at theMerrimack ValleySchools, Penacook
5 Million Btu Boiler

NH Audubon Center, ConcordTarm wood pellet system


Characteristics• Uniform shape and size• Dry (4-6% moisture) • Energy dense (7,750 Btu/lb, 6%
moisture)
Pricing• Per ton• Plus delivery charge
Availability• Bulk suppliers in Massachusetts
and New Hampshire
Wood Pellets

WOOD FUEL COMPARISON:
Best Applications for Wood Pellets
• Residential use (stoves & central heat)
• Small commercial facilities
• Small schools (under 40,000 sq. ft.)
• Locations with limited space
• Sites not far from a pellet plant

Wood Energy in
New HampshireSarah Smith
UNH Cooperative ExtensionNH Division of Forests and Lands210 Nesmith Hall, 131 Main Street
Durham, NH(603) 862-2647