Women’s Reservation and India’s National Rural …€™s Reservation and India’s National...
40
Women’s Reservation and India’s National Rural Employment Guarantee Scheme Nayana Bose * Shreyasee Das † September 17, 2014 (Preliminary Draft. Please do not cite) Abstract This paper examines the efficiency of public works implementation when a government has a seat reserved for female candidates versus those that are not. Since 1993, one third of the local governments in India(Panchayats) have been randomly restricted to fielding only woman candidates. We use detailed information on employment and public works expenditure under the Indian National Rural Employment Guarantee Act (NREGA) from 2010 to 2013 for 5987 Panchayats in 9 districts in the state of Uttar Pradesh and combine this with information on local level electoral information. Exploiting the randomized assignment of female candidate reservations, we find that demand for work and women’s labor force participation significantly increase in Panchayats with women leaders. However, we find no significant effects on the type of work. Thus, although we find some evidence of a role-model effect, we find no evidence of better public works distribution under female leaders. JEL Codes : H50, I38, J16, J78, O2, P16 Keywords : Affirmative Action, NREGA, Public Works, Women * Department of Economics, Washington & Lee University, TN 37240, Email: [email protected] † University of Wisconsin-Whitewater, Department of Economics, 4401 Hyland Hall, 800 W. Main Street, Whitewater, WI - 53190, Email: [email protected] We are grateful to Kathryn Anderson, William J. Collins, and Federico Gutierrez for helpful discussions and comments. We also thank Abhishek Das for help with data. Any errors or omissions are our own. 1
Transcript of Women’s Reservation and India’s National Rural …€™s Reservation and India’s National...

Women’s Reservation and India’s National Rural Employment
Guarantee Scheme
Nayana Bose∗ Shreyasee Das†
September 17, 2014
(Preliminary Draft. Please do not cite)
Abstract
This paper examines the efficiency of public works implementation when a government
has a seat reserved for female candidates versus those that are not. Since 1993, one third
of the local governments in India(Panchayats) have been randomly restricted to fielding
only woman candidates. We use detailed information on employment and public works
expenditure under the Indian National Rural Employment Guarantee Act (NREGA) from
2010 to 2013 for 5987 Panchayats in 9 districts in the state of Uttar Pradesh and combine
this with information on local level electoral information. Exploiting the randomized
assignment of female candidate reservations, we find that demand for work and women’s
labor force participation significantly increase in Panchayats with women leaders. However,
we find no significant effects on the type of work. Thus, although we find some evidence
of a role-model effect, we find no evidence of better public works distribution under female
leaders.
JEL Codes : H50, I38, J16, J78, O2, P16
Keywords : Affirmative Action, NREGA, Public Works, Women
∗Department of Economics, Washington & Lee University, TN 37240, Email: [email protected]†University of Wisconsin-Whitewater, Department of Economics, 4401 Hyland Hall, 800 W. Main Street,
Whitewater, WI - 53190, Email: [email protected] are grateful to Kathryn Anderson, William J. Collins, and Federico Gutierrez for helpful discussions andcomments. We also thank Abhishek Das for help with data. Any errors or omissions are our own.
1

1 Introduction
Policymakers in the developing world, quite often, argue for the need to increase quotas
(reservations) for historically disadvantaged and underrepresented groups in the local govern-
ment. The notion behind this is that filling up these seats will help in a targeted distribution
of welfare programs and motivates the intended groups to increase their participation in the
political process. Furthermore, World Bank (2001) finds evidence that when women par-
take in government activities, there is an augmentation of performance of the government,
especially in the context of public works distribution. The 73rd Amendment to the Indian
Constitution allows for decentralized government at the local level by instituting Gram Pan-
chayats (village councils) to better serve the needs of the voters. More importantly, it allows
for a randomized assignment of quotas for women in these councils to increase their political
participation.1 We use this constitutionally mandated feature to examine the performance
of the Indian National Rural Employment Guarantee Act of 2005 (NREGA) under female
leadership. NREGA is a rights based, demand driven, works program that allows every adult
member of a rural household a minimum of 100 days of labor in one of the many prescribed
works listed under the Act. We further examine at whether having a female leader in a given
Panchayat has any bearing on the types of work taken up, especially those that are thought
to be of direct benefit to women (such as rural drinking water, sanitation and water bodies).
Having a female leader in the government can impact public works distribution through
two mechanisms. One channel is through a role-model effect that a woman leader could
provide to the rest of the female population in the villages. Women can be inspired by the
female leader and hence take up more work or increase attendance to schools (Beaman et al.
2012). Quotas at the level of the local government, may help reduce statistical discrimination
against women regarding their ability to lead (Beaman et al.2009). This discrimination arises
because the electorate has more information about men and their abilities, and therefore the
preference is for male leaders. By having a woman in a leadership position, she can have a role
1Details of the methodology of this reservation is provided in the Background Section.
2
model effect and encourage women in her Panchayat to participate in the labor force (Duflo,
2005, Iyer et al. 2012). Women leaders may also empathize with issues that directly affect
women and public spending on projects may reflect these concerns (Beaman et al. 2012). On
the other hand, these quotas could have the opposite effect. They may be counterproductive
because the forced presence of women in a position of power challenges social norms and can
create a backlash against women. Women in villages, usually inexperienced at politics, could
just be figureheads to fill up these seats and a certain amount of capture-cum-clientelism
takes place(Bardhan et al. 2010). They find that having women leaders, surprisingly, reduces
welfare of Scheduled Caste households in villages and has no significant impact on targeted
distribution of public works. This is also evidenced in Ban & Rao (2008) who find no evidence
of political decentralization, reservations and distribution of public works program in four
states of India. Thus, it is theoretically ambiguous as to how reservations for women in the
government can affect public works programs.
Since the advent of NREGA in 2005-06, Uttar Pradesh has had unfavorable reviews with
respect to the implementation of NREGA. A quick ranking of the success of the program
in 25 states in India puts Uttar Pradesh in the bottom (Farooquee, 2013).2 Agarwal (2012)
blames the lack of audits and misallocation of funds to the problems the state is facing in
terms of NREGA performance. Since these studies look at the overall performance of the
state3, we try to examine the workings of NREGA at the local level. We attempt to do
this by examining the effectiveness of the program (at the Panchayat level) by looking at
Panchayats that was reserved for women versus those that weren’t. The Program website
provides Panchayat level employment information from 2010 to 2013 with details on number
of days worked by sex and caste, expenditures on the different categories of public works
undertaken for a particular year, and the number of completed and ongoing works in various
categories. Data on the Panchayats that are reserved for women in the state of Uttar Pradesh
2The author uses five different parameters to order the states with respect to their performance underNREGA, and Uttar Pradesh consistently ranks last.
3A few articles have looked at the Panchayat level, but not to the extent that this paper provides. To ourknowledge, we are the first paper that tries to teach the Panchayat organization and NREGA performance
3

is obtained from Thad Dunning’s website. The website contains data for 24,666 panchayats
collected from the State Election Commission website for the 2010 Panchayat Elections and
contains vital statistics from the 2001 Census. Since Panchayat elections are conducted
every five years, the Program website information for until the 2013 can be used to study
the impact of female leadership on women’s participation under NREGA.
Before we conduct our main analysis, we establish the exogeneity of the randomness
of Panchayat selection to provide reservations for women during election cycles. Then,
in order to analyze whether women leaders are as effective as their male counterparts,
who are more likely to have greater experience and have more concern about reelection,
we study the number of public works that are either ongoing or completed in reserved
Panchayats. We do this by estimating a simple OLS regression where the dependent
variable is NREGA works and the independent variable is whether a Panchayat was
reserved in 2010 or not. We try to get at the role model effect in terms of increased
women’s participation and if women do indeed target public works to help their own
groups. In rural India 36 % of women who are mainly engaged in domestic activity
bring water from outside the house. So, public works that reduce the time and effort of
bringing water from outside is especially beneficial for women. By focusing on expenditures
under NREGA on water works, we analyze the impact of reservation of Panchayat seats
for women on women’s utility in the village by improving the welfare of the median
female voter. We find evidence of increased demand for work, job cards issued and
number of work days that women take up. However, our analysis finds no evidence of
improvements in water works, irrigation works, rural connectivity or drought proofing works.
The rest of the paper is organized in the following manner. Section 2 provides the
background information about NREGA and also a literature review of what has been done
so far. Section 3 elaborates the empirical strategy we employ, Section 4 talks about the data.
We elaborate on the results in Section 5 and finally conclude in Section 6.
4

2 Related Literature and Background
2.1 Political Representation for Women in India
In 1993, India introduced an affirmative action program for women by using a quota sys-
tem that mandated political representation of women in rural areas. The 73rd Amendment to
the Indian constitution officially recognized the existence of local governments.4 These local
government bodies are known as Gram Panchayats(GP). However, to uphold the democratic
process of selecting the Panchayat leader, the Amendment requires an election to be held
every five years where everyone in the Panchayat is to participate in the voting process of
selecting the council. The council consists of members who were either fielded by political
parties or independents. The leader of the Panchayat, or the Pradhan, is then chosen from
this council. The only caveat is that the members officially belong to the local area. Overall,
there are 3 tiers of local government. The village level or the Gram Panchayat, consists is
formed of a group of villages (between 5 to 15 villages) to ensure that each GP has around
10,000 people. The other two levels of local government are at the Block and District level.
Figure 1 provides a visual of the different levels of government in India.
Since council members of the Panchayat are in close proximity to the village popula-
tion, they are constantly aware of the needs of villagers and the development works that are
necessary to address the problems of the village. Therefore, the onus of executing develop-
ment programs was put on Gram Panchayats. Most importantly, they are responsible for
local infrastructure, welfare programs, water provision, sanitation, and rural connectivity.
Although development works are mainly funded by the State Government, the Panchayats
are responsible for allocating the funds in a manner that they deem optimal. This decentral-
ized form of government was intended to ensure that relevant public works are undertaken
and that expenditure on irrelevant works is reduced. With respect to NREGA, a public
4Decentralized government at the local government was prevalent even before the Amendment was inplace. For example, West Bengal has had local governments since the 1970s. The 73rd Amendment made ita law for the entire country of India.
5
works program, the same pattern in terms of the execution of works prescribed. The Cen-
tral government provides nearly 90 % of the funds for works under NREGA and the State
government makes recommendations on how the fund should be used. The Panchayats are
responsible for proposing the actual works that are to be implemented under NREGA.
Another important goal of the 73rd Amendment is also to promote gender equality at the
local level. The Amendment recommends reservations for women at the level of the local
government, thus providing women in rural areas a voice in policy making processes and
more importantly, to be responsive to the needs of women in these villages. This further
promotes women from underrepresented areas to enter local politics without having to fight
for a seat in the councils. To achieve this goal, it was mandated that one-third of all the seats
in all Panchayat councils be reserved for women. Additionally, one-third of all Panchayat
leader positions are reserved for women and this is done by randomly assigning one third
of Panchayat seats for women candidates. To carry out the affirmative action program, in
Panchayats that are reserved for women candidates, political parties can only field women
candidates, however, the entire population in the Panchayat can vote for their preferred
candidate. In Uttar Pradesh this rule came into effect only in 2000.5
Women Panchayat leaders are supposed to constitute at least 33 percent of all seats. The
process of reserving Panchayats for women leaders is based on a systematic process in order
to ensure that Panchayats are randomly allocated to women. All village Panchayats in a
district are ordered according to their serial legislative number that was assigned to villages
before the 73rd Amendment was introduced. The Panchayats are then ranked in three lists
(those reserved for Scheduled Caste candidates, Scheduled Tribe candidates, and those that
are not reserved for any minority group) and every third candidate in the list is then selected
to be reserved for a woman Panchayat leader. This implies that although Panchayats are
chosen in an arbitrary fashion, they are aware of the time period during which they are going
5A point to note here: even though the Amendment was passed in 1993/94, Uttar Pradesh did notimplement it until 2000. Another state that has implemented it only recently is the state of Bihar, whichborders Uttar Pradesh on its east.
6

to have a woman leader.
2.2 National Rural Employment Guarantee Act
The National Rural Employment Guarantee Act (NREGA)6, a flagship program of the
UPA government, was enacted in 2005.7 The policy guarantees all adults in a rural house-
hold8, a minimum of 100 days of unskilled labour work in a given financial year. The objective
of the program is multifaceted; the most important ones being improvements to local public
infrastructure and providing employment during lean agricultural seasons.9 NREGA is also
one of the very few guarantee programs that provides for equal wages for women and also
reserves 33% workforce for women.
NREGA was rolled out in three different phases. Phase I was first implemented in 2006 in
the 200 poorest districts in India. These districts were specifically targeted by the Planning
Commission of India based on their backward status ranking of Indian districts. 10 These
districts were also chosen based on the Scheduled Caste/Scheduled Tribe female population
to give them more opportunities to take up work. Phase 2 was implemented in 2007 in
130 districts and by the end of 2008, Phase III that covered the rest of the country, was
rolled out. Thus, NREGA covers the entire country with the sole exception of 100% urban
population districts.
As of 2012, Rs.90,000 crore (approximately 1.5 billion US dollars) had been spent by
the then ruling UPA government over the program’s implementation. More than 45 mil-
lion households have been provided with work since 2006 when Phase I was implemented.
Just in the 2012-2013 financial year alone, NREGA has provided employment to over 45
6The program was renamed as Mahatma Gandhi National Rural Employment Guarantee Scheme in2009. For the purposes of the paper, we will refer to the program as NREGA.
7UPA stands for the United Progressive Alliance, a coalition government that was formed after the 2004elections with the Indian National Congress as the biggest party.
8An adult is anyone who is 18 years or older9India, even today, is an agriculturally dependent economy. Any shocks to rainfall and hence agriculture,
proves very detrimental especially to rural households. NREGA tries to mitigate this as well.10The official ranking of backwardness of the districts in each state was based on the Scheduled Caste
and Tribe population in 1991, agricultural wages in 1996-97 and output per agricultural worker in 1990-93.
7

million people and the number continues to improve(Farooquee, 2013). However, there is
state-level heterogeneity when it comes to the program’s performances. Bihar, Madhya
Pradesh, Rajasthan and Uttar Pradesh continue to fair poorly, with Uttar Pradesh ranking
low consistently.11
To participate in NREGA, adult members first apply for a job card at the local Gram
Panchayat (GP); the location of the Panchayat is determined by their residency. Once a
job card application has been submitted, it is the GP’s responsibility to issue the Job Card
within 15 days after verification. Any adult who has applied for work under NREGA must be
assigned to a public works within 15 days; failure to do so results in the state compensating
the workers with unemployment benefits. The Act also mandates that worksites shouldn’t
be more than 5 km (3.11 miles) in radius from the workers’ residences. To promote women’s
participation in the program, NREGA has made it mandatory for worksites to provide for
creches for children under the ages of 0-5. However, this has been grossly violated. Narayan
(2008) has reported that
Projects approved under NREGA mainly emphasize on asset creations, improving local
infrastructure; these include road constructions, improving irrigation works, drought proof-
ing and most importantly water conservation works.12Wage to material ratio is set at 60:40.
While there are specific provisions that there will no sign of contractors or machinery in
NREGA works, this has been grossly violated. The Central Government bears the costs
towards wage payments, 75% of material costs and some administrative costs. State Gov-
ernments on the other hand meet the cost of unemployment benefit, the remainder of the
cost of materials and administrative costs.
11Rajasthan, however, has shown positive outcomes with respect to NREGA implementation.12A recent 2012 amendment to NREGA allows for improvements in sanitation works, increasing access
to rural drinking water and also working on improving own farms especially for the SC/ST communities.
8

2.2.1 NREGA In Uttar Pradesh
Uttar Pradesh is the fourth largest state(in terms of area) and the largest state (in terms
of population) in India. Figure 2 provides a political district map of Uttar Pradesh. As of the
2011 Census13, the state spans over 243,286 km2 (approximately 95000 sq.miles), and has a
population of about 200 million people (47% of which is female population). While the state
as whole ranks below the national average with respect to female to male sex ratio (Uttar
Pradesh is at 908 while India’s average is 940), there is considerable amount of heterogeneity
within the state, with certain districts well above the national average (Figure 3).14 Uttar
Pradesh also has a high percentage of Scheduled Caste population (approximately 30%)
while the Scheduled Tribe population is considerably low (1%).15
In Uttar Pradesh, 23 districts received the program in Phase I, 18 districts in Phase II,
and 32 districts in Phase III.16 As of 2012, the NREGA wage rate in the state is at Rs. 120
per day, compared to Rs 58 in 2006. All projects under NREGA follow a bottom to top
approach instead of the usual top down approach in implementing public works programs.
Every year, the Gram Panchayat prepares its annual plans with respect to budget and works’
status. These plans go to the Block level, then to the District level which then goes to the
State for budget approval. It is then presented to the Government of India. Since the main
proposal comes from the Panchayats, it is important to evaluate the types of works that are
taking place at the Panchayat level, more so in the context of female representation.
13Series-10, Uttar Pradesh, 2011 Census.14Our paper thus bears a greater importance to see whether higher sex ratio results in more female candi-
dates (with or without reservation) and thus better distribution and efficiency of public works, particularlythose that are targeted towards women.
15We find similar statistics in our data set as well.16Phase I: Lakimpur Kheri, Sitapur, Hardoi, Unnao, Rae Bareli, Jalaun, Lalitpur, Hamirpur, Banda,
Fatehpur, Pratapgarh, Barabanki, Gorakhpur, Azamgarh, Jaunpur, Mirzapur, Sonbhadra, Kaushambi,Chandauli, Kushinagar, Chitrakoot,Mahoba. Phase II: Etah, Budaun, Farrukhabad, Ramabai Nagar (Kan-pur Dehat), Jhansi, Bahraich, Gonda, Sultanpur, Siddharth Nagar, Maharajganj, Basti, Mau, Ballia, SantKabir Nagar, Balrampur, Shrawasti, Ambedkar Nagar. Phase III: Bijnor, Moradabad, Rampur, Saha-ranpur, Muzaffarnagar, Meerut, Ghaziabad, Bulandshahar, Aligarh, Mathura, Agra, Firozabad, Mainpuri,Bareilly, Pilibhit, Shahjahanpur, Lucknow, Kanpur Nagar, Allahabad, Faizabad, Deoria, Etawah, Ghazipur,Varanasi, Gautam Buddha Nagar, Baghpat, Hathras, Kannauj, Jyotiba Phule Nagar, Auraiya, Sant RavidasNagar, Kanshiram Nagar
9

However, NREGA performance in Uttar Pradesh has been dismal. A 2013 report by the
Comptroller and Auditor General (CAG)of India conducted an audit of NREGA operations
in Uttar Pradesh and has found that Rs 22714 crore spent on the program’s implementation.
Additionally, the report also found that none of the Panchayats have filled the 33% reserved
for female; most places in the state have only about 18-20% female participation. Further-
more, the CAG report indicates a decline of 14.50% in rural households’ employment in the
2011-2012. Thus evaluating Uttar Pradesh’s NREGA performance through the channels of
female leaders bears significant importance for policy makers in the near future.
2.3 Related Literature
A large number of papers have looked at the impact of women’s reservation on the provi-
sion of public goods, particularly in India. Chattopadhyay & Duflo (2004) find that women’s
reservation in West Bengal and Rajasthan in India, lead to more investment in public goods
that directly benefit women. Using a panel data they find that the presence of a woman
leader increases spending on works that increase supply of drinking water to villages. Bea-
man et al. (2009) find that women’s reservation reduces statistical discrimination about
women in leadership positions. The electorate’s opinion about the effectiveness of a female
leader increases with exposure to women Panchayat leaders as a result of reservation, al-
though, they continue to view women as less effective than men. Beaman et al. (2012)
survey 495 villages in West Bengal and find that in villages with female leaders, adolescent
educational attainment no longer showed signs of any gender gap. Iyer et al.(2012) find
that women’s reservation leads to greater reporting of crime against women. They also find
increased public goods, especially when it came to drinking water.
However, Bardhan et al. (2010) find no impact of female reservation on targeting of
public goods provision. They look at West Bengal over a span of 6 years and find that women
leaders are in fact associated with a a significant worsening of SC/ST households within the
villages. This means that there is a certain amount of capturing of inexperienced women
10

candidates to fill up the reserved posts. Ban & Rao (2008) look at 106 Gram Panchayats
(encompassing 310 villages) in the four states of Andhra Pradesh, Karnataka, Kerala and
Tamil Nadu and find no difference in the execution of public works (especially drinking
water, and sanitation) between men and women leaders. Rajaraman and Gupta (2008) find
that women’s reservation did not have a differential effect on public expenditure for water
and sanitation for the state of Uttar Pradesh.
We use the above papers on reservation and public goods to motivate our analysis to
check the success rate of NREGA works in Panchayats that have a female reservation versus
those that don’t. Although NREGA has been highlighted by United Nations Development
Program to achieve the Millennium Development goals, problems regarding transparency,
under-utilization of funds, inadequate awareness, discrimination, and challenges in creating
useful assets still exist (Dreze et al. 2008, Aiyar and Samji 2009, Business Standard 2012,
Times of India 2012). Afridi et al.(2011) examine female reservation and efficiency of
NREGA works in Andhra Pradesh between 2006-2010. They find that villages with women
leaders are prone to more inefficiencies and program leakages. However, they do find a
persistence effect of these women leaders. They gain some political experience over the
years and hence are better at delivering public goods. Except for Afridi et al.(2011), we are
not aware of any other paper that looks at political reservations and the delivery of NREGA
in India. Our paper adds to the literature of public goods distribution in the context of
Uttar Pradesh. Since Uttar Pradesh has been having an unfavorable NREGA performance,
it is interesting to evaluate whether any sort of reservation in the local governments could
improve the implementation.
11

3 Methodology
3.1 Conceptual Framework
One of the positive externalities of political reservation for female candidates is the role
model effect they generate. Even though jobs under NREGA are open to all household
members who are of working age, they may be reluctant to join the labor market due to
social unacceptability of entering the work force. However, when they see a demonstration
of other women filling positions of power they are able to verify that there is low social
stigma attached to joining the labor force. Women often face a barrier to entry from the
lack of female role models. Having a female Panchayat leader may help change attitudes of
the women in the village. Iyer et al. (2012) find that female representation leads to greater
confidence among women and they report more crimes against them. Ghani et al. (2014)
find that political reservation for women leads to greater female entrepreneurship in the
unorganized sector of the economy while Beaman et al (2012) find that reservation increases
aspirations for adolescent girls and their overall educational attainment, and reduces time
spent on household chores. In this paper we focus on the role model effect of women leaders
by studying women’s participation rate in NREGA.
There is growing literature that looks at the impact of women’s reservation on the pro-
vision of public goods, especially, in India. Pande (2003) provides a model to explain the
mechanism behind why a certain reservation, in this case, female reservation would play
significant role in the public goods distribution. The model assumes a two party system
where each party selects a candidate to represent their constituency for election. Citizens,
in this case, voters are aware if the candidates will implement the party policy. With this
information at hand, the rational voter will cast their vote. The argument behind the model
is that if parties can garner commitment from their candidates to implement their policies,
then the gender of the candidate should not play a role on the outcome measures. Thus,
gender based reservations will not have any differential effects on the policies that directly
12

impact the targeted gender.
On the other hand, if parties cannot commit their candidates to implement party policy,
then gender based political reservations will increase the likelihood of the elected leader
implementing policies that benefit the targeted group. In the absence of reservation, it is
unlikely that there will be proportional(optimal) representation of women in policy making
positions. This is primarily because men historically have occupied positions of power and
therefore established their ability to undertake these jobs. For women, entry is costly since
they have to put in more effort to prove their ability to lead and implement policies. This
would lead to an underrepresentation of women in political parties. Under the assumption
that parties cannot commit their candidates to implement party policies, political reservation
may have a differential impact on women in reserved districts in the context of NREGA.
Also, as Chin & Prakash (2011) point out, post election in a reserved constituency, the
minority leader may favor the minority group but that is not ”synonymous with reducing
poverty.” The benefits may accrue to individuals in the minority group who are above the
poverty line or resources may be diverted from the poor to the non-poor.
3.2 Empirical Strategy
Political reservations for female candidates are randomly assigned at the Panchayat level
following the 73rd Amendment to the Indian Constitution. We analyze the effectiveness of
having a woman leader at the local government level with respect to public works distri-
bution and completion of certain targeted rural works. Thus, it is important to empirical
test whether the assignment is in fact unbiased. Since we have information on Panchayat
reservations in 2005 and 2010, we can test the randomness of the assignment between two
consecutive election cycles. To analyze whether the assignment is in fact exogenous con-
trolling for various factors, we regress if a Panchayat is reserved in 2010 for women on
whether the Panchayat is reserved in 2005 or not and control for Panchayat level factors.
The equation is as follows:
13

reserved2010,p = α + β(reserved2005,p) + ΠXpt + εpt) (1)
where reserved2010,p is a dummy variable that takes on the value 1 if a Panchayat has
been assigned a female candidate reservation in 2010 and 0 if not, reserved2005,p if the
Panchayat had a female reservation in 2005 or not. We also control for Panchayat level
variables including the population and caste related variables (more details are provided in
the paragraphs below).
We, then, analyze the effectiveness of having a woman leader at the local government level
with respect to public works distribution and completion of certain targeted rural works. If
in fact having a woman leader in the government provides for a role-model effect, then we
should see positive and significant outcomes when it comes to adult women taking up more
work. We also hypothesize that Panchayats with female candidates should see an increase
in the number of water related works in the Panchayats compared to those without a female
candidate. We conduct a simple OLS regression where we analyze the performance of public
works in Panchayats with respect to having a female candidate in the local government. Our
estimation model is thus,
ypt = α + β(reserved2010,p) + ΠXpt + εpt (2)
where ypt is the outcome variable in a panchayat p in a year t. reserved2010,p is a dummy
variable that takes on the value 1 if a panchayat had a seat reserved for women in 2010
and 0 if there was no reservation. Xpt is a matrix of panchayat level controls. We include
the following 2001 Census statistics at the Panchayat level: total population, total female
population, Scheduled Caste population and Scheduled Caste female population. Finally,
εpt is the error term. The coefficient of interest is β which gives us the effect of having a
female candidate in the Panchayat on the variable of interest. Decisions about the execution
of NREGA works is also taken at the mandal (or block level) as well. Any secular changes
14

taking place at the block levels, thus, needs to be controlled for. Thus, we edit equation 1
to include for block fixed effects:
ypt = α + β(reserved2010,p) + γb + ΠXpt + εpt (3)
where γb are block fixed effects.17 In our results section, we focus on estimating the
analysis from Equation 2 since this controls for any within-block variation.
4 Data
We first collected electoral information from 31 districts in the North Indian state of
Uttar Pradesh. The dataset comes directly from Thad Dunning’s work on political Gram
Panchayats in four states in India, one of them being Uttar Pradesh.18 The dataset contains
information on Panchayat level candidate reservations for the 2005 and 2010 election cycles.
Information on caste-based reservations and female reservations have been identified in this
dataset. Seats are reserved for Scheduled Caste, Scheduled Tribes and Other Backward
Castes. There is 33% reservation for females at the Panchayat level.19 Furthermore, there
is detailed statistics on each Panchayats’ population, the gender divide of the population,
population of various castes based on the 2001 Census of India. This allows us to include an
exhaustive list of Panchayat level controls in our analyses.
The employment and works data under NREGA is collected from the official NREGA
website hosted by the Indian Government.20 We collected data for all the 31 districts that are
in the Dunning’s political data. Employment information consists of number of job cards
that were issued at the Panchayat level, the demand for work, whether the 100 days has
17We do not add district fixed effects here because the number of districts is too small to control for andalso because the within variation in these districts should be taken care of by the block fixed effects in thisequation.
18Data can be directly downloaded at Dr. Thad Dunning’s website: http://www.thaddunning.com/19Since there is negligible Scheduled Tribes and OBCs in UP, our analysis primarily focuses on the
population of Scheduled Castes.20NREGA data can be collected from http://nrega.nic.in/netnrega/home.aspx
15

been fulfilled or not. Additionally, we have information on person days of work (for both
female and male). The works data has information on all the works that has been started
and completed, started and suspended, approved and proposed at the Panchayat level. We
specifically look at drought protection works, irrigation works, sanitation works, and all the
outcomes from the employment data.
We then merge the two datasets to conduct our analyses and are able to successfully
match all districts and Panchayats. However, our final dataset only looks at 9 districts
and 5987 Panchayats.21 The 9 districts in our dataset are Barabanki, Chitrakoot, Fateh-
pur, Hardoi, Kheri (NREGA Phase I districts) and Ambedkar Nagar, Basti, Etah, Jhansi
(NREGA Phase II districts). Our analyses looks at data from 2010-2013. This allows us to
remove any biases that could have happened during the phase wise roll out since all eligible
districts were brought under the program by the end of 2009.
Our outcome variables are the following: we look at demand for work under NREGA, the
number of job cards issued at the Panchayat level, and the number of days worked by both
men and women. We further look at the types of works taken up, namely, drought proofing
works, sanitation works, irrigation works and water works that are undertaken under the
Panchayat level. Table 1 presents summary statistics of the data set. 43% of the Panchayats
had female reservation in 2005 in Phase I districts, where in Phase 2 50% was reserved for
women. However, we notice that in 2010 only 31% of the Panchayats in Phase I districts
were reserved for women, versus the 33% in Phase 2. Phase I and Phase 2 are similar
in terms of gender distribution (about 47% of the population is female). Approximately,
13% of the total population is female and Scheduled Caste. At the Panchayat level, we see
approximately 150 people have demanded for work under NREGA inspite of the average job
cards issued being around 340 (average of Phase I and Phase 2). On average, we see that
21Not all Panchayats in the Dunning data have information with respect to the Census statistics, andso to make our analysis consistent across all controls, we restrict it just to the 9 districts that have thisinformation. We intend to later on, augment this by including information in the Panchayats excluded inthis version of the paper to provide a better understandings of the workings of NREGA in UP based onthese political reservations.
16

works geared towards rural connectivity have been given more preference than works that
deal with irrigation and water conservation. This is in accordance to the CAG(2013) which
reports that low priority works (rural connectivity) have been higher emphasis than higher
priority works (water works) which have not been well funded.
5 Results
5.1 Randomization of Panchayat Reservations
First, in Table 2, we present results from our analysis of whether the reservation is in
fact exogenous. The results indicate that reservation in a particular Panchayat in 2005 has
no significant bearing on it being more likely to be reserved in the future, i.e., in 2010. As
described in Section 2, Panchayats are ordered the reservation list in terms of their serial
legislative number, and every third Panchayat on the list is reserved for female leaders. If
this rule is strictly followed, then reservation in one period should reduce the likelihood of
being reserved in the next administrative period. In fact, the coefficient on reserved2005 is
positive and not significant for Phase I and negative and not significant for Phase II districts
suggesting that the direction of the results is ambiguous. We find that reservation is not
correlated with past reservation, or the number of female population or the Scheduled Caste
population in the Panchayat. The results presented in Table 2, thus suggest that reservation
is based on an arbitrary method and lends credibility to the simple OLS strategy we present
in the rest of this section.
5.2 Demand for Work under NREGA
In Table 3A we focus on the Phase 1 districts which had received the NREGA in the first
year of the program rollout (from February 2006) and were regarded as the most backward
districts by the Planning Commission of India. In Table 3B we focus on Phase 2 districts
which received the program in the second year of the rollout (from April 2007). The Phase 2
17

districts were typically less backward than the Phase 1 districts. In these tables, we focus on
the delivery of services to households who demand work under NREGA. This provision of
service is captured by the number of households whose demand for work under NREGA was
officially recorded by the Panchayat leader and through the issue of job cards which are used
to get work under the program. Our data shows that under female leadership, there is a 2.2
% increase in registered cases of households demanding work under the program. Also, in
terms of job card provision, female leaders issue more job cards than their male counterparts.
3.5 percent more job cards were issued in Panchayats that were reserved versus Panchayats
that were not reserved for women candidates. This holds true even in our full sample of
Panchayats as well as Panchayats that were reserved only since 2010.
However, for Panchayats that had reservation in 2005, the effect is positive but not
statistically significant. For Panchayats in Phase 2 districts, the effect of reservation is
positive but not significant in terms of job cards issued. These results are in line with
the findings of Duflo & Topalova (2004) for women’s reservation in West Bengal, where
they find that women leaders are not significantly different from their male counterparts in
terms of the quality of public goods provision. There have been newspaper reports (Indian
Express, February 23, 2009; Live Mint and the Wall Street Journal, January 15, 2010) that
suggest that not all households that seek work under the program are registered officially
as households demanding work under NREGA. One of the main concerns in states like
Uttar Pradesh is the capture of job cards by elites and denying job card application forms.
In this case, we find that women leaders provide better reporting of demand for NREGA
and that under female leadership there are significantly more job cards being issued. This
suggests that the concern about denying job cards under NREGA might be lower under
female Panchayat leaders. Thus our findings are consistent with Duflo and Topalova (2004)
where they find that in Panchayats with women leaders, there is lower level of corruption.
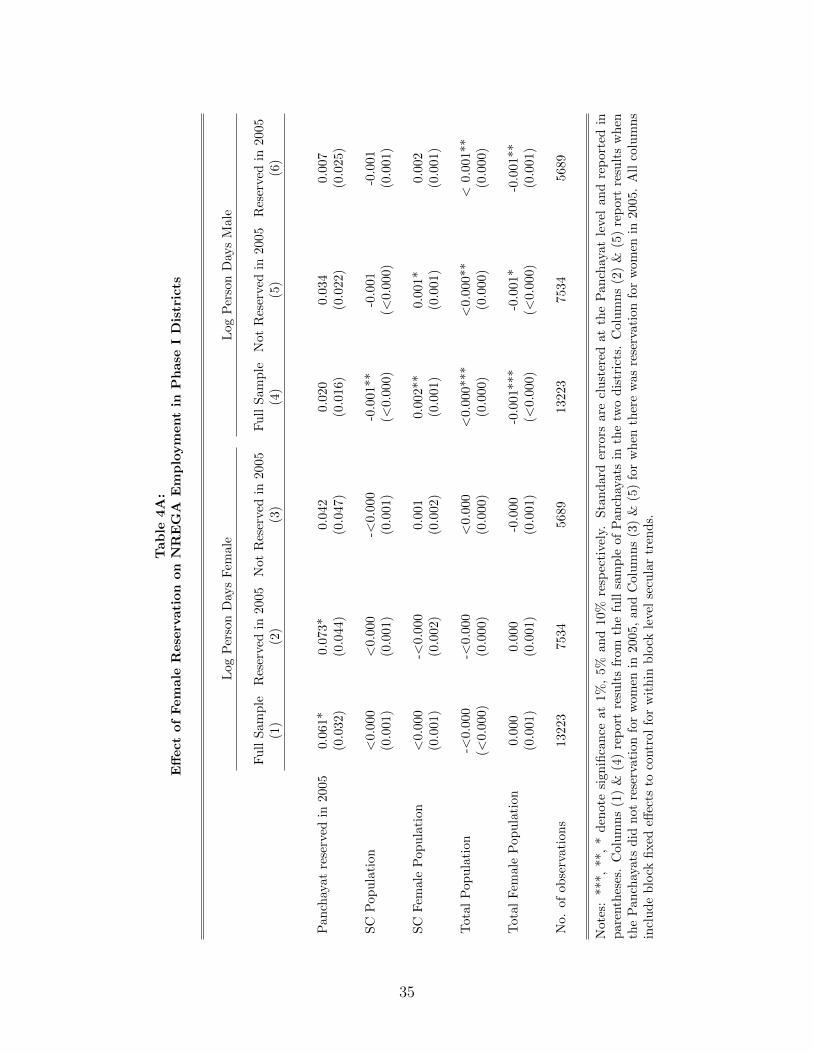
In Tables 4A and 4B, we focus on the impact of female reservation on the average number
of person days of work by women under NREGA. To tease out any gender differences with
18

respect to the labor force participation, we also evaluate the impact of reservation on person
days of work taken up by the men in the villages. The average person days is obtained by
dividing total person days (for men and women) by the number of households that were
employed under NREGA in a particular Panchayat. Here, we find that female leadership
increases the number of person days worked by women by approximately 6% in Panchayats in
Phase I districts while for Panchayats in Phase 2, there is no effect. In terms of male person
days, there is a positive but not significant effect in Phase 1, and a small and insignificant
effect for Phase 2. These results suggest that female leadership provides a role model effect
for women in reserved districts (Ghani et al. (2014), Iyer et al. (2012), and Beaman et al.
(2012)). Having a woman leader in their village may have a positive externalities in terms of
overcoming public taste discrimination and may increase entry into the NREGA jobs though
improving aspirations of the disadvantaged groups (Pande and Ford (2011).
5.3 Types of NREGA Work Undertaken
One oft-repeated argument towards increasing reservations through a quota system is
that it will help targeted groups be better served through development works that will
improve their quality of living. To examine the types of work that are taken up under a
female leader, we concentrate on the major works under NREGA - rural connectivity, land
development, works related to drought, and irrigation and present the results in Tables 5A
& 5B. For Phase 1 Panchayats, women leadership increases the total number of completed
works for irrigation projects by around 14%. This only holds true for those Panchayats also
that had reservation in 2005-2009. For Phase 2 Panchayats, women leadership increases the
total number of completed works for land development projects by around 12 %. This again
only holds true for those Panchayats also that had reservation in 2005-2009. For the other
categories of public works, we find no significant differences in outcomes between male and
female leadership. These results would suggest that only with experience and learning over
time are women leaders able to outperform their male counterparts. Women leaders at the
19

time of their first appointment are less educated less likely to be literate, shy in responding
to question, and less ambitious than male leaders (Duflo and Chattopadhyay (2004)). Only
by learning on the job, do they gain the experience to complete more projects than male
leaders; our evidence shows women maturing as leaders over time. Beaman et al. (2010) use
village survey data from West Bengal to demonstrate the women leading in twice-reserved
districts provides a greater level of public goods indicating that experience may strengthen
political performance. Apart from irrigation and land development, we find no impact of
female reservation on public good provision (similar to Bardhan, et al. (2010) and Kumar
and Prakash (2012)).
In Tables 6A and 6B we focus on works under NREGA that are more relevant for the
female population. Policy preferences of women have been documented to be different in
various studies (Duflo and Chattopadhyay (2004), Topalova and Duflo (2004)). Employing
the model developed by Pande (2003), we work under the assumption that parties cannot
commit their candidates to implement party policies and as a result political reservation
may have a differential impact on women in reserved districts in the context of NREGA.
Therefore, we look at the number of works related to sanitation, water consumption, and
water bodies that have been completed under women Panchayat leaders during the period
of 2010 to 2013. In terms of sanitation and water bodies we find no effect of reservation.
This is in line with the finding of Bardhan et al.(2010) and Ban & Rao (2008) fails to find
evidence of women leaders favoring female-preferred public goods provision.
6 Conclusion
This paper analyzes the effectiveness of having a female candidate in the government on
type of public works taken up under NREGA and the number of works that are completed
in 9 districts of Uttar Pradesh. We exploit the mandate set by the 73rd Amendment to
randomly assign Panchayats(village councils), the lowest level of government under decen-
tralized India, with a seat for female candidates to increase their political participation at
20

the local level. Although the amendment was passed in 1993, Uttar Pradesh did not im-
plement the program until 2000. The amendment also mandates elections to be held every
five years, thus Uttar Pradesh has had 2 Panchayat elections so far (2005 and 2010). The
National Rural Employment Guarantee Act of India was enacted in 2005 and implemented
in a phase wise fashion starting in 2006. First, we find that the Panchayat reservations
between consecutive election cycles are in fact exogenous, we find no significant impact of
being reserved in the previous election cycle on the current reservations. This allows us to
use a simple OLS regression since the dependent variable does not suffer from any bias that
could skew our results.
We find that having a female candidate in the Panchayat positively impacts demand
for work and the number of person days worked by women in Phase I districts, especially
in those that did not have a woman leader in 2005. However, we find no significant effect
for these outcomes in Phase II districts. In both Phase I & II districts we no effect of a
reservation on the number of person-days worked by men. Thus, we find evidence of a role-
model effect when it comes to women taking up more work in a Panchayat with a woman
leader and no evidence of persistence effect of having a woman leader in 2005 and 2010. An
important artifact of having a woman leader is also that the type of NREGA work undertaken
might be significantly different from those without. Our results find no significant impact
of having a woman leader on works that might be of importance to their targeted audience,
i.e., improving sanitation and water works.
Our work contributes to the growing literature on NREGA and its implementation based
on reservations at the Panchayat level. The lack of any significant results in the type of
works undertaken in Uttar Pradesh is in line with the reports that have shown evidence
that the implementation has suffered a lot in spite of the huge budget spent on NREGA in
the state. The state needs more social audit at every level of decision making stage of the
NREGA. The lack of cohesion between the different levels of government in the planning
stages of NREGA needs to be addressed. Further, the state government of Uttar Pradesh
21

should analyze why there has been a decline in households participating in the program.
Misappropriation of NREGA funds is also an issue in the state; the state Government is
going through an intensive audit to see where approximately 1200 crores have been used.
The types of work needs to be prioritized as well; rural connectivity is not of high priority
anymore, water works need a lot more attention. These are some of the areas that the Uttar
Pradesh state government needs to address for a better implementation of NREGA.
22

References
Afridi, Farzana, Vegard Iversen and M.R. Sharan.“Women Political Leaders,Corruption and Learning: Evidence from a Large Public Program in India,” InternationalGrowth Center Working Paper, 2013.
Aiyar, Yamini, and Salimah Salimah. “Transparency and Accountability in NREGA:A Case Study of Andhra Pradesh,” Working Paper, 2009.
Angrist, Joshua D, and Jorn-Steffen Pischk. “Mostly Harmless Econometrics:An Empiricist’s Companion,” Princeton University Press, 2008.
Agarwal, R.K..“Implementation of the NREGA in Uttar Pradesh,” VSRD-InternationalJournal of Business and Management Research, 2 (6): 271-279, 2012
Azam, Mehtabul. “The Impact of Indian Job Guarantee Scheme on Labor MarketOutcomes:Evidence from a Natural Experiment.” IZA Discussion Paper No. 6548, 2012.
Ban,Radu and Vijayendra Rao“Tokenism or Agency? The Impact of Women’sReservations on Village Democracies in South India,” Economic Development and CulturalChange, 56(3): 501-530, 2008. Banerjee, Abhijit, and Rohini Somanathan. “ThePolitical Economy of Public Goods: some Evidence from India.” Journal of DevelopmentEconomics, 82(2): 287-314, 2007.
Banerjee, Abhijit, Marianne Bertrand, Saugato Datta, and Sendhil Mul-lainathan.“Labor market discrimination in Delhi: Evidence from a field experiment.”Journal of Comparative Economics, 37(1): 14-27, 2009
Bardhan, Pranab, Dilip Mookherjee, and Monica Parra Torrado. “Impactof Political Reservations in West Bengal Local Governments on Anti-Poverty Targeting.”Journal of Globalization and Development, 1(1), 2010.
Beaman, Lori, Raghabendra Chattopadhyay, Esther Duflo, Rohini Pandeand Petia Topalova. “Powerful Women: Does Exposure Reduce Prejudice?,” QuarterlyJournal of Economics, 124 (4): 1497-1540, 2009.
Beaman, Lori, Esther Duflo, Rohini Pande, and Petia Topalova. “FemaleLeadership Raises Aspirations and Educational Attainment for Girls: A Policy Experimentin India”, Science, 335(6068):582-586, 2012.
Berg, Erlend, Sambit Bhattacharyya, Rajasekhar Durgam, and ManjulaRamachandra. “Can Rural Public Works Affect Agricultural Wages? Evidence fromIndia.” Unpublished, 2012.
23

Besley, T., Pande, R., L. Rahman, and V. Rao. “The Politics of Public GoodProvision: Evidence from Indian Local Governments,” Journal of the European EconomicAssociation, 416-426, 2004.
Besley, Timothy, and Stephen Coate. “An Economic Model of RepresentativeDemocracy.” The Quarterly Journal of Economics, 1997.
Besley, Timothy, and Stephen Coate. “Workfare Versus Welfare: Incentive Argumentsfor Work Requirements in Poverty-Alleviation Programs,” The American Economic Review,82(1): 249-261,1992.
Bhalotra, Sonia R., Irma Clots-Figueras, and Lakshm I Iyer. “Path-Breakers: HowDoes Women’s Political Participation Respond to Electoral Success?” IZA Discussion Paper7771, 2013.
Bhargava, Alok. “Family Planning, Gender Differences and Infant Mortality: Evi-dence from Uttar Pradesh, India.” Journal of Econometrics, 112: 225-240, 2003.
Centre for Budget and Governance Accountability. “Report on Implementa-tion of NREGA in Andhra Pradesh, Chattisgarh, Jharkhand and Madhya Pradesh in Mayand June 2006.” New Delhi , 2006.
Chattopadhyay, Raghabendra, and Esther Duflo. “Women as Policy Makers:Evidence from a Randomized Policy Experiment in India,” Econometrica, 72(5):1409-1443,2004.
Chaudhuri, Shubham, Gaurav Datt, and Martin Ravallion. “Does Maharash-tra’s Employment Guarantee Scheme Guarantee Employment? Effects of the 1988 WageIncrease,” Economic Development and Cultural Change, 41(2):251-275, 1993.
Chin, Aimee and Nishith Prakash. “The Redistributive Effects of Political Reservationfor Minorities: Evidence from India.” Journal of Development Economics, 96: 265-277, 2011.
Comptroller and Auditor General of India. “Report of the Comptroller andAuditor General of India on Performance Audit of Mahatma Gandhi National RuralEmployment Guarantee Scheme: Government of Uttar Pradesh”, 2013.
Del Ninno, Carlo, Kalanidhi Subbarao, and Annamaria Milazzo. “How toMake Public Works Work: A Review of the Experiences.” World Bank, Human Develop-ment Network, 2009.
Doepke, Matthias, and Michele Tertilt.“Does Female Empowerment PromoteEconomic Development?” National Bureau of Economic Research, No. w19888, 2014.
Dreze, Jean, Reetika Khera, and Siddhartha. “Corruption in NREGA: Myth
24

and Reality.” The Hindu, January 22, 2008.
Duflo, Esther. “Why Political Reservation,” Journal of the European Economic As-sociation, 3(2-3): 668-678, 2005.
Duflo, Esther. “Women Empowerment and Economic Development.” Journal ofEconomic Literature, 50(4), 2012.
Duflo, Esther, and Christopher Udry. “Intrahousehold Resource Allocation inCote d’Ivoire: Social Norms, Separate Accounts and Consumption Choices,” NationalBureau of Economic Research, w10498, 2004.
Dutta, Puja, Rinku Murgai, Martin Ravallion, and Dominique Van deWalle. “Does India’s Employment Guarantee Scheme Guarantee Employment?” WorldBank Policy Research Working Paper 6003, 2012.
Farooquee, Arsalan Ali. “Policy Implementation and Impact Reivew: A Case ofMGNREGA in India,” Mediterranean Journal of Social Sciences, 4(13): 367-379, 2013.
Ghani, Ejaz, William R. Kerr, and Stephen D. O’Connell. “Political Reser-vations and Women’s Entrepreneurship in India,” Journal of Development Economics ,108:138-153, 2014.
Government of India.“Delay in Payment of Wages to NREGA Workers,” Circular,2009.
Government of India. “Employment and Unemployment Situation in India, 2004-05”. National Sample Survey Organisation, 2006.
Government of India. “National Rural Employment Guarantee Act 2005 (NREGA),Report of the Second Year, April 2006 -March 2007,” Department of Rural Development,Ministry of Rural Development, New Delhi.
Government of India. “Informal Sector and Conditions of Employment in India2004-05.” National Sample Survey Organisation, Ministry of Statistics & ProgrammeImplementation, 2007.
Government of India. “Mahatma Gandhi National Rural Employment GuaranteeAct - Report to the People.” Department of Rural Development, Ministry of Rural Devel-opment, New Delhi, 2013.
Government of India. ”Report of the Expert Group to Review the Methodologyfor the Estimation of Poverty.” Planning Commission, 2009.
Government of India.“The Mahatma Gandhi National Rural Employment Guaran-
25

tee Act 2005.” Ministry of Rural Development, http://nrega.nic.in/netnrega/home.
aspx(accessedSeptember23,2013).
Heckman, J., LaLonde, R., and R. Smith. “The Economics and Econometricsof Active Labor Market Programs.” Handbook of Labor Economics, Volume 3, edited by O.Ashenfelter and D. Card, 1865-2097, 1999.
Hoddinott, John, and Emmanuel Skoufias. “The Impact of PROGRESA onFood Consumption.” Economic Development and Cultural Change, 53(1): 37-61, 2004.
Hoddinott, John, and Lawrence Haddad. “Does Female Income Share InfluenceHousehold Expenditures? Evidence from Cote d’Ivoire.” Oxford Bulletin of Economics andStatistics, 77-96, 1995.
Iyer, Lakshmi, Anandi Mani, Prachi Mishra, and Petia Topalova. ”ThePower of Political Voice: Women’s Political Representation and Crime in India.” AmericanEconomic Journal: Applied Economics 4, no. 4 (2012): 165-193.
Jacob, Naomi. “The Impact of NREGA on Rural-Urban Migration: Field survey ofVillupuram District, Tamil Nadu.” http://www.ccs.in/ccsindia/downloads/intern-papers-08/NREGA-Paper-202.pdf (accessed 10 10, 2013), 2008.
Jadhav, Vishal.“Elite Politics and Maharashtra’s Employment Guarantee Scheme.”Economic and Political Weekly,5157-5162, 2006.
Khosla, Rishabh. “Caste, Politics and Public Good Distribution in India: Evidencefrom NREGA in Andhra Pradesh.” Economic & Political Weekly, 46(12), 2011.
Kumar, Sunil Mitra. “Does Access to Formal Agricultural Credit Depend on Caste?”World Development, 2012.
Kumar, Santosh and Nishith Prakash. “Political Decentralization, Women Reservationin Bihar and Children?s Health Outcomes: A Case Study of Rural Bihar,” Working Paper,2012
Lemos, Sara. “Minimum Wage Effects in a Developing Country.” Labor Economics,16(2): 224-237, 2009.
Luke, Nancy, and Kaivan Munshi. ”Social affiliation and the demand for healthservices: Caste and child health in South India.” Journal of Development Economics 83, no.2 (2007): 256-279.
Moore, Mick, and Vishal Jadhav. ”The politics and bureaucratics of rural pub-lic works: Maharashtra’s employment guaranteed scheme.” Journal of Development Studies42, no. 8 (2006).
26

Pande, Rohini. “Can Mandated Political Representation Increase Policy Influencefor Disadvantaged Minorities? Theory and Evidence from India.” American EconomicReview, 93(4): 1132-1151, 2003.
Planning Commission of India. “Report of the Task Force: Identification of Dis-tricts for Wage and Self Employment Programmes,” 2003.
Planning Commission of India.“All India Report on Evaluation of NREGA: Asurvey of 20 Districts,” 2008.
Planning Commission of India. “Tendulkar Committee. ”Report of the ExpertGroup to Review the Methodology for Estimation of Poverty,” 2009.
Qian, Nancy. “Missing Women and the Price of Tea in China: The Effect of Sex-SpecificEarnings on Sex Imbalance.” The Quarterly Journal of Economics, 123(3)1251-1285, 2008.
Ravallion, Martin. “Evaluating Anti-Poverty Programs,” Handbook of DevelopmentEconomics, Volume 4, edited by T. P. Schultz and John Strauss, 3787-3846. Amsterdam,2007.
Rawlings, Laura B., and Gloria M. Rubio. ”Evaluating the Impact of Condi-tional Cash Transfer Programs.” The World Bank Research Observer 20, no. 1 (2005).
Tendulkar, Suresh D. “Report of the Expert Group to Review the Methodologyfor Estimation of Poverty,” Planning Commission of India, 2009.
Times of India. ”Workers to Protest Against Corruption in NREGA, ”Jaipur, March 22,2012.
UNDP. ”Empowering Lives Through Mahatma Gandhi NREGA,” 2011.
World Bank. “Engendering Development,” World Bank and Oxford University Press, 2001.
Zimmermann, Laura. “Labor Market Impacts of a Large-Scale Public Works Pro-gram: Evidence from the Indian Employment Guarantee Scheme.” Working Paper, 2012.
27

Figure 1:Decentralization of Government in India
28

Figure 2:District Map of Uttar Pradesh
Source: National Disaster Management Authority, Government of India(http://www.ndma.gov.in/en/uttar-pradesh-sdma-office).
29

Figure 3:2011 Provisional Sex Ratio Figures in UP
Source: Series-10, Uttar Pradesh, Paper-I of 2011
30

Tab
le1:
Desc
rip
tive
Sta
tist
ics
Ph
ase
IP
hase
II(1
)(2
)
Res
erve
dfo
rF
emale
in2005
0.4
30.5
0(0
.50)
(0.5
0)
Res
erve
dfo
rF
emale
in2010
0.3
10.3
3(0
.46)
(0.4
7)
Pro
por
tion
ofF
emale
Pop
ula
tion
0.4
70.4
8(0
.04)
(0.0
5)
Pro
por
tion
ofF
emale
Sch
edu
led
Cast
eP
op
ula
tion
0.1
40.1
2(0
.09)
(0.0
9)
Tot
alJob
Car
ds
400.9
2279.3
7(2
06.6
1)
(127.6
8)
Dem
and
for
NR
EG
AW
ork
163.5
9126.5
3(9
5.5
3)
(76.2
5)
Per
son
Day
sof
Work
by
Wom
en3.5
88.0
4(4
.25)
(6.1
)
Per
son
Day
sof
Work
by
Men
28.9
25.9
3(1
4.0
9)
(11.3
6)
Ru
ral
Con
nec
tivit
yW
ork
s3.2
74.8
6(5
.78)
(6.9
1)
Dro
ugh
tW
orks
0.2
90.3
7(1
.14)
(1.3
4)
Irri
gati
onW
orks
0.1
90.3
50.9
31.0
4
Wat
erC
onse
rvati
on
Work
s0.6
61.1
2(2
.01)
(3.0
9)
Wat
erB
od
ies
Work
s0.1
20.2
4(0
.53)
(0.8
9)
No.
ofO
bse
rvat
ion
s13283
8866
Not
es:
Ob
serv
atio
ns
are
at
the
Pan
chay
at
level
.
31

Table
2:
Exogeneit
yof
Panch
ayat
Rese
rvati
on
in2010
Phas
eI
Phas
eII
(1)
(2)
Pan
chay
atR
eser
ved
in20
050.
015
-0.0
12(.
016)
(0.0
21)
Sch
edule
dC
aste
Pop
ula
tion
0.00
00.
000
(0.0
00)
(0.0
01)
Sch
edule
dC
aste
Fem
ale
Pop
ula
tion
-0.0
000.
000
(0.0
00)
(0.0
01)
Tot
alP
opula
tion
-0.0
000.
000
(0.0
00)
(0.0
00)
Tot
alF
emal
eP
opula
tion
-0.0
000.
000
(0.0
00)
(0.0
00)
No.
ofO
bse
rvat
ions
1607
410
834
Not
es:
***,
**,
*den
ote
sign
ifica
nce
at1%
,5%
and
10%
resp
ecti
vely
.Sta
n-
dar
der
rors
are
clust
ered
atth
eP
anch
ayat
leve
lan
dre
por
ted
inpar
enth
eses
.
32

Tab
le3A
:E
ffect
of
Fem
ale
Rese
rvati
on
on
Take-U
pof
NR
EG
Ain
Ph
ase
ID
istr
icts
Log
of
Job
Card
sIs
sues
Log
of
NR
EG
AD
eman
d
Fu
llS
amp
leN
ot
Res
erved
in2005
Res
erve
din
2005
Fu
llS
am
ple
Not
Res
erved
in2005
Res
erved
in2005
(1)
(2)
(3)
(4)
(5)
(6)
Pan
chay
atre
serv
edin
2010
0.03
5***
0.0
36**
0.0
27
0.0
22*
0.0
30*
0.0
12
(0.0
11)
(0.0
15)
(0.0
18)
(0.0
12)
(0.0
17)
(0.0
19)
SC
Pop
ula
tion
<0.
001
<0.0
01
<0.0
01
-<0.0
01
<0.0
01
-<0.0
01
(<0.
001)
(<0.0
01)
(<0.0
01)
(<0.0
01)
(<0.0
01)
(<0.0
01)
SC
Fem
ale
Pop
ula
tion
-0.0
00-0
.000
0.0
00
0.0
01
0.0
00
0.0
01
(0.0
00)
(0.0
01)
(0.0
01)
(0.0
01)
(0.0
01)
(0.0
01)
Tot
alP
opu
lati
on<
0.00
0**
<0.0
00*
<0.0
00
<0.0
00**
<0.0
00
0.0
00***
(<0.
000)
(<0.0
00)
(<0.0
00)
(<0.0
00)
(<0.0
00)
Tot
alF
emal
eP
opu
lati
on-<
0.00
0*-<
0.0
00
-<0.0
00
-0.0
01**
-<0.0
00
-0.0
01*
(0.0
00)
(0.0
00)
(0.0
00)
(0.0
00)
(0.0
00)
(0.0
00)
No.
ofob
serv
atio
ns
1322
37534
5689
13223
7534
5689
Not
es:
***,
**,
*d
enot
esi
gnifi
can
ceat
1%,
5%
an
d10%
resp
ecti
vely
.Sta
nd
ard
erro
rsare
clu
ster
edat
the
Pan
chay
at
leve
lan
dre
port
edin
par
enth
eses
.C
olu
mn
s(1
)&
(4)
rep
ort
resu
lts
from
the
full
sam
ple
of
Pan
chay
ats
inth
etw
od
istr
icts
.C
olu
mn
s(2
)&
(5)
rep
ort
resu
lts
wh
enth
eP
anch
ayat
sd
idn
otre
serv
atio
nfo
rw
om
enin
2005,
an
dC
olu
mn
s(3
)&
(5)
for
wh
enth
ere
was
rese
rvati
on
for
wom
enin
2005.
All
regr
essi
ons
incl
ud
eb
lock
fixed
effec
tsto
contr
ol
for
any
wit
hin
33

Tab
le3B
:E
ffect
of
Fem
ale
Rese
rvati
on
on
Take-U
pof
NR
EG
Ain
Ph
ase
IID
istr
icts
Log
of
Job
Card
sIs
sued
Log
of
NR
EG
AD
eman
d
Fu
llS
amp
leN
ot
Res
erved
in2005
Res
erve
din
2005
Fu
llS
am
ple
Not
Res
erved
in2005
Res
erved
in2005
(1)
(2)
(3)
(4)
(5)
(6)
Pan
chay
atre
serv
edin
2010
0.01
10.0
26
0.0
02
-0.0
06
-0.0
11
0.0
12
(0.0
14)
(0.0
20)
(0.0
20)
(0.0
15)
(0.0
20)
(0.0
21)
SC
Pop
ula
tion
-0.0
01-<
0.0
00
-0.0
01*
-0.0
01*
-<0.0
00
-<0.0
01**
(<0.
000)
(0.0
01)
(0.0
01)
(<0.0
00)
(<0.0
01)
(<0.0
01)
SC
Fem
ale
Pop
ula
tion
0.00
2**
0.0
01
0.0
03**
0.0
02**
0.0
01
0.0
03**
(0.0
01)
(0.0
01)
(0.0
01)
(0.0
01)
(0.0
01)
(0.0
01)
Tot
alP
opu
lati
on<
0.00
0*<
0.0
00*
<0.0
00
<0.0
00***
<0.0
01***
0.0
00
(<0.
000)
(<0.0
00)
(<0.0
00)
(<0.0
00)
(<0.0
00)
Tot
alF
emal
eP
opu
lati
on-<
0.00
0-<
0.0
01
-<0.0
00
-0.0
01***
-0.0
01***
-0.0
00
(0.0
00)
(0.0
00)
(0.0
00)
(0.0
00)
(0.0
00)
(0.0
00)
No.
ofob
serv
atio
ns
8802
4424
4378
8802
4424
4378
Not
es:
***,
**,
*d
enot
esi
gnifi
can
ceat
1%,
5%
an
d10%
resp
ecti
vely
.Sta
nd
ard
erro
rsare
clu
ster
edat
the
Pan
chay
at
leve
lan
dre
port
edin
par
enth
eses
.C
olu
mn
s(1
)&
(4)
rep
ort
resu
lts
from
the
full
sam
ple
of
Pan
chay
ats
inth
etw
od
istr
icts
.C
olu
mn
s(2
)&
(5)
rep
ort
resu
lts
wh
enth
eP
anch
ayat
sd
idn
otre
serv
atio
nfo
rw
om
enin
2005,
an
dC
olu
mn
s(3
)&
(5)
for
wh
enth
ere
was
rese
rvati
on
for
wom
enin
2005.
All
regr
essi
ons
incl
ud
eb
lock
fixed
effec
tsto
contr
ol
for
any
wit
hin
34
Tab
le4A
:E
ffect
of
Fem
ale
Rese
rvati
on
on
NR
EG
AE
mp
loym
ent
inP
hase
ID
istr
icts
Log
Per
son
Day
sF
emale
Log
Per
son
Day
sM
ale
Fu
llS
amp
leR
eser
ved
in2005
Not
Res
erve
din
2005
Fu
llS
am
ple
Not
Res
erved
in2005
Res
erved
in2005
(1)
(2)
(3)
(4)
(5)
(6)
Pan
chay
atre
serv
edin
2005
0.06
1*0.0
73*
0.0
42
0.0
20
0.0
34
0.0
07
(0.0
32)
(0.0
44)
(0.0
47)
(0.0
16)
(0.0
22)
(0.0
25)
SC
Pop
ula
tion
<0.
000
<0.0
00
-<0.0
00
-0.0
01**
-0.0
01
-0.0
01
(0.0
01)
(0.0
01)
(0.0
01)
(<0.0
00)
(<0.0
00)
(0.0
01)
SC
Fem
ale
Pop
ula
tion
<0.
000
-<0.0
00
0.0
01
0.0
02**
0.0
01*
0.0
02
(0.0
01)
(0.0
02)
(0.0
02)
(0.0
01)
(0.0
01)
(0.0
01)
Tot
alP
opu
lati
on-<
0.00
0-<
0.0
00
<0.0
00
<0.0
00***
<0.0
00**
<0.0
01**
(<0.
000)
(0.0
00)
(0.0
00)
(0.0
00)
(0.0
00)
(0.0
00)
Tot
alF
emal
eP
opu
lati
on0.
000
0.0
00
-0.0
00
-0.0
01***
-0.0
01*
-0.0
01**
(0.0
01)
(0.0
01)
(0.0
01)
(<0.0
00)
(<0.0
00)
(0.0
01)
No.
ofob
serv
atio
ns
1322
37534
5689
13223
7534
5689
Not
es:
***,
**,
*d
enot
esi
gnifi
can
ceat
1%,
5%
an
d10%
resp
ecti
vely
.S
tan
dard
erro
rsare
clu
ster
edat
the
Pan
chay
at
level
an
dre
port
edin
par
enth
eses
.C
olu
mn
s(1
)&
(4)
rep
ort
resu
lts
from
the
full
sam
ple
of
Pan
chay
ats
inth
etw
od
istr
icts
.C
olu
mn
s(2
)&
(5)
rep
ort
resu
lts
wh
enth
eP
anch
ayat
sd
idn
otre
serv
atio
nfo
rw
omen
in2005,
an
dC
olu
mn
s(3
)&
(5)
for
wh
enth
ere
was
rese
rvati
on
for
wom
enin
2005.
All
colu
mn
sin
clu
de
blo
ckfi
xed
effec
tsto
contr
olfo
rw
ith
inb
lock
leve
lse
cula
rtr
end
s.
35

Tab
le4B
:E
ffect
of
Fem
ale
Rese
rvati
on
on
NR
EG
AE
mp
loym
ent
inP
hase
IID
istr
icts
Log
Per
son
Day
sF
emale
Log
Per
son
Day
sM
ale
Fu
llS
amp
leR
eser
ved
in2005
Not
Res
erve
din
2005
Fu
llS
am
ple
Not
Res
erved
in2005
Res
erved
in2005
(1)
(2)
(3)
(4)
(5)
(6)
Pan
chay
atre
serv
edin
2005
-0.0
13-0
.000
-0.0
11
-0.0
08
0.0
06
-0.0
05
(0.0
30)
(0.0
41)
(0.0
44)
(0.0
20)
(0.0
28)
(0.0
28)
SC
Pop
ula
tion
-0.0
01**
-0.0
01
-0.0
01
-0.0
00
0.0
00
-0.0
00
(0.0
01)
(0.0
01)
(0.0
01)
(0.0
00)
(0.0
01)
(0.0
01)
SC
Fem
ale
Pop
ula
tion
0.00
3**
0.0
02
0.0
04
0.0
01
-0.0
00
0.0
01
(0.0
01)
(0.0
02)
(0.0
02)
(0.0
01)
(0.0
01)
(0.0
02)
Tot
alP
opu
lati
on0.
001*
*0.0
01***
0.0
00
0.0
00***
0.0
01***
0.0
00
(0.0
00)
(0.0
00)
(0.0
00)
(0.0
00)
(0.0
00)
(0.0
00)
Tot
alF
emal
eP
opu
lati
on-0
.001
**-0
.002***
-0.0
00
-0.0
01**
-0.0
01***
-0.0
00
(0.0
00)
(0.0
01)
(0.0
01)
(0.0
00)
(0.0
00)
(0.0
01)
No.
ofob
serv
atio
ns
8802
4424
4378
8802
4424
4378
Not
es:
***,
**,
*d
enot
esi
gnifi
can
ceat
1%,
5%
an
d10%
resp
ecti
vely
.S
tan
dard
erro
rsare
clu
ster
edat
the
Pan
chay
at
level
an
dre
port
edin
par
enth
eses
.C
olu
mn
s(1
)&
(4)
rep
ort
resu
lts
from
the
full
sam
ple
of
Pan
chay
ats
inth
etw
od
istr
icts
.C
olu
mn
s(2
)&
(5)
rep
ort
resu
lts
wh
enth
eP
anch
ayat
sd
idn
otre
serv
atio
nfo
rw
omen
in2005,
an
dC
olu
mn
s(3
)&
(5)
for
wh
enth
ere
was
rese
rvati
on
for
wom
enin
2005.A
llco
lum
ns
incl
ud
eb
lock
fixed
effec
tsto
contr
olfo
rw
ith
inb
lock
leve
lse
cula
rtr
end
s.
36

Tab
le5A
:E
ffect
of
Wom
en
’sR
ese
rvati
on
on
NR
EG
Aw
ork
sin
Ph
ase
ID
istr
icts
Ru
ral
Dro
ught
Lan
dIr
rigati
on
Con
nec
tivit
yW
ork
sD
evel
op
men
tW
ork
s
Fu
llN
otR
eser
ved
Res
erved
Fu
llN
ot
Res
erve
dR
eser
ved
Fu
llN
ot
Res
erved
Res
erve
dF
ull
Not
Res
erve
dR
eser
ved
Sam
ple
in20
05in
2005
Sam
ple
in2005
in2005
Sam
ple
in2005
in2005
Sam
ple
in2005
in2005
(1)
(2)
(3)
(4)
(5)
(6)
(7)
(8)
(9)
(10)
(11)
(12)
Pan
chay
atR
eser
ved
in20
050.
004
-0.0
090.0
25
-0.0
06
0.0
23
-0.0
51
-0.0
57*
-0.0
69
-0.0
36
0.0
62
0.0
09
0.1
40**
(0.0
18)
(0.0
25)
(0.0
28)
(0.0
29)
(0.0
40)
(0.0
43)
(0.0
30)
(0.0
43)
(0.0
45)
(0.0
44)
(0.0
64)
(0.0
70)
SC
Pop
ula
tion
-0.0
00-0
.000
-0.0
01
0.0
00
-0.0
01
0.0
02
-0.0
01
-0.0
00
-0.0
01
-0.0
01
-0.0
01
-0.0
01
(0.0
00)
(0.0
00)
(0.0
01)
(0.0
01)
(0.0
01)
(0.0
01)
(0.0
01)
(0.0
01)
(0.0
01)
(0.0
01)
(0.0
01)
(0.0
01)
SC
Fem
ale
Pop
ula
tion
0.00
10.
000
0.0
02
-0.0
00
0.0
02
-0.0
04
0.0
01
0.0
01
0.0
02
0.0
02
0.0
03
0.0
01
(0.0
01)
(0.0
01)
(0.0
01)
(0.0
01)
(0.0
02)
(0.0
03)
(0.0
01)
(0.0
02)
(0.0
02)
(0.0
02)
(0.0
03)
(0.0
03)
Tot
alP
opu
lati
on-0
.000
-0.0
00-0
.000
0.0
00
0.0
01*
-0.0
00
-0.0
00
0.0
00
-0.0
00
-0.0
00
-0.0
00
-0.0
00
(0.0
00)
(0.0
00)
(0.0
00)
(0.0
00)
(0.0
00)
(0.0
01)
(0.0
00)
(0.0
00)
(0.0
00)
(0.0
00)
(0.0
01)
(0.0
01)
Tot
alF
emal
eP
opu
lati
on0.
000
0.00
00.0
00
-0.0
01
-0.0
01*
0.0
01
0.0
00
-0.0
00
0.0
01
0.0
00
0.0
00
0.0
00
(0.0
00)
(0.0
00)
(0.0
01)
(0.0
01)
(0.0
01)
(0.0
01)
(0.0
01)
(0.0
01)
(0.0
01)
(0.0
01)
(0.0
01)
(0.0
01)
No.
ofO
bse
rvat
ion
s69
0639
422964
1963
1028
935
3313
1830
1483
1110
595
515
Not
es:
***,
**,
*d
enot
esi
gnifi
can
ceat
1%,
5%an
d10%
resp
ecti
vely
.S
tan
dard
erro
rsare
clu
ster
edat
the
Pan
chay
at
leve
lan
dre
port
edin
pare
nth
eses
.C
olu
mn
s(1
)&
(4)
rep
ort
resu
lts
from
the
full
sam
ple
of
Pan
chay
ats
inth
etw
od
istr
icts
.C
olu
mn
s(2
)&
(5)
rep
ort
resu
lts
wh
enth
eP
an
chay
ats
did
not
rese
rvati
onfo
rw
omen
in20
05,
and
Col
um
ns
(3)
&(5
)fo
rw
hen
ther
ew
as
rese
rvati
on
for
wom
enin
2005.A
llco
lum
ns
incl
ud
eb
lock
fixed
effec
tsto
contr
ol
for
wit
hin
blo
ckle
vel
secu
lar
tren
ds.
37

Tab
le5B
:E
ffect
of
Wom
en
’sR
ese
rvati
on
on
NR
EG
Aw
ork
sin
Ph
ase
IID
istr
icts
Ru
ral
Dro
ught
Lan
dIr
rigati
on
Con
nec
tivit
yW
ork
sD
evel
op
men
tW
ork
s
Fu
llN
otR
eser
ved
Res
erved
Fu
llN
ot
Res
erve
dR
eser
ved
Fu
llN
ot
Res
erved
Res
erve
dF
ull
Not
Res
erve
dR
eser
ved
Sam
ple
in20
05in
2005
Sam
ple
in2005
in2005
Sam
ple
in2005
in2005
Sam
ple
in2005
in2005
(1)
(2)
(3)
(4)
(5)
(6)
(7)
(8)
(9)
(10)
(11)
(12)
Pan
chay
atR
eser
ved
in20
05-0
.025
-0.0
26-0
.029
0.0
29
0.0
07
0.0
41
0.0
17
-0.0
83
0.1
27**
0.0
05
0.0
43
-0.0
38
(0.0
22)
(0.0
31)
(0.0
33)
(0.0
37)
(0.0
54)
(0.0
54)
(0.0
42)
(0.0
59)
(0.0
62)
(0.0
32)
(0.0
43)
(0.0
47)
SC
Pop
ula
tion
0.00
00.
000
0.0
00
-0.0
01
-0.0
01
-0.0
01
-0.0
00
0.0
01
-0.0
02
-0.0
00
-0.0
01
0.0
00
(0.0
01)
(0.0
01)
(0.0
01)
(0.0
01)
(0.0
01)
(0.0
02)
(0.0
01)
(0.0
01)
(0.0
02)
(0.0
01)
(0.0
01)
(0.0
01)
SC
Fem
ale
Pop
ula
tion
-0.0
01-0
.001
-0.0
00
0.0
02
0.0
01
0.0
02
0.0
01
-0.0
02
0.0
05
0.0
01
0.0
02
0.0
00
(0.0
01)
(0.0
02)
(0.0
02)
(0.0
02)
(0.0
02)
(0.0
03)
(0.0
02)
(0.0
03)
(0.0
03)
(0.0
02)
(0.0
02)
(0.0
03)
Tot
alP
opu
lati
on0.
000
0.00
0-0
.000
0.0
01***
0.0
01***
0.0
01*
0.0
01**
0.0
01
0.0
01**
0.0
00
0.0
01*
-0.0
00
(0.0
00)
(0.0
00)
(0.0
00)
(0.0
00)
(0.0
00)
(0.0
01)
(0.0
00)
(0.0
00)
(0.0
01)
(0.0
00)
(0.0
00)
(0.0
00)
Tot
alF
emal
eP
opu
lati
on0.
000
-0.0
000.0
01
-0.0
02***
-0.0
02***
-0.0
02
-0.0
02**
-0.0
01
-0.0
02**
-0.0
00
-0.0
01
0.0
00
(0.0
00)
(0.0
01)
(0.0
01)
(0.0
01)
(0.0
01)
(0.0
01)
(0.0
01)
(0.0
01)
(0.0
01)
(0.0
01)
(0.0
01)
(0.0
01)
No.
ofO
bse
rvat
ion
s52
1526
652550
1487
769
718
1902
962
940
1547
758
789
Not
es:
***,
**,
*d
enot
esi
gnifi
can
ceat
1%,
5%an
d10%
resp
ecti
vely
.Sta
nd
ard
erro
rsare
clu
ster
edat
the
Pan
chay
at
leve
lan
dre
port
edin
pare
nth
eses
.C
olu
mn
s(1
)&
(4)
rep
ort
resu
lts
from
the
full
sam
ple
ofP
an
chay
ats
inth
etw
od
istr
icts
.C
olu
mn
s(2
)&
(5)
rep
ort
resu
lts
wh
enth
eP
an
chay
ats
did
not
rese
rvati
on
for
wom
enin
2005
,an
dC
olu
mn
s(3
)&
(5)
for
wh
enth
ere
was
rese
rvati
on
for
wom
enin
2005.A
llco
lum
ns
incl
ud
eb
lock
fixed
effec
tsto
contr
ol
for
wit
hin
blo
ckle
vel
secu
lar
tren
ds.
38

Tab
le6A
:E
ffect
of
Wom
en
’sR
ese
rvati
on
on
NR
EG
AW
ate
rW
ork
sin
Ph
ase
1D
istr
icts
San
itati
on
Work
sW
ate
rW
ork
s
Fu
llS
amp
leR
eser
ved
in2005
Not
Res
erve
din
2005
Fu
llS
am
ple
Not
Res
erved
in2005
Res
erved
in2005
(1)
(2)
(3)
(4)
(5)
(6)
Pan
chay
atre
serv
edin
2005
0.06
7-0
.142
0.1
37
-0.0
10
0.0
03
-0.0
16
(0.1
79)
(0.2
58)
(0.2
82)
(0.0
19)
(0.0
26)
(0.0
29)
SC
Pop
ula
tion
-0.0
020.0
04
-0.0
09*
-0.0
00
-0.0
00
0.0
00
(0.0
03)
(0.0
03)
(0.0
05)
(0.0
00)
(0.0
01)
(0.0
01)
SC
Fem
ale
Pop
ula
tion
0.00
3-0
.007
0.0
18
0.0
01
0.0
01
-0.0
00
(0.0
07)
(0.0
07)
(0.0
11)
(0.0
01)
(0.0
01)
(0.0
01)
Tot
alP
opu
lati
on0.
001
0.0
01
0.0
03
-0.0
00
0.0
00
-0.0
00
(0.0
01)
(0.0
01)
(0.0
03))
(0.0
00)
(0.0
00)
(0.0
00)
Tot
alF
emal
eP
opu
lati
on-0
.002
-0.0
02
-0.0
05
0.0
00
-0.0
00
0.0
00
(0.0
02)
(0.0
03)
(0.0
06)
(0.0
00)
(0.0
00)
(0.0
01))
No.
ofob
serv
atio
ns
272
148
124
12234
6967
5267
Not
es:
***,
**,
*d
enot
esi
gnifi
can
ceat
1%,
5%
an
d10%
resp
ecti
vely
.S
tan
dard
erro
rsare
clu
ster
edat
the
Pan
chay
at
level
an
dre
port
edin
par
enth
eses
.C
olu
mn
s(1
)&
(4)
rep
ort
resu
lts
from
the
full
sam
ple
of
Pan
chay
ats
inth
etw
od
istr
icts
.C
olu
mn
s(2
)&
(5)
rep
ort
resu
lts
wh
enth
eP
anch
ayat
sd
idn
otre
serv
atio
nfo
rw
omen
in2005,
an
dC
olu
mn
s(3
)&
(5)
for
wh
enth
ere
was
rese
rvati
on
for
wom
enin
2005.A
llco
lum
ns
incl
ud
eb
lock
fixed
effec
tsto
contr
olfo
rw
ith
inb
lock
leve
lse
cula
rtr
end
s.
39

Tab
le6B
:E
ffect
of
Wom
en
’sR
ese
rvati
on
on
NR
EG
AW
ate
rW
ork
sin
Ph
ase
IID
istr
icts
San
itati
on
Work
sW
ate
rW
ork
s
Fu
llS
amp
leR
eser
ved
in2005
Not
Res
erve
din
2005
Fu
llS
am
ple
Not
Res
erved
in2005
Res
erved
in2005
(1)
(2)
(3)
(4)
(5)
(6)
Pan
chay
atre
serv
edin
2005
0.05
7-0
.137
-0.4
73
0.0
18
0.0
19
0.0
23
(0.2
39)
(0.3
32)
(0.5
79)
(0.0
24)
(0.0
33)
(0.0
34)
SC
Pop
ula
tion
0.00
2-0
.002
-0.0
04
-0.0
00
-0.0
01
-0.0
01
(0.0
06)
(0.0
04)
(0.0
15)
(0.0
01)
(0.0
01)
(0.0
01)
SC
Fem
ale
Pop
ula
tion
-0.0
050.0
01
0.0
04
0.0
01
0.0
01
0.0
01
(0.0
13)
(0.0
08)
(0.0
33)
(0.0
01)
(0.0
02)
(0.0
02)
Tot
alP
opu
lati
on-0
.005
**0.0
02
-0.0
01
-0.0
00
0.0
00
-0.0
00
(0.0
02)
(0.0
04)
(0.0
06)
(0.0
00)
(0.0
00)
(0.0
00)
Tot
alF
emal
eP
opu
lati
on0.
010*
*-0
.003
0.0
02
0.0
00
-0.0
00
0.0
01
(0.0
05)
(0.0
07)
(0.0
14))
(0.0
00)
(0.0
01)
(0.0
01)
No.
ofob
serv
atio
ns
128
67
61
7803
3913
3890
Not
es:
***,
**,
*d
enot
esi
gnifi
can
ceat
1%,
5%
an
d10%
resp
ecti
vely
.S
tan
dard
erro
rsare
clu
ster
edat
the
Pan
chay
at
level
an
dre
port
edin
par
enth
eses
.C
olu
mn
s(1
)&
(4)
rep
ort
resu
lts
from
the
full
sam
ple
of
Pan
chay
ats
inth
etw
od
istr
icts
.C
olu
mn
s(2
)&
(5)
rep
ort
resu
lts
wh
enth
eP
anch
ayat
sd
idn
otre
serv
atio
nfo
rw
omen
in2005,
an
dC
olu
mn
s(3
)&
(5)
for
wh
enth
ere
was
rese
rvati
on
for
wom
enin
2005.A
llco
lum
ns
incl
ud
eb
lock
fixed
effec
tsto
contr
olfo
rw
ith
inb
lock
leve
lse
cula
rtr
end
s.
40