WOMEN'S PARTICIPATION IN HOUSEHOLD DECISION MAKING
75
WOMEN'S PARTICIPATION IN HOUSEHOLD DECISION MAKING: A Comparative Study of Sarki, Gurung and Chhetri Married Women in Phulkharka VDC, Dhading District A Dissertation Submitted to the Central Department of Population Studies, Faculty of Humanities and Social Sciences of Tribhuvan University in Partial Fulfillment of the Requirements for the Degree of Master of Arts in Population Studies By: Bhakta Bahadur Budhathoki Tribhuvan University Kirtipur, Kathmandu, Nepal September, 2008
Transcript of WOMEN'S PARTICIPATION IN HOUSEHOLD DECISION MAKING

WOMEN'S PARTICIPATION IN HOUSEHOLD DECISION MAKING:
A Comparative Study of Sarki, Gurung and Chhetri Married
Women in Phulkharka VDC, Dhading District
A Dissertation
Submitted to the Central Department of Population Studies,
Faculty of Humanities and Social Sciences of
Tribhuvan University in Partial Fulfillment of
the Requirements for the Degree of
Master of Arts
in
Population Studies
By:
Bhakta Bahadur Budhathoki
Tribhuvan University
Kirtipur, Kathmandu, Nepal
September, 2008

Tribhuvan University
Faculty of Humanities and Social Sciences
Central Department of Population Studies
Kirtipur, Kathmandu
Nepal
LETTER OF RECOMMENDATION
This is to certify that Mr. Bhakta Bahadur Budhathoki has completed the dissertation
entitled " Women's Participation in Household Decision Making: A Comparative
Study of Sarki, Gurung and Chhetri Married Women in Phulkharka VDC, Dhading
District" under my guidance and supervision. I, therefore recommend the Dissertation
Committee for the evaluation of this dissertation.
………………………………………….
Dr. Puspa Lal Joshi
(Supervisor)
Date: September, 2008 Visiting Professor of Central Department of
Population Studies (CDPS)
Tribhuvan University
Kirtipur, Kathmandu

APPROVAL-SHEET
This dissertation entitled " Women's Participation in Household Decision Making: A
Comparative Study of Sarki, Gurung and Chhetri Married Women in Phulkharka
VDC, Dhading District" by Bhakta Bahadur Budhathoki has been accepted as partial
fulfillment of the requirements for the Master's Degree of Arts in Population Studies.
Dissertation Committee
…………………………………
Dr. Bal Kumar K.C.
(Professor and Head of CDPS)
………………………………
Dayaram Simkhada (External Examiner)
………………………………
Dr. Puspa Lal Joshi
(Supervisor)

ACKNOWLEDGEMENTS
This study has been done for the partial fulfillment of the requirements for the degree of
Master's in Population Studies. I would like to express my sincere gratitude to Dr. Bal
Kumar K.C., professor and Head of Central Department of Population Studies for the
acceptance of this dissertation.
I am very indebted to my supervisor Dr. Puspa Lal Joshi visiting Professor of CDPS, for
his valuable suggestions, guidelines, co-operation, and encouragement to prepare this
dissertation, despite his busy time schedule. Similarly, I would like to express my
gratitude to external examiner Dayaram Simkhada for his kind co-operation, suggestion
and guidance to prepare this dissertation.
I would like to express my gratitude to CDPS's teachers and staffs for their responsible
co-operation.
Similarly, I would like to express thank a lot to all the respondents who respond to the
entire questionnaires curiously and participated interestingly in my research work. I
respect to their opinions willingness and also thankful to Mr. Thakur Simkhada, the
secretary of Phulkharka VDC, Dhading District because whose help is played a grate role
to completion this dissertation.
Likewise, I would like to express my sincere thanks to my family members for the given
opportunity to study in Master's Degree. In the same way, I would like especial thanks to
my brother Dhan Bahadur Budhathoki for his immense help, suggestions and cooperation
on various phases of this dissertation during the preparation period.
I wish to express thank a lot to all friends for their assistance and encouragement to
prepare this dissertation in various phases during the preparation period.
Bhakta Bahadur Budhathoki
September, 2008 Phulkharka-5, Dhading

ABSTRACT
The study is a comparative analysis of "Women's Participation in Household Decision
Making" among Sarki, Gurung and Chhetri married women, which is based on primary
data collected from the Phulkharka VDC. The main objectives of the study are to
examine demographic and socio-economic status and the participation of decision-
making power of married women (15-49 years) in household chores of the study area.
Out of the nine wards three wards (3,4 and 5) have been taken by using purposive
sampling. Out of 872 household 90 household were included purposively as sample for
the study, and a total of 122 respondents were interviewed.
Inside the topic of decision making, many variables are analyzed regarding the study area
like decision on birth, cropping, buying and selling livestock, education of children,
health problem of children, use of family planning methods, using the type of fuel for
cooking food, family expenditure and taking loan or deposits in women's name. It also
gives the Socio-economic status of all women a whole in the study area.
It is observed that among the three ethnic groups, majority of Chhetri respondents
participated in local level committees and higher socio-economic status than Gurung and
Sarki respondents but the socio-economic status of Sarki is poor.

TABLE OF CONTENTS
Page No.
LETTER OF RECOMMENDATION
APPROVAL-SHEET
ACKNOWLEDGEMENTS
LIST OF TABLES
LIST OF FIGURES
ACRONYMS
ABSTRACT
CHAPTER-I: INTRODUCTION
1.1 General Background 1
1.2 Statement of the Study 2
1.3 Objectives of the Study 4
1.4 Rational of the Study 4
1.5 Limitation of the Study 5
1.6 Organization of the Study 5
CHAPTER-II: LITERATURE REVIEW
2.1 Theoretical Literature Reviews 6
2.2 Empirical Literature Reviews 11
CHAPTER-III: METHODOLOGY
3.1 Introduction of the Study Area 17
3.2 Study Design 17
3.3 Method of Data Collection 18
3.4 Research Procedure 18
3.5 Sampling Procedure 18
3.6 Sources of Data 18
3.7 Data Processing, Presentation and Analysis 18
3.8 Conceptual Framework 19
CHAPTER-IV: INTRODUCTION TO STUDY POPULATION
4.1 Demographic Characteristics 20
4.1.1 Age and Sex Composition of Household Population with Sex Ratio 20
4.1.2 Age Composition of Respondents 21
4.1.3 Marital Status of Respondents 21
4.1.4 Age at Marriage of Respondents 22
4.1.5 Age at Birth of First Child 24
4.2 Economic Characteristics 26
4.2.1 Distribution of Land 26
4.2.2 Distribution of Respondent by 'Pewa' Livestock 28
4.2.3 Main Source of Income and Monthly Income Level of Respondents 28

4.2.4 Fuel Used for Cooking of the Respondents 30
4.3 Social Characteristics 30
4.3.1 Education Status of the Respondents 30
4.3.2 Religion Composition of the Respondents 32
4.3.3 Participatory Institution of the Respondents 32
4.3.3.1 Distribution of the Respondents by Participation of the Female Committee 33
4.3.3.2 Distribution of the Respondents by Participation in Political Parties 33
4.3.3.3 Distribution of the Respondents by Participation in School
Management Committee 34
4.3.4 Use of the Family Planning of the Respondents 35
4.3.4.1 Ever Use of the Family Planning Methods of the Respondents 35
4.3.4.2 Current Use of the Family Planning Methods of the Respondents 36
CHAPTER-V: WOMEN HOUSEHOLD DECISION MAKING PROCESS
5.1 Decision on First Birth 38
5.2 Decision on Respondents by Ever Use of Family Planning Methods 39
5.3 Decision on Respondents by Current Use of Family Planning Methods 40
5.4 Decision on Cropping 40
5.5 Decision on Buying Livestock 41
5.6 Decision on Selling Livestock 41
5.7 Decision on Using Type of Fuel for Cooking Food 42
5.8 Decision on Going or Not-going to School for Children 42
5.9 Decision on Treatment of Heath Problem of Children 43
5.10 Decision on Admitting Oneself to Political Parties 44
5.11 Decision on Family Expenditures 45
5.12 Decision on Taking Loan or Deposits in Women's Name 46
5.13 Decision on respondents by Ever Using of FP Method by Education 47
5.14 Decision on Cropping by Occupation 48
CHAPTER-VI: SUMMARY, CONCLUSIONS AND RECOMMENDATIONS
6.1 Summary of Findings 49
6.1.1 Demographic Characteristics 49
6.1.2 Economic Characteristics 50
6.1.3 Social Characteristics 50
6.1.4 Women in Household Decision Making Process 51
6.2 Conclusions 53
6.3 Recommendations 54
6.4 Recommendations of Future Research 55
REFERENCES 56
QUESTIONNAIRE 59

LIST OF TABLES
Page No.
Table 4.1 Distribution of Household Population with Sex Ratio 20
Table 4.2 Distribution of Respondents 21
Table 4.3 Distribution of Respondents by Marital Status 22
Table 4.4 Distribution of Respondents by Age at Marriage 22
Table 4.5 Distribution of Respondents by Age at Birth of First Child 24
Table 4.6 Mean CEB by Current Age of Ever Married Women of Sarki 25
Table 4.7 Mean CEB by Current Age of Ever Married Women of Gurung 25
Table 4.8 Mean CEB by Current Age of Ever Married Women of Chhetri 26
Table 4.9 Distribution of Respondents by Landholding 27
Table 4.10 Distribution of Respondents Having Livestock as 'Pewa' 28
Table 4.11 Distribution of Respondents by Main Source of Income 28
Table 4.12 Distribution of Respondents by Monthly Income Level 29
Table 4.13 Distribution of Respondents by Fuel Consumption for Cooking 30
Table 4.14 Distribution of Respondents by Education Status 31
Table 4.15 Distribution of Respondents by Religion 32
Table 4.16 Distribution of Respondents by Participation in Female Committee 33
Table 4.17 Distribution of Respondents by Participation in Political Parties 34
Table 4.18 Distribution of Respondents by Participation in School
Management Committee 35
Table 4.19 Percentage Distribution of Respondents by Ever Use of FP
Methods in the Study Area 36
Table 4.20 Percentage Distribution of Respondents by Current Use of FP
Methods in the Study Area 37
Table 5.1 Distribution of Respondents by Decision on First Birth 38
Table 5.2 Distribution of Respondents by Decision on Ever Use of Family
Planning Method 39
Table 5.3 Distribution of Respondents by Decision on Current Use of Family
Planning Method 40
Table 5.4 Distribution of Respondents by Decision on Cropping 41
Table 5.5 Distribution of Respondents by Decision on Buying Livestock 41
Table 5.6 Distribution of Respondents by Decision on Selling Livestock 42
Table 5.7 Distribution of Respondents by Decision on Using Type of Fuel for
Cooking Food 43
Table 5.8 Distribution of Respondents by Decision on Going or Not-going
to School for Children 43

Table 5.9 Distribution of Respondents by Decision on Treatment of Health
Problem of Children 44
Table 5.10 Distribution of Respondents by Decision on Admitting Oneself to
Political Parties 45
Table 5.11 Distribution of Respondents by Decision on Family Expenditure 45
Table 5.12 Distribution of Respondents by Decision on Taking Loan or
Deposit in Women's Name 46
Table 5.13 Distribution of Respondents by Using of Family Planning
Method by Education 47
Table 5.14 Distribution of Respondents by Decision on Cropping by
Occupation 48

LIST OF FIGURES
Page No.
Figure 4.1 Percentage Distribution of Respondents by Age at Marriage 23
Figure 4.2 Percentage Distribution of Respondents by Landholding 27
Figure 4.3 Percentage Distribution of Respondents by Main Source of Income 29
Figure 4.4 Percentage Distribution of Respondents by Education status 31
Figure 4.5 Percentage Distribution of Respondents by Participation in
Female Committee 33
Figure 4.6 Percentage Distribution of Respondents by Participation in
Political Parties 34
Figure 4.7 Distribution of respondents by Current Use of Family Planning
Methods by each Ethnicity 37
Figure 5.1 Percentage Distribution of Respondents by Decision on Ever Use of
Family Planning Methods 39
Figure 5.2 Percentage Distribution of Respondents by Decision on Going
or Not-going to School for Children 43
Figure 5.3 Percentage Distribution of Respondents by Decision on Treatment of
Health Problem of Children 44
Figure 5.4 Percentage Distribution of Respondents by Decision on Family
Expenditure 46

ACRONYMS
ADB Asian Development Bank
BBC Beyond Beijing Committee
CBS Central Bureau of Statistics
CEB Children Ever Born
DDC District Development Committee
DNGO District Non-governmental Organization
DHS Demographic Health Survey
GEM Gender Empowerment Measure
GO Governmental Organization
HH Household
ILO International Labour Organization
INGO International Governmental Organization
M.A. Master of Arts
NDHS Nepal Demographic Health Survey
NGO Non-governmental Organization
NPC Nepal Planning Commission
SLC School Leaving Certificate

Women's Participation in Household Decision Making:
A Comparative Study of Sarki, Gurung and Chhetri Married
Women in Phulkharka VDC, Dhading District
CHAPTER- I: INTRODUCTION
1.1 General Background
The majority of women in Nepal live in rural areas where the choice for livelihood is
limited to agriculture work on the farms but the ownership of land either by father or
father in law, husband, landlord and brother. Most of the females are economically
dependent. They have to ask to their male partners to spend their own income also. Very
few women are economically independent and they have little bit higher decision-making
power. Socio-economic status of female affects the women's participation in society.
However they are capable and potential, their capability and potentiality do not respect if
they have low socio-economic status. As females are less educated, they have low
decision-making power. Those women, who have higher education and sound economic
background, have higher chances in decision-making.
According to Subedi (1997:1-3) to raise a socio-economic status of the country, women
play a vital role. Nepal is a male dominated society, where women have low socio-
economic status as well as low decision-making power. Women have to do three
responsibilities as reproduction, household work and productive role. Beside this, they do
not have control over decision making on their reproduction and production. There exists

an asymmetrical relationship between the women performing the roles of protectors,
nurturer, healer and guide. Nepali women are daughters, wives, and mothers but are less
recognized by their own identity. Many societies have placed women to the lowest rank
and to a passive role, limited to the home and farm and their family responsibilities.
The overall literacy rate 2001 was 54.1 percent for both sexes, 65.5 percent for the males
and 42.8 percent for the females. Due to widened gap (22.7 percent) in literacy between
women and men, there is less access of women in decision-making (CBS, 2003: 238).
According to Gurung (2007: 3) Dalit women also cover of more than half of the Dalit
community in Nepal. After the political changes in 2007, the situations of women have
certainly changed but not to the extent, it should have been. The fact is that Dalit women
also consist of one fourth of the total women population. The entire women are the
victims of gender bias in the society. The fundamental difference between high caste
women and Dalit women lie on the ground of caste based discrimination and
untouchables, which Dalit women have to face patriarchal feudal system considers
women folk in general as commodity, means of entertainment and second-class citizen.
That is why? Even Dalit women face discrimination injustice, education, job, property
rights, and wages and decision-making process.
Nepal is a multiethnic, multilingual and multicultural country with more than 50 spoken
languages and cultural traditions. They have often been classified into two broad groups,
the Tibeto-Burman, and the Indo-Aryan. Women from the Tibeto-Burman communities
are socially less constrained than, their Indo-Aryan sisters in terms of mobility, marriage
or remarriage options and most importantly, income earning opportunities. In the Indo-
Aryan groups, traditionally, women have fewer social and economic options.1
It is essential for the development that male and female should enjoy equal opportunities
for decision making in policy making, plan formulation and programme implementation
as well as in monitoring and evaluation. But women are out of mainstream of
development, participation of decision-making process. Women are suffering from
exploitation and injustice. To empower women, social-cultural norms, values and
practices are changed positively. As well as decision-making process should be addressed
to lunch many formal and informal programme. Policy and programme should be
formulated and implemented properly to address the problems of women. This study has
tried to show the situation of Sarki, Gurung and Chhetri married women's participation in
household decision-making.
1 http://www.onlinewomeninpolitics.org/nepaldoc.htm

1.2 Statement of the Problem
In Nepal, Census 2001 shows that women's population is more than half of the total but
their participation as decision-making is negligible. Women's participation is compulsory
to make a decision, which helps to establishment of equality between men and women, to
build the development and self-development of women.
Every stage of women's life is control by male. In her childhood, a woman is under the
decision of father. In adulthood, woman is under the decision of husband, in old age, a
woman is under the decision of son. The decision –making power of women is low in
Nepal. Low decision-making power further descends on the economic dependence.
Women, particularly in rural area in Nepal, tend to be the poorest of the world's poor.
They constitute more than half of all persons living in extreme poverty. Women are
under-represented in formal sector employment as well as in policy and political
decision-making positions (UNFPA, 2003:9).
The participation of women in social, economic and political life has been minimal and
women have remained voiceless. Problems related to women in power and decision
making have qualitative and quantitative dimensions. The first dimension involves the
capacity of women to assert and exercise their rights, and the lack of an enabling
environment in which to do this .On the other hand, some quantitative improvements
have been made with the introduction of reservations in local election. The overall
participation of women in decision-making positions is very low and remains
unsatisfactory .The statutory provisions alone do not adequately facilitate women's entry
into these positions. Quantitative growth horizontally and only observed at the lowest
levels of representation. Higher levels, of both local and national politics, are still
regarded as the 'male sector'. Therefore, the political parties and legislatures have failed
to substantiate their commitment to ensuring women's access to powerful decision-
making positions (BBC, 2004:28).
Most of the developing countries, there is imbalance in status between male and female.
Women in Nepal are also engaged in domestic chore along with the social and economic
activities required for survival. Despite their important roles undertaken for social and
economic life capacity and potential, women have more disadvantages than their
counterparts due to an inadequate access to exposure, technology, credit and
environment.
In Nepal, the majority of the women population is far from mainstreaming. There is no
any effective government policy to support decision-making power for women. As like
men, women are also considered the factors that contribute in nation's development.
However, the fact is that participation of women in household decision-making is
important issue for the prosperous development of the nation.
It will help to make significant improvement in households, in society and in nation.
Therefore, policies and programmes should be formulated to address the women's issues
and should be implemented with proper way. Programmes should be beneficial for needy
and targeted people and enhance the capabilities and potentialities of women to enable
them to be in the mainstream of social improvement and nation development with their
productive capacities of significant and effective decision-making. Improvement in
decision-making power of female will play the vital role to make society developed and
address the problems of social injustice.
The research on this issue was not taken before in the Phulkharka VDC, Dhading District.
In social scenario of Nepal, low socio-economic status of women found as a variant in
less access in household decision-making. This comparative study shows the current
situation of Sarki, Gurung and Chhetri's married women in household decision-making.
Which further pays way outs and provides guidelines to other researchers to conduct
research on this issue and contribute in improving women's status in decision-making
process.
1.3 Objectives of the Study
The general objective of the study is to portray and compare the women's participation in
household decision-making among ethnic group (Sarki, Gurung and Chhetri) married
women in rural areas like Phulkharka VDC of Dhading District. The specific objectives
are as:
To examine the socio-economic status of women among Sarki, Gurung and Chhetri in
the study area.
To identify the level of participation in the household decision-making power by the
married women of reproductive age groups among Sarki, Gurung and Chhetri in the
study area.
To compare the women's role in household decision- making among Sarki, Gurung
and Chhetri in the study area.
1.4 Rational of the Study
Decision-making role of married women for household in any area are affected by
various culture, traditional norms, value and practice, occupation and religion etc. It is

integral part of development efforts. In patriarchal societies, women are discarded from
participation in social, political and economic aspects. State policy must be include
gender perspectives in their national development policies and should implement various
programmes to improve women's confidence and decision-making power. In this study,
women's participation in household decision-making is focused within Sarki, Gurung and
Chhetri married women. The importances of the study are as follows:
This study is important to explain socio-economic condition and household decision-
making power of women.
It compares the women participation in household decision-making among Sarki,
Gurung, and Chhetri ethnic groups.
It will be helpful to those organizations, which are working in this field to identify the
situation of women in household decision-making and implement some welfare
programme to improve their status.
It is also helpful for other researcher to conduct further research in the issue of
women's participation in household decision –making.
1.5 Limitation of the Study
The issue of women's participation in decision-making process is very vague. Because of
the limited time, source and cost, this study is limited in the following areas:
This study is limited to married women of ages (15-49 years) of ward numbers 3,4
and 5 in Phulkharka VDC, Dhading District.
The small sample of this study covered only 90 households.
This study focused to analyze the situation of women in household decision-making.
1.6 Organization of the Study
Generally, on the course of research, study is accompanied by dividing into six chapters.
The different chapters are organized as follows:
Chapter-I: It holds the background of the study, statement of the problem, objective
of the study, rational of the study, limitation of the study and organization of the
study.
Chapter-II: It deals with the literature review from the various books, journals,
publication etc.
Chapter-III: It deals with the description of study area and explanation of the research
design and procedure of the data generated and the statistical tools during the process.
Chapter-IV: It holds the demographic, social, economic characteristics of sample
households' population in the selected ward in Phulkharka VDC.

Chapter-V: It deals with the analysis of collected data regarding the household
decision-making process.
Chapter-VI: It leads to the summary of findings and conclusions of the whole study.
It also includes recommendations on the basis of the findings.
CHAPTER-II: LITERATURE REVIEW
This chapter deals with the available literature about decision-making roles of women
and men. In this section, efforts have been made to review past researches, publication
and related documents pertaining to the study area. This part of research is very
important because it provides knowledge about the related topic, which increases ability
of researcher to perform research.
2.1 Theoretical Literature Reviews
The majority of women in Nepal live in rural areas. Rural women, as else where play
multiple roles. In the domestic sphere they are household managers, mother and wives: in
community they maintain social and cultural services, predominantly on a voluntary basis
and in economy, if they are not formally engaged as employees or entrepreneurs; they are
active in family businesses and farms. But they have to low access to income, wealth and
employment, which are the main causes of their low economic status. So, it is directly
and indirectly related to their decision making power.
Participation in decision-making, about half of women participate in decisions about their
own health care, making major household purchases, making daily household purchases,
and visiting family and friends. However, one-third of women do not participate in any of
these decisions at all. (NDHS, 2006:12).
Women play a significant role in domestic work, if not a predominant, role in agricultural
production. One participatory research project found that women do more agricultural
work than men in the high mountain areas, equal or more than men in middle hills, and

less than men in the Terai. Women and men are participants and decision makers, share
the responsibility for planting, transplanting, weeding, harvesting, carrying grains to the
mill for grinding, and collecting wood, water and fodder. Women's involvement is also
significant in the care and management of livestock and poultry, and as well as in kitchen
gardening. The participation of women is varying according to geographical region. In
the complex social system of the hills, women's participation in agriculture further varies
tremendously according to social group. Even though women's important role in
agriculture, traditional social norms and customary laws, which are often gender biased,
are a barrier to women's equitable access to productive resources. Which are the one of
the most important cause of women's backwardness (BBC, 2004:23-24).
Decision making power is directly related to the family's norms and values.
Discriminations between males and females start from the family. Females are not
included in the decision making process, and the opportunities and benefits available in
the society are monopolized by males. Women's participation in socio-cultural and
political activities depends upon the attitudes of their men relative (Human Rights in
Nepal, 2003:70).
In Janajati community, women play vital social role in the family. There is high social
mobility in Dalit women due to compulsion to earn for family livelihood. Male head of
the household has absolute authority, women as they grow older gain power but are still
considered and act as dependent to male figure and restricted social mobility due to the
fact that dignity is attached to women's sexuality in Chhetri society (Acharya 2004: 12).
The Universal Declaration of Human Rights States that everyone has the right to take part
in the Government of his or her country. The empowerment and authority of women and
the improvement of women's social, economic and political status are essential to the
achievement of both transparent and accountable government administration and
sustainable development. The power relations that prevent women from leading fulfilling
lives operate at many levels of society, from the most personal to the highly public.
Achieving the goal of equal participation among women and men in decision-making
shall provide a balance that more accurately reflects the composition of society. The low
proportion of women among economic and political decision-makers at the local,
national, regional and international levels reflects the attitudes and structural barriers that
need to be addressed through the positive measures. In addressing the inequality between
men and women in the sharing of power and decision-making at all levels, Government
and other authorities should promote an active and visible policy of mainstreaming a
gender perspective in all policies and programmes so that before decisive actions are
taken, an analysis of the effects on women and men, is made. (ILO: 2002:110-111).

Nepal's political parties and NGOs have made only taken contributions to linking
women's problems and needs with formal state structures and authorities. Although
women are empowering themselves through their interaction with the state's power
structure, their participation in the decision making process has yet to be properly
streamlined, and they remain largely excluded from politics, government and governance.
Had they been given full access to formal political structures and processes their vision of
the state would undoubtedly be guided more by factors like power sharing, self-
channeling of resources and playing a role in policy formulation and implementation.
However, Nepali women are distant from the axis of state power, as the Human
Development Report of Nepal Says: "gender empowerment in Nepal is abysmally low in
relation to achievements at the regional and international level. The global GEM is more
than double that of Nepal. Women in all South Asian countries except Pakistan are more
empowered than women in Nepal" (Gurung, 2007:90).
The Level of education of individual women in a particular setting to their fertility,
evidence suggest that the contextual effect of schooling can be as important as the
individual level in determining reproductive behaviour. A modest exposure to education
has little impact on fertility in a context in which average levels of women's education is
low. In the other words, the overall effect of education in a society may be as powerful an
influence on the reproductive patterns of individuals as their own level of education
(Jejeebhoy: 1995: 3).
When the male head of the household is faced with a decision to be made (often brought
to his attention by his wife), he first presides over as open discussion, looking for
consensus, and then announces a decision that expresses the consensus. Other family
members actively participate in this process. Children, old people, even hired ploughmen,
if present, may contribute to the discussion (which for convenience usually takes place
around mealtime or just after a meal). But he listens most carefully to his wife's
contributions and in practice often defers to her in the decision, relying on her experience,
especially in agricultural matters, and formulating a consensus that reflects her position.
She in her turn defers to him as the one whose role is to make and announce the decision,
thus, in public, private and mirrored in the functioning of the decision-making process.
So, intended to reveal Nepalese village life as a dynamics can be of ultimately practical
benefit to the decision (but decisive in their own way) village people of Nepal (Casper
and Miller, 2002:239-240, 252).
Two different issues of women are: women's political participation and representation at
decision-making levels. Participation is necessary but insufficient condition for

representation does not flow automatically from participation. Women all over the world
have participated widely in political movements in times of crisis but, once the crisis is
over, they are relegated again to the domestic arena (ADB, 1999:41).
The rural households are divided in five categories with related to decision-making: farm
management, domestic expenditure, education, gifts, religious and social travel and
disposal of household products and capital transaction. In all of these, women's
contribution to rural household's decision- making process seems to have decline in the
last decade. The StriiShakti report does not explain why this is happening. One cause
could be the increasing commercialization of agriculture, which is changing the pattern of
household expenditure and investment. Women know less about new technology and
commercial agriculture than men, and are, therefore getting marginalized from farm
management. Changing pattern of household expenditure in favor of market goods and
investment beyond small household industries could also reduce women's input into
decision-making process. But all these are only conjectures and can only be explained by
in depth research of these processes. Conventional social custom is one of the major
reason obstructing women from participation fully in economic development, which
results low decision-making power in women's hand. Higher the participation of women
for economic development, higher will be the decision-making power of women. On the
other hand, the social conception that only women are responsible for the reproduction of
human beings, conception, delivery and upbringing of child has made it extremely
difficult for women to participate in the development process as equal member of society.
So, female status is very low compared to the male (Acharya 1997:19).
Nepalese society is based on patriarchal structure, which by design has relegated women
to a subordinate position, there were meaningful variation s between communities in the
extent of women's participation in the wider market economy and the overall household
decision making process. These variations fall into a consistent pattern, suggesting that
women's household decision-making input in a given community is directly related to the
strength of the inside/outside dichotomy. To varying degrees the 'inside' private domestic
sphere is characterized the proper domain of women and the 'outside' sphere of politics,
commerce and wider public concerns-VDC meting on political candidacy,
water/irrigation system construction, budget allocation, village development programmes,
selection of extension workers –are mostly ascribed to men. Women in dichotomous
village communities (based on cultural and economic criteria) including the Maithali and
Parbatia, have considerably less control in terms of decision making than those in non-
dichotomous communities including the Lohorung Rai, Baragaonle and Kham Magar.
The Newar, Tamag and Tharu fall between these two groups (StriiShakti, 1995:201).

According to Shrestha (1994) decision making power of women may increase with an
equality of participation at all levels of planning and policy making not as recipient
beneficiaries, labour an input contribution and consultants but as active change agent at
the concerned level. It does not mean the involvement of one or two women or the wives
of the leaders, but the involvement of women and men in the sample proportion in
decision making as their proportion in decision making as their proportion in the
communities at large. She further added that the women of Nepal are so dependent to
men if the partners of members deny giving shelter to them; it is a question of basic
survivals. This system has made women to helpless, houseless and dependent that
without men they will not survive. So, this is human systematic the right of survival is
laid on the heart of men. It can be concluded that only strong status of female may
increase the decision-making power otherwise they have to play sub-ordination role of
their male partners.
Existing cultural groups and access to resources of women are determined by the social
status of women. Generally, women belonging to Tibeto-Burman cultural groups had
considerably greater freedom in matters such as choice of marries patterns, deciding the
time for marriage and in selection of the Indo- Aryan cultural group. While Indo-Aryan
women were married early, had no choice in their life partners and were severely
restricted in their social mobility, such findings did not generally apply to women
belonging to Tibeto-Burman groups. In all cultural groups, however, it was found that
women's access to modern resources in the form of knowledge and traditional and newly
created assets that is land, machines, employment etc. was severely limited (Acharya,
1994:1).
A wider overview of women's status in decision-making power in their household, they
claim that economic factor affects women's role in decision-making both directly and
indirectly. If a woman has a greater economic participation she has a greater power of
decision-making. Similarly, social and demographic factors also influence the role of
decision-making e.g. small size off children imply higher economic participation and
consequently greater decision-making power for women (Acharya and Bennett,
1981:127-143).
According to UN (1995: 17) the status of women are improving and also enhances their
decision-making capacity at all spheres of life. This in turn is essential for the long-term
success of population programmes. Experience shows that population and development
programmes are most effective when steps have simultaneously been taken to improve
the status of women.
Especially, decision- making of females in the study area at home and farm affairs
among the rural families, she goes on to emphasis education of women as an important
factor in the matter of decision process. In her words, 'Educated women are better placed
as compared to their illiterate counter parts'. She has stated that she has never seen
women as final decision makers in many household matters except for cases for food and
nutrition of children. The male members of the family solely do the financial activities.
She claims that women have greater input in household decision making if they are from
medium status. She also claims that the socio-economic status is closely linked with
women's power of decision –making (Kaur, 1987: 120).
2.2 Empirical Literature Reviews
Women in Nepal are less likely to be educated than men. Half (49 percent) of women in
the households interviewed in the NDHS had never attended school compared to only 23
percent of men. More than a third of men in the households had attended at least some
secondary school, while only one in five women reached this level of education. Men are
also more likely to be employed than women (99 percent versus 83 percent) and in 70
percent of cases; men earn more than their wives (NDHS, 2006:12).
According to Gurung (2007:11-12), in Nepalese society, women's role appears to be
changing in the cities but it is only a surface change. Unfortunately, the majority of
women are living in the rural areas. Almost 93 percent of Nepal is rural, and here change
is coming at a painfully slow pace. The rural women have little or no self-confidence and
do not consider themselves on par with men. The village women's life is nothing more
than that of a servant or a possession of the family. They do not appear to know the value
of their individual live.
Generally, husbands were the main decision maker as to whether to terminate a
pregnancy. It was found that if the husband decided to keep the unintended pregnancy to
term, his wife would have few or no options to alter the decision. It was not possible in
this study to assess whether women with unintended pregnancies had resorted to abortion
without informing their husbands. Nevertheless, the finding indicates discordance in
responses between husbands and wives regarding the final outcomes. For example, of 12
husbands who said their wives had successful abortions, two of these wives responses did
not match with their husbands' responses. Like as, among those seven husbands who
reported abortion failures, these responses matched only with four wives (Gurung,
2007:11).

Women's access in economic assets and property, there is no ground to believe that
women's access to land and other economic resources has increased in the last 20-25
years as their legal rights over property and inheritance has not changed much during this
period. Even the recently promulgated amendment, to the low on property rights of
women does not change her access to parental property substantially. The law provides
easier access to property in her final household. As the census 2001, about11 percent of
the households reported some land in female legal ownership (Acharya, 2003:47).
The political history of Nepal one realizes that women have been actively, involved in the
movements of restoring democracy in 1950 as well as in 1990. Women politicians only
make up 21 (7.9 percent) members out of the 265 Parliamentarian. In the General
Election of 1999 for the House of Representatives, the percentage of total women
candidates are 6.1 percent out of which only 12 (5.8 percent) were elected in the house of
205 members. There are 9 (15 percent) women members in the National Assembly out of
60 members. The number of women in the Cabinet is 1 out of 32 (28 Sept. 1999). The 20
percent seat reservation for members in Local Political bodies in 1997 local level election
has brought more than 39,000 women in local bodies. However, a vast majority of these
women need to be empowered politically through sensitization. Even the constitutional
provision for integrating women into the various level of political power structure has
failed to increase women's participation in decision-making adequately. There are also
very few women in the administrative and managerial positions. In fact a vast majority of
women involved in the unorganized sectors are illiterate, unskilled and earning nominal
wages. Their working hours is longer than that prescribed by low for the organized sector
and with no childcare and maternity facilities (Pradhan Malla, 2000: 2-3).
Basically, women's position in the family and society is determined by religion. The
existing religions differ in their approach to God and salvation; one common feature they
share is the allocation of inferior status of women. In spite of, religious tenets, taboos also
play a role in establishing women's lower position in the society. Nepal has two major
religions: Hinduism and Buddhism, among them 86.5 percent are Hindus and 7-8 percent
are Buddhist. Broadly speaking, Buddhist women do enjoy better position compare to
Hindu women, but within their own community, their status is lower in compare to men.
The notions of purity and impurity, which are dominant caste system, are even more
stringent in relation to women. Menstruation and childbirth are considered impure and
these accords women lower status than men from lower caste. The religious scriptures
also influence women that they consider themselves subordinate to their male
counterparts, as especially Hindu women consider it their duty to take orders from their
husbands. Their whole life revolves around their husbands and children and only few

have individual identities. Thus, women's status is poor compared to the men (Gurung,
2007:12).
Women are struggling to reconcile activities outside home with their traditional roles.
They cannot participate fully in economic and public life/ have limited access to position
of influence and power and have narrower occupation choices and lower earning than
men. In the majority of the countries, Women comprise 10 to 30 percent of managers and
occupy less than 5 percent of the very highest economic position. In addition, there has
been significant improvement in the percentage of females among, managerial and
administrative worker, individual countries report significantly higher percentage in the
United States, Botswana and Guatemala; for example, women constitute 40, 26 and 32
percent of these positions respectively. (Limbu, 2007:10).
Gautam (2006:14) found that the girls' enrollment in primary level, in spite of equal level
population was lower than that of boys in study area. The main causes were found to be
the property negative parental attitude, girls' involvement in farming and household work
and lack of educational awareness in parents. He also found that girls a decreasing trend
of enrollment from primary to secondary level in study areas. Though high rate of
enrollment were found in primary levels, the proportion of girls' enrollment even at this
level was only 38 percent as against 62 percent of the boys.
Ghimire (1997: 49-57) found that the girls' enrollment in primary level, in spite of equal
level population was lower than that of boys in study areas. The main causes were found
to be the property negative parental attitude, girls' involvement in farming and household
work and lack of educational awareness in parents. He also found that girls a decreasing
trend of enrollment from primary to secondary level in study areas. Though high rate of
enrollment were found in primary levels, the proportion of girls' enrollment even at this
level was only 38 percent as against 62 percent of the boys.
In political perspective, very few women have been elected to executive positions of
VDC and DDC local institutions in 1997. Only 289 women have elected on ward
chairpersons in a total of 3993 wards. Between nearly 8000 chairperson and vice-
chairperson, only 26 are women. Their proportion declines progressively as one move to
higher decision-making position. The participation of Nepalese women in the judiciary is
also negligible women constitute only some 4 percent of the judiciary's decision makers.
There were one-secretary two women judges (special class) and a district judge as of
1997 (ADB, 1999:44-45).

In Tamang community, the participation in the decision-making inside the household
sphere was found to be equal for men and women. The decision-making authority
constituted 40.3 percent of the total. However, the females' participation in decision-
making authority for outside the household spheres is found to be dominated by males'
decision authority (32.5 percent vs.49.4 percent) (Limbu, 1997:87).
Gautam (2006:21-22) the roles of women in food production, industrial work, health
provision and education. Women constitute the largest number of food producers-
approximately 50 percent in Africa, 30-40 percent in Asia and slightly less in Latin
America. A questioning notes "can we afford to trace any path of development without
pooling the untapped resources of women?" She emphasize upon women as an
indispensable human resources and the necessity to mobilize them for any significant and
balanced development of a nation.
According to (NPC, 1992: 92) a case study from Bajhang showed that about 20 percent
of female households head were landless as compare to only about 9 percent of male-
headed households. Slightly more female-headed households than male-headed
households were in marginal former category. No women were found in the category of
medium and large farmers. All female households in this sample had incomes below
poverty level.
In conclusion of M.A thesis by Paudyal, large number of women are literate in study area
out of 150 respondents, 58 percent are literate but they are concentrated on primary level
and non-formal sector. Brahmin/ Chhetri, women are more literate than the other caste
groups. It is found that increase the levels of education drop out cases are also increasing
in school enrolment of female students. The major cause of dropout is early marriage.
Brahmin/ Chhetri, women have high decisive role in household except decision on
dowry. There is negative relationship between age of respondents and decision on
childbirth, age and decision on dowry & age and decision on children's education.
Among the respondent about 78.7 percent have decision on usually cooked. Women have
loose command over their own property showing.
Gurung (2007:54) in her dissertation "Role of Women in Household Decision-making: A
Comparative Study of Dalit, Janajati, and Khas Married Women in Vyas Municipality of
Tanahun District". In this study, Gurung cleared that the socio-economic status among
the Dalit, Janajati and Khas community. The major findings of this dissertation as:
The majority of the respondents are married except in Dalit, 20 percent are separated
and 2 percent are widow and in Janajati 2 percent are widow.

Among 3 ethnic groups 30 percent of Dalit, 14 percent of Janajati and 10 percent of
Khas respondents are illiterate.
Majority of respondents from each ethnic group are housewives. Among Dalit 20
percent, Janajati 40 percent and Khas 36 percent respondents are engaged in
agricultural activities.
Majority of the respondents except Janajati respondents take decision on cropping
themselves.
Majority of the respondents 76 percent of Janajati, 68 percent of the Dalit, and 62
percent of Khas buy food products by themselves.
Among three ethnic groups, only 20 percent of Dalit respondents take decision on
dowry in children's marriage.
About 53 percent of Dalit, 50 percent of Janajati and 43 percent of Khas take decision
on income generating activities by themselves.
As per the occupation majority of Janajati respondents (48.3 percent) engaged in
agriculture activities and 50 percent of Dalit respondents engaged in non-agricultural
activities take decision on type of fuel themselves.
Among three ethnic groups 60 percent of illiterate Janajati and 44 percent of literate
Khas take decision on income generating activities etc.
Guatam (2006) in her M.A dissertation work "Women's Education Status And Their
Decision Making Power in Household Activities: A Case Study of Itahari Municipality,
Sunisari". The major findings of her dissertation as:
Out of the total female respondents 104 of them were found to be currently married, 4
of them widow and 2 of them are divorced.
Most of the women in survey were Hindu (90 percent) followed by Buddhist (6.4
percent) and Muslim (3.6 percent).
Forty percent of women are force to have baby without their own choice.
About sixty six percent women respondent use family planning where only 20 percent
of their husbands use family planning
Only 10.9 percent respondents have ownership in business and industry.
Eighty percent of women who have to take permission to spend money even though
they are keeping money and only 20 percent women spend money without
permission.
The survey of Itahari women's outdoor participation is high and maximum women i.e.
69.1 percent said that they have freedom to decide upon outdoor participation but
only 30.9 percent said that they have no freedom in such participation
Only 20 percent are involved in politics.

Limbu (2007:81) in his M.A dissertation work " Impact of Occupational and Educational
Status of Married Women in Household Decision-making: A Case Study of Sanischare
VDC of Morang District. The major findings of his dissertation as:
Large numbers of women are engaged in agricultural works in study area. Out of 108
respondents, 84.3 percent are engaged in agriculture along with self-agriculture and
other agriculture.
Large numbers of women are literate in study area. Out of 108 respondents, 65
percent are literate but they are concentrated on the secondary and primary level.
Huge share of literate respondents belong to secondary level and 25-39 years age
group. Brahmin women are more literate than other caste groups.
It is found that increasing the levels of education means decreasing the number of
females' education attainment (for secondary and upward).
The major cause of dropout is marriage.
Respondents with secondary level and agriculture occupation have high decisive role
on all sectors except dowry, selling home/land and 'Pewa' cattle.
Majority of respondents choose husband and husband/self as final decision-maker.
In case of decision to go to out side the door, majority of respondents are taking
decisions on going market and meeting personal friend.
The above referenced studies show that the decision-making power is surrounded by
various factors. In Nepal, female constitute more than half of total population with poor
status. More female are engaged in household activities without decision-making power.
They have to follow their male partners in most of the cases. A perusal of the available
literature also makes it clear that there is a persisting controversy regarding women's
input in decision-making process.
It can be concluded from the above studies, that females have low participation on
decision-making power due to lack of proper socio-cultural, economic and demographic
status. Females have more responsibilities in household chores, agricultural activities or
labour force but they have less chance to decide freely but participate more. The massive
literatures in the field of the participation of women in decision-making show that there
are very few women in political level decision-makers. Women from Tibeto-Burman
groups are socially less constrained to women of Indo-Aryan groups. Men are found
more participated in household decision-making than women. So, Men are superior to
women. Lastly, it should not be forgotten that without equal participation of male and
female in all spheres of households and all aspect of life, there is less change to be
developed societies. So, women should bring into the mainstream of development
activities not by only their physical presentation but by providing fully decision-making
power in every sector.
CHAPTER-III: METHODOLOGY
Research methodology is a way to solve systematically about the research problems. It is
a general plan of how the researcher is going about answering the research questions the
researcher has set. It is also the chain process or method applied from data collection,
processing and analysis to finding conclusions. This chapter deals with methods
employed while constructing the research study in order to achieve the research
objectives. The major contents of research methodology are as follows:
3.1 Introduction of the Study Area
Among the eight districts of Bagmati Zone, Dhading is the one, which has covered 1926
square kilometers. Its bordering districts are Kathmandu, Nuwakot and Rasuwa in the
east, Gorkha in the west, Makwanpur and Chitwan in the south and Tibet in the north.
This district comprises of three electoral constituencies and 50-village development
committee. The population of the district is 338658, which covers the 4.2 percent of the
total population (23,151,423). Among them 1,65,864 (49 percent) are males and 1,72798
(51 percent) are females. According to ethnic composition 21.5 percent are Tamang, 16.7
percent Brahmin, 15.5 percent Chhetri, 9.6 percent Newar, 8.5 percent Magar, 7.7 percent
Gurung, 4 percent Sarki, 3.4 percent Kami, 2.3 percent Damai, 1.3 percent Sanyasi, 1.2
percent Kumal, 1 percent Takuri, 0.9 percent Gharti, 0.5 percent Sunar, 0.5 percent other
Dalit and others are 2.7 percent. (DNGOP: 2064).
The research study was conducted in the Phulkharka VDC of Dhading district. Its
boarding VDCs are Basari and Budathum in the west, Gumdi in the east, Mulpani and
Salayankot in the south and Re in the north. The population of the VDC is 4655; among
them 2106 are males and 2549 are females. And the total household of this VDC is 872.
Among the nine wards of this VDC, the study has covered the ward number 3, 4 And 5.
Agriculture is the major occupation of this area but for livelihood they are engaged in
business, government jobs (like teacher, police etc), wages labour, national and
international labour etc. But there is lack of development indicators such as electricity,
road, irrigation, pure drinking water etc.
3.2 Study Design
The design of the study is basically non-experimental. Descriptive research method has
been used to collect, explain and to analyze the data. It is used to describe the exact
situation of study population and their demographic and socio-economic variables have
been analyzed and presented in this study.
3.3 Method of Data Collection
To fulfill the objectives of research, collection of data is very important. During the
research study, the data were collected with the help of both structure and non-structure
questionnaire included all questions, which are needed to collect the information related
to households and socio-economic activities. According to needs, the researcher used the
other techniques such as Interview schedule, Observation, Key informant's interviews,
focus group discussion etc.
3.4 Research Procedure
To obtain the objectives of the study mainly this study has been completed in three
phases. The first phase was started with conceptual clarity, second phase was empirical
and third phase was analytical phase. The study is mainly depending upon the responses
of respondents.
3.5 Sampling Procedure
The sample population has selected purposively from ward no. 3, 4 and 5 of Phulkharka
VDC of Dhading District. This study has covered 30 households from each Sarki,
Gurung and Chhetri ethnicity as a sample. All married women of age group 15-49 years
in 90 households of the study areas are interviewed. The sample size is 122 married
women of age group 15-19 years.
3.6 Sources of Data
Sources of data are the primary and secondary data. The primary data have been collected
from the direct field visit, (personal interview, household survey, observation and group
discussion).

The secondary data were collected from the various type of relevant literatures, such as
articles, books, village profile, website, journals, newspaper, reports etc. publications and
concerned offices.
3.7 Data Processing, Presentation and Analysis
After collection of data, data processing were done for drawing out meaningful results.
The researcher gets raw data from the field so it needs to be analyzed to get fruitful
results. The collected data are analyzed by using the methods such as frequency
distribution, cross tabulation, average and percentage distribution. To present the result in
more simple way different cohort has been presented as and when necessary.
3.7 Conceptual Framework
Demographic, social and economic factors affect the women's decision-making power.
Demographic variables such as age, marital status and age at first birth are important
factors, which are influenced by the participation of women in society. Social variables
are education, health, participation in social activities, which are primary needs to
involvement of formal job or employment and also influenced the decision-making
power. Economic variables are directly related to decision-making power of women.
These are land ownership, employment and income level play vital role to build up the
self-confidence of women.
Figure: Conceptual Framework
Dependent Variables Independent Variables
DECISION – MAKING
POWER OF WOMEN
Demographic Variables:
Age and Sex
Marital Status
Age at Marriage
Age at First Birth
Children Ever Born
Economic Variables:
Land Ownership
Agriculture & Livestock
Fuel Consumption
Income &employment
Level

CHAPTER-VI: INTRODUCTION TO STUDY POPULATION
This chapter deals with the demographic, social and economic characteristics of
household and respondents. The characteristics of household and respondents in many
aspects like age-sex composition; religious composition, education status etc. are dealt in
this segment. Out of the total 872 households, 90 households were taken as sample.
4.1 Demographic Characteristics
The demographic characteristics such as household population by age and sex, sex ratio,
marital status, age at marriage, age at birth of first child children ever born have analyzed.
4.1.1 Age and Sex Composition of Household Population with Sex Ratio
A significant feature of any population is the distribution of its members according to age
and sex, which facilitates the planners and policy makers in formulating effective socio-
economic development plans for the population of different age group by sex. Age and
sex of each household member were obtained from the married women of age group 15-
49 years. In 90 sampled households, the total population is 553.
Table 4.1: Distribution of Household Population with Sex Ratio
Age
group
Male Female Total Sex
Ratio Cases Percentage Cases Percentage Cases Percentage
0-4 31 11.4 27 9.6 58 10.5 114.8
5-9 35 12.9 32 11.4 67 12.1 109.3
10-14 32 11.7 29 10.3 61 11.0 110.3
15-19 26 9.6 30 10.7 56 10.1 86.7
20-24 25 9.2 28 10.0 53 9.6 80.3
25-29 19 7.0 24 8.5 43 7.8 79.2
30-34 21 7.7 25 8.9 46 8.3 84
Social Variables:
Education
Religion
Health
Participation in social
Activities
Family Planning

35-39 18 6.6 15 5.3 33 6.0 120
40-44 15 5.5 16 5.7 31 5.6 93.8
45-49 19 7.0 21 7.5 40 7.2 90.5
50-54 12 4.4 11 3.9 23 4.2 109.1
55-59 6 2.2 8 2.9 14 2.5 75
60+ 13 4.8 15 5.3 28 5.1 86.7
Total 272 100.0 281 100.0 553 100.0 96.8
Source: Field Survey, 2008
Table 4.1 shows that the total population is 553, among them 272 are males and 281 are
females. The proportion of population of the age group 0-4 is relatively less than that of
the age group 5-9. Age distribution tends to be a smooth one in the sense that the
proportions of the persons in each successive age group are less than in the proceeding
one. The sex ratio is found 96.8, which is lower than that of national figure (99.8).
4.1.2 Age Composition of Respondents
In demography, age composition is the composition of a population according to the
number and proportion of population (male and female) in each age category. Decision-
making roles are different in people according to their ages. The five-years age
composition of respondents as follows:
Table 4. 2: Distribution of Respondents by Age Group and Ethnicity
Age
group
Sarki Gurung Chhetri Total
Cases Percentage Cases Percentage Cases Percentage Cases Percentage
15-19 1 2.5 2 4.3 1 2.7 4 3.3
20-24 9 23.1 9 19.6 7 18.9 25 20.5
25-29 4 10.3 12 26.1 5 13.5 21 17.2
30-34 9 23.1 9 19.6 7 18.9 25 20.5
35-39 3 7.7 4 8.7 6 16.2 13 10.6
40-44 4 10.2 6 13.0 5 13.6 15 12.3
45-49 9 23.1 4 8.7 6 16.2 19 15.6
Total 39 100.0 46 100.0 37 100.0 122 100.0
Source: Field Survey, 2008
Table 4.2 shows that highest respondents are found in age groups 20-24 and 30-34 years.
In Sarki, the highest population is found in age groups 20-24, 30-34 and 45-49 years i.e.
23.1 percent. In Gurung, the highest population is found in the age group 25-29 years i.e.

26.1 percent. There are 18.9 percent of Chhetri respondents in both age group 20-24 and
30-34. In selected 30-sampled households in each ethnicity, there is a higher number of
the married female population in Gurung community than the Chhetri and Sarki.
4.1.3 Marital Status of Respondents
A person who has lived as husband and wife after being married religiously or socially
and legally, it maintains the social structures given continuity to the society and helps to
sustain social development. Which determines the social roles and responsibilities of
people. The marriage situation of the study population is given in table:
Table 4.3: Distribution of Respondents by Marital Status
Marital
Status
Sarki Gurung Chhetri Total
Cases Percen
tage
Cases Percen
tage
Cases Percen
tage
Cases Percen
tage
Currently
married
37 94.9 44 95.6 36 97.3 117 95.9
Separated - - 1 2.2 - - 1 0.8
Widow 2 5.1 1 2.2 1 2.7 4 3.3
Total 39 100.0 46 100.0 37 100.0 122 100.0
Source: Field Survey, 2008
Table 4.3 shows that marital status of women, among the respondents of Sarki, 94.9
percent are currently married, and 5.1 percent are widow. In Gurung, 95.6 percent are
currently married, 2.2 percent were separated and widow. In Chhetri, 97.3 percent are
currently married and remaining, few people are widow. In total, 95.9 percent are
currently married, 0.8 percent, are separated and 3.3 percent are widow. Comparatively,
Chhetri's respondents are higher than other respondents, which are currently married.
Gurung respondents have lived in separated i.e. 2.2 percent. But widow women are
higher in Sarki comparatively than other groups.
4.1.4 Age at Marriage of Respondents
Age at marriage is one of the most important factors, which is a key determinant of the
fertility. Marriage marks the point in a woman's life when childbearing becomes socially
acceptable. The early age at marriage contributes a relatively long period of childbearing
age for women, while the marriage is postponed to some extent contributes receptively
shorter span of their childbearing. The women who tend to marry early in their
reproductive ages are likely to bear more than that of women who marry late. In this
study, the age at marriage is grouped into five age groups in each ethnicity: 10-14, 15-19,
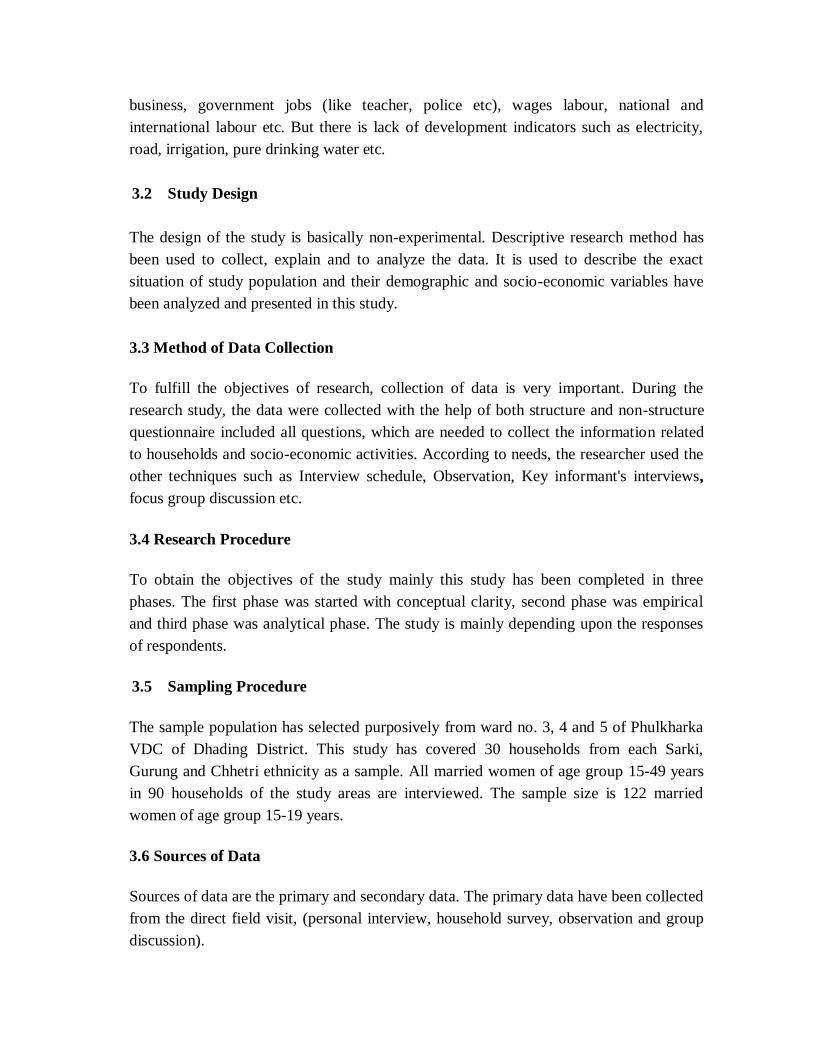
20-24, 25-29 and 30-34, which is clearly shown in the table 4.4.
Table 4.4: Distribution of Respondents by Age at Marriage
Age at
marriage
Sarki Gurung Chhetri Total
Cases Percentage Cases Percentage Cases Percentage Cases Percentage
10-14 5 12.8 7 15.2 4 10.8 16 13.1
15-19 23 59.0 34 73.9 21 56.8 78 63.9
20-24 9 23.1 5 10.9 8 21.6 22 18.1
25-29 2 5.1 - - 3 8.1 5 4.1
30-34 - - - - 1 2.7 1 0.8
Total 39 100.0 46 100.0 37 100.0 122 100.0
Source: Field Survey, 2008
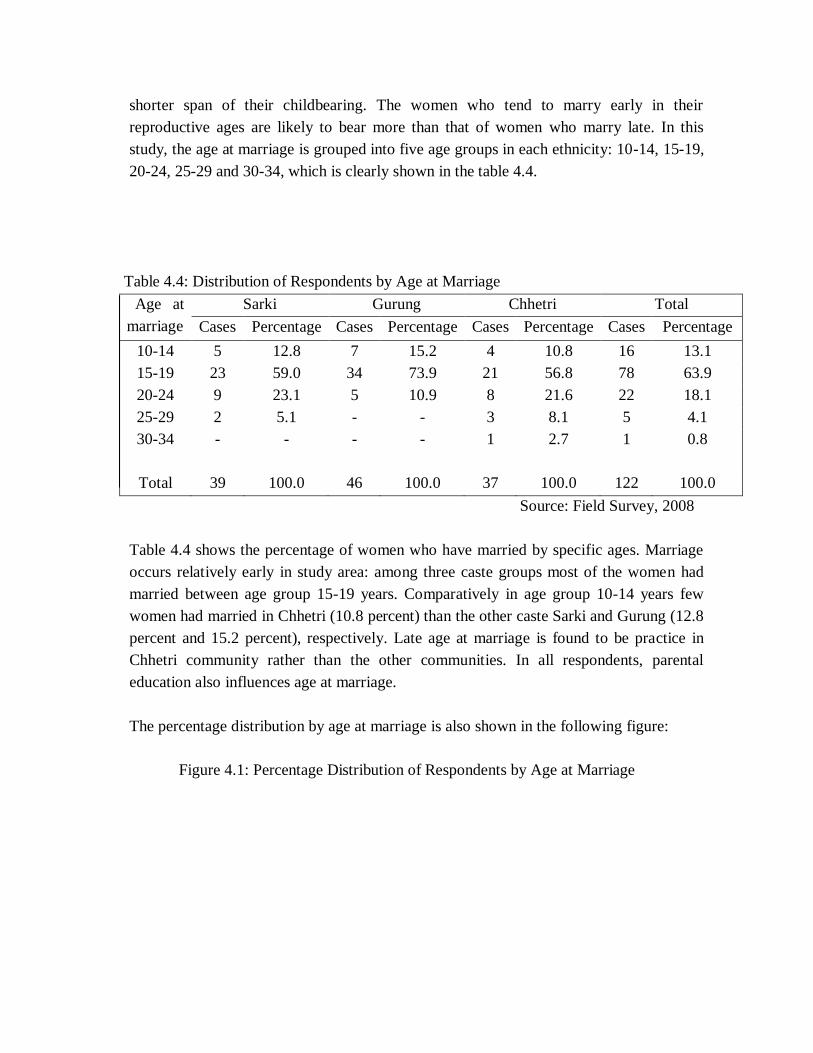
Table 4.4 shows the percentage of women who have married by specific ages. Marriage
occurs relatively early in study area: among three caste groups most of the women had
married between age group 15-19 years. Comparatively in age group 10-14 years few
women had married in Chhetri (10.8 percent) than the other caste Sarki and Gurung (12.8
percent and 15.2 percent), respectively. Late age at marriage is found to be practice in
Chhetri community rather than the other communities. In all respondents, parental
education also influences age at marriage.
The percentage distribution by age at marriage is also shown in the following figure:
Figure 4.1: Percentage Distribution of Respondents by Age at Marriage

0
10
20
30
40
50
60
70
80
10 14 15-19 20-24 25-29 30-34
Age Groups
Perc
en
tag
e
Sarki
Gurung
Chhetri
4.1.5 Age at Birth of First Child
The early age at first birth increases the relatively longer period of childbearing ages of
ever-married women but postponed of age at first birth decreases the period of
childbearing, which might help to reduce the fertility. The age at first birth might be
increased with the civilization of the society, which helps to decrease the fertility. The
age at birth of first child in this study is grouped into five years age groups such as 10-14,
15-19, 20-24, 25-29 and 30-34 years.
Table 4.5: Distribution of Respondents by Age at Birth of First Child
Age at
birth of
1st child
Sarki Gurung Chhetri Total
Cases Percentage Cases Percentage Cases Percentage Cases Percentage
10-14 1 2.6 1 2.2 - - 2 1.6
15-19 25 64.1 37 80.4 19 51.4 76 62.3
20-24 11 28.2 8 17.4 14 37.8 38 31.2
25-29 2 5.1 - - 3 8.1 5 4.1
30-34 - - - - 1 2.7 1 0.8
Total 39 100.0 46 100.0 37 100.0 122 100.0
Source: Field Survey, 2008
10-14 DECISION
–
MAKI
NG POW
ER
OF WOM
EN
Depen
dent
Varia
bles

Table 4.5 shows that the Chhetri's women have a higher age at birth of first child than
other i.e. Gurung and Sarki. For example, proportion of age at birth of first child in age
group 10-14 is 2.6 percent in Sarki women and 2.2 percent in Gurung women but nil in
Chhetri women. 2.7 percent of Chhetri women have given birth in age group 30-34 years
but nil in Sarki and Gurung women. Comparatively, Chhetri respondents are better than
the Gurung and Sarki respondents because early age at first birth is lower rather than the
other ethnic groups. Majority of Gurung respondents have given a first birth in early ages
i.e. 82.6 percent, Sarki (66.7 percent) and Chhetri (51.4 percent).
4.1.6 Mean Children Ever Born of Respondents by each Ethnicity
A woman who has reached reproductive age will have born a certain number of children
at any given time, of which a certain number will still be surviving. These numbers are
referred to, respectively, as the children ever born and children surviving for this woman
at this time. Data on the number of children ever born reflect the accumulation of births
over the past 30 years and, therefore have limited relevance to current fertility levels,
particularly when the country has experienced a decline in fertility. The information on
children ever born (or parity) is useful in looking at a number of issues. The general age
pattern of fertility is that the level of current fertility increases to a certain age and then
decreases. The distribution of mean number of CEB by each ethnicity as follows:
Table 4.6: Mean CEB by Current age of Ever Married Women of Sarki
Age
Group
Sarki
Respondents Number of children Mean CEB DHS 2006
15-19 1 0 0.0 0.2
20-24 9 11 1.2 1.2
25-29 4 12 3.0 2.4
30-34 9 30 3.3 3.3
35-39 3 11 3.7 4.1
40-44 4 16 4.0 4.6
45-49 9 38 4.2 5.3
Total 39 118 3.0 2.4
Source: Field Survey, 2008
Table 4.7: Mean CEB by Current age of Ever Married Women of Gurung

Age Group Gurung
Respondents Number of
Children
Mean CEB DHS 2006
15-19 2 1 0.5 0.2
20-24 9 13 1.4 1.2
25-29 12 35 2.9 2.4
30-34 9 31 3.4 3.3
35-39 4 15 3.8 4.1
40-44 6 26 4.3 4.6
45-49 4 21 5.3 5.3
Total 46 142 3.1 2.4
Source: Field Survey, 2008
Table 4.8: Mean CEB by Current age of Ever Married Women of Chhetri
Age Group Chhetri
Respondents Number of
Children
Mean CEB DHS 2006
15-19 1 0 0 0.2
20-24 7 6 0.9 1.2
25-29 5 10 2.0 2.4
30-34 7 22 3.1 3.3
35-39 6 23 3.8 4.1
40-44 5 21 4.2 4.6
45-49 6 25 4.2 5.3
Total 37 107 2.9 2.4
Source: Field Survey, 2008
Table 4.6, 4.7 and 4.8 show that higher the age of respondents, higher the number of
children ever born. It also indicates that the mean number of children ever born varies by
age group of women. The highest children ever born are found in the age group 45-49
year of age in each ethnicity. The average number of CEB in the Sarki, Gurung and
Chhetri respondents are found to be 3.0, 3.1and 2.9, which is higher than the 2.4 for
Nepal reported by DHS, 2006. It is cleared that highest CEB is found in Gurung
respondents followed by Sarki. And lowest CEB is found in Chhetri respondents Thus, it

can be concluded that Chhetri women have given less number of births during their
reproductive life span than the Gurung and Sarki women.
4.2 Economic Characteristics
Economic status is an indicator of the level of wealth that is consistent with expenditure
and income measures. In this part, economic characteristics such as land ownership,
Pewa cattle, income level, and fuel consumption. All persons consume goods and
services; only a part of the total population of any area is engaged in producing such
goods and services. According to ILO, economically active person are persons engaged
of intent to engage in the production of goods and services included within the boundary
of production of the system.
4.2.1 Distribution of Land
Landholding size is one of the key economic indicators to measure the economic well
being of the community or person. Nepal is agro-based country and most of the people
depend upon the agriculture as main occupation. Land has great contribution in
agriculture and it measures the economic status of people. So, huge ownership of land
indicates the economy well and few ownership of land indicates the poor economy.
Table 4.9: Distribution of Respondents by Landholding
Land
(Ropani)
Sarki Gurung Chhetri Total
Cases Percentage Cases Percentage Cases Percentage Cases Percentage
<10 4 10.3 6 13.0 2 5.4 12 9.8
11-20 19 48.7 22 47.8 16 43.3 57 46.7
21-30 13 33.3 15 32.6 9 24.3 37 30.4
31-40 3 7.7 2 4.4 7 18.9 12 9.8
41+ - - 1 2.2 3 8.1 4 3.3
Total 39 100.0 46 100.0 37 100.0 122 100.0
Source: Field Survey, 2008
Table 4.7 shows that Sarki (10.3 percent), Gurung (13.0 percent) and Chhetri (5.4
percent) respondents have (<10 Ropani) land. But Chhetri (8.1 percent), Gurung (2.2
percent) respondents have (41+ Ropani) land but nil in Sarki. So that, landing pattern
signifies their actual economic status to their community. In that sense, Sarki have less
landholding size than Gurung though Gurung have lower level of land holding size

compare to the Chhetri. Thus, Chhetri's status is higher compare to than that of Gurung
and Sarki's status.
Figure 4.2: Percentage Distribution of Respondents by Landholding
0
10
20
30
40
50
60
1 10 10 20 21-30 31-40 41+
Land (Ropani)
Pe
rce
nta
ge
of
Re
sp
on
de
nts
Sarki
Gurung
Chhetri
4.2.2 Distribution of Respondents by 'Pewa' Livestock
'Pewa' means own rights of goods or self-property of a person. So, following table shows
the distribution of respondent by "Pewa" Livestock:
Table 4.10: Distribution of Respondents having Livestock as 'Pewa', 2008
Having
'Pewa'
Sarki Gurung Chhetri Total
Cases Percentage Cases Percentage Cases Percentage Cases Percentage
Yes 16 41.0 21 45.6 11 29.7 48 39.3
No 23 59.0 25 54.4 26 70.3 74 60.7
Total 39 100.0 46 100.0 37 100.0 122 100.0
Source: Field Survey, 2008
Above table shows that 41.0 percent Sarki had Pewa, 45.6 percent Gurung had Pewa but
compare than this few Chhetri respondents had Pewa i.e. only 29.7 percent. In the sense
of Pewa, Gurung respondents has found to have strong position in Pewa than the other
two ethnicity i.e. Sarki and Chhetri.
4.2.3 Main Source of Income and Monthly Income Level of the Respondents
<10 10-20
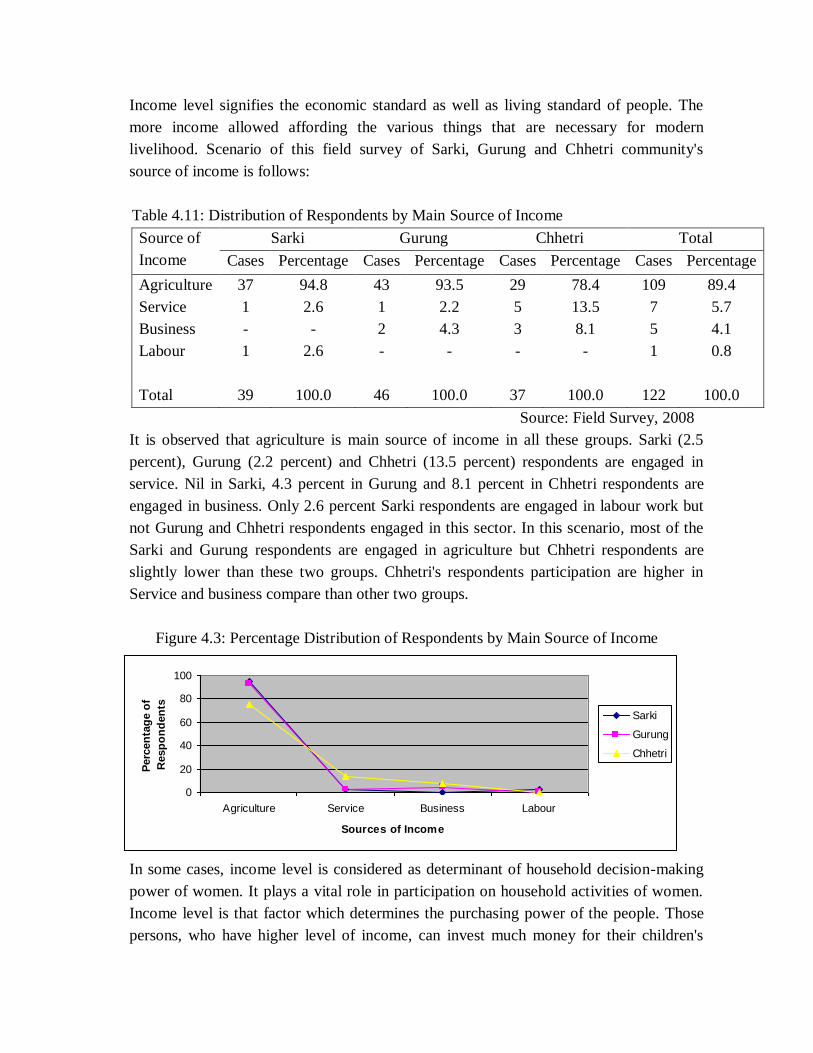
Income level signifies the economic standard as well as living standard of people. The
more income allowed affording the various things that are necessary for modern
livelihood. Scenario of this field survey of Sarki, Gurung and Chhetri community's
source of income is follows:
Table 4.11: Distribution of Respondents by Main Source of Income
Source of
Income
Sarki Gurung Chhetri Total
Cases Percentage Cases Percentage Cases Percentage Cases Percentage
Agriculture 37 94.8 43 93.5 29 78.4 109 89.4
Service 1 2.6 1 2.2 5 13.5 7 5.7
Business - - 2 4.3 3 8.1 5 4.1
Labour 1 2.6 - - - - 1 0.8
Total 39 100.0 46 100.0 37 100.0 122 100.0
Source: Field Survey, 2008
It is observed that agriculture is main source of income in all these groups. Sarki (2.5
percent), Gurung (2.2 percent) and Chhetri (13.5 percent) respondents are engaged in
service. Nil in Sarki, 4.3 percent in Gurung and 8.1 percent in Chhetri respondents are
engaged in business. Only 2.6 percent Sarki respondents are engaged in labour work but
not Gurung and Chhetri respondents engaged in this sector. In this scenario, most of the
Sarki and Gurung respondents are engaged in agriculture but Chhetri respondents are
slightly lower than these two groups. Chhetri's respondents participation are higher in
Service and business compare than other two groups.
Figure 4.3: Percentage Distribution of Respondents by Main Source of Income
0
20
40
60
80
100
Agriculture Service Business Labour
Sources of Income
Perc
en
tag
e o
f
Resp
on
den
ts
Sarki
Gurung
Chhetri
In some cases, income level is considered as determinant of household decision-making
power of women. It plays a vital role in participation on household activities of women.
Income level is that factor which determines the purchasing power of the people. Those
persons, who have higher level of income, can invest much money for their children's

education, health as well as for their quality of life, which directly or indirectly affects the
human life. Scenario of this field survey of Sarki, Gurung and Chhetri community's
income level is seen in the following table.
Table 4.12: Distribution of Respondents by Monthly Income Level
Income
Level
Sarki Gurung Chhetri Total
Cases Percentage Cases Percentage Cases Percentage Cases Percentage
<1000 36 92.3 45 97.8 31 83.8 112 91.8
1001-2000 2 5.1 1 2.2 2 5.4 5 4.1
2001-3000 1 2.6 - - 3 8.1 4 3.3
3000+ - - - - 1 2.7 1 0.8
Total 39 100.0 46 100.0 37 100.0 122 100.0
Source: Field Survey, 2008
Table 4.10 shows that 92.3 percent of Sarki, 97.8 percent of Gurung and 83.8 percent of
Chhetri respondents have income level less than and equal to Rs.1000. 5.1 percent of
Sarki, 2.2 percent of Gurung and 5.4 percent of Chhetri respondents have income level
between Rs.1001-2000. Sarki (2.6 percent), Gurung (nil) and Chhetri (8.1 percent)
respondents have income level between Rs. 2001-3000. Only one Chhetri respondents
(2.7 percent) respondent have income level 3000 and above rupees but others groups are
found to be nil in this income level. Comparatively, Chhetri's respondents have better
income level than the others two groups.
4.2.4 Fuel Used for Cooking of the Respondents
Wood is the major source of cooking fuel for all respondents. The second common
source of cooking fuel is biogas and third is kerosene. Sarki (100 percent), Gurung (93.5
percent) and Chhetri (86.6 percent) respondents are dependent on firewood for cooking
purpose. Only 4.3 percent of Gurung and 8.7 percent of Chhetri respondents are used
Biogas, which is generally affordable by higher or middle-income respondents. But very
few respondents are used to cooking is kerosene i.e. only 2.2 percent of Gurung and 2.7
percent of Chhetri. Overall, 93 percent respondents in this area depend on the firewood.
Comparatively, in the sense of fuel used for cooking of the respondents; Sarki
respondents have poor socio-economic status than the Gurung and Chhetri respondents. It
is found that Chhetri respondents have high socio-economic status and Gurung is middle.
Table 4.13: Distribution of Respondents Fuel Consumption for Cooking
Type of Sarki Gurung Chhetri Total

Fuel Cases Percentage Cases Percentage Cases Percentage Cases Percentage
Wood 39 100.0 43 93.5 32 86.6 114 93.5
Bio-gas - - 2 4.3 4 8.7 6 4.9
Kerosene - - 1 2.2 1 2.7 2 1.6
Total 39 100.0 46 100.0 37 100.0 122 100.0
Source: Field Survey, 2008
4.3 Social Characteristics
Social characteristics such as educational status and religion of the respondents have
analyzed as follows:
4.3.1 Educational Status of the Respondents
Educational status affects the every aspect of human life. Education is the one of the most
important indicator of development. It can play the crucial role for the dignity and
prosperity of the nation. Education has positive correlation with decision-making power
and change the national scenario. It is directly or indirectly affects the demographic and
socio-economic variables such as income, occupation, health etc. In fact, it is a single
indicator, which can depict the real image of various socio-economic factors of a society.
This field survey has collected data on two main educational features of the population:
literacy status and educational attainment of the respondents.
Table 4.14: Distribution of Respondent by Educational Status
Educational
Attainment
Sarki Gurung Chhetri Total
Cases Percentage Cases Percentage Cases Percentage Cases Percentage
Illiterate 16 41.0 12 26.1 4 10.8 32 26.2
Non-formal 7 17.9 10 21.7 9 24.3 26 21.3
Primary 9 23.1 16 34.8 6 16.2 31 25.4
Lower
Secondary
4 10.3 - - - - 4 3.3
Secondary 1 2.6 3 6.5 4 10.8 8 6.6
SLC passed 2 5.1 4 8.7 9 24.4 15 12.3
Higher
Secondary
and above
- - 1 2.2 5 13.5 6 4.9
Total 39 100.0 46 100.0 37 100.0 122 100.0

Source: Field Survey, 2008
Figure 4.4: Percentage Distribution of Respondent by Educational Status
0
5
10
15
20
25
30
35
40
45
Sarki Gurung Chhetri
Ethnic Groups
Perc
en
tag
e
Illiterate
Non-formal
Primary
Lower Secondary
Secondary
SLC Passed
Higher Secondary and
Above
It is observed that among the three ethnic groups: 41.0 percent of Sarki, 26.1 percent of
Gurung and 10.8 percent of Chhetri respondents are found illiterate. Some respondents
have attended the non-formal education i.e. Sarki (17.9 percent), Gurung (21.7 percent)
and Chhetri (24.3 percent). In the sense of formal education, majority of the respondents
have attended the primary education i.e. Sarki (23.1 percent), Gurung (34.8 percent) and
Chhetri (16.2 percent). Above table also shows that 5.1 percent Sarki, 8.7 percent Gurung
and 24.3 percent Chhetri respondents are SLC passed. Gurung (2.2 percent) and Chhetri
(13.5 percent) respondents have attended higher secondary and above level but there are
no respondents from Sarki in this level. Comparatively, majority of Sarki respondents are
more illiterate than the Gurung and Chhetri respondents. Among of these three groups,
Chhetri's respondents are more literate or high level of educational status than the Sarki
and Gurung respondents. It concludes that the proportion of respondents (students) have
declined in upper level in all respondents might be the cause of low income and failed in
the final examination. Drop out is high in Gurung respondents than followed by Sarki
respondents, but comparatively low in Chhetri respondents, although primary school
enrollment is satisfactory of the all respondents.
4.3.2 Religion Composition of the Respondents
Religion has become a sensitive topic in ethnically diverse Nepali society. People of
different religious groups have their own traditional value system governing their future
life and decision-making power of individual or society.
Table 4.15: Distribution of Respondents by Religion
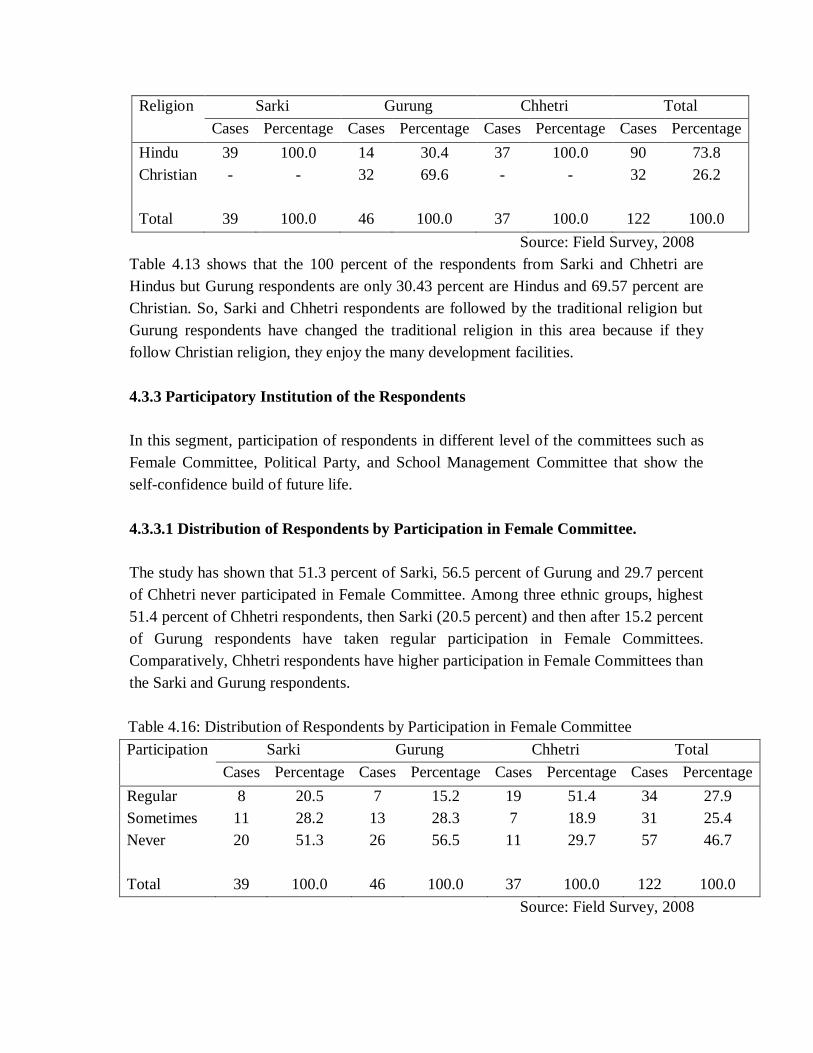
Religion Sarki Gurung Chhetri Total
Cases Percentage Cases Percentage Cases Percentage Cases Percentage
Hindu 39 100.0 14 30.4 37 100.0 90 73.8
Christian - - 32 69.6 - - 32 26.2
Total 39 100.0 46 100.0 37 100.0 122 100.0
Source: Field Survey, 2008
Table 4.13 shows that the 100 percent of the respondents from Sarki and Chhetri are
Hindus but Gurung respondents are only 30.43 percent are Hindus and 69.57 percent are
Christian. So, Sarki and Chhetri respondents are followed by the traditional religion but
Gurung respondents have changed the traditional religion in this area because if they
follow Christian religion, they enjoy the many development facilities.
4.3.3 Participatory Institution of the Respondents
In this segment, participation of respondents in different level of the committees such as
Female Committee, Political Party, and School Management Committee that show the
self-confidence build of future life.
4.3.3.1 Distribution of Respondents by Participation in Female Committee.
The study has shown that 51.3 percent of Sarki, 56.5 percent of Gurung and 29.7 percent
of Chhetri never participated in Female Committee. Among three ethnic groups, highest
51.4 percent of Chhetri respondents, then Sarki (20.5 percent) and then after 15.2 percent
of Gurung respondents have taken regular participation in Female Committees.
Comparatively, Chhetri respondents have higher participation in Female Committees than
the Sarki and Gurung respondents.
Table 4.16: Distribution of Respondents by Participation in Female Committee
Participation Sarki Gurung Chhetri Total
Cases Percentage Cases Percentage Cases Percentage Cases Percentage
Regular 8 20.5 7 15.2 19 51.4 34 27.9
Sometimes 11 28.2 13 28.3 7 18.9 31 25.4
Never 20 51.3 26 56.5 11 29.7 57 46.7
Total 39 100.0 46 100.0 37 100.0 122 100.0
Source: Field Survey, 2008

Figure 4.5: Percentage Distribution of Respondents by Participation in Female
Committee
0
10
20
30
40
50
60
Sarki Gurung Chhetri
Ethnic Groups
Perc
en
tag
e
Regular
Sometimes
Never
4.3.3.2 Distribution of Respondents by Participation in Political Parties
Politics is directly associated with the power relation that involves the authority of
decision-making. Political participation signifies the access of power and its exercise for
decision-making that impact to the future of people or society or nation. In this study
area, local level political participation of the respondent is negligible.
Table 4.17: Distribution of Respondents by Participation in Political Parties
Participation Sarki Gurung Chhetri Total
Cases Percentage Cases Percentage Cases Percentage Cases Percentage
Regular - - 2 4.3 3 8.1 5 4.1
Sometimes 2 5.1 5 10.9 13 35.1 20 16.4
Never 37 94.9 39 84.8 21 56.8 97 79.5
Total 39 100.0 46 100.0 37 100.0 122 100.0
Source: Field Survey, 2008
Table 4.15 shows that Chhetri respondents are found with more political participation
than Gurung But Sarki respondents are nil in political participation. Sarki (94.9 percent),
Gurung (84.8 percent) and Chhetri (56.8 percent) respondents have never participated in
Political Parties.
Figure 4.6: Percentage Distribution of Respondents by Participation in Political Parties

05.1
94.9
4.310.9
84.8
8.1
35.1
56.8
0
10
20
30
40
50
60
70
80
90
100
Regular Sometimes Never
Category of Participation
Pe
rce
nta
ge
Sarki
Gurung
Chhetri
4.3.3.3 Distribution of Respondents by Participation in School Management
Committee
Participation of respondents are negligible in School Management Committee. Table 4.16
shows that 100 percent of Sarki, 91.3 percent of Gurung and 81.1 percent of Chhetri
respondents have never participate in School Management Committee. The participation
of Gurung respondents is little better than the Sarki. Similarly, Chhetri respondents are
better than the Gurung.
Table 4.18: Distribution of Respondents by Participation in School Management
Committee
Participation Sarki Gurung Chhetri Total
Cases Percentage Cases Percentage Cases Percentage Cases Percentage
Regular - - 1 2.2 2 5.4 3 2.4
Sometimes - - 3 6.5 5 13.5 8 6.6
Never 39 100.0 42 91.3 30 81.1 111 91.0
Total 39 100.0 46 100.0 37 100.0 122 100.0
Source: Field Survey, 2008
4.3.4 Use of the Family Planning of the Respondents
Family planning means the conscious effort of couples to regulate the number and
spacing of births through artificial and natural methods of contraption. Family planning
connotes conception control to avoid pregnancy and abortion, but it also includes efforts

of couples to induce pregnancy. Family planning programmes play a key role in
providing information and services that help people make informed reproductive rights
and use contraception safely and effectively. Family planning is to make the family life
happy through appropriate management of family size and mobilization of various
sources. The greatest contribution of family planning program lies in avoiding unwanted
pregnancies and thereby unplanned births and making sure that all births are planned.
4.3.4.1 Ever Use of Family Planning Method of the Respondents
Ever use of family planning methods are indicates their history of using family planning
methods. Data on ever use of contraception has special significance because it reveals the
cumulative success of programs promoting the use of family planning among couples at
any time, with no distinction between past and present use. In the 2006 NDHS,
respondents who had heard of a method of family planning were asked if they had ever
used a method.
Ever use of family planning methods may have significant impact to manage the rapid
growing population and environment problems. Most of the under developed and
developing countries are out of its proper use because of the tradition, low level of
education, non availability etc. Ever use of contraception varies with women's age. The
pattern of ever use is curvilinear, with use being lowest among women in the youngest
age group (15-19), increasing with age, and reaching a level among in their thirties before
declining thereafter. In the study, ever married women were asked about the ever use of
family planning methods. The responses are tabulated in table 4.17
Table 4.19: Percentage Distribution of Respondents by Ever Use of FP Methods in
the Study Area.
Ever Used of
FP planning
No of CEB Respondents Mean CEB Percent
Have you /
your
husband
ever
used…any
method
Yes 215 79 2.7 64.8
No 152 43 3.5 35.2
Total 367 122 3.0 100.0
Source: Field Survey, 2008

Table 4.17 shows the percentage of all respondents who have ever used family planning
by specific method. The ever use family planning methods among the respondents are
64.8 percent and remaining 35.2 percent have not used any one method. Women who
said to have ever used family planning methods have CEB 2.7 but the women who have
not used family planning methods have 3.5 CEB.
4.3.4.2 Currently Use of Family Planning Method
The level of current use is important from the policy point of view simply because it
helps in assessing the success of the family planning programmes of the country. Current
use of contraception is defined as the proportion of women who reported the use of a
family planning method at the time of interview. The level of currently use- usually
calculated among currently married women- is the most used and valuable measure of the
success of family planning programmes. The study of differentials in current use of
contraception is important because it helps identify subgroups of the population to target
for family planning services. Table 4.18 allows comparison of levels of current
contraceptive use among Sarki, Gurung and Chhetri respondents.
Table 4.20: Percentage Distribution of Respondents by Current Use of FP Methods
Current Use
of FP
Methods
Sarki Gurung Chhetri Total
Cases Percen
tage
Cases Percen
tage
Cases Percen
tage
Cases Percenta
ge
Sterilization 5 12.8 6 13.0 6 16.2 17 13.9
Condoms 3 7.7 4 8.7 4 10.8 11 9.0
Pills 4 10.3 3 6.5 4 10.8 11 9.0
Depo-
Provera
2 5.1 2 4.3 3 8.1 7 5.7
Norplant - - 2 4.3 1 2.7 3 2.5
Total 14 35.9 17 37.0 18 48.6 49 40.2
Source: Field Survey, 2008
Table 4.18 shows the distribution of respondents by current use of family planning
methods among Sarki, Gurung and Chhetri respondents. Out of the 122 respondents, 35.9
percent of Sarki, 37.0 percent of Gurung and 48.6 percent of Chhetri respondents are
currently using the family planning methods. On an average 40.2 percent of respondents
have been using any method of contraception. There are large difference between ever
use (64.8 percent) and current use (40.2 percent) because large number of males in

foreign employment and security force may be reasons for gap between ever use and
current use in the study area. Comparatively, current use of family planning method is
higher practiced of the Chhetri respondents rather than the Gurung and Sarki respondents.
Figure 4.7: Distribution of Respondents by Current Use of FP Methods by each Ethnicity
35.9
37
48.9Sarki
Gurung
Chhetri
CHAPTER-V:
WOMEN IN HOUSEHOLD DECISION MAKING PROCESS
This segment of dissertation deals with the women's status in terms of decision making in
different aspect of household as well as other activities. Decision regarding to first birth,
family planning method, cropping patterns, buying and selling live-stocks, type of fuel,
income generating activities, borrowing and lending money, education for children,
children's health, political parties, female committee and school management committee.
In course of analyzing the role of women as household decision makers, this study has
covered all relevant and possible aspects that would reflect women's decision-making
power in different matters within and outside the household. Women participation in
decision making on household sphere may affects the every aspects of life. In Nepalese
society, very low women get the opportunity of decision making on household sphere
because Nepalese patriarchal society have traditional belief that women should live under
the shadow of son, husband and parent in her old age, youth and childhood, respectively.
Nepalese society assigns some strict gender roles for men and women that lead to
discriminatory practices against women.
5.1 Decision on First Birth

Childbearing process is mainly related with health of women, women are not in the stage
of making decision on childbirth. In the study area, women (respondents) decision on
first birth as shows the following table:
Table 5.1: Distribution of Respondents by Decision on First Birth
Decision
Maker
Sarki Gurung Chhetri Total
Cases Percentage Cases Percentage Cases Percentage Cases Percentage
Husband 14 37.8 17 40.0 11 32.3 42 36.8
Self - - - - - - - -
Both 23 62.2 26 60.5 23 67.7 72 63.2
Total 37 100.0 43 100.0 34 100.0 114 100.0
Source: Field Survey, 2008
Table 5.1 shows that women never take decision on first birth. Sarki (37.8 percent),
Gurung (40.0 percent) and Chhetri (32.3 percent) respondent husbands take decision on
first birth. Sarki (62.2 percent), Gurung (60.5 percent) and Chhetri (67.7 percent)
respondents both take decision on first birth. Comparatively, husbands' decisions are
more powerful in Gurung society rather than Sarki and Chhetri society. But both or
husband and wife co-operative decision is stronger in Chhetri society rather than the
Sarki and Gurung societies. In case of decision on first birth, regarding the household
decision is concerned to the co-operative relation between couple, which is taken as the
most important conjugal phenomenon in the sound household decision-making i.e. both.
5.2 Decision on Respondents by Ever Use of Family Planning Methods
This study shows that out of 122 respondents, 79 respondents have ever used family
planning method. Among the 22 respondents of Sarki 13.6 percent make decision by
themselves. Only the 6.5 percent of Gurung respondents make decision on using the
family planning method. Out of 26 Chhetri respondents, 11.5 percent make a decision on
it. Generally, it is observed that most of the respondents take decisions on ever use family
planning method in cooperation with their husband i.e. higher percentage of Chhetri (80.7
percent) rather than the Gurung (61.3 percent) and Sarki (54.6 percent).
Table 5.2: Distribution of Respondents by Decision on Ever Use FP Method
Decision
Maker
Sarki Gurung Chhetri Total
Cases Percentage Cases Percentage Cases Percentage Cases Percentage
Husband 5 22.7 9 29.0 2 6.8 16 20.3

Self 3 13.6 2 6.5 3 11.5 8 10.1
Both 12 54.6 19 61.3 21 80.7 52 65.8
Health
Worker
2 9.1 1 3.2 - - 3 3.8
Total 22 100.0 31 100.0 26 100.0 79 100.0
Source: Field Survey, 2008
Figure 5.1: Distribution of Respondents by Decision on Ever Use FP Method
0
10
20
30
40
50
60
70
80
90
Husband Self Both Health Worker
Decision Maker
Pe
rce
nta
ge
Sarki
Gurung
Chhetri
5.3 Decision on Respondents by Current Use of FP Methods
Family planning connotes conception control to avoid pregnancy and abortion, but it also
includes efforts of couples to induce pregnancy. Current use of contraception is defined
as the proportion of women who reported the use of a family planning method at the time
of interview. The level of currently use- usually calculated among currently married
women- is the most used and valuable measure of the success of family planning
programmes. The study of differentials in current use of contraception is important
because it helps identify subgroups of the population to target for family planning
services. Decision on respondents by current use family planning methods are shows the
following table:
Table 5.3: Distribution of Respondents by Decision on Current Use FP Method
Decision
Maker
Sarki Gurung Chhetri Total
Cases Percentage Cases Percentage Cases Percentage Cases Percentage
Husband 4 10.3 5 10.9 1 2.7 10 8.2
Self 1 2.6 1 2.2 1 2.7 3 2.5
Both 9 23.1 11 23.9 16 43.2 36 29.5

Total 14 35.9 17 37.0 18 48.6 49 40.2
Source: Field Survey, 2008
Table 5.3 shows that only 40.2 percent of the respondents currently used the family
planning method. It is found that 2.6 percent of Sarki, 2.2 percent of Gurung and 2.7
percent of Chhetri respondents take decision on currently used family planning method
by them. Among these three ethnic groups: Chhetri respondents (48.6 percent), which is
higher than Gurung (37 percent) and Sarki (35.9 percent). This data indicates that Chhetri
respondents are more aware in family size than the Sarki and Gurung respondents.
5.4 Decision on Cropping
Cropping pattern is directly related to landholding size. It is one of the key economic
indicators to measure the economic well being of the community or person. Land has
great contribution in agriculture and it measures the economic status of people. Decision
on cropping is a major indicator of decision making of household. In the study area, most
of the female work in agriculture but self-decision is low. It is found that 17.9 percent of
Sarki, 26.1 percent of Gurung and 27.0 percent of Chhetri respondents take decision on
cropping by them. There is more involvement of female rather than the male in
agriculture, provided capable in decision making in fieldwork.
Table 5.4: Distribution of Respondents by Decision on Cropping
Decision
Maker
Sarki Gurung Chhetri Total
Cases Percentage Cases Percentage Cases Percentage Cases Percentage
Husband 3 7.7 3 6.5 2 5.4 8 6.5
Self 7 17.9 12 26.1 10 27.0 29 23.8
Both 13 33.3 16 34.8 15 40.6 44 36.1
Father
in Law
4 10.3 2 4.3 2 5.4 8 6.5
Mother
in Law
- - 3 6.5 1 2.7 4 3.3
Family 12 30.8 10 21.7 7 18.9 29 23.8
Total 39 100.0 46 100.0 37 100.0 122 100.0
Source: Field Survey, 2008
5.5 Decision on Buying of Livestocks
In this title, only half of the respondents have given answer yes or no. Other respondents
had no experience about this topic. It is observed that 30 percent of Sarki, 44.4 percent of

Gurung and 45.8 percent of Chhetri respondents take a decision on buying of livestocks.
Remaining respondents haven't participation on buying of livestocks. In this case, Chhetri
respondents are more likely to be involvement on buying of livestocks rather than
Gurung and Sarki respondents. But Sarki respondents have low decision on it.
Table 5.5: Distribution of Respondents by Decision on Buying of livestock
Decision
Maker
Sarki Gurung Chhetri Total
Cases Percentage Cases Percentage Cases Percentage Cases Percentage
Yes 3 30.0 12 44.4 11 45.8 26 42.6
No 7 70.0 15 55.6 13 54.2 35 57.4
Total 10 100.0 27 100.0 24 100.0 61 100.0
Source: Field Survey, 2008
5.6 Decision on Selling of Livestocks
This field survey shows that 10 percent of Sarki, 25.9 percent of Gurung and 20.8 percent
of Chhetri respondents take their decision on selling of livestocks. Comparatively,
Gurung respondents have taken higher self-decision on selling livestocks rather than the
Chhetri and Sarki respondents. Sarki respondents take lowest decision on selling
livestocks.
Table 5.6: Distribution of Respondents by Decision on Selling of livestock
Decision
Maker
Sarki Gurung Chhetri Total
Cases Percentage Cases Percentage Cases Percentage Cases Percentage
Yes 1 10.0 7 25.9 5 20.8 13 21.3
No 9 90.0 20 74.1 19 79.2 48 78.7
Total 10 100.0 27 100.0 24 100.0 61 100.0
Source: Field Survey, 2008
5.7 Decision on Using Type of Fuel for Cooking Food
It is found that 33.3 percent of Sarki, 30.4 percent of Gurung and 24.3 percent of Chhetri
respondents take a self-decision on using fuel for cooking food. These three ethnic

groups: Sarki respondents take more decision comparatively than the Gurung and Chhetri
respondents but Chhetri respondents take low self-decision.
Table 5.7: Distribution of Respondents by Decision on Using Type of Fuel for Cooking
Food
Decision
Maker
Sarki Gurung Chhetri Total
Cases Percentage Cases Percentage Cases Percentage Cases Percentage
Husband 6 15.4 9 19.6 7 18.9 22 18.0
Self 13 33.3 14 30.4 9 24.3 36 29.5
Both 17 43.6 16 34.8 13 35.2 46 37.7
Other 3 7.7 7 15.2 8 21.6 18 14.8
Total 39 100.0 46 100.0 37 100.0 122 100.0
Source: Field Survey, 2008
5.8 Decision on Going or Not Going to School for Children
Children's education is most important aspect of the household decision-making process,
which is managed by parents. In this aspect, both (father and mother) have equal
responsibilities on children's education.
Table 5.8: Distribution of Respondents by Decision on Going or Not Going to School for
Children
Decision
Maker
Sarki Gurung Chhetri Total
Cases Percentage Cases Percentage Cases Percentage Cases Percentage
Husband 3 7.7 1 2.2 1 2.7 5 4.1
Self - - 7 15.2 3 8.1 10 8.2
Both 24 61.5 22 47.8 23 62.2 69 56.5
Family 12 30.8 16 34.8 10 27.0 38 31.2
Total 39 100.0 46 100.0 37 100.0 122 100.0
Source: Field Survey, 2008
Table 5.8 shows that out of 122 respondents; 4.1 percent, 8.2 percent, 56.5 percent, 31.2
percent respondents take a decision on children's education with their husband, self, both
and family, respectively. In the three ethnicity: 7.7 percent of Sarki, 2.2 percent of
Gurung, 2.7 percent of Chhetri respondents take decision on children's education by their
husband. No one of Sarki, 15.2 percent of Gurung and 8.1 percent of Chhetri respondents
take decision on children's education by themselves. 61.5 percent of Sarki, 47.8 percent
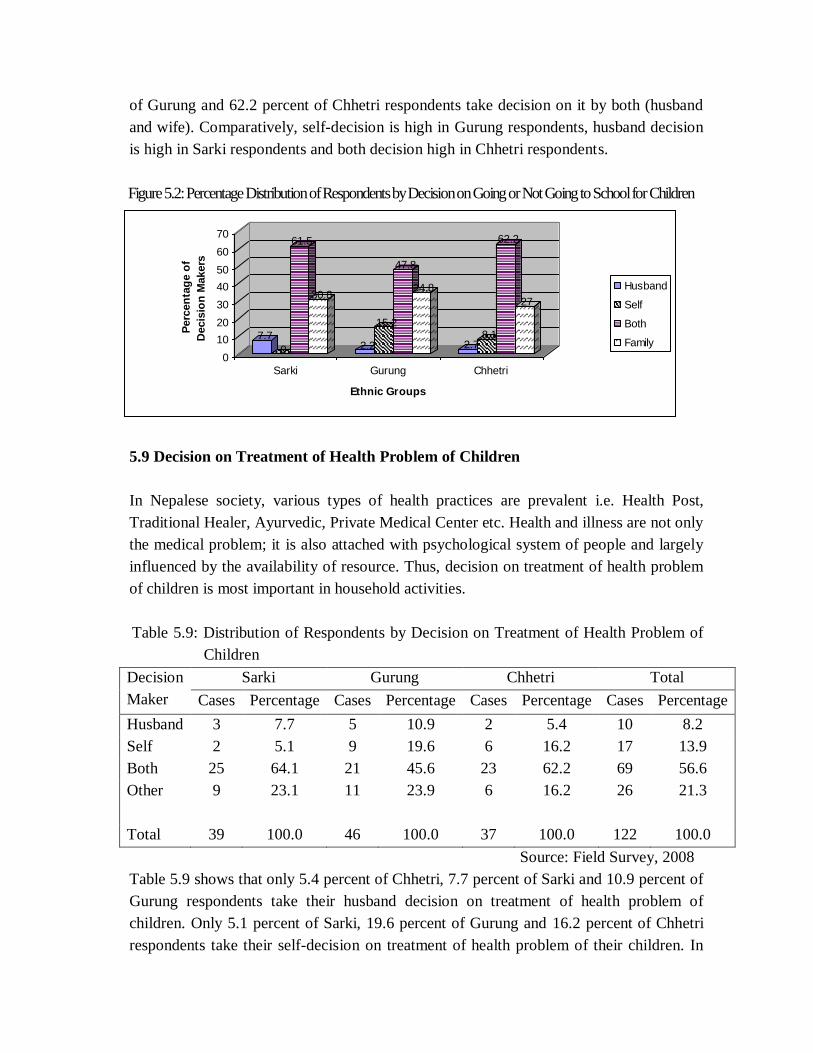
of Gurung and 62.2 percent of Chhetri respondents take decision on it by both (husband
and wife). Comparatively, self-decision is high in Gurung respondents, husband decision
is high in Sarki respondents and both decision high in Chhetri respondents.
Figure 5.2: Percentage Distribution of Respondents by Decision on Going or Not Going to School for Children
7.7
0
61.5
30.8
2.2
15.2
47.8
34.8
2.78.1
62.2
27
0
10
20
30
40
50
60
70
Perc
en
tag
e o
f
Decis
ion
Makers
Sarki Gurung Chhetri
Ethnic Groups
Husband
Self
Both
Family
5.9 Decision on Treatment of Health Problem of Children
In Nepalese society, various types of health practices are prevalent i.e. Health Post,
Traditional Healer, Ayurvedic, Private Medical Center etc. Health and illness are not only
the medical problem; it is also attached with psychological system of people and largely
influenced by the availability of resource. Thus, decision on treatment of health problem
of children is most important in household activities.
Table 5.9: Distribution of Respondents by Decision on Treatment of Health Problem of
Children
Decision
Maker
Sarki Gurung Chhetri Total
Cases Percentage Cases Percentage Cases Percentage Cases Percentage
Husband 3 7.7 5 10.9 2 5.4 10 8.2
Self 2 5.1 9 19.6 6 16.2 17 13.9
Both 25 64.1 21 45.6 23 62.2 69 56.6
Other 9 23.1 11 23.9 6 16.2 26 21.3
Total 39 100.0 46 100.0 37 100.0 122 100.0
Source: Field Survey, 2008
Table 5.9 shows that only 5.4 percent of Chhetri, 7.7 percent of Sarki and 10.9 percent of
Gurung respondents take their husband decision on treatment of health problem of
children. Only 5.1 percent of Sarki, 19.6 percent of Gurung and 16.2 percent of Chhetri
respondents take their self-decision on treatment of health problem of their children. In
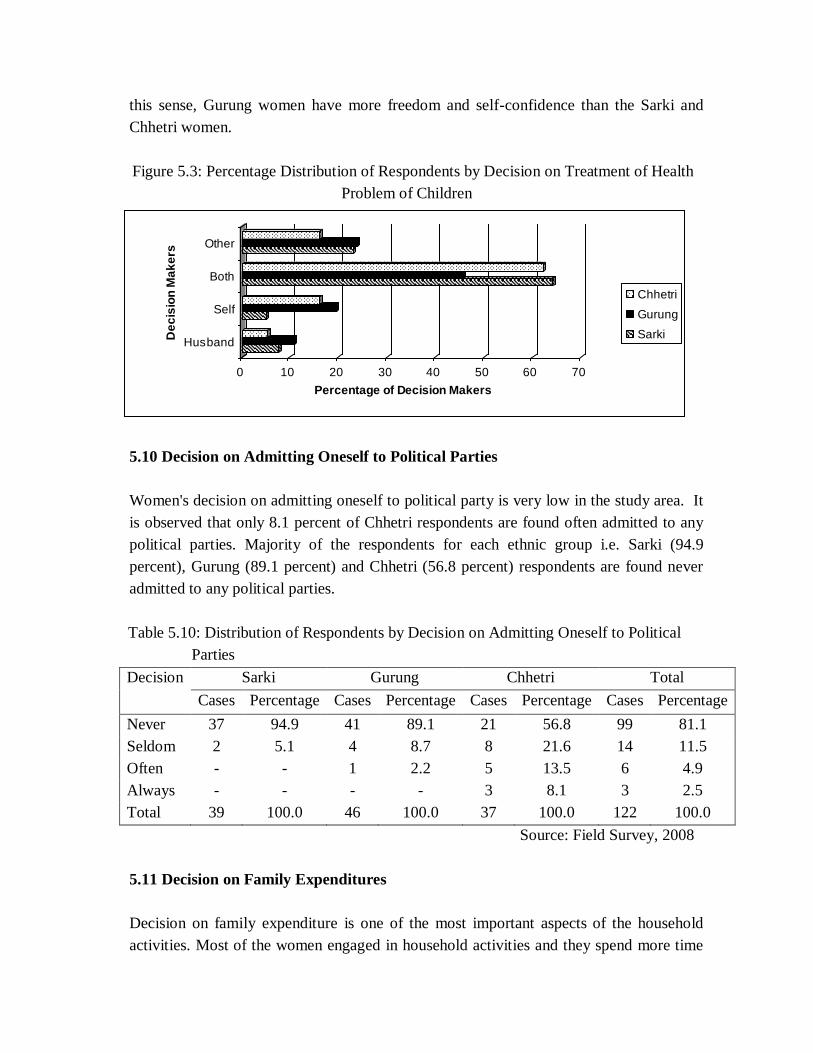
this sense, Gurung women have more freedom and self-confidence than the Sarki and
Chhetri women.
Figure 5.3: Percentage Distribution of Respondents by Decision on Treatment of Health
Problem of Children
0 10 20 30 40 50 60 70
Percentage of Decision Makers
Husband
Self
Both
Other
De
cis
ion
Ma
ke
rs
Chhetri
Gurung
Sarki
5.10 Decision on Admitting Oneself to Political Parties
Women's decision on admitting oneself to political party is very low in the study area. It
is observed that only 8.1 percent of Chhetri respondents are found often admitted to any
political parties. Majority of the respondents for each ethnic group i.e. Sarki (94.9
percent), Gurung (89.1 percent) and Chhetri (56.8 percent) respondents are found never
admitted to any political parties.
Table 5.10: Distribution of Respondents by Decision on Admitting Oneself to Political
Parties
Decision Sarki Gurung Chhetri Total
Cases Percentage Cases Percentage Cases Percentage Cases Percentage
Never 37 94.9 41 89.1 21 56.8 99 81.1
Seldom 2 5.1 4 8.7 8 21.6 14 11.5
Often - - 1 2.2 5 13.5 6 4.9
Always - - - - 3 8.1 3 2.5
Total 39 100.0 46 100.0 37 100.0 122 100.0
Source: Field Survey, 2008
5.11 Decision on Family Expenditures
Decision on family expenditure is one of the most important aspects of the household
activities. Most of the women engaged in household activities and they spend more time

for these activities than men. It is found that only 12.8 percent of Sarki, 13.0 percent of
Gurung and 21. 6 percent of Chhetri respondents always take decision on family
expenditure. But 17.9 percent of Sarki, 17.4 percent of Gurung and only 5.4 percent of
Chhetri respondents never take decision on family expenditure. So, it can be concluded
that Chhetri respondents are more participated in decision on family expenditure than
Sarki and Gurung respondents.
Table 5.11: Distribution of Respondents by Decision on Family Expenditure
Decision
on family
expenditure
Sarki Gurung Chhetri Total
Cases Percentage Cases Percentage Cases Percentage Cases Percentage
Never 7 17.9 8 17.4 2 5.4 17 13.9
Seldom 12 30.8 12 26.1 9 24.3 33 27.1
Often 15 38.5 20 43.5 18 48.7 53 43.4
Always 5 12.8 6 13.0 8 21.6 19 15.6
Total 39 100.0 46 100.0 37 100.0 122 100.0
Source: Field Survey, 2008
Figure 5.4: Percentage Distribution of Respondents by Decision on Family Expenditure
17.917.4
5.4
30.826.124.3
38.543.5
48.7
12.813
21.6
05
101520253035404550
Perc
en
tag
e o
f D
ecis
ion
Makers
Never Seldom Often Always
Decision on Family Expenditure
Sarki
Gurung
Chhetri
5.12 Decision on Taking Loan or Deposits in Woman's Name

Taking loan is a major indicator of decision making of household. In the study area, loan-
taking practices are carried out to fulfill the basic needs. It is observed that almost or 92.3
percent of Sarki respondents, more than fifty percent (58.7 percent) and less (near about)
fifty percent (48.6 percent) respondents never take decision on taking loan or deposits on
women's name. Only 4.3 percent of Gurung and 2.7 percent of Chhetri respondent always
take decision on taking loan or deposits. In the matter of always take decision; Gurung
respondents are more responsible for decision than Chhetri respondents but no one in
Sarki.
Table 5.12: Distribution of Respondents by Decision on Taking Loan or Deposits in
Women's Name
Particulars Sarki Gurung Chhetri Total
Cases Percentage Cases Percentage Cases Percentage Cases Percentage
Never 36 92.3 27 58.7 18 48.7 81 66.4
Seldom 3 7.7 17 37.0 12 32.4 32 26.2
Often - - - - 6 16.2 6 4.9
Always - - 2 4.3 1 2.7 3 2.5
Total 39 100.0 46 100.0 37 100.0 122 100.0
Source: Field Survey, 2008
5.13 Decision on Respondents by Ever Use of FP Methods by Education
Education of women is one of the main instruments to increase the self-confidence,
which helps to the participation on decision-making in household chores. Literatures have
shown that educated women are more aware of the every aspects of life. Studies have
shown that education is one of the major socio-economic factors that influence a person's
behaviour and attitudes. In general, the higher the level of education of a woman, the
more knowledgeable she is about the use of family planning method, health facilities etc.
Education has indirectly influenced by decision on using the family planning methods.
Table 5.13: Distribution of Respondents by Ever Use of FP Method by Education
Educational
Attainment
Decision
Maker Sarki Gurung Chhetri Total
Cases % Cases % Cases % Cases %
Illiterate Husband 5 31.2 7 58.3 2 50.0 14 43.7
Self - - - - 1 25.0 1 3.1
Both 1 6.3 2 16.7 - - 3 9.4

HW 1 6.3 1 8.3 - - 2 6.3
Not
users
9 56.2 2 16.7 1 25.0 12 37.5
Total 16 100.0 12 100.0 4 100.0 32 100.0
Literate Husband - - - - - - - -
Self 3 13.0 2 5.9 2 6.1 7 7.8
Both 11 47.8 17 50.0 21 63.6 49 54.4
HW 1 4.4 - - - - 1 1.1
Not
users
8 34.8 15 44.1 10 30.3 33 36.7
Total 23 100.0 34 100.0 33 100.0 90 100.0
Note: HW= Health Worker and % = Percentage Source: Field Survey, 2008
Table (5.13) shows that, among illiterate respondents, cent percent of Sarki and Gurung
respondents don't take decision by themselves on using the family planning methods but
only 25 percent Chhetri respondents take a decision by themselves. In this context, only
husband decision is more powerful than self and both decision. Also among the literate
respondents, majority of Chhetri respondents i.e. 63.6 percent, Gurung (50 percent) and
Sarki (47.8 percent) respondents make decision on using family planning methods by
cooperative way i.e. both. Literate respondents self-decision are higher than the illiterate
respondents. So, it can be concluded that education is most important indicator of the
self-confidence and decision making power of the women. In general, as women's level
of education increases they are likely to use modern spacing methods.
5.14 Decision on Cropping by Occupation
Occupation status of the women is one of the major indicators of decision on decision-
making process. Decision making power inspires empowerment and that ultimately help
in deriving the quality of life. Decision-making power is determined by various factors
such as education, health, political etc. Women occupation leads to income generate that
directly affects the decision-making trend of women because occupation upgrades the
economic status of women in family and feeling of importance of person. Occupation
enhances women to step in equal footing with men and believed that it will empower
women and bring about a reduction in the inequalities between male and female. The
result of this study is presented below:
Table 5.14: Distribution of Respondents by Decision on Cropping by Occupation
Occupation Decision
Maker
Sarki Gurung Chhetri Total
Cases % Cases % Cases % Cases %
Agriculture Husband 1 2.7 1 2.3 - - 2 1.8

Self 7 18.9 12 27.9 10 34.5 29 26.6
Both 13 35.1 16 37.2 12 41.4 41 37.6
F. in Law 4 10.8 1 2.3 1 3.4 6 5.5
M. in Law - - 3 7.0 1 3.4 4 3.7
Family 12 32.5 10 23.3 5 17.2 27 24.8
Total 37 100.0 43 100.0 29 100.0 109 100.0
Non-
agriculture Husband 2 100.0 2 66.7 2 25.0 6 46.2
Self - - - - - - - -
Both - - 1 33.3 3 37.5 4 30.8
F. in Law - - - - 1 12.5 1 7.6
Family - - - - 2 25.0 2 15.4
Total 2 100.0 3 100.0 8 100.0 13 100.0
Note: F. = Father, M. = Mother and % = Percentage Source: Field Survey, 2008
Table 5.14 shows that occupational status among the respondents by decision on
cropping. Among the respondents who are engaged in agricultural activities, majority of
the Chhetri respondents (43.5 percent) and 27.9 percent of Gurung and 18.9 percent of
Sarki respondents take a decision by themselves on cropping. But among non-agricultural
activities, all respondents do not take decision by themselves; they take decision with
their husband i.e. 100 percent, 66.7 percent, and 25 percent of Sarki, Gurung and Chhetri
respondents respectively. Comparatively husband decision is more power in Sarki society
than followed by Gurung but low in Chhetri society, those respondents who involve in
non-agriculture activities.
CHAPTER-VI: SUMMARY, CONCLUSIONS AND RECOMMENDATIONS
The chapter attempts to summarize the major findings of the entire study related to
women's participation in household decision making in Phulkharka VDC along with
conclusions and recommendations of the study.
7.1 Summary of Findings
This study analyzes the women's involvement in household decision-making process in
Phulkharka VDC of Dhading District and focused on ever-married women of
reproductive age 15-49 years. There were 872 households, 90 households were taken as
sampled households to collect information. This study is mainly focused upon the
women's participation in the household decision-making as well as other socio-economic
activities. The present study is based on primary data collected from questionnaires.
The findings of study are summarized as follows:

7.1.1 Demographic Characteristics
Among the 90 sampled households the total population is 553, among them 272 are
males and 281 are females representing 3 ethnic groups. The sex ratio is 96.8. (Table 4.1)
With report to demographic characteristics of respondents, the majority of the
respondents belong to 20-24, 30-34 and 45-49 age groups in Sarki (23.1 percent), 25-29
years in Gurung (26.1 percent) and 20-24 and 30-34 age groups in Chhetri (18.9 percent).
(Table 4.2)
Out of the total respondents of each ethnic group, 94.9 percent, 95.6 percent and 97.3
percent respondents are currently married in Sarki, Gurung and Chhetri, respectively. 2.2
percent are separated and widow in Gurung, 5.1 percent and 2.7 percent are widow in
Sarki and Chhetri, respectively. (Table 4.3)
The majority of the respondents' age at marriage is 15-19 years in each Sarki (59.0
percent), Gurung (73.9 percent) and Chhetri (56.8 percent). (Table 4.4)
Out of the total respondents of each ethnic group, Sarki (64.1 percent), Gurung (80.4
percent) and Chhetri (51.4 percent) respondents were within the age of 15-19 years at the
birth of first child. (Table 4.5)
The average number of children ever born to Sarki is 3. 0, Gurung is 3.1 and Chhetri is
2.9. (Table 4.6, 4.7,and 4.8)
7.1.2 Economic Characteristics
This study shows that majority of the respondents have 11-20 Ropani land of each ethnic
groups i.e. Sarki (48.7 percent), Gurung (47.8 percent) and Chhetri (43.3 percent). And
then Sarki (33.3 percent), Gurung (32.6 percent) and Chhetri (24.3 percent) respondents
have 21-30 Ropani land. But only 2.2 percent of Gurung and 8.1 percent of Chhetri
respondents have 40+ Ropani land. (Table 4.9)
Out of the total respondents of each ethnic group, Sarki (41 percent), Gurung (45.6
percent) and Chhetri (29.7 percent) respondents do have 'Pewa' cattle but 59 percent of
Sarki, 54.4 percent of Gurung and 70.3 percent of Chhetri respondents do not have 'Pewa'
cattle. (Table 4.10)

Regarding main source of income or occupation of the respondents, 94.8 percent of Sarki,
93.5 percent of Gurung and 78.4 percent of Chhetri respondents' occupation is
agriculture. Similarly, Sarki (2.6 percent), Gurung (2.2 percent) and Chhetri (13.5
percent) respondents main source of income is service. 4.3 percent of Gurung and 8.1
percent of Chhetri respondents involved in Business. But only 2.6 percent of Sarki
respondents main source of income is labour. (Table 4.11)
Most of the respondents have low level of income, which is hardly enough to fulfill their
households' basic needs i.e. Sarki (92.3 percent), Gurung (97.8 percent) and Chhetri (83.8
percent) of respondent's income level is less than Rs.1000 per month. (Table 4.12)
In the study area, wood is the major source of cooking fuel in all respondents i.e. Sarki
(100 percent), Gurung (93.5 percent) and Chhetri (86.6 percent). (Table 4.13)
7.1.3 Social Characteristics
Educational attainment is vital indicators of women's social status. In this study shows
that among three ethnic groups: out of the total respondents of each ethnic group, 41
percent of Sarki, 26.1 percent of Gurung and 10.8 percent of Chhetri respondents are
illiterate. The non- formal education lunched by GOs/ NGOs/ INGOs has brought
significant and remarkable change in female education. Sarki (17.9 percent), Gurung
(21.7 percent) and Chhetri (24.3 percent) respondents are non-formal literate. Primary
school enrollment is high in all ethnic groups i.e. 23.1 percent of Sarki, 34.8 percent of
Gurung and 16.2 percent of Chhetri. Similarly, only 10.3 percent of Sarki respondents'
educational level is lower secondary level. Very few respondents passed in the SLC i.e.
Sarki (5.1 percent), Gurung (8.7 percent) and Chhetri (24.4 percent). It is also found that
the negligible respondents attained the higher level of education i.e. 2.2 percent of
Gurung and 13.5 percent of Chhetri but nil in Sarki respondents. (Table 4.14)
All the respondents from Sarki and Chhetri are followed by Hindu religion; only 30.4
percent Gurung respondents followed by the Hindu religion and remaining respondents
are followed by Christian religion. (Table 4.15)
Among three ethnic groups; 20 percent of Sarki, 15.2 percent of Gurung and 51.4 percent
of Chhetri respondents take regular participation in Female Committee. But except
Chhetri respondents, majority of the respondents never participate of this committee.
(Table 4.16)

It is found that, only 4.3 percent of Gurung and 8.1 percent of Chhetri respondents
participate in Political Parties but no one of the Sarki respondents take regular
participation in Political Parties. (Table 4.17)
Out of the total respondents of each ethnic group, only 2.2 percent of Gurung and 5.4
percent of Chhetri respondents participate in School Management Committee but no one
is Sarki respondents' participation in this committee. (Table 4.18)
Out of the 122 respondents, 64.8 percent respondents have ever used any means of FP
methods. (Table 4.19)
Out of the 122 respondents, 35.9 percent of Sarki, 37.0 percent of Gurung and 48.6
percent of Chhetri respondents have been currently using at least one modern method of
family planning. (Table 4 20)
7.1.4 Women in Household Decision Making Process
Household decision-making power is strong indicator of women's empowerment of
society. Analysis has focused upon the relative status of women in terms of women's
participation in household decision-making power in demographic, socio-economic
characteristics as:
This study has shown that among three ethnic groups, all the respondents do not take
decision on first birth. Some respondents i.e. 37.8 percent of Sarki, 40.0 percent of
Gurung and 32.3 percent of Chhetri take a decision on 1st birth by their husband and
remaining one take decision by both (discuss husband and wife). (Table 5.1)
Out of the 122 respondents of each ethnic group, Sarki (13.6 percent), Gurung (6.5
percent) and Chhetri (11.5 percent) respondents take decision on ever-use of family
planning method. (Table 5.2)
Out of the 122 respondents of each ethnic group, Sarki (35.9 percent), Gurung (37.0
percent) and Chhetri (48.6 percent) respondents take decision on current use of FP
method. (Table 5.3)
Majority of women compare than the male take decision on cropping by themselves i.e.
only Sarki (7.7 percent), Gurung (6.5 percent) and Chhetri (5.4 percent) take decision on
cropping by their husband but 17.9 percent of Sarki, 26.1 percent of Gurung and 27
percent of Chhetri respondents take decision on cropping by themselves. (Table 5.4)

Majority of the respondents from each ethnic group do not take decision on buying
livestock. Only 30 percent of Sarki, 44.4 percent of Gurung and 45.8 percent of Chhetri
respondents take decision on buying livestock. (Table 5.5)
Similarly, Very few respondents from each ethnic groups do take decision on selling
livestock i.e. only 10 percent of Sarki, 25.9 percent of Gurung and 20.8 percent of
Chhetri. (Table 5.6)
It is observed that 33.3 percent of Sarki, 30.4 percent of Gurung and 24.3 percent of
Chhetri respondents take decision on using type of fuel for cooking. And 43.6 percent of
Sarki, 34.8 percent of Gurung and 35.2 percent of Chhetri take decision by both
(cooperative way). (Table 5.7)
No one of Sarki, 15.2 percent of Gurung and 8.1 percent of Chhetri respondents take
decision on going or not going to school for children. (Table 5.8)
Only 5.1 percent of Sarki, 19.6 percent of Gurung and 16.2 percent of Chhetri
respondents take decision on treatment of health problem of children. (Table 5.9)
It has been found that only 8.1 percent of Chhetri respondents take decision on admitting
oneself to political parties but no one in other ethnic groups. (Table 5.10)
The study has shown that 12.8 percent of Sarki, 13 percent of Gurung and 21.6 percent of
Chhetri respondents always take decision on family expenditures. (Table 5.11)
Out of 122 respondents, only Gurung (4.3 percent) and Chhetri (2.7 percent) respondents
always take decision on taking loan or deposits in women's name. (Table 5.12)
The total illiterate respondents, only 25 percent of Chhetri respondents take decision on
ever use of family planning method by themselves. But in literate respondents, 13 percent
of Sarki, 5.9 percent of Gurung and 6.1 percent of Chhetri respondents take decision by
themselves. (Table 5.13)
As per the occupation, among the respondents who are engaged in agricultural activities,
Sarki (18.9 percent), Gurung (27.9 percent) and Chhetri (34.5 percent) respondents take
decision by themselves; among non-agricultural activities, respondents never take
decision in all ethnic groups. (Table: 5.14)

7.2 Conclusions
This comparative study has focused to examine the socio-economic status and to find out
the women's participation in household decision making of the respondents. Men and
women are equal participation rights in household chores but patriarchy system is
practiced in the study area. In the study area, the main decision maker is male or male
dominated society is practiced. Among the three ethnic groups, early age at marriage is
highly practiced in Gurung society followed by Sarki and Chhetri society, respectively.
Gurung women give more number of births during their reproductive life span than other
two ethnic groups i.e. Chhetri and Sarki. Huge ownership of land used to Chhetri family
followed by Gurung but less practice in Sarki society. Therefore, economic status of
Chhetri respondents is well followed by Gurung. Pewa livestocks are more practice in
Gurung society followed by Sarki society but less practice in Chhetri society. Most of the
Sarki respondents engaged in agriculture work followed by Gurung respondents. Chhetri
respondents had better income level than the Sarki and Gurung respondents.
Comparatively, economic status of Chhetri is better than the Sarki and Gurung
respondents. Poor economic status can be seen in Sarki community.
Among the three ethnic groups, majority of Sarki respondents are illiterate than followed
by Gurung and Chhetri respondents, respectively. The level of primary school enrollment
is satisfactory in all respondents but Sarki drop out cases are higher than other groups
because of poor socio-economic status. Comparatively, more Chhetri respondents
attained the higher secondary education than Gurung respondents but Sarki is nil.
Literacy is widely acknowledged as benefiting the individual and the society and is
associated with a number of positive outcomes for health, and overall well-being of men
and women. Religion is changed of the Gurung respondents but not changed in Chhetri
and Sarki respondents so that Christian religion is being popular in Gurung society.
In the participation of various institutions, majority of Chhetri respondents participated in
many institutions followed by Gurung respondents but Sarki respondent are less
participated of this institution. In the decision making process, Chhetri respondents take
more decision followed by Gurung respondents, Sarki respondents less participate in
household decision making process. Therefore, Sarki are poor and backwardness ethnic
group in the study area. This study concludes that on an average all respondents (women)
have low socio-economic status and poor decision-making power in the study area. So, it
is essential to increase their knowledge, skill, attitude, practice and self-confidence to
participate in decision-making process in every sector.
7.3 Recommendations

Basis on the finding and conclusion in this study, following recommendations can be
suggested to improve the women's status and participation in decision-making process
issue:
Emphasis should be given to improve the educational level of women. For this
purpose, the government should formulate police to provide free and compulsory
education for girls.
Give priority to women in training for income generating activities.
To reduce the early marriage practice, GOs/ NGOs/ INGOs should implement
effective programmes to change the prevalent cultural norms and traditional values
towards the early marriage.
Informal education and women empowerment related programme should be given for
women.
Easily access of females to modern health facilities and family planning method.
Incentive and disincentive programmes should be lunched to change in the attitude of
society for decreasing age at marriage.
Government should lunch policies and programmes which would make possible the
people to shift from this occupation to non-agricultural occupation in their own
country.
To give an inherent rights like as ownership of land and property.
7.4 Recommendations for Future Research
This study examined the women's participation on household decision-making process in
rural areas. Thus, further research should be conducted in urban areas.
This study has covered only three ethnic groups i.e. Chhetri, Gurung and Sarki. Hence,
other ethnic groups can be taken into consideration as future researcher issues. This study
is based on sampling procedure. Hence further investigation needed in census method.
This study has covered only selected demographic and socio-economic variables so that
cultural characteristics or variables could also be used to cover the further researcher.
And also other ecological, biological, religious and other variables can be taken for future
research issue.
REFERENCES
Acharya, M., 1994, The Statistical Profile on Nepalese Women: An Update in the Policy
Context (Kathmandu: Institute for Integrated Development Studies).
Acharya, M., 1997, Gender Equality and Empowerment of women-A Study Report
Submitted to UNFPA (Kathmandu: UNFPA.
Acharya, M., 2003, Efforts at Proportion of Women in Nepal a report in Cooperation with
Friedrich-Ebert-Stiftung (Kathmandu: Tanka Prasad Acharya Memorial
Foundation/FES).

Acharya, S., 2004, Democracy Gender Equality and Women's Literacy Experience from
Nepal (Kathmandu: UNESCO).
Acharya, M. and L. Bennett, 1981, The Rural Women in Nepal: An Aggregate Analysis
and Summary of Eight Village Studies: The Status of Women in Nepal. Field
Studies, Volume II, Part 9:127-143.
Acharya, M. and L. Bennett 1983. Women and subsistence Sector, Economic Participation
and Household Decision Making in Nepal World Bank Staff Working Paper 526
(USA: World Bank).
Ahooja- Patel, Krishna, 1982, Another Development with Women Development Dialogue.
A journal of International Cooperation Published by the Dag Hammarskjold
Foundation, Uppsala 1982: (1-2): 17-28.
Asian Development Bank, 1999, Women in Nepal (Kathmandu: Program Development
West of Office of Environment and Social Development).
Beyond Beijing Committee, 2004, Nepal Beijing and Beyond—Beijing +10 NGO Country
Report 2004 (Lalitpur: Beyond Beijing Committee).
Casper J. and Miller, SJ, 2002, Decision- Making in Village Nepal, Pilgrims Publishing.
CBS, 2003, Population Monograph of Nepal, Volume-I, Central Bureau of Statistics,
Ramshah Path, Kathmandu, Nepal.
CREHPA, 2007, The Influence of Male Partners in Pregnancy Decision-Making and
Outcomes in Nepal (Kathmandu: CREHPA).
Demographic and Health Survey (DHS), 2006, Key Finding.
Demographic and Health Survey (DHS), 2006, New ERA, Kathmandu Nepal.
District Non-Governmental Organization Profile: Dhading, 2064.
Forum for Women Legal and Development, 2003, Special Measure for Women and Their
Impact (Kathmandu: FWLD).

Gautam, Gurash, 2006, Women's Educational Status and Their Decision Making Power in
Household Activities: (A Case Study of Itahari Municipality, Sunsari) Unpublished
M.A Thesis (T.U Kirtipur).
Ghimire, Durga, 1997, Women and Development, Volume-II, Part 2,CEDA, TU,
Kathmandu: 47-59.
Gurung, R. 2007, Impact of Occupational and Educational Status of Married Women in
Household Decision-Making. Unpublished M.A. Thesis. (T.U. Kathmandu).
http://www.sistersadventure.com/EWN/womeninnepal.
ILO/IPEC, 2002, Population and Social Justice (Central Department of Population Studies,
Tribhuvan University, Kirtipur, Kathmandu, Nepal).
Jejeebhoy, Shireen J., 1995, Women's Education, Autonomy, and Reproductive Behaviour:
Experience from developing Countries, Clarendon Press: Oxford.
Kaur, Satnam, 1987, Women in Rural Development: A Case Study Mittal, Delhi: 120.
Limbu, L., 1997, The Status of Tamang Women and Their Reproductive Behaviour (Ed.)
Nepal Population Journal, (Kathmandu: Population Association of Nepal).
Limbu, N., 2007, Impact of Occupational and Educational Status of Married Women in
Household Decision-making: A Case Study of Sanischare VDC of Morang District.
Unpublished M.A. Dissertation.
Nepal Planning Commission, 1992, Children and Women of Nepal – A Situation Analysis
(Kathmandu: NPC/HMG/UNICEF).
Paudyal, Tika Devi, 2003, Educational Status and Household Decision-Making of Married
Women (A Case Study of Phuyatappa VDC, Ilam District). Unpublished M.A
Thesis (T.U Kirtipur).
Pradhan Malla, Sapana, 2000,Forum for women, Law and Development (FWLD):
Baseline Study on Inheritance Right of Women, Forum for Women, Law and
Development (FWID).

Shrestha, I. And Krishna Hachhethu, 2002, Women and governance-Re imaging State from
a Gender Perspective Nepal Chapter (Kathmandu: ShtriiShakti).
Shrestha, Shanta Laxmi, 1994, Gender Sensitive Planning What, Why and How in Nepal
(Women Awareness Center, Kathmandu).
ShtriiShakti, 1995, Women Development Democracy: A Study of the Socio-Economic
Changes in the Profile of Women in Nepal (Kathmandu: ShtriiShakti).
Subedi, P., 1997, Women and Violence-Nepali Women Rising (Kathmandu: Sahayogi
Press).
UN, 1994, International Conference On Population and Development Cairo Egypt 1994,
(New York United Nations).
UN, 1995, Report of the Fourth World Conference of Women (New York: UN).
UNFPA, 2003, Achieving the Millennium Development Goals, Population and
Reproductive Health as Critical Determinants (Kathmandu: United Nations
Population Fund).
.
QUESTIONNAIRE
Women's Participation In Household Decision Making
(A Comparative Study Of Sarki, Gurung and Chhetri Married Women In
Phulkharka VDC, Dhading District)
Survey Questionnaire
Central Department of Population Studies
Tribhuvan University
Kirtipur, Kathmandu
Date:
1.Demographic Information:

B. Personal Information
Name of respondent: … … … … … … … ……, Age: … …………, Sex… … ……..,
Marital Status... … … …, Religion: … … …, Occupation: … … … …,
Caste/ Ethnicity: … … … …, Family Structure … … …, Educational Status: … … …,
Address: District: … … … , Ward: … … , Tole: … … …,Age at marriage: … … ….
C. Household Information
1.Family Information:
S.N Name of
the family
members
Relation
with
household
head
Age Sex Marital
status
Education Occupation
1
2
3
4
5
6
7
8
9
10
C. Birth Information
1. Have you given any live birth to a baby till now?
(i) Yes (ii) No
2. How old are you to give a first birth?… … … …
3. Who decided for it?
(i) Self (ii) Husband (iii) Both (iv) Other
4. How many of them are living with you?
(i) Sons (…) (ii) Daughter (…)
5. Do any of your own children not living with you now?
(i) Yes (ii) No
6. How many of them are not living with you now?
(i) Sons (…) (ii) Daughter (…)
2. Economic Information:
D. House-Land Information
1. How much of land do your family using? … … In Ropani.

2. How many land have in your own name? … …In Ropani
3. Type of your roof of the house.
(i) Tin (ii) Stone (iii) Grass (iv) Other.
4. Who is landowner?
(i) Husband (ii) Father in law (iii) Self (iv) Other.
E. Agricultural Information
4. Are you engaged in agriculture?
(i) Yes (ii) No
2. Who make decision on cropping?
(i) Self (ii) Husband (iii) Other.
3. Is the food production in your land sufficient for consumption for a whole year?
(i) Yes (ii) No.
4. If no, from where do you fulfill food deficit?
(i) Service (ii) Livestock (iii) Wage earning (iv) Other.
5. Did you buy any food products by your own decision during the last year?
(i) Yes (i) No.
6. Did you sell any surplus food by your own decision during the last year
(i) Yes (ii) No.
F. Livestock Information
1.What kind of animal do you have and how many?
S.N Animal Yes (numbers) No
1 Goat
3 Buffalo
4 Ox and Cow
6 Hen
7 Other
5. Do you have any animal "Pewa"?
(i) Yes (ii) No.
6. If yes, which animal do you have and how many?
(i) Goat ( ) (ii) Buffalo ( ) (iii) Hen ( )
(iv) Ox And Cow (v) Other ( )
7. Did you buy any livestock by your own decision during the last year?
(i) Yes (ii) No.
8. Did you sell any livestock by your own decision during the last year?
(i) Yes (ii) No
9. Are you asked during selling purchasing of any livestock in your family?
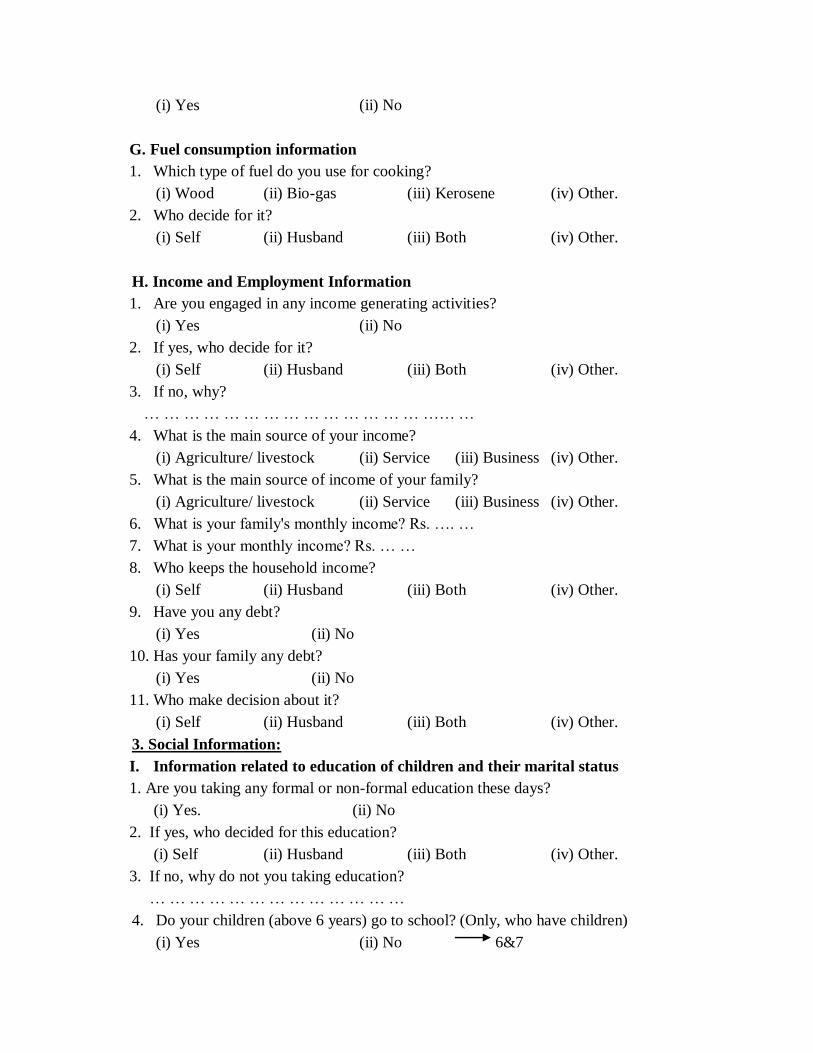
(i) Yes (ii) No
G. Fuel consumption information
1. Which type of fuel do you use for cooking?
(i) Wood (ii) Bio-gas (iii) Kerosene (iv) Other.
2. Who decide for it?
(i) Self (ii) Husband (iii) Both (iv) Other.
H. Income and Employment Information
1. Are you engaged in any income generating activities?
(i) Yes (ii) No
2. If yes, who decide for it?
(i) Self (ii) Husband (iii) Both (iv) Other.
3. If no, why?
… … … … … … … … … … … … … … …… …
4. What is the main source of your income?
(i) Agriculture/ livestock (ii) Service (iii) Business (iv) Other.
5. What is the main source of income of your family?
(i) Agriculture/ livestock (ii) Service (iii) Business (iv) Other.
6. What is your family's monthly income? Rs. …. …
7. What is your monthly income? Rs. … …
8. Who keeps the household income?
(i) Self (ii) Husband (iii) Both (iv) Other.
9. Have you any debt?
(i) Yes (ii) No
10. Has your family any debt?
(i) Yes (ii) No
11. Who make decision about it?
(i) Self (ii) Husband (iii) Both (iv) Other.
3. Social Information:
I. Information related to education of children and their marital status
1. Are you taking any formal or non-formal education these days?
(i) Yes. (ii) No
2. If yes, who decided for this education?
(i) Self (ii) Husband (iii) Both (iv) Other.
3. If no, why do not you taking education?
… … … … … … … … … … … … …
4. Do your children (above 6 years) go to school? (Only, who have children)
(i) Yes (ii) No 6&7

5. If yes,
Children Total number Number going to school
Son Daughter Son Daughter
Number of son
Number of daughter
6. If no, sons do not go, why?
… … … … … … … … … … … …
7. If no, daughters do not go, why?
… … … … … … … … … … … …
8. Who make decision on going to school of your children?
(i) Self (ii) Husband (iii) Both (iv) Other
9. Who make decision on not going to school of your children?
(i) Self (ii) Husband (iii) Both (iv) Other
10. Have any of your children got married?
(i) Yes (ii) No
11. If yes, who decided for it?
(i) Self (ii) Husband (iii) Both (iv) Other
J. Information related to Health
1. Have you any health problem of your children?
(i) Yes (ii) No.
2. If yes, which problem (mention disease name).
… … … … … … … … … … … … … … …
3. Where will you bring your children for the treatment?
(i) Health post (ii) Private Medical center
(iii) Traditional Healer (iv) Other
4. Who decided for it?
(i) Self (ii) Husband (iii) Both (iv) Other
K. Information related to social activities
1. Do you engage in social activities?
(i) Yes (ii) No
2. If yes, what kind of social institutions do you engaged?
S.N. Social Institution Regularly Sometime Never
1 Female committee
2 Political parties
3 School management committee
4 Other
3. Who make decision in participating on such social activities?
(i) Husband (ii) Neighbour (iii) Self (iv) Other.
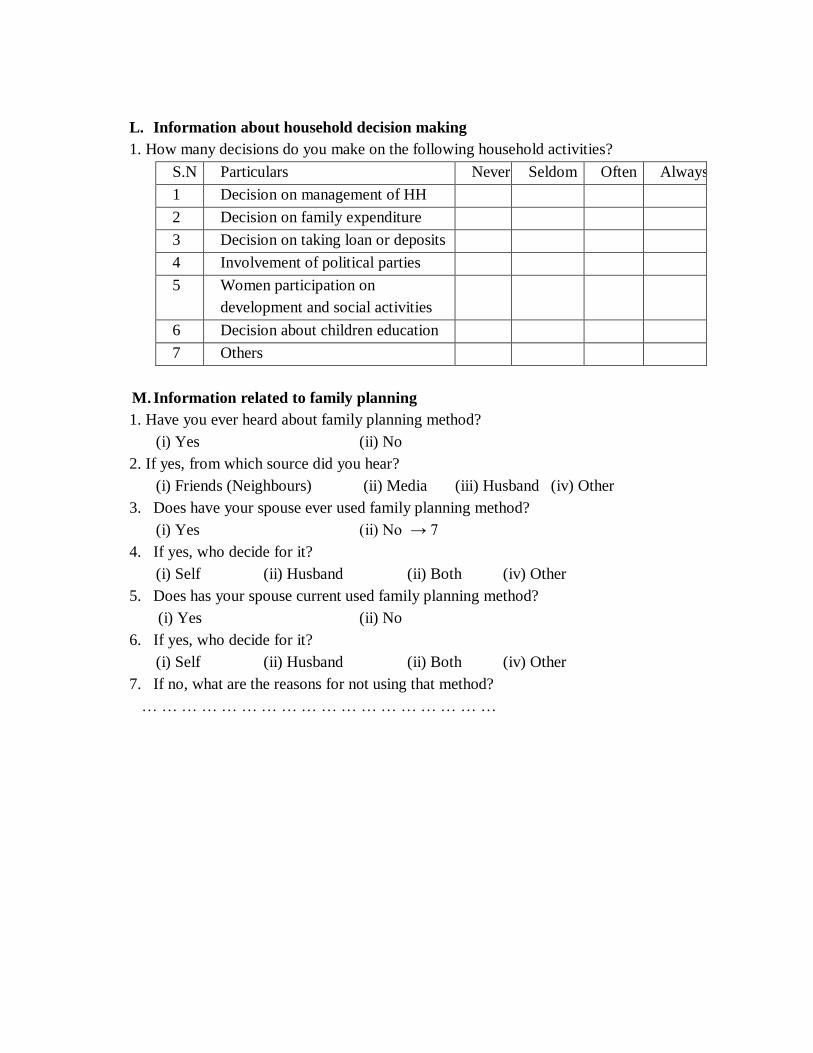
L. Information about household decision making
1. How many decisions do you make on the following household activities?
S.N Particulars Never Seldom Often Always
1 Decision on management of HH
2 Decision on family expenditure
3 Decision on taking loan or deposits
4 Involvement of political parties
5 Women participation on
development and social activities
6 Decision about children education
7 Others
M. Information related to family planning
1. Have you ever heard about family planning method?
(i) Yes (ii) No
2. If yes, from which source did you hear?
(i) Friends (Neighbours) (ii) Media (iii) Husband (iv) Other
3. Does have your spouse ever used family planning method?
(i) Yes (ii) No → 7
4. If yes, who decide for it?
(i) Self (ii) Husband (ii) Both (iv) Other
5. Does has your spouse current used family planning method?
(i) Yes (ii) No
6. If yes, who decide for it?
(i) Self (ii) Husband (ii) Both (iv) Other
7. If no, what are the reasons for not using that method?
… … … … … … … … … … … … … … … … … …