Women's Marketing Benchmark Study Final PPT
39
1 Women’s Sports Marketing Benchmark Study { December 9, 2015 }
-
Upload
abigail-curry -
Category
Documents
-
view
86 -
download
0
Transcript of Women's Marketing Benchmark Study Final PPT

1
Women’s Sports Marketing Benchmark Study
{ December 9, 2015 }

2
BSBA 2016 BSBA 2017 Faculty Advisor
Women’s Sports Marketing Benchmark Study Team
Abigail CurryPaige Nielsen Randy Myer

3
Agenda
• Key Question
• Current State
• Fan Survey Analysis
• University Participation Analysis
• Key Takeaways and Implementation
Key Question Current State Survey AnalysisUniversity
Participation Analysis
Key Takeaways/Imple
mentation

4
Key Question
How can UNC produce larger attendance numbers for female sporting events?
Key Question Current State Survey AnalysisUniversity
Participation Analysis
Key Takeaways/Imple
mentation

5Key Question Current State Survey AnalysisUniversity
Participation Analysis
Key Takeaways/Imple
mentation
The percent of facility filled varies among sports
Source: UNC Staff
Basketball
Field Hocke
y
Lacrosse
Socce
r
Softball
Volleyb
all0%
10%
20%
30%
40%
50%
60%
70%
43%40%
8%
28%
60%
29%
Perc
ent o
f Fac
ility
Fill
ed (%
)

6
34.7%Of our facilities are filled on average for female sporting
events
Average percent capacity is roughly 35% with Softball being the highest and Lacrosse being the lowest
1 • Softball
2 • Basketball
3• Field
Hockey4 • Volleyball
5• Soccer
6 • Lacrosse
v
Key Question Current State Survey AnalysisUniversity
Participation Analysis
Key Takeaways/Imple
mentation
Source: UNC Staff

7
Attendance number and percent utilization are not aligned because of a variation in facility size
Key Question Current State Survey AnalysisUniversity
Participation Analysis
Key Takeaways/Imple
mentation
Source: UNC Staff
Basketball
Field Hocke
y
Lacrosse
Socce
r
Softball
Volleyb
all0
1000
2000
3000
4000
5000
6000
7000
8000
2922
435 472
1663
300
2000
3900
651
5528 4337
200
4822
Column1Series 2
Num
ber o
f Peo
ple
Remaining Seats
Avg. # of Fans

8
1 • Basketball
2 • Volleyball
3 • Soccer4 • Lacrosse
5• Field
Hockey
6 • Softball
v
2,922People is the highest average
attendance value for UNC female sports
Basketball has the highest average attendance and Softball has the lowest
Key Question Current State Survey AnalysisUniversity
Participation Analysis
Key Takeaways/Imple
mentation
Source: UNC Staff

9
Objectives
DemographicsIncentivesFacilitiesParking
EntertainmentSocial MediaScheduling
Objectives
Staff BackgroundProgram Attendance
Program PerformanceMarket and Marketing Programs
BudgetIn-game Experience
Tickets/Loyalty Programs
UNC Fan Survey Program Survey
To identify opportunities to improve attendance at UNC’s female sporting events we created two surveys: (1) UNC Fan Survey and (2) Program Survey—other programs
Key Question Current State Survey AnalysisUniversity
Participation Analysis
Key Takeaways/Imple
mentation
Procedure

10
Fan Survey Analysis
Key Question Current State Survey AnalysisUniversity
Participation Analysis
Key Takeaways/Imple
mentation

11
SEX
RACE
Survey Analysis - Demographics
150 # of Survey Respondents
Key Question Current State Survey AnalysisUniversity
Participation Analysis
Key Takeaways/Imple
mentation
AGE
12
Survey Analysis - Demographics
1
Key Question Current State Survey AnalysisUniversity
Participation Analysis
Key Takeaways/Imple
mentation
2
3 4
13
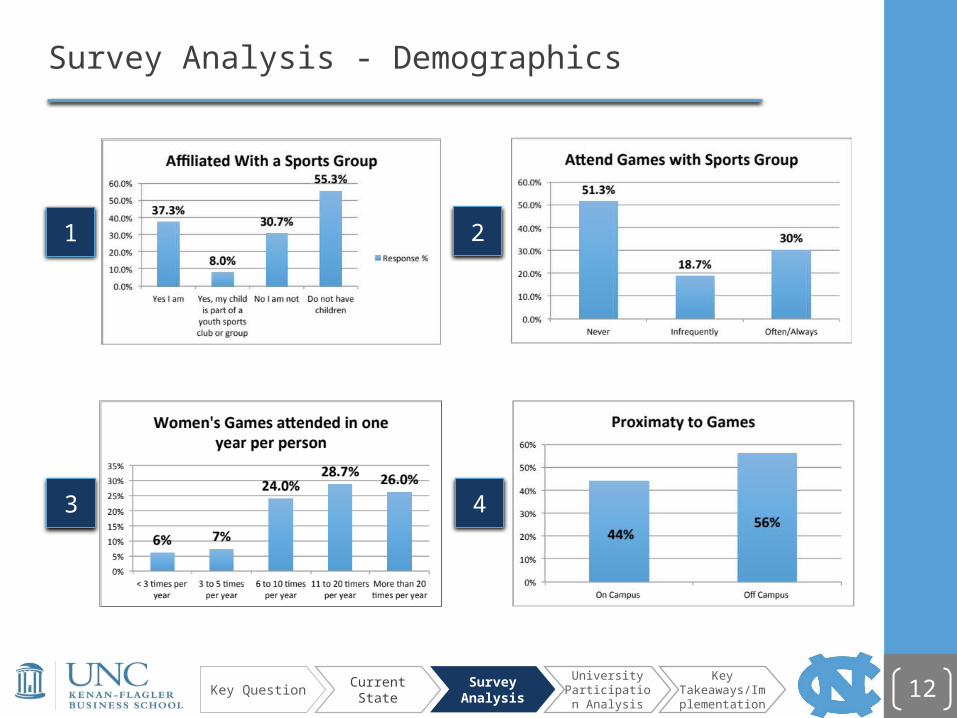
Interesting Trends – UNC Fan Survey
Of people would attend more games if parking was more
convenient 70%
Of people prefer game time M-Fr at 7pm 70%
Of people use Twitter and UNC Athletic Website for Info78%
Of people say that free apparel
is a huge incentive 81%
Of people say that professional entertainment is best for half-
time shows60%
Of people say that quality of view is the most important factor
for in-game experience 91%
Pre-game Issues In-game Issues
Key Question Current State Survey AnalysisUniversity
Participation Analysis
Key Takeaways/Imple
mentation

14
Pre-Game Survey Analysis – Parking
• If parking improved, 71.7% of surveyed students said they would attend more games.
1
• If parking improved 69.4% of surveyed adults said they would attend more games.
2
• Overall Satisfaction with Parking (1-10)3
Key Question Current State Survey AnalysisUniversity
Participation Analysis
Key Takeaways/Imple
mentation
3.96

15
Pre-Game Survey Analysis – Scheduled Time
Weekday Overall – Top 2
7 pm 69%
6:30 pm 56%
Saturday Overall – Top 2
3 pm 51%
5 pm 51%
Sunday Overall – Top 2
2 pm 47%
3 pm 49%
Key Question Current State Survey AnalysisUniversity
Participation Analysis
Key Takeaways/Imple
mentation

16
Pre-Game Survey Analysis – Social Media
Students – Top 2
Twitter 81%
UNC Athletics Website 69%
Adults – Top 2
Key Question Current State Survey AnalysisUniversity
Participation Analysis
Key Takeaways/Imple
mentation
Twitter 78%
UNC Athletics Website 77%

17
Adults – Top 3Students – Top 3
Pre-Game Survey Analysis – Facility
Quality of ViewScreens & ReplaysEase of Access to Facility
Quality of ViewComfortable Seating Easy of Access to Facility
Key Question Current State Survey AnalysisUniversity
Participation Analysis
Key Takeaways/Imple
mentation

18
Students – Top 3
• If alcohol would be served • Post game autograph sessions• In-game competitive contest• Athlete interaction post game
Pre-Game Analysis – What would incentivize fans to come?
Free Giveaways 79% Significant Prizes 58% Entertainment 52%
Adults – Top 3
More Comfort 49%Better Facility 45%Coach Interaction 41%
Key Question Current State Survey AnalysisUniversity
Participation Analysis
Key Takeaways/Imple
mentation
Other Categories with Less Popularity:

19
In-Game Survey Analysis – Prizes
Student – Top 2
Apparel 89%
Future Game Tickets 68%
Adults – Top 2
Apparel 65%
Post Season Tickets 41%
Key Question Current State Survey AnalysisUniversity
Participation Analysis
Key Takeaways/Imple
mentation

20
In-Game Survey Analysis – Halftime Entertainment
Student – Top 2
Prof. Entertainment 71%
Open Competition 71%
Adults – Top 2
Prof. Entertainment 43%
Mascot Events 41%
Key Question Current State Survey AnalysisUniversity
Participation Analysis
Key Takeaways/Imple
mentation
21
University Participation Analysis
Key Question Current State Survey AnalysisUniversity
Participation Analysis
Key Takeaways/Imple
mentation

22
Factors and process used to survey selected universities
Identified top 6 female collegiate programs ranked by attendance provided by Michael Beale and his team from online database
Chose the top 3 schools from each sport; if no ACC team present chose highest ACC program as the 3rd position
Identified Marketing Directors/Assistant Directors for each university department or sport specific representative
1
2
3
4Leveraged the UNC Athletic Marketing department to introduce the project to the identified programs and sent survey to them—corresponded through email
Key Question Current State Survey AnalysisUniversity
Participation Analysis
Key Takeaways/Imple
mentation

23
Marketing Directors from these 9 programs—11 sports—completed the survey
Key Question Current State Survey AnalysisUniversity
Participation Analysis
Key Takeaways/Imple
mentation
Softball Volleyball & Ice Hockey Tennis
Swimming & Diving Track & Field Volleyball
Tennis & Soccer Track & Field Baseball

24
Survey questions were designed to assess correlation between these factors and attendance
STAFF BACKGROUND• Program Management Experience
PROGRAM ATTENDANCE
• Attendance Trends• Crowd Demographics• Attendance Trends Intra-season• Scheduling Tendencies (Day of week, time, conflicts, etc.)
PROGRAM PERFORMACE
• End of Season Records• End of Season Rankings• Program History
MARKET AND MARKETING PROGRAMS
• Target Audience• Effective Marketing and Advertising Channels• Promotional Opportunities
Key Question Current State Survey AnalysisUniversity
Participation Analysis
Key Takeaways/Imple
mentation

25
BUDGET
• Allotment • Successful Spending
IN-GAME EXPERIENCE
• Fan Programs and Clubs • Spectator Engagement (Replays, statistics, videos, etc.)• Raffles and Prize Giveaways • Amenities or Services• Half-time Activities
TICKETS
• Pricing• Purchasing • Seat Selection
Survey questions were designed to assess correlation between these factors and attendance (continued)
Key Question Current State Survey AnalysisUniversity
Participation Analysis
Key Takeaways/Imple
mentation

26
• Majority of Marketing Directors manage more than 1 sport with varying attendance performance
• There may be inherent advantages in managing more than one sport
• 7 of the 9 participating programs have staff with 1 – 5 years of experience
General Findings: Staff Background
There is no correlation between school attendance rankings with the experience of the Marketing Directors /Assistant Marketing Directors or sport specific representatives
Dedicated Marketing Directors/Assistant Marketing Director or sports specific representatives can benefit from managing more than one sport
1
2
Key Question Current State Survey AnalysisUniversity
Participation Analysis
Key Takeaways/Imple
mentation

27
• Multiple programs indicated that the minority of attendees were students—less than 25% in most cases and some as low as 10%
• Rivalry games and games against ranked opponents bring larger attendance numbers
• Games late in conference play bring larger attendance numbers
General Findings: Program Attendance
• Early time-slot, weekend games can be targeted for larger attendance • There is a difference of opinion about whether holidays should be avoided • Most programs are scheduled around their conference television networks
Opponent and conference games are a significant driver of attendance
In general, attendees are youth teams, families with children, and middle-aged people
Scheduling is an important factor, but is mostly dependent on outside forces.
1
2
3
Key Question Current State Survey AnalysisUniversity
Participation Analysis
Key Takeaways/Imple
mentation

28
• Generally have a historical ranking within the top 25• Many universities have competed for a national title in the last 5 years
General Findings: Program Performance
• Nebraska volleyball, Wisconsin hockey, Florida softball sold out for 5+ years• Typically they sell season tickets and charge for their games• Each of them have fan clubs with special benefits
Majority of programs have strong performance records in conference play and achieve repeat appearances in the NCAA tournament
It is clear that performance is a driver of attendance however many programs have established a loyal fan base, which lifts their numbers
1
2
Key Question Current State Survey AnalysisUniversity
Participation Analysis
Key Takeaways/Imple
mentation

29
General Findings: Market and Marketing Programs
• Print is beneficial as well—magazines, flyers, pocket schedules, banners
Market generally consists of young families, students, and middle-aged adults
Social media—Twitter, Intagram, Facebook, Snapchat—and other technology—email, website, radio, and TV—are very effective marketing tools
1
2
• Ticket Scavenger Hunt• Classroom Cardinal• Season Ticket Holders Meet and Greets• Theme Nights• Food Truck Nights • Champions of Character • Athlete Alumni Signing—famous or well known • Student Rewards App
Most programs have creative marketing promotions that have drawn a large crowd3
Key Question Current State Survey AnalysisUniversity
Participation Analysis
Key Takeaways/Imple
mentation

30
General Findings: Budget
• Generally marketing departments spend more on promotions—up to 90% of marketing spend—than adverting and other miscellaneous resources
Each program has a different budget that they allot to different marketing categories– Marketing and Promotions, Advertising, and other programs
Of marketing spend, marketing and promotions yielded the best results
1
2
Average Budget Allocation (%)
Advertising
Marketing and Promotions
Other Programs
0% 20% 40% 60% 80%
20%
64%
20%
Key Question Current State Survey AnalysisUniversity
Participation Analysis
Key Takeaways/Imple
mentation
Source: Participating Program Staff

31
General Findings: In-game Experience
• Elements such as replays, statistics, promotional videos, etc.• Games like trivia contests are more frequently used than our standard 3 hats
• T-shirts were the most effective of all giveaway promotions• Food is a bigger seller with students
Interactive video board elements are a significant driver for in-game experience satisfaction
T-shirts, old jerseys, sport specific apparel and food are significant incentives for attendance
1
2
• Pre-game clinics and on-court opportunities with introductions• Athlete or coach pre or post game interaction events
Post-game interactions such as meet and greets and autograph sessions are significant incentives for attendance3
Key Question Current State Survey AnalysisUniversity
Participation Analysis
Key Takeaways/Imple
mentation

32
General Findings: Tickets
• Within these programs, students accumulate points to be used at a later date for prizes, giveaways or tickets at future events
• A few programs charge for single ticket admission• offer group discounts and season pass discounts
In general, each university has a rewards program for students similar to what we have with Fever
Majority of the programs offer free admission for female sports
1
2
• Although, people are seeing a rise in online ticketing
Day of competition sales and walk up crowds are the most common 3
Key Question Current State Survey AnalysisUniversity
Participation Analysis
Key Takeaways/Imple
mentation

33
Key Takeaways and Implementation
Key Question Current State Survey AnalysisUniversity
Participation Analysis
Key Takeaways/Imple
mentation

34
PROGRAM HISTORY AND TRADITION• Most successful programs
o Wisconsin hockeyo Nebraska volleyballo Florida softball
• Reasons why are varied but knowno Region has very strong high school and club sport history in these sportso Really no professional teams compete in these marketso All are college towns with limited entertainment beyond sports
• These programs tend to attract primarily families and middle aged fanso Have many outreach and communications programs for this audienceo Students are only 10-20% of the crowd o Parking, facility quality (seats, views) and services are less of an issue
PROGRAM PERFORMACE
• Majority of programs have conference championships and NCAA appearances under their belt; performance is a driver of fan support o Wisconsin hockey – 4 national championships*; 4 final four appearances*o Nebraska volleyball - 3 national championships*; 4 final four appearances*o Florida softball – 2 national championships*; 16 NCAA appearances*
* Last 20 years
Long-term Program Success = Higher Attendance
Key Question Current State Survey AnalysisUniversity
Participation Analysis
Key Takeaways/Imple
mentation

35
MARKET AND MARKETING PROGRAMS
• Social media functions as a significant force to channel information to fanso Twitter is best vehicle but some are experimenting with Instagram and Facebook
• T-shirt giveaways and free food were more effective than any other giveawayo Prize raffles is something others do but we do not
• Fan clubs with special benefits• Special seating sections for them to be together and common t-shirts help
• Creative marketing strategies have provided increases in numbers at select gameso i.e. ticket scavenger hunt, theme nights, food trucks, etc.
Key Takeaways: Fan Survey and Program Survey
TICKETS
• Ticket pricing was not a huge factor in driving attendance• In general, there was not priority seating allotted for ticket holders
o Nebraska—all reserved tickets for public, student first come first serve o Florida—first come first serve for all public o Wisconsin Ice Hockey—no preferred seating / reserved seating and general
admission • Season ticket programs with special communications and separate benefits are common
Key Question Current State Survey AnalysisUniversity
Participation Analysis
Key Takeaways/Imple
mentation

36
BUDGET
• Most success comes from giveawayso Due to the fact that this is one of the most successful promotional strategies
• Most of their budgets are allocated towards promotions
IN-GAME EXPERIENCE• Interactive video board elements are one of the most successful tools
o Replays, stats, promotional videos, interviews, minute to win it videos, other athlete inspired entertainment
o Kids in the crowd shots also very popular – i.e. new rams horn shots o Trivia contests are very popular with the students – but need prizeso Name that tune are also fun and engaging
• People were most likely to attend with the hopes of free food or apparelo Sport related apparel, old jerseys, autographed paraphernalia
• Any chance to create athlete or coach interaction is a driver for attendanceo Kids on the court for national anthem, raffle opportunities to sit on the bench, pre
or post game clinics
Key Takeaways: Fan Survey and Program Survey
Key Question Current State Survey AnalysisUniversity
Participation Analysis
Key Takeaways/Imple
mentation
37
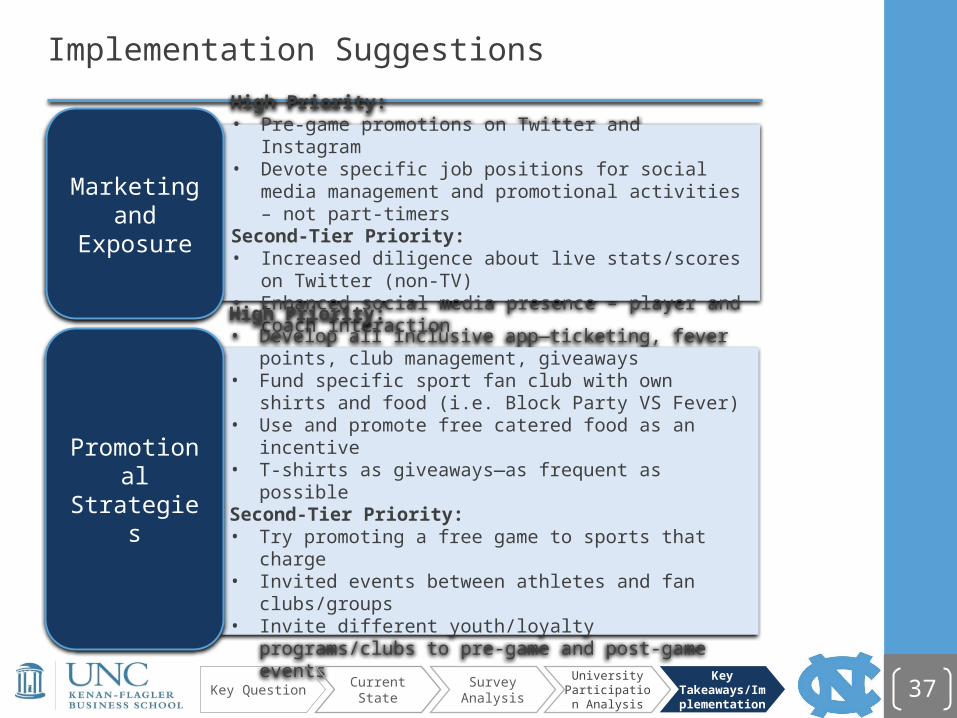
Implementation Suggestions
High Priority:• Pre-game promotions on Twitter and Instagram• Devote specific job positions for social media management and
promotional activities – not part-timersSecond-Tier Priority:• Increased diligence about live stats/scores on Twitter (non-TV)• Enhanced social media presence – player and coach interaction
Marketing and Exposure
High Priority:• Develop all inclusive app—ticketing, fever points, club
management, giveaways • Fund specific sport fan club with own shirts and food (i.e. Block
Party VS Fever) • Use and promote free catered food as an incentive• T-shirts as giveaways—as frequent as possible Second-Tier Priority:• Try promoting a free game to sports that charge• Invited events between athletes and fan clubs/groups• Invite different youth/loyalty programs/clubs to pre-game and
post-game events
Promotional Strategies
Key Question Current State Survey AnalysisUniversity
Participation Analysis
Key Takeaways/Imple
mentation

38
High Priority:• Premium seat locations for loyal fans--i.e. Courtside club for
volleyball and women’s basketball for season ticket holders • Cushioned backed seats for outdoor stadium seating (i.e.
football) Second-Tier Priority:• Have small van shuttle service from other parking locations—like
basketball and football on a smaller scale – for best games • Revamp facilities that have become outdated with an emphasis
on comfort, quality of view from all angles, accessibility, and parking
• Create an extension of the school of government parking with a deck to increase parking opportunities in the middle of campus
High Priority:• More use of interactive video board – trivia, fan shots, live music
shot of crowd, videos related to sports • Professional level entertainment (i.e Bouncing Bulldogs) • Organized half-time shows—dance teams, UNC choir, Frisbee
dog, live music karaoke, etc.
Implementation Suggestions
In-game Experience
Facilities / Transportation
and Parking
Key Question Current State Survey AnalysisUniversity
Participation Analysis
Key Takeaways/Imple
mentation

39
THANK YOU!


![Utilizing Benchmark Guiding Assessments …€¢ Are anchored in meaningful, ... Educational Philosophy ... Utilizing Benchmark Guiding Assessments Dec2010.ppt [Compatibility Mode]](https://static.fdocuments.net/doc/165x107/5b030a537f8b9ab9598eba9b/utilizing-benchmark-guiding-assessments-are-anchored-in-meaningful-educational.jpg)