Womenomics 4.0 Time to Walk the Talk - Goldman Sachs 30, 2014 Japan: Portfolio Strategy Womenomics...
33
May 30, 2014 Japan: Portfolio Strategy Womenomics 4.0: Time to Walk the Talk Portfolio Strategy Research Economic case and areas for improvement With Japan’s population set to shrink by 30% and the elderly ratio expected to reach 40% by 2060, Japan has much to gain by boosting female employment. We estimate that by closing the gender employment gap, the potential boost to Japan’s GDP could be nearly 13%. While some progress has been made in recent years, there is still much room for improvement. Japan’s female labor participation remains low vs. other countries, too few females occupy leadership positions, gender pay gaps persist, tax distortions discourage married women from participating fully in the workplace, and gender-related corporate disclosures remain inadequate. Three-pronged recommendations (1) The government should deregulate daycare/nursing care sectors, reform immigration laws, neutralize the tax and social security codes, mandate gender-related corporate disclosures, equalize part-time and full-time work, and boost female representation in the government. (2) The private sector should stress the business case for diversity, create more flexible work environments, adopt objective evaluation schemes, set diversity targets, introduce a more flexible employment contract, and engage male champions of diversity. (3) Society at large also needs to work to dispel various myths about Womenomics and encourage greater gender equality at home. This report is a modified version of the Womenomics 4.0: Time to Walk the Talk, originally published on May 6, 2014. Kathy Matsui +81(3)6437-9950 [email protected] Goldman Sachs Japan Co., Ltd. Hiromi Suzuki +81(3)6437-9955 [email protected] Goldman Sachs Japan Co., Ltd. Kazunori Tatebe +81(3)6437-9898 [email protected] Goldman Sachs Japan Co., Ltd. Tsumugi Akiba +81(3)6437-9966 [email protected] Goldman Sachs Japan Co., Ltd. Goldman Sachs does and seeks to do business with companies covered in its research reports. As a result, investors should be aware that the firm may have a conflict of interest that could affect the objectivity of this report. Investors should consider this report as only a single factor in making their investment decision. For Reg AC certification and other important disclosures, see the Disclosure Appendix, or go to www.gs.com/research/hedge.html. Analysts employed by non-US affiliates are not registered/qualified as research analysts with FINRA in the U.S. The Goldman Sachs Group, Inc. Global Investment Research
Transcript of Womenomics 4.0 Time to Walk the Talk - Goldman Sachs 30, 2014 Japan: Portfolio Strategy Womenomics...

May 30, 2014
Japan: Portfolio Strategy
Womenomics 4.0:
Time to Walk the Talk
Portfolio Strategy Research
Economic case and areas for improvement
With Japan’s population set to shrink by 30% and the elderly ratio expected
to reach 40% by 2060, Japan has much to gain by boosting female
employment. We estimate that by closing the gender employment gap, the
potential boost to Japan’s GDP could be nearly 13%. While some progress
has been made in recent years, there is still much room for improvement.
Japan’s female labor participation remains low vs. other countries, too few
females occupy leadership positions, gender pay gaps persist, tax
distortions discourage married women from participating fully in the
workplace, and gender-related corporate disclosures remain inadequate.
Three-pronged recommendations
(1) The government should deregulate daycare/nursing care sectors, reform
immigration laws, neutralize the tax and social security codes, mandate
gender-related corporate disclosures, equalize part-time and full-time work,
and boost female representation in the government. (2) The private sector
should stress the business case for diversity, create more flexible work
environments, adopt objective evaluation schemes, set diversity targets,
introduce a more flexible employment contract, and engage male champions
of diversity. (3) Society at large also needs to work to dispel various myths
about Womenomics and encourage greater gender equality at home.
This report is a modified version of the Womenomics 4.0: Time to Walk the Talk,
originally published on May 6, 2014.
Kathy Matsui +81(3)6437-9950 [email protected] Goldman Sachs Japan Co., Ltd.
Hiromi Suzuki +81(3)6437-9955 [email protected] Goldman Sachs Japan Co., Ltd.
Kazunori Tatebe +81(3)6437-9898 [email protected] Goldman Sachs Japan Co., Ltd.
Tsumugi Akiba +81(3)6437-9966 [email protected] Goldman Sachs Japan Co., Ltd.
Goldman Sachs does and seeks to do business with companies covered in its research reports. As a result, investorsshould be aware that the firm may have a conflict of interest that could affect the objectivity of this report. Investorsshould consider this report as only a single factor in making their investment decision. For Reg AC certification and otherimportant disclosures, see the Disclosure Appendix, or go to www.gs.com/research/hedge.html. Analysts employed bynon-US affiliates are not registered/qualified as research analysts with FINRA in the U.S.
The Goldman Sachs Group, Inc. Global Investment Research

May 30, 2014 Japan
Goldman Sachs Global Investment Research 2
Table of contents
Summary: How to “walk the talk” 3
The economic case for Womenomics 4
What’s improved? 7
Areas for improvement 11
Three-pronged solution: Recommendations 17
Government policies 18
Private sector initiatives 20
Society: Dispelling myths and promoting gender equality at home 25
Disclosure Appendix 31
The authors would like to extend thanks to our colleague, Kevin Daly, for his assistance with this report.

May 30, 2014 Japan
Goldman Sachs Global Investment Research 3
Summary: How to “walk the talk”
With the government set to announce a revised Growth Strategy in June, we think there
will likely be a renewed focus on Womenomics—which Prime Minister Shinzo Abe has
positioned as a core pillar of Japan’s future growth. When we first broached this topic 15
years ago with our 1999 report, “Womenomics: Buy the Female Economy,” the term
“diversity” was not part of the Japanese vernacular. However, as a result of a shrinking
and greying workforce, acute labor shortages, and a recovering economy, a growing
number of policymakers and citizens are finally becoming convinced that gender diversity
in the workplace is no longer an option; rather, it is an imperative. Japan can no longer
afford not to leverage half its population. This report responds to four commonly asked
questions:
1. What’s the economic rationale behind Womenomics?
2. What progress has been seen since 2010?
3. What areas still need improvement?
4. What specific recommendations should the government, private sector, and
society consider?
Economic case: With Japan’s total population set to shrink by 30% and the elderly ratio
forecast to surge to 40% by 2060, Japan has more to gain than most countries from raising
female labor participation. By closing the gender employment gap (as of 2013), we
estimate the potential boost to Japan’s GDP could be nearly 13%.
Progress since 2010: Japan’s overall female labor participation rate has risen to nearly 63%
(from 60% in 2010), daycare capacity has expanded and some firms have started disclosing
gender-related information.
Areas for improvement: Japan’s female labor participation remains low relative to other
countries, there are still too few females in leadership positions, gender pay gaps and
unequal career opportunities persist, tax distortions discourage married women from
participating more fully in the workplace, and gender disclosures by companies remain
inadequate.
Three-pronged recommendations: We think the government should look to deregulate the
daycare/nursing care sectors, reform immigration laws, neutralize the tax and social
security codes, modify childcare benefits, mandate gender-related disclosures for
companies, equalize part-time and full-time work, boost female representation in the
government, promote female entrepreneurship, and support “on-ramping” of women (ie,
getting back to work after childbirth). The private sector should: stress the business case
for diversity, create more flexible work environments, adopt objective and performance-
based evaluation schemes, set diversity targets, introduce a more flexible employment
contract, and engage male champions of diversity. Finally, society should work to dispel
myths and encourage greater gender equality at home.
Although there is widespread skepticism about PM Abe’s goal of reaching “30% female
representation in various fields of Japanese society by 2020,” which although potentially
overambitious, is better than no target at all. Boosting female employment will be a multi-
year process, but there are many best practices that Japan can adopt from the rest of the
world in order to accelerate the process of change.

May 30, 2014 Japan
Goldman Sachs Global Investment Research 4
The economic case for Womenomics
According to Cabinet Office projections, Japan’s total population is forecast to shrink by
over 30% from 127mn in 2013 to just 87 mn by 2060 as the birthrate remains low (1.4 as of
2012) and the proportion of elderly surges from 25% to nearly 40% (see Exhibit 1).
Indeed, Japan is one of the few OECD countries where the number of registered pets
(dogs and cats only: 21.3 mn) continues to outnumber the total number of children under
the age of 15 (16.5 mn).1
Exhibit 1: Shrinking and aging Japan millions, % of total population %
Source: Cabinet Office, MIC, MHLW, Japan National Institute of Population and Social Security Research.
As of October 2013, Japan’s workforce population (ages 15-64) sank below 80mn for the
first time in 32 years (1981) to 79 mn. Japan’s workforce has been shrinking steadily since
peaking at 87 mn in 1995, but the trend has accelerated since 2012 as baby boomers (born
between 1947-1949 have begun to reach retirement. As a ratio of the total population,
Japan’s workforce is forecast to shrink faster than most other economies (see Exhibit 2).
Exhibit 2: Japan’s workforce is shrinking faster than other countries Working population (ages 15-64) as a % of total population
Source: JILPT (Japan Institute for Labor Policy and Training and OECD.
1 Japan Pet Food Association, 2012.
127 117 87
25.1
31.6
39.9
12.910.3 9.1
0
5
10
15
20
25
30
35
40
45
0
20
40
60
80
100
120
140
2013 2030 2060
Total population % of elderly (65-, rhs) % of children (0-14, rhs)
45
50
55
60
65
70
75
1980 1990 2000 2005 2010 2025 2050
Japan Korea Germany
UK China US
Japan
KoreaGermany
UK
China
US

May 30, 2014 Japan
Goldman Sachs Global Investment Research 5
The shrinking population is increasingly evident in the form of acute labor shortages
across a broad range of industries. While the overall ratio of effective job offers to
applicants stands at a seven-year high of 1.1X, the ratios for labor-intensive sectors such as
security services and construction/mining stand as high as 3-5X, meaning that for every
person seeking a job, there are 3-5 jobs available in those industries (see Exhibit 3).
Our real estate analyst, Sachiko Okada, anticipates that the combination of growing
demand from Tohoku reconstruction, the 2020 Tokyo Summer Olympics and public works
projects alongside the shrinking supply of construction workers (due to retiring baby-
boomers and limited inflow of young workers) mean that construction labor costs—which
have already risen 20% since the March 2011 Tohoku earthquake—will likely rise by
another 20% during FY2015-FY2016.2
Exhibit 3: Many sectors are already suffering acute labor shortages Effective offers to applicant ratios (including part-time)
Note: As of February 2014.
Source: MHLW.
Growth dividends from Womenomics
Since the three key determinants for economic growth are: labor, capital and productivity,
Japan’s severe demographic headwinds mean that unless radical steps are taken quickly,
the nation faces the risk not only of longer-term economic stagnation, but of economic
contraction and lower standards of living as well.
As we have previously demonstrated, the potential dividends from closing the gender
employment gap for Japan are substantial. Based on 2013 female and male employment
rates, we updated our estimate of the potential impact to Japan’s GDP if Japan’s female
labor participation ratio matched that of Japanese males. Since the gap has narrowed since
2012 (from 20pp in 2012 to 18pp in 2013), the potential GDP boost has become slightly
smaller, but nevertheless remains significant and one of the highest in the developed world.
If Japan’s female employment rate as of 2013 (62.5%) rose to that of males (80.6%), this
would add 7.1 mn employees to the workforce. We estimate the absolute level of Japan’s
GDP could be lifted by as much as 12.5% (see Exhibit 4).3
2 See Sachiko Okada’s April 23 report, “Rising labor costs a structural issue; add Aeon Mall (Buy) to CL.”
3 Note that our 2013 estimate of 12.5% is lower than our previous estimate of 14% (from Hugo Scott-Gall’s April 25, 2013 Fortnightly Thoughts report, “Working Women Works”) since the gender employment gap narrowed significantly from 20pp in 2012 to 18pp in 2013.
0.0 0.5 1.0 1.5 2.0 2.5 3.0 3.5 4.0 4.5 5.0
Security
Construction and mining
Service
Professional and technical
Transport and machinery operation
Selling
Agri., Forestry and Fisheries
Production process
Management
Transportation, cleaning, packaging
Clerical staff
Effective opening to application ratio(including part-time)
Total=1.1

May 30, 2014 Japan
Goldman Sachs Global Investment Research 6
To be clear, we are by no means arguing that every Japanese woman should work outside
the home. The decision to work outside the home or not is obviously an individual and
personal choice. Rather, our argument is that Japanese women who desire to work outside
the home (especially on a full-time basis) should not only be given the opportunity but be
encouraged to do so.
Exhibit 4: Closing the 18pp employment gap could boost Japan’s GDP by nearly 13% Potential increase in GDP levels assuming female employment rates match that of males, %
Note: US as of 2012, the others are as of 2013.
Source: Goldman Sachs Global Investment Research.

May 30, 2014 Japan
Goldman Sachs Global Investment Research 7
Abenomics and Womenomics
As part of his keynote speech at the World Economic Forum Annual Meeting in Davos on
January 22, 2014, Prime Minister Shinzo Abe stated:
…Japan's corporate culture, by contrast, is still one of pinstripes and button-
downs. After all, the female labour force in Japan is the most under-utilized
resource. Japan must become a place where women shine. By 2020 we will make
30% of leading positions to be occupied by women. In order to have a large
number of women become leading players in the market we will need a diverse
working environment.
Abe’s speech was dubbed the “Davos Promise,” and Womenomics has become one of the
main pillars of his government’s Growth Strategy. Specifically, PM Abe has articulated
several “Key Performance Indicators” (KPIs) for his “Womenomics” agenda:
1. Target 30% female representation in leadership positions across Japanese society
by 2020
2. Lift the female labor participation rate between the ages of 25-44 from 68% in 2012
to 73% by 2020
3. Raise the percentage of women returning to work after their first child from 38% in
2010 to 55% by 2020
4. Boost the supply of childcare facilities with the aim of eliminating children on
daycare waitlists (22,741 waitlisted children as of April 2013), by 2017
5. Increase the percentage of fathers who take paternity leave from 2.6% in 2011 to
13% by 2020
However, there are plenty of skeptics on whether or not the Japanese government,
corporate world and society will be able to effect a meaningful rise in the participation of
women in the workforce.
What’s improved?
Since our third Womenomics report in 2010, “Womenomics 3.0: The Time is Now,”
improvement has been seen in three areas:
Overall female labor participation
Daycare capacity
Gender-related disclosures by corporations
More women working than ever before
The most encouraging development since 2010 is that Japan’s overall female labor
participation rate has risen from 60% in 2010 to a record-high of 62.5% as of 2013 (see
Exhibit 5).4 Of particular note is that since Japan’s economy began expanding in late 2012,
the female employment ratio has made significant strides, while male labor participation
has remained stagnant at around 80% (see Exhibit 6). This dichotomy can be explained by
the fact that more women are assuming part-time jobs as the economy has been
4 Note this ratio represents the percentage of working females between the ages of 15-64. For the population between the ages of 25-64, the ratio stands at 73%.

May 30, 2014 Japan
Goldman Sachs Global Investment Research 8
recovering, while male participation has stalled mainly due to the growing number of baby
boomers reaching retirement.
Exhibit 5: Record ratio of Japanese working women—participation rate rises to nearly 63% % working-age (15-64) females employed in full-time or part-time work (2013)
Source: Labor force survey (MHLW).
Exhibit 6: Japanese female employment rate has risen, while that of males has stagnated Employment rate (15-64), %
Source: MICA
Consequently, Japan’s ubiquitous “M-curve” (female labor participation by age cohort) has
normalized somewhat in recent years, with the “valley” (between late-20s and 30s) shifting
gradually upward (see Exhibit 7).
62.5
44
46
48
50
52
54
56
58
60
62
64
75 80 85 90 95 00 05 10
50
52
54
56
58
60
62
64
66
68
66
68
70
72
74
76
78
80
82
84
81 83 85 87 89 91 93 95 97 99 01 03 05 07 09 11 13
Male (lhs) Female (rhs)

May 30, 2014 Japan
Goldman Sachs Global Investment Research 9
Exhibit 7: Japan’s “M-curve” has normalized somewhat Female employee rate by age, %
Note: Potential rate = Employed females +unemployed females + females seeking employments/ female population over 15 years of age.
Source: MHLW.
Daycare capacity has expanded
With a heightened focus on the challenge of work-life balance, some progress has also
been made in expanding childcare services. For instance, since 2010, the overall capacity of
daycare facilities rose from 2.16 mn to 2.29 mn as of 2013 (see Exhibit 8). Part of this is
attributable to the initial push by former Prime Minister Junichiro Koizumi to boost daycare
capacity during 2003-2009.
However, with 22,741 children currently on waiting lists nationwide, the Abe government’s
goal is to reduce this to zero by 2017.
Exhibit 8: Daycare capacity has expanded thousands, nationwide
Note: As of April 1, 2014.
Source: MHLW.
0
10
20
30
40
50
60
70
80
90
100
15-19 20-24 25-29 30-34 35-39 40-44 45-49 50-54 55-59 60-64
1980 1990 2000 2013 Potential rate
0
5
10
15
20
25
30
1,950
2,000
2,050
2,100
2,150
2,200
2,250
2,300
2,350
FY3/04 3/05 3/06 3/07 3/08 3/09 3/10 3/11 3/12 3/13 3/14
Waitlisted children (rhs) Nursery capacity (lhs)

May 30, 2014 Japan
Goldman Sachs Global Investment Research 10
Disclosure: One small step
Starting in February 2013, the Cabinet Office has urged listed firms to proactively disclose
gender-related statistics in their Corporate Governance Reports. As of December 2013, 556
firms (17% of a total 3196 listed firms) disclosed such information.5 Of this, roughly 67% of
firms disclosed the gender breakdown of their boards, 42% revealed their policies to
promote work-life balance (WLB), and 20% disclosed the gender breakdown of their
manager ranks (see Exhibit 9). Unsurprisingly, firms with higher percentages of outside
directors and foreign ownership ratios tend to provide greater diversity disclosures.
Exhibit 10 contains a ranking of the ratio of firms in each sector that provided gender-
related disclosures, with financials, utilities, food, and pharmaceuticals ranked highest.
Exhibit 9: Gender disclosures—Measuring female participation %
Note: Universe is 556 listed firms (of a total of 3196) that disclosed their gender-related information after April 19, 2013; data as of end-December 2013.
Source: Cabinet Office.
Exhibit 10: Sector ranking of gender-related disclosures (% of total firms in each sector) % of total firms in each sector
Note: Universe is 556 listed firms (of a total of 3196) that disclosed their gender-related information after April 19, 2013; data as of end-December 2013.
Source: Cabinet Office.
5 The information can be found on the Cabinet Office’s website: htttp://www.gender.go.jp/policy/mieruka/company/mierukasite.html
0 20 40 60
Male-female director ratio
Specific efforts to promote work-life balance
No-gender bias
Male-female manager ratio
Specific efforts to promote women's careers
Promotion of diversity and inclusion
Male-female employee ratio
Goal-setting for female managers
0 10 20 30 40 50
BanksElectric Power & GasFinancials (Ex Banks)
FoodPharmaceuticals
Basic Materials/ChemicalsIT & Communication Services
Transportation/DistributionEnergy
Electric Appl. & PrecisionsRetail
Autos & Transport EquipmentSteel & Nonferrous Metals
TradingMachinery
Real EstateConstruction & Materials
May 30, 2014 Japan
Goldman Sachs Global Investment Research 11
Areas for improvement
While some progress has been made since 2010, there are still many areas which have
seen minimal change or even deteriorated, especially when compared to the rest of the
developed world, where gender diversity has generally seen more visible progress.
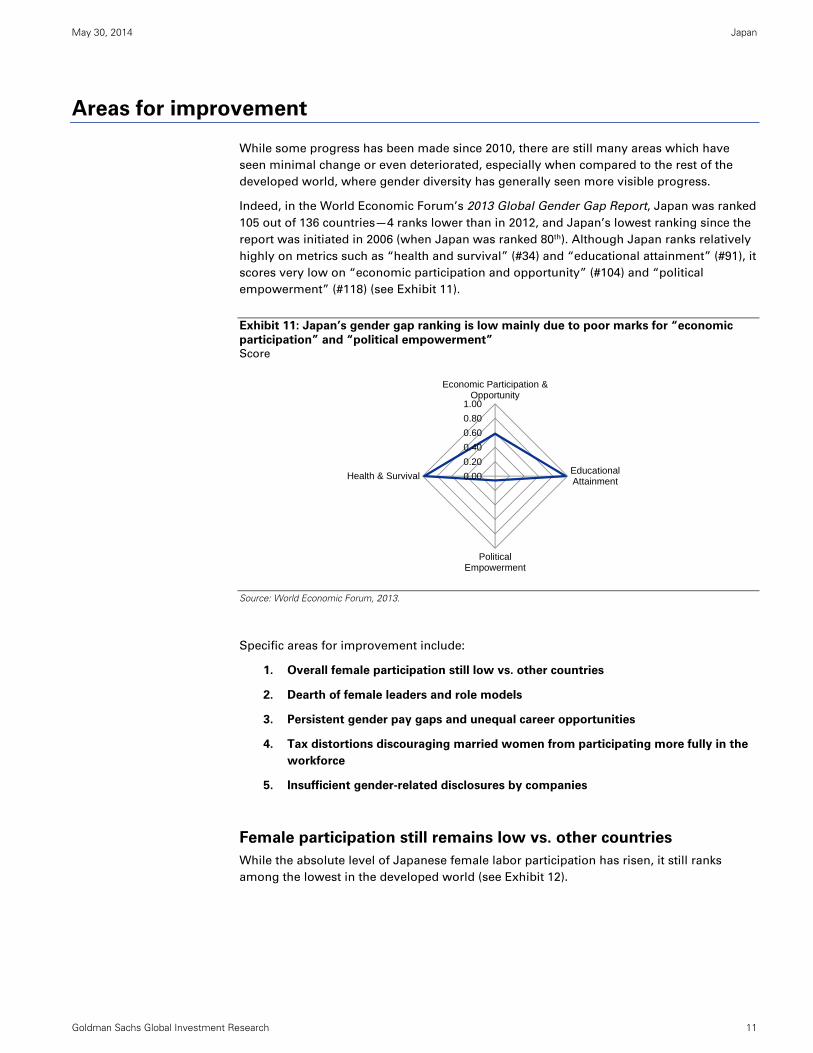
Indeed, in the World Economic Forum’s 2013 Global Gender Gap Report, Japan was ranked
105 out of 136 countries—4 ranks lower than in 2012, and Japan’s lowest ranking since the
report was initiated in 2006 (when Japan was ranked 80th). Although Japan ranks relatively
highly on metrics such as “health and survival” (#34) and “educational attainment” (#91), it
scores very low on “economic participation and opportunity” (#104) and “political
empowerment” (#118) (see Exhibit 11).
Exhibit 11: Japan’s gender gap ranking is low mainly due to poor marks for “economic
participation” and “political empowerment” Score
Source: World Economic Forum, 2013.
Specific areas for improvement include:
1. Overall female participation still low vs. other countries
2. Dearth of female leaders and role models
3. Persistent gender pay gaps and unequal career opportunities
4. Tax distortions discouraging married women from participating more fully in the
workforce
5. Insufficient gender-related disclosures by companies
Female participation still remains low vs. other countries
While the absolute level of Japanese female labor participation has risen, it still ranks
among the lowest in the developed world (see Exhibit 12).
0.00
0.20
0.40
0.60
0.80
1.00
Economic Participation &Opportunity
EducationalAttainment
PoliticalEmpowerment
Health & Survival

May 30, 2014 Japan
Goldman Sachs Global Investment Research 12
Exhibit 12: Japan’s female employment rate still ranks among the lowest in the developed
world Employment/population ratios, 15-64 years old, %
Note: Japan, US, European countries as of 2013 and the others as of 2012.
Source: MHLW, OECD, World Bank.
Though Japan’s “M-curve” has begun to normalize, there still exists a “valley” compared
to other developed countries caused by the fact that as many as 60% of Japanese women
still “off-ramp” from their careers after giving birth to their first child (see Exhibit 13).
Exhibit 13: Japan’s M-curve has eased somewhat, but a ‘valley’ still persists Female participation rate by age, %
Note: Data for Japan is 2013, while that of others is as of 2012.
Source: MHLW, JILPT (Japan Institute for Labor Policy and Training.
Dearth of female leaders
While the overall female labor participation rate has risen since 2010, there is still a dearth
of females in both public and private leadership positions.
For instance, following Japan’s last Lower House elections in December 2012, the ratio of
female Parliamentarians dropped to 8% from 11% (just 77 out of a total of 722 in the Lower
and Upper Houses). This percentage is lower than countries in the Middle East such as Iraq
(25%), Saudi Arabia (20%) and Libya (17%).
0
10
20
30
40
50
60
70
80
90
15-19 20-24 25-29 30-34 35-39 40-44 45-49 50-54 55-59 60-64
Japan US Germany France

May 30, 2014 Japan
Goldman Sachs Global Investment Research 13
Exhibit 14: Dearth of female politicians—Ranking of number of females in Parliament % of women in lower or single house of Parliament or Congress
Note: Data has been compiled by the Inter-Parliamentary Union on the basis of information provided by National Parliaments by 1st December 2013. 188 countries are classified by descending order of the percentage of women in the lower or single House.
Source: Inter-Parliamentary Union.
Circumstances are not much better in the private sector where the percentage of female
managers, defined as kacho (section chief or above), at large Japanese companies stood at
just 10.6% in 2011—nearly the same as the 2005 ratio of 10.1% (see Exhibit 15). Similarly,
female representation on Japanese company boards remains a mere 1% (see Exhibit 16).
Exhibit 15: Japan’s female manager ratio remains low and has barely moved in 6 years Ratio of female managers (2011), % total
Source: MIC, MHLW, ILO.
0
5
10
15
20
25
30
35
40
45
50
42.5
34.3
28.2
10.1
43.0
35.7
29.9
10.6
0 10 20 30 40 50
U.S.
U.K.
Germany
Japan 2005 2011

May 30, 2014 Japan
Goldman Sachs Global Investment Research 14
Exhibit 16: Japanese female board directors still a rare breed % Female board directors
Note: As of March 1, 2013
Source: GMI Ratings’ 2013 Women on Boards Survey.
Persistent gender pay gap and unequal career opportunities
While gender gaps in compensation are universal, the difference remains particularly large
in Japan, with women earning on average just 71% that of Japanese men (see Exhibit 17).
Despite the introduction of the Equal Employment Opportunity Law nearly three decades
ago in 1986 (which was supposed to prohibit discrimination against women in recruitment,
employment, and promotion practices), the reality is that Japanese women still get paid
considerably less than their male counterparts.
Exhibit 17: Gender pay gaps persist Average ratio of female wages relative to male wages (2011), %
Source: MHLW.
Part of this may be attributable to a “female discount” since the majority of Japanese
women “off-ramp” or exit the workforce once they start a family and if they “on-ramp,” or
re-enter the workforce, it is typically on a part-time basis. However, there seem to be other
factors at play. For example, it appears that women’s career paths are often managed
differently from that of men.
1.1
0
5
10
15
20
25
30
35
40

May 30, 2014 Japan
Goldman Sachs Global Investment Research 15
As one senior Japanese female executive explained, “While it’s encouraging to see
companies become more diversity-conscious, they need to be careful about becoming
‘overly female-friendly’ (josei ni yasashi-sugiru).” She argues that in the interest of career
longevity, she has observed many high-potential women placed in career tracks that are
more clerical or administrative in nature (i.e. posts with an “R” in the acronym such as HR,
CSR, PR), rather than front-line production or sales positions. The unintended consequence
is that by the time these women are eligible for important managerial or leadership
promotions, many have not accumulated the necessary skills or experience required for
such positions. This is also reflected in a recent MHLW survey, where the top reason cited
for the lack of female managers was “Too few women with sufficient knowledge,
experience and judgement” (see Exhibit 18).
In other words, in the process of trying to promote diversity, some companies run the risk
of becoming “too soft on women,” when they should actually be “as tough on women as
they are on men” by offering them similar career experiences and training opportunities.
This is particularly critical for women during the early stages of their careers.
Exhibit 18: Why are there so few female managers in Japan? Need to be as tough on
women as on the men %
Source: MHLW
Tax distortions: Need neutral tax treatment of second earners
Another structural obstacle to greater Japanese female employment is a tax system that
has traditionally discouraged women from participating fully in the workforce.
Under the current system, a head of household (usually the husband) is able to claim a
dependent exemption (of ¥380,000 or US$3800) for his wife as long as her annual income
does not exceed ¥1.03 mn (US$10,300). Moreover, as long as the wife’s annual income
remains below ¥1.3 mn, she may claim a national pension without paying any premiums.
Such income thresholds have forced many talented Japanese women to become poorly
paid part-timers or discouraged them from not working outside the home at all.
The current tax system was introduced in 1961 when the typical household structure was
comprised predominantly of single-income earners, but since the number of double-
income households has exceeded single-income households since the mid-1990s, the tax
and social security systems are long overdue for a change, in our view.
0 10 20 30 40 50 60
Too few females with sufficient knowledge, experienceand judgement
Female candidates exist, but length of service isinsufficient
Females don’t wish to be promoted to management
Household responsibilities take priority

May 30, 2014 Japan
Goldman Sachs Global Investment Research 16
Exhibit 19: Double-income households have exceeded single-income households since the
mid-1990s Households with married couples, millions
Source: MHLW
Corporate disclosures: Can’t move the needle if you don’t know
where the needle is
While the Cabinet Office’s launch of its new gender-related website, “Mieru-ka,” in
February 2014 was a step forward, since only 17% of all listed firms reported such
information (since disclosure is optional), the quantity and quality of gender-related
disclosure still has a long way to go.
In our view, it is important to mandate disclosure of gender-related statistics for three
reasons:
1. To showcase firms that are doing well or poorly on diversity metrics,
2. To provide information for potential recruits (women and men) for whom gender
diversity (especially in leadership positions) as well as work-life balance are
priorities, and
3. To supply data for investors focused on diversity-related metrics, especially as part
of ESG (environment, social and governance) investment frameworks.
While recent voluntary disclosures in Corporate Governance reports are better than
nothing, the problem is that since reporting is neither comprehensive nor standardized, it is
difficult for outsiders to compare firms within and across different sectors.
In other words, it’s difficult to “move the needle” on gender diversity if you don’t know
where the needle is. Though some firms argue that gender-related disclosures pose an
additional cost burden, they need to be convinced that gender disclosure is actually an
investment for the future.
8.1
10.7
4
5
6
7
8
9
10
11
12
80 81 82 83 84 85 86 87 88 89 90 91 92 93 94 95 96 97 98 99 00 1 2 3 4 5 6 7 8 9 10 12
Single-income household
Double-income household

May 30, 2014 Japan
Goldman Sachs Global Investment Research 17
Three-pronged solution: Recommendations
There is clearly no silver bullet to improving Japan’s gender diversity; however, there are
many pieces of ‘low-hanging fruit’ which can be attained through the cooperation of
government, private sector and society. Importantly, gender diversity initiatives cannot
succeed if they are positioned as a “women’s problem;” rather, as witnessed in other
countries where gender diversity has made significant progress, success requires a three-
pronged, holistic approach that involves everyone.
The box below contains a summary of our recommendations. While not an exhaustive list,
we believe much can be learned by examining global best practices and since the Abe
government has positioned Womenomics as a core pillar of its Growth Strategy, we think it
is important to start with some small successes.
Recommendations for government, private sector and society
Government policy
Deregulate daycare/nursing care sectors
Immigration reforms for foreign caregivers/workers
Neutralize the tax and social security codes
Modify childcare benefits and make them conditional on workforce participation and paternity leave
Mandate gender-related disclosures and encourage gender diversity target-setting
Look to the “Dutch model” for part-time but equal work
Boost female representation in the government
Promote female entrepreneurship
Support on-ramping of women with re-training and recruitment centers
Private sector
Stress the business case for diversity
Create more flexible work environments
Adopt fair and objective evaluation, compensation and promotion schemes
Set clear diversity targets and hold senior executives accountable for reaching them
Introduce a more flexible employment contract
Engage the majority—male diversity champions
Society
Dispel myths
Encourage greater gender equality at home

May 30, 2014 Japan
Goldman Sachs Global Investment Research 18
Government policies
While changing the mindset of society and the private sector will take time, governments
are in a position to “lead by example,” and are able to influence behavior and outcomes
through policies and incentives. Below is a list of nine initiatives the Japanese government
could consider.
1. Deregulate daycare/nursing care sectors: Expand the capacity and affordability of
daycare and nursing care facilities and services via greater deregulation. Given
fiscal constraints, deregulation is vital to allow more private sector
daycare/nursing care service providers into the market (which is how Yokohama
Mayor Fumiko Hayashi found places for all waitlisted children in Yokohama within
three years).
2. Immigration reforms for foreign caregivers/workers: While the government is
mulling a proposal to expand the number of foreign workers in sectors such as
construction, we think this should also be expanded to caregivers (nursing
care/daycare) given labor shortages in these areas. Since PM Abe stated in his Feb.
2014 “Davos Promise” speech that “...Support from foreign workers will also be
needed for help with the housework, care for the elderly, and the like..”
expectations are now raised that concrete progress will be made in this arena.
3. Neutralize the tax and social security codes: Both systems need to be modified so
they no longer discourage married women from participating fully in the
workforce. The elimination of institutional exemptions on spousal income in the
tax and social security codes should help encourage more married women to seek
higher-paying, full-time jobs. Many other developed countries have already
replaced “family income” taxation with “individual income” taxation. Reducing
the tax burden for secondary (typically female) earners can help boost female
employment. The LDP has begun discussing a proposal that would help neutralize
the codes, which would represent a step in the right direction, in our view.
4. Modify childcare benefits and make them conditional to workforce participation
and paternity leave: Despite the ability for Japanese fathers to take up to 1 year of
paternity leave, less than 3% of eligible men take such leave. Germany faced a
similar problem until Chancellor Angela Merkel introduced a new system of
benefits for double-income families in 2005. Prior to this, only 2-3% of German
fathers took paternity leave, yet after this new system took effect, the average
paternity leave ratio rose to nearly 30%. Similarly, in Sweden, parents are entitled
to 480 days (about 16 months) of paid leave per child (390 days of which is paid at
80% of salary), and at least 2 of the 16 months must be taken by the other parent
(typically the father) — otherwise the benefits are forfeited. On average, Swedish
fathers typically take 3-4 months of paternity leave, which not only makes it easier
for the mother to transition back to work, but also builds empathy within the home
for childcare and household chores.
The Japanese government currently provides childcare subsidies (monthly
payments of ¥10,000-¥15,000 per child up to middle-school age), but these are not
linked to female labor participation. Similar to the impact of neutralizing the tax
and social security codes, we believe that making childcare benefits conditional on
workforce participation could also help encourage more women to work outside
the home.
5. Mandate gender-related disclosures and encourage diversity target-setting: While
the Cabinet Office’s recent “Mieru-ka” initiative was a step forward, we believe
gender-related disclosures should be both mandatory and standardized within
corporate financial statements. Prior to 1999, listed firms were actually obliged to

May 30, 2014 Japan
Goldman Sachs Global Investment Research 19
disclose gender-related information, but this requirement was eliminated with the
arrival of “Accounting Big Bang.” In other words, obliging firms to provide such
data would merely bring back the original status quo. The government should also
urge companies to set specific gender diversity policies and measurable targets,
and report against them.
6. Look to the “Dutch model” for part-time but equal work: Another reason behind
the low rate of full-time female labor participation as well as gender pay gaps is
the unequal treatment of part-time vs. full-time employees. Part-timers now
account for roughly 40% of total employees, of which around 70% are women. The
difference in average annual income earned between these two categories is
substantial: regular workers earn an average of ¥4.7 mn, while non-regular
workers earn just ¥1.7 mn.6 Since part-timers are not eligible for the same wages
and benefits as full-timers, work styles are extremely rigid and there is limited
mobility between part-time and full-time jobs.
The Netherlands faced a similar challenge during the 1970s-1980s, but after
negotiations among the government, employers and unions, barriers between full-
time and part-time workers fell. As a result, the median hourly wage of part-time
workers is now equivalent to that of full-time employees, and part-timers enjoy the
same social security coverage and employment protection as full-timers.
Consequently, Dutch female labor participation rose from 35% in 1980 to more
than 80% in 2008.7
Japan has begun taking some steps to increase protection of part-time workers by
extending the eligibility of part-timers for social security benefits from October
2016, but more can be done to narrow the gap.8 Since women dominate the non-
regular or part-time worker population, equalizing part-time vs. full-time work
conditions would help boost female labor participation as well as overall labor
market mobility.
7. Boost female representation within the government: PM Abe has stated that
starting in FY2015, at least one-third of civil servant recruits will be female, but we
believe even more can be done to promote female representation in the public
sector. In Korea, for instance, the government established a quota system in 2000
that required 30% of candidates running for proportional representation seats to
be female, and this target was subsequently raised to 50% in 2004. As a result, the
ratio of female candidates more than doubled from 5.9% in 2000 to 14.7% by 2008.
In addition, for single-seat constituencies, the government urged political parties
to field at least 30% female candidates and to encourage this, the government
established a special subsidy for political parties that followed this practice. Japan
could consider similar incentives to encourage more females to enter politics.
8. Promote female entrepreneurship: Offer preferential treatment for women-owned
businesses for government procurement and low-interest loans to encourage
entrepreneurship and job creation. SMEs account for over 99% of all enterprises in
Japan and around 70% of all jobs, yet the level of female entrepreneurship is
extremely low, with just 2% of Japanese women engaged in entrepreneurial
6 Japan National Tax Agency, 2012.
7 IMF Working Paper, “Can Women Save Japan?” by Chad Steinberg and Masato Nakane, October 2012.
8 Under current rules, a part-time employee must work at least 75% of the number of hours per day or number of days per month that a full-time employee works to be eligible for social security benefits, but from Oct. 2016, as long as an employer has more than 500 employees, a part-time employee who works over 20 hours/week, earns more than ¥1.06mn annually, and works continuously for at least 1 year will become eligible for social security.

May 30, 2014 Japan
Goldman Sachs Global Investment Research 20
activity (vs. 10% in the US and 5% in Europe).9 Since it will take time for
institutionalized corporate structures to change, promoting women-owned
businesses can offer a more flexible and, therefore, more desirable work option for
many females.
9. Support on-ramping of women with re-training and recruitment centers: Since
one of the biggest challenges to higher female labor participation is the on-
ramping of women once they’ve off-ramped, the government can do more to
support women wishing to re-enter the workforce with training and recruitment
programs. For example, the Korean government established a system of 120 “New
Occupation or ‘Restart’ Centers” nationwide for the sole purpose of supporting
women whose careers have been interrupted by childbirth, childcare, etc.10 These
centers provide job counseling, vocational training, job placement and follow-up
care after employment. In 2013, 1.08 mn women found employment through these
Restart centers out of a total of 2.1 mn women.
Private sector initiatives
Amid an increasingly globalized and competitive world, we think Japan’s private sector can
offer greater leadership in promoting gender diversity in the following six areas.
1. Stress the business case for diversity: To make genuine progress, top
management needs to convince employees about the business case for gender
diversity. Numerous global studies have demonstrated the positive correlation
between gender diversity and corporate performance.
For instance, a 2011 Catalyst study found that Fortune 500 companies with
sustained high board representation of women (3 or more women board directors
in at least 4 of 5 years) significantly outperformed those with sustained low
representation by 46% on ROE and 60% on ROIC (see Exhibit 20).11 Reasons
behind the positive correlation include: improved financial performance,
leveraging talent, reflecting the marketplace and building reputation, and
increasing innovation and group performance.
Importantly, women board directors appear to have a significant effect on
increasing the percentage of line positions held by women, which is critical for
women to advance into CEO and top leadership positions.
9 Global Entrepreneurship Monitor, 2012. See also Anna Stupnytska, Kathryn Koch, et al, Giving credit where it is due: How closing the credit gap for women-owned SMEs can drive global growth, Goldman Sachs Global Market Institute, February 2014.
10 For more information, see: http://english.mogef.go.kr/sub02/sub02_22_01.jsp/
11 Nancy M. Carter and Harvey M. Wagner, “The Bottom Line: Corporate Performance and Women’s Representation on Boards (2004-2008), Catalyst, 2011.
May 30, 2014 Japan
Goldman Sachs Global Investment Research 21
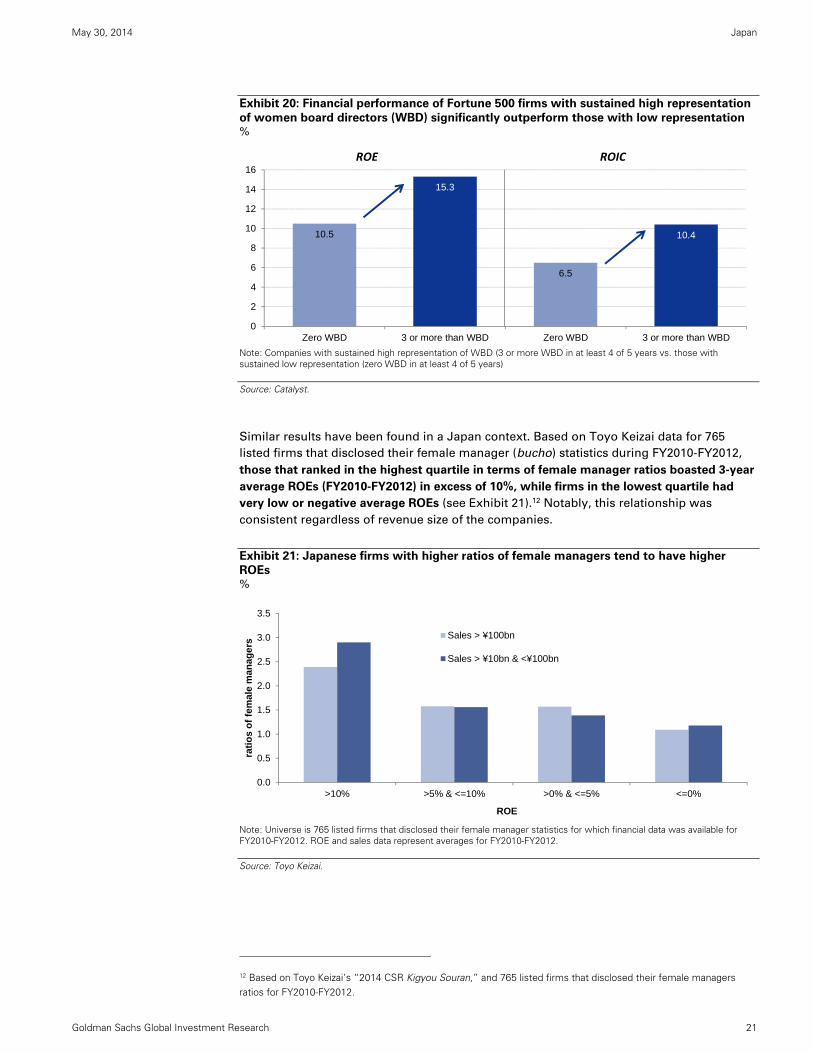
Exhibit 20: Financial performance of Fortune 500 firms with sustained high representation
of women board directors (WBD) significantly outperform those with low representation %
Note: Companies with sustained high representation of WBD (3 or more WBD in at least 4 of 5 years vs. those with sustained low representation (zero WBD in at least 4 of 5 years)
Source: Catalyst.
Similar results have been found in a Japan context. Based on Toyo Keizai data for 765
listed firms that disclosed their female manager (bucho) statistics during FY2010-FY2012,
those that ranked in the highest quartile in terms of female manager ratios boasted 3-year
average ROEs (FY2010-FY2012) in excess of 10%, while firms in the lowest quartile had
very low or negative average ROEs (see Exhibit 21).12 Notably, this relationship was
consistent regardless of revenue size of the companies.
Exhibit 21: Japanese firms with higher ratios of female managers tend to have higher
ROEs %
Note: Universe is 765 listed firms that disclosed their female manager statistics for which financial data was available for FY2010-FY2012. ROE and sales data represent averages for FY2010-FY2012.
Source: Toyo Keizai.
12 Based on Toyo Keizai’s “2014 CSR Kigyou Souran,” and 765 listed firms that disclosed their female managers ratios for FY2010-FY2012.
10.5
15.3
6.5
10.4
0
2
4
6
8
10
12
14
16
Zero WBD 3 or more than WBD Zero WBD 3 or more than WBD
ROE ROIC
0.0
0.5
1.0
1.5
2.0
2.5
3.0
3.5
>10% >5% & <=10% >0% & <=5% <=0%
rati
os
of
fem
ale
man
ager
s
ROE
Sales > ¥100bn
Sales > ¥10bn & <¥100bn

May 30, 2014 Japan
Goldman Sachs Global Investment Research 22
2. Create more flexible work environments: Reasons cited by Japanese women who
off-ramp after giving birth are not limited to childcare availability and wage
differentials. For many, the inflexibility of working hours and lack of support for
working mothers in the workplace are cited more often (see Exhibit 22). Therefore,
employers should promote more flexible work arrangements (including job-
sharing and tele-commuting), and crucially, employees in flexible work
arrangements should not be discriminated against in terms of career opportunities
and compensation.
One interesting model that may be worth exploring is the UK’s “Right to Request
Flexible Working” legislation which empowers working parents to ask for flexible
scheduling (meaning hours of work and place of work), and ensures that
employers consider these requests. The program has been highly successful since
its introduction in 2003. Initially the legislation was targeted at working parents,
but from June 2014, the legislation will be expanded to cover all employees after
26 weeks of service. Sweden and the Netherlands have similar laws that grant
employees the right to request more flexible work hours.
While a growing number of Japanese firms offer flexible work arrangements, few
employees take advantage of them for fear that doing so will negatively impact
their internal evaluations. Therefore it is crucial that employers (particularly senior
management) create an environment where flexible work styles are not only
acceptable, but actively encouraged.
Exhibit 22: Reasons cited by Japanese mothers who off-ramped after giving birth despite a
desire to continue working % responses (2010)
Source: MHLW.
3. Adopt fair and objective evaluation, compensation and promotion schemes:
Evaluation systems that emphasize performance and output rather than seniority
and hours worked should help deter excessive overtime for both men and women.
Since evaluations at many traditional Japanese companies tend to emphasize
65.4
49.5
45.7
25.0
22.9
20.7
19.1
18.1
18.1
6.4
0 20 40 60 80
Working hours making (or likely to make) child care infeasible
Workplace lacking the willingness to support mothers
Excessive physical exhaustion expected (or caused)
Little or no availability of child care leave
Frequent days off unavoidable to care for children when theyare sick
Little or no likelihood of the child's being admitted to a day-carecenter
No child care leave provided by the employer
Sickness (morning sickness, sickness after childbirth, etc.) dueto pregnancy or childbirth
Other family member requests her to leave her job
Other

May 30, 2014 Japan
Goldman Sachs Global Investment Research 23
seniority over performance, it is no surprise that Japan ranks near the top for
longest number of hours worked annually in the OECD (see Exhibit 23).
While such ingrained systems may take a long time to change, we believe the
forces of globalization and the battle for talent are already forcing many Japanese
firms to re-think their evaluation processes, which we think is a good sign.
Exhibit 23: Japan ranks near the top in the OECD for number of hours worked annually Average annual hours worked per person in employment (2011)
Source: JIL, OECD.
4. Set clear diversity targets and hold senior management accountable for reaching
them: Companies should not only be required to disclose their gender diversity
statistics in a standardized format, but managements should also establish and
disclose their diversity goals and targets for recruitment, retention and promotion.
To ensure progress, senior executives should be held accountable for monitoring
progress and reaching these goals.
5. Introduce a more flexible employment contract: One reason behind the limited
number of female managers in Japan is the dual-track employment model of
“career” (sogo-shoku) and “non-career” (ippan-shoku) roles. Career positions
typically offer higher salaries and include significant investment in training and
development over a lifetime of employment. Meanwhile, non-career positions
typically offer lower salaries and limited investment in training. Since the majority
of Japanese women opt for non-career track roles upon entering the workforce
(especially at large firms), this dual-track system leads to significant gaps in
promotion opportunities and wages longer-term.13
One potential solution is to introduce more flexible employment contracts to
reduce hiring risks for employers. The American Chamber of Commerce in Japan
recently proposed the introduction of a new more flexible “regular employee”
contract that would allow companies and employees to conclude labor contracts
of indeterminate duration, as long as the employee is compensated in case of
dismissal with a pre-contracted amount of severance pay based on his/her total
years of service. 14 Such contracts could increase incentives for hiring regular
workers, boost labor mobility, and allow a greater number of young and female
workers to enter mainstream career paths.
13 IMF Working Paper, “Can Women Save Japan?” by Chad Steinberg and Masato Nakane, October 2012.
14 See The American Chamber of Commerce in Japan Viewpoint, “Add Flexibility to the Labor Contract Law to Address Burgeoning Social Inequality While Spurring Economic Growth.” (http://accj.or.jp/en/advocacy/viewpoints)

May 30, 2014 Japan
Goldman Sachs Global Investment Research 24
6. Engage the majority—male diversity champions: There are several organizations
currently active in Japan working to improve gender diversity, including:
J-Win: “Japan Women’s Innovative Network” is an NPO launched in 2007
that promotes gender diversity management, training and networking
activities for women employed in the private sector (http://www.j-win.jp/)
Women Corporate Directors (WCD) Japan: The Japan chapter of WCD
aims to promote more women on Japanese corporate boards
(http://www.womencorporatedirectors.com/?page=_AboutWCD)
In addition to women pushing the diversity agenda, however, it is also important
to engage the majority, i.e. male leaders, to promote a diversity agenda. Two
examples of global best practices are: the UK and Hong Kong’s “30% Clubs” and
Australia’s “Male Champions of Change.”
30% Clubs (UK/Hong Kong): The purpose of these clubs (established in the UK and
HK) is to (a) raise awareness among business leaders of the benefits of gender
diversity, (b) inspire debate and discussion, and (c) support initiatives to build the
pipeline of women in executive and non-executive roles. The 30% Club was
originally launched in the UK in 2010 by Helena Morrissey, CEO of Newton
Investment Management, and has attracted over 60 chairmen of leading
institutions (e.g. Lloyds Banking Group, HSBC, Aviva, Anglo American,
Burberry). Since 2010, the number of women on FTSE-100 boards increased
from 12.5% in 2010 to 17.3% in 2012. Moreover, 43% of FTSE 100 non-
executive director (NED) appointments in the year to March 1, 2013 went to
women, vs. just 13% of NED appointments in 2010.15
Importantly, the 30% Club is not a call for a quota; rather, the 30% Club “supports
sustainable business-led voluntary change to improve the current gender
imbalance of corporate boards.” It encourages companies to set their own
aspirational targets for gender diversity on their boards and to consider diversity
as it applies to their particular context and circumstances. Members publicly
support having more women on boards, support initiatives to build the pipeline of
women for executive and non-executive roles, and actively assist in recruiting and
spreading the word to other chairmen and key influencers.
Male Champions of Change (Australia): In 2011, Australia’s Sex Discrimination
Commissioner, Elizabeth Broderick, launched “Male Champions for Change”
(MCC), a leadership group in Australia that has brought the Women Empowering
Principles (WEPs) to life through collaboration and innovative strategies.16
Broderick contends that “Minimizing gender differences requires behavioral
changes among both women and men. Without the avid support of men—men
who currently dominate the leadership of large businesses and control most of the
financial and other resources—substantial progress is unlikely. Creating change
therefore requires men to take the message of gender equality to other men.”
Since Japan has a number of prominent male business and political leaders who
understand the importance of gender diversity, we believe it would be highly
effective to create the Japanese equivalents of “Male Champions of Change” or a
“30% Club” leveraging these leaders to help educate and spread best practices on
diversity across Japanese society.
15 For more on the 30% Clubs in the UK and Hong Kong, see http://www.30percentclub.org/ and http://www.thewomensfoundationhk.org/our-work.php?id=308
16 For more information, see the Male Champions of Change website: https://www.humanrights.gov.au/male-champions-change

May 30, 2014 Japan
Goldman Sachs Global Investment Research 25
Society: Dispelling myths and promoting gender equality at home
Perhaps one of the greatest barriers to higher Japanese female employment is Japanese
society itself. In a 2012 Cabinet Office survey, 52% of the Japanese respondents stated that
women should stay at home and men should work, marking a 10% increase from the
previous survey conducted in 2009. In order to help change the mindset, much work needs
to be done to dispel myths and encourage greater gender equality at home.
Dispel the myths about Womenomics
Over the past 15 years, we have confronted a number of counter-arguments to our thesis
that greater female labor participation would be positive for Japan’s long-term economic
growth, including:
1. Japanese women tend to quit working after starting a family primarily due to
“pull” factors
2. Japanese women have limited desire to return to work after having children
3. More working women will mean fewer jobs for men
4. Raising female labor participation will drive Japan’s low birth rate even lower
Myth #1: Japanese women quit working only because of “pull” factors
In 2011, the Center for Work-Life Policy released a survey (based on 1582 respondents)
focused on the reasons Japanese women off-ramped more than women in other
countries.17 Notably, childcare and eldercare (i.e. “pull” factors) were not the primary
reasons for the exodus of Japanese women from the workforce.
For instance, only 32% of Japanese women off-ramped for childcare reasons, vs. 74% in
the US (see Exhibit 24). In contrast, as many as 63% of Japanese working women quit
because of “push” factors, i.e. dissatisfaction with their jobs and 49% because they felt
stalled in their careers. This compares with comparable ratios of 26% and 16%, respectively,
for American women.
The implication is that while policies to address “pull” factors such as expanding childcare
and elder care services are necessary, they are not sufficient. Changes within organizations
are also necessary to address the “push” factors.
Exhibit 24: Reasons cited for leaving the workforce—Japanese women cite “push” factors
more than “pull” reasons
%
Source: Center for Work Life Policy.
17 See Sylvia Ann Hewlett and Laura Sherbin’s “Off-Ramps and On-Ramps Japan: Keeping Talented Women on the Road to Success,” Center for Work-Life Policy, 2011.
3238
63
49
74
3026
16
0
10
20
30
40
50
60
70
80
Child Care Eldercare Career not satisfying Felt stalled in career
Japanese
American
Pull Factors Push Factors

May 30, 2014 Japan
Goldman Sachs Global Investment Research 26
Myth #2: Japanese women have limited desire to return to work after giving birth
Another pushback to our Womenomics thesis is that Japanese women are simply not that
ambitious and few desire to return to full-time jobs after having children. However, the
Center for Work-Life Policy survey also debunked this myth, showing that just as many
Japanese women wanted to re-enter the workforce (77%) as women in the US (89%) and
Germany (78%). The problem lies in the lack of opportunities, since only 43% of Japanese
women surveyed succeeded in getting a job vs. 73% in the US and 68% in Germany (see
Exhibit 25).
Exhibit 25: Japanese women’s desire to return to work is similar to that of
American/German women %
Source: Center for Work-Life Policy.
Myth #3: More working women means fewer jobs for men
Many observers have argued that higher Japanese female labor participation will result in
fewer jobs for Japanese men. However, this assumes that the economy and job market
remain static in a world with higher female employment, which is short-term thinking.
After all, more working women means more household income, more income translates
into higher consumption, higher consumption leads to expanded corporate profits,
expanded profits means more investment and wage growth, and so on.
In other words, Womenomics can drive a virtuous cycle that produces an expanded
economic pie rather than a static one, leading to more jobs and economic benefits for
everyone, not just women.
Myth #4: Higher female participation is negatively correlated with fertility rates
The final myth is that if more women work, Japan’s already-low birth rate will decline even
further, exacerbating the demographic headwinds. However, as we have previously
demonstrated, the empirical evidence contradicts this.
For instance, if female labor participation rates are plotted against birth rates for various
countries, there is a distinctly positive—not negative—correlation between the two,
meaning that countries with higher labor participation rates such as Sweden, Denmark,
the Netherlands, and the UK, tend to have higher fertility rates and vice versa (Exhibit 26).
Moreover, a similar relationship holds true domestically for the 47 prefectures in Japan
(see Exhibit 27).
77
89
78
43
7368
0
10
20
30
40
50
60
70
80
90
100
Japanese American Germany
Desire to return to work Found work

May 30, 2014 Japan
Goldman Sachs Global Investment Research 27
Exhibit 26: Female labor participation and fertility rates are positively, not negatively,
correlated globally %
Note: Female employment rates: as of 2013 for Japan, as of 2012 for the others.
Source: MHLW.
Exhibit 27: Same is true inside Japan—Female labor participation and fertility rates for
Japan’s 47 Prefectures %
Source: MHLW
Korea
JapanItaly
Germany
Canada
Netherlands
DenmarkUK
SwedenAustralia
France
US
1.0
1.2
1.4
1.6
1.8
2.0
2.2
45 50 55 60 65 70 75
Tot
al fe
rtili
ty r
ate
s(20
10)
Female Employment Rates
Total
Hokkaido
Aomori
Iwate
Miyagi
Akita
YamagataFukushimaIbaraki
Tochigi
Gunma
Saitama
Chiba
Tokyo
Kanagawa
Niigata
Toyama
Ishikawa
Fukui
Yamanashi
Nagano
Gifu
Shizuoka
AichiMie
Shiga
Kyoto
Osaka
Hyogo
Nara
WakayamaTottori
Shimane
Okayama
HiroshimaYamaguchi
Tokushima
Kagawa
Ehime
KochiFukuoka
SagaNagasaki Kumamoto
Oita
MiyazakiKagoshima
1.0
1.1
1.2
1.3
1.4
1.5
1.6
1.7
1.8
40 42 44 46 48 50 52 54
To
tal f
ert
ility
ra
tes
(20
12
)
Female labor participation rate (2005)
May 30, 2014 Japan
Goldman Sachs Global Investment Research 28
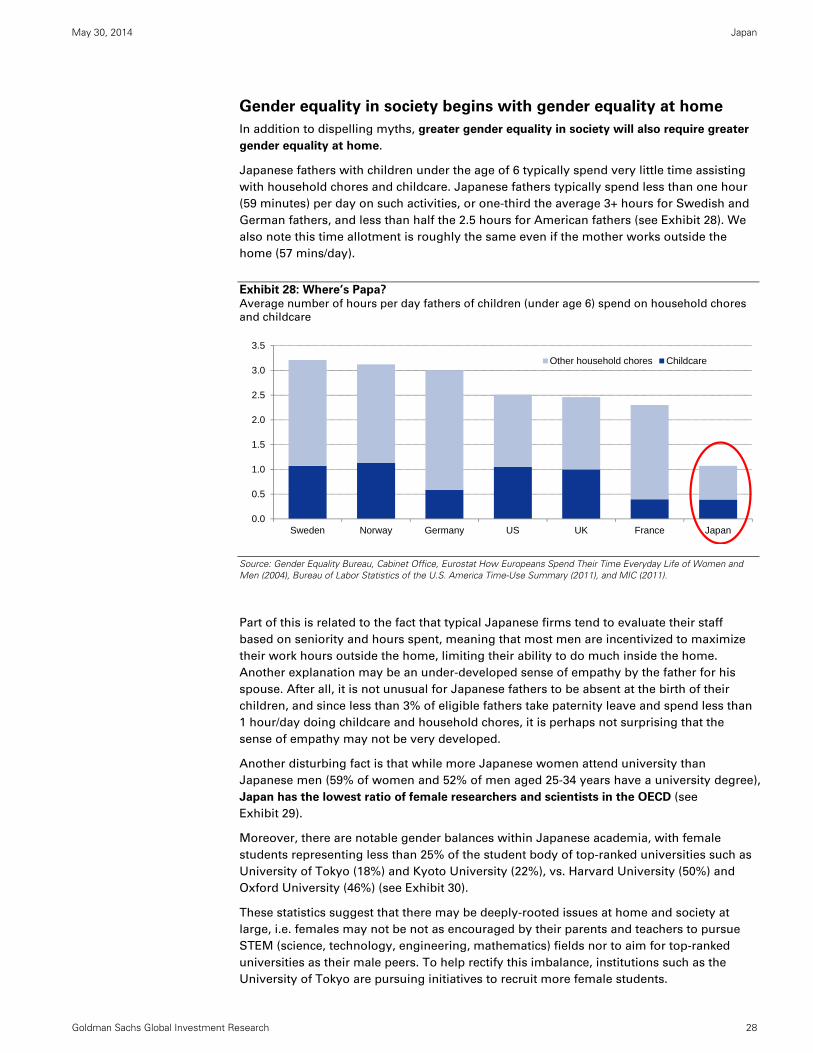
Gender equality in society begins with gender equality at home
In addition to dispelling myths, greater gender equality in society will also require greater
gender equality at home.
Japanese fathers with children under the age of 6 typically spend very little time assisting
with household chores and childcare. Japanese fathers typically spend less than one hour
(59 minutes) per day on such activities, or one-third the average 3+ hours for Swedish and
German fathers, and less than half the 2.5 hours for American fathers (see Exhibit 28). We
also note this time allotment is roughly the same even if the mother works outside the
home (57 mins/day).
Exhibit 28: Where’s Papa? Average number of hours per day fathers of children (under age 6) spend on household chores
and childcare
Source: Gender Equality Bureau, Cabinet Office, Eurostat How Europeans Spend Their Time Everyday Life of Women and Men (2004), Bureau of Labor Statistics of the U.S. America Time-Use Summary (2011), and MIC (2011).
Part of this is related to the fact that typical Japanese firms tend to evaluate their staff
based on seniority and hours spent, meaning that most men are incentivized to maximize
their work hours outside the home, limiting their ability to do much inside the home.
Another explanation may be an under-developed sense of empathy by the father for his
spouse. After all, it is not unusual for Japanese fathers to be absent at the birth of their
children, and since less than 3% of eligible fathers take paternity leave and spend less than
1 hour/day doing childcare and household chores, it is perhaps not surprising that the
sense of empathy may not be very developed.
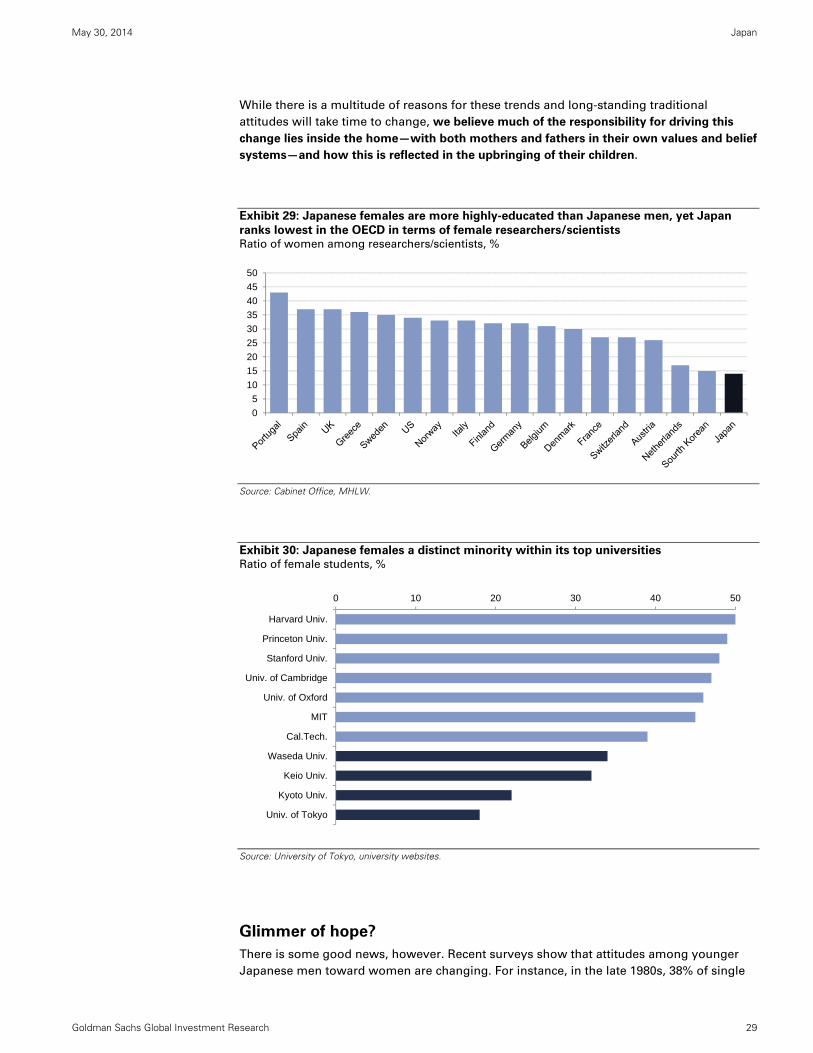
Another disturbing fact is that while more Japanese women attend university than
Japanese men (59% of women and 52% of men aged 25-34 years have a university degree),
Japan has the lowest ratio of female researchers and scientists in the OECD (see
Exhibit 29).
Moreover, there are notable gender balances within Japanese academia, with female
students representing less than 25% of the student body of top-ranked universities such as
University of Tokyo (18%) and Kyoto University (22%), vs. Harvard University (50%) and
Oxford University (46%) (see Exhibit 30).
These statistics suggest that there may be deeply-rooted issues at home and society at
large, i.e. females may not be not as encouraged by their parents and teachers to pursue
STEM (science, technology, engineering, mathematics) fields nor to aim for top-ranked
universities as their male peers. To help rectify this imbalance, institutions such as the
University of Tokyo are pursuing initiatives to recruit more female students.
0.0
0.5
1.0
1.5
2.0
2.5
3.0
3.5
Sweden Norway Germany US UK France Japan
Other household chores Childcare
May 30, 2014 Japan
Goldman Sachs Global Investment Research 29
While there is a multitude of reasons for these trends and long-standing traditional
attitudes will take time to change, we believe much of the responsibility for driving this
change lies inside the home—with both mothers and fathers in their own values and belief
systems—and how this is reflected in the upbringing of their children.
Exhibit 29: Japanese females are more highly-educated than Japanese men, yet Japan
ranks lowest in the OECD in terms of female researchers/scientists Ratio of women among researchers/scientists, %
Source: Cabinet Office, MHLW.
Exhibit 30: Japanese females a distinct minority within its top universities Ratio of female students, %
Source: University of Tokyo, university websites.
Glimmer of hope?
There is some good news, however. Recent surveys show that attitudes among younger
Japanese men toward women are changing. For instance, in the late 1980s, 38% of single
0
5
10
15
20
25
30
35
40
45
50
0 10 20 30 40 50
Harvard Univ.
Princeton Univ.
Stanford Univ.
Univ. of Cambridge
Univ. of Oxford
MIT
Cal.Tech.
Waseda Univ.
Keio Univ.
Kyoto Univ.
Univ. of Tokyo

May 30, 2014 Japan
Goldman Sachs Global Investment Research 30
men aged 18-34 years old believed that his future spouse should be a housewife, and only
11% should be a working mother.
By 2010, however, the same survey showed a reversal, with 33% preferring their spouse to
be a working mother, while only 11% wanting the woman to stay at home (see Exhibit 31).
This suggests that attitudes of the younger generations are already shifting in a positive
direction.
Exhibit 31: Survey of young Japanese men today vs. in the past The life course young men would wish for their spouses (18-34 years-old, unmarried men), %
Source: Japan National Institute of Population and Social Security Research.
38
11 11
33
0
5
10
15
20
25
30
35
40
Housewife Working women
1987 1992 1997 2002 2005 2010

May 30, 2014 Japan
Goldman Sachs Global Investment Research 31
Disclosure Appendix
Reg AC
We, Kathy Matsui, Hiromi Suzuki, Kazunori Tatebe and Tsumugi Akiba, hereby certify that all of the views expressed in this report accurately reflect
our personal views about the subject company or companies and its or their securities. We also certify that no part of our compensation was, is or
will be, directly or indirectly, related to the specific recommendations or views expressed in this report.
Disclosures
Company-specific regulatory disclosures
Compendium report: please see disclosures at http://www.gs.com/research/hedge.html. Disclosures applicable to the companies included in this
compendium can be found in the latest relevant published research
Distribution of ratings/investment banking relationships
Goldman Sachs Investment Research global coverage universe
Rating Distribution Investment Banking Relationships
Buy Hold Sell Buy Hold Sell
Global 32% 53% 15% 53% 47% 40%
As of April 1, 2014, Goldman Sachs Global Investment Research had investment ratings on 3,662 equity securities. Goldman Sachs assigns stocks as
Buys and Sells on various regional Investment Lists; stocks not so assigned are deemed Neutral. Such assignments equate to Buy, Hold and Sell for
the purposes of the above disclosure required by NASD/NYSE rules. See 'Ratings, Coverage groups and views and related definitions' below.
Price target and rating history chart(s)
Compendium report: please see disclosures at http://www.gs.com/research/hedge.html. Disclosures applicable to the companies included in this
compendium can be found in the latest relevant published research
Disclosures required by United States laws and regulations
See company-specific regulatory disclosures above for any of the following disclosures required as to companies referred to in this report: manager
or co-manager in a pending transaction; 1% or other ownership; compensation for certain services; types of client relationships; managed/co-
managed public offerings in prior periods; directorships; for equity securities, market making and/or specialist role. Goldman Sachs usually makes a
market in fixed income securities of issuers discussed in this report and usually deals as a principal in these securities.
The following are additional required disclosures: Ownership and material conflicts of interest: Goldman Sachs policy prohibits its analysts,
professionals reporting to analysts and members of their households from owning securities of any company in the analyst's area of
coverage. Analyst compensation: Analysts are paid in part based on the profitability of Goldman Sachs, which includes investment banking
revenues. Analyst as officer or director: Goldman Sachs policy prohibits its analysts, persons reporting to analysts or members of their
households from serving as an officer, director, advisory board member or employee of any company in the analyst's area of coverage. Non-U.S. Analysts: Non-U.S. analysts may not be associated persons of Goldman, Sachs & Co. and therefore may not be subject to NASD Rule 2711/NYSE
Rules 472 restrictions on communications with subject company, public appearances and trading securities held by the analysts.
Additional disclosures required under the laws and regulations of jurisdictions other than the United States
The following disclosures are those required by the jurisdiction indicated, except to the extent already made above pursuant to United States laws
and regulations. Australia: Goldman Sachs Australia Pty Ltd and its affiliates are not authorised deposit-taking institutions (as that term is defined in
the Banking Act 1959 (Cth)) in Australia and do not provide banking services, nor carry on a banking business, in Australia. This research, and any
access to it, is intended only for "wholesale clients" within the meaning of the Australian Corporations Act, unless otherwise agreed by Goldman
Sachs. In producing research reports, members of the Global Investment Research Division of Goldman Sachs Australia may attend site visits and
other meetings hosted by the issuers the subject of its research reports. In some instances the costs of such site visits or meetings may be met in part
or in whole by the issuers concerned if Goldman Sachs Australia considers it is appropriate and reasonable in the specific circumstances relating to
the site visit or meeting. Brazil: Disclosure information in relation to CVM Instruction 483 is available at
http://www.gs.com/worldwide/brazil/area/gir/index.html. Where applicable, the Brazil-registered analyst primarily responsible for the content of this
research report, as defined in Article 16 of CVM Instruction 483, is the first author named at the beginning of this report, unless indicated otherwise at
the end of the text. Canada: Goldman Sachs Canada Inc. is an affiliate of The Goldman Sachs Group Inc. and therefore is included in the company
specific disclosures relating to Goldman Sachs (as defined above). Goldman Sachs Canada Inc. has approved of, and agreed to take responsibility for,
this research report in Canada if and to the extent that Goldman Sachs Canada Inc. disseminates this research report to its clients. Hong Kong: Further information on the securities of covered companies referred to in this research may be obtained on request from Goldman Sachs
(Asia) L.L.C. India: Further information on the subject company or companies referred to in this research may be obtained from Goldman Sachs
(India) Securities Private Limited. Japan: See below. Korea: Further information on the subject company or companies referred to in this research
may be obtained from Goldman Sachs (Asia) L.L.C., Seoul Branch. New Zealand: Goldman Sachs New Zealand Limited and its affiliates are neither
"registered banks" nor "deposit takers" (as defined in the Reserve Bank of New Zealand Act 1989) in New Zealand. This research, and any access to it,
is intended for "wholesale clients" (as defined in the Financial Advisers Act 2008) unless otherwise agreed by Goldman Sachs. Russia: Research
reports distributed in the Russian Federation are not advertising as defined in the Russian legislation, but are information and analysis not having
product promotion as their main purpose and do not provide appraisal within the meaning of the Russian legislation on appraisal
activity. Singapore: Further information on the covered companies referred to in this research may be obtained from Goldman Sachs (Singapore)
Pte. (Company Number: 198602165W). Taiwan: This material is for reference only and must not be reprinted without permission. Investors should
carefully consider their own investment risk. Investment results are the responsibility of the individual investor. United Kingdom: Persons who
would be categorized as retail clients in the United Kingdom, as such term is defined in the rules of the Financial Conduct Authority, should read this
research in conjunction with prior Goldman Sachs research on the covered companies referred to herein and should refer to the risk warnings that
have been sent to them by Goldman Sachs International. A copy of these risks warnings, and a glossary of certain financial terms used in this report,
are available from Goldman Sachs International on request.

May 30, 2014 Japan
Goldman Sachs Global Investment Research 32
European Union: Disclosure information in relation to Article 4 (1) (d) and Article 6 (2) of the European Commission Directive 2003/126/EC is available
at http://www.gs.com/disclosures/europeanpolicy.html which states the European Policy for Managing Conflicts of Interest in Connection with
Investment Research.
Japan: Goldman Sachs Japan Co., Ltd. is a Financial Instrument Dealer registered with the Kanto Financial Bureau under registration number Kinsho
69, and a member of Japan Securities Dealers Association, Financial Futures Association of Japan and Type II Financial Instruments Firms
Association. Sales and purchase of equities are subject to commission pre-determined with clients plus consumption tax. See company-specific
disclosures as to any applicable disclosures required by Japanese stock exchanges, the Japanese Securities Dealers Association or the Japanese
Securities Finance Company.
Ratings, coverage groups and views and related definitions
Buy (B), Neutral (N), Sell (S) -Analysts recommend stocks as Buys or Sells for inclusion on various regional Investment Lists. Being assigned a Buy
or Sell on an Investment List is determined by a stock's return potential relative to its coverage group as described below. Any stock not assigned as
a Buy or a Sell on an Investment List is deemed Neutral. Each regional Investment Review Committee manages various regional Investment Lists to a
global guideline of 25%-35% of stocks as Buy and 10%-15% of stocks as Sell; however, the distribution of Buys and Sells in any particular coverage
group may vary as determined by the regional Investment Review Committee. Regional Conviction Buy and Sell lists represent investment
recommendations focused on either the size of the potential return or the likelihood of the realization of the return.
Return potential represents the price differential between the current share price and the price target expected during the time horizon associated
with the price target. Price targets are required for all covered stocks. The return potential, price target and associated time horizon are stated in each
report adding or reiterating an Investment List membership.
Coverage groups and views: A list of all stocks in each coverage group is available by primary analyst, stock and coverage group at
http://www.gs.com/research/hedge.html. The analyst assigns one of the following coverage views which represents the analyst's investment outlook
on the coverage group relative to the group's historical fundamentals and/or valuation. Attractive (A). The investment outlook over the following 12
months is favorable relative to the coverage group's historical fundamentals and/or valuation. Neutral (N). The investment outlook over the
following 12 months is neutral relative to the coverage group's historical fundamentals and/or valuation. Cautious (C). The investment outlook over
the following 12 months is unfavorable relative to the coverage group's historical fundamentals and/or valuation.
Not Rated (NR). The investment rating and target price have been removed pursuant to Goldman Sachs policy when Goldman Sachs is acting in an
advisory capacity in a merger or strategic transaction involving this company and in certain other circumstances. Rating Suspended (RS). Goldman
Sachs Research has suspended the investment rating and price target for this stock, because there is not a sufficient fundamental basis for
determining, or there are legal, regulatory or policy constraints around publishing, an investment rating or target. The previous investment rating and
price target, if any, are no longer in effect for this stock and should not be relied upon. Coverage Suspended (CS). Goldman Sachs has suspended
coverage of this company. Not Covered (NC). Goldman Sachs does not cover this company. Not Available or Not Applicable (NA). The
information is not available for display or is not applicable. Not Meaningful (NM). The information is not meaningful and is therefore excluded.
Global product; distributing entities
The Global Investment Research Division of Goldman Sachs produces and distributes research products for clients of Goldman Sachs on a global
basis. Analysts based in Goldman Sachs offices around the world produce equity research on industries and companies, and research on
macroeconomics, currencies, commodities and portfolio strategy. This research is disseminated in Australia by Goldman Sachs Australia Pty Ltd
(ABN 21 006 797 897); in Brazil by Goldman Sachs do Brasil Corretora de Títulos e Valores Mobiliários S.A.; in Canada by either Goldman Sachs
Canada Inc. or Goldman, Sachs & Co.; in Hong Kong by Goldman Sachs (Asia) L.L.C.; in India by Goldman Sachs (India) Securities Private Ltd.; in
Japan by Goldman Sachs Japan Co., Ltd.; in the Republic of Korea by Goldman Sachs (Asia) L.L.C., Seoul Branch; in New Zealand by Goldman Sachs
New Zealand Limited; in Russia by OOO Goldman Sachs; in Singapore by Goldman Sachs (Singapore) Pte. (Company Number: 198602165W); and in
the United States of America by Goldman, Sachs & Co. Goldman Sachs International has approved this research in connection with its distribution in
the United Kingdom and European Union.
European Union: Goldman Sachs International authorised by the Prudential Regulation Authority and regulated by the Financial Conduct Authority
and the Prudential Regulation Authority, has approved this research in connection with its distribution in the European Union and United Kingdom;
Goldman Sachs AG and Goldman Sachs International Zweigniederlassung Frankfurt, regulated by the Bundesanstalt für
Finanzdienstleistungsaufsicht, may also distribute research in Germany.
General disclosures
This research is for our clients only. Other than disclosures relating to Goldman Sachs, this research is based on current public information that we
consider reliable, but we do not represent it is accurate or complete, and it should not be relied on as such. We seek to update our research as
appropriate, but various regulations may prevent us from doing so. Other than certain industry reports published on a periodic basis, the large
majority of reports are published at irregular intervals as appropriate in the analyst's judgment.
Goldman Sachs conducts a global full-service, integrated investment banking, investment management, and brokerage business. We have
investment banking and other business relationships with a substantial percentage of the companies covered by our Global Investment Research
Division. Goldman, Sachs & Co., the United States broker dealer, is a member of SIPC (http://www.sipc.org).
Our salespeople, traders, and other professionals may provide oral or written market commentary or trading strategies to our clients and our
proprietary trading desks that reflect opinions that are contrary to the opinions expressed in this research. Our asset management area, our
proprietary trading desks and investing businesses may make investment decisions that are inconsistent with the recommendations or views
expressed in this research.
The analysts named in this report may have from time to time discussed with our clients, including Goldman Sachs salespersons and traders, or may
discuss in this report, trading strategies that reference catalysts or events that may have a near-term impact on the market price of the equity
securities discussed in this report, which impact may be directionally counter to the analyst's published price target expectations for such stocks. Any
such trading strategies are distinct from and do not affect the analyst's fundamental equity rating for such stocks, which rating reflects a stock's
return potential relative to its coverage group as described herein.
We and our affiliates, officers, directors, and employees, excluding equity and credit analysts, will from time to time have long or short positions in,
act as principal in, and buy or sell, the securities or derivatives, if any, referred to in this research.
This research is not an offer to sell or the solicitation of an offer to buy any security in any jurisdiction where such an offer or solicitation would be
illegal. It does not constitute a personal recommendation or take into account the particular investment objectives, financial situations, or needs of
individual clients. Clients should consider whether any advice or recommendation in this research is suitable for their particular circumstances and, if
appropriate, seek professional advice, including tax advice. The price and value of investments referred to in this research and the income from them

May 30, 2014 Japan
Goldman Sachs Global Investment Research 33
may fluctuate. Past performance is not a guide to future performance, future returns are not guaranteed, and a loss of original capital may occur.
Fluctuations in exchange rates could have adverse effects on the value or price of, or income derived from, certain investments.
Certain transactions, including those involving futures, options, and other derivatives, give rise to substantial risk and are not suitable for all investors.
Investors should review current options disclosure documents which are available from Goldman Sachs sales representatives or at
http://www.theocc.com/about/publications/character-risks.jsp. Transaction costs may be significant in option strategies calling for multiple purchase
and sales of options such as spreads. Supporting documentation will be supplied upon request.
All research reports are disseminated and available to all clients simultaneously through electronic publication to our internal client websites. Not all
research content is redistributed to our clients or available to third-party aggregators, nor is Goldman Sachs responsible for the redistribution of our
research by third party aggregators. For research or data available on a particular security, please contact your sales representative or go to
http://360.gs.com.
Disclosure information is also available at http://www.gs.com/research/hedge.html or from Research Compliance, 200 West Street, New York, NY
10282.
© 2014 Goldman Sachs.
No part of this material may be (i) copied, photocopied or duplicated in any form by any means or (ii) redistributed without the prior written consent of The Goldman Sachs Group, Inc.