WOC 5.3 Study group report - International Gas Unionmembers.igu.org/old/IGU...
66
WOC 5.3 – Study group report Natural Gas Vehicles: The Sustainable Road Towards a Clean Planet June 2015
Transcript of WOC 5.3 Study group report - International Gas Unionmembers.igu.org/old/IGU...

WOC 5.3 – Study group report
Natural Gas Vehicles: The Sustainable Road Towards a Clean Planet June 2015

2012-2015 Triennium Work Report June 2015
Natural Gas Vehicles: The Sustainable Road Towards
a Clean Planet
Produced by: International Gas Union
This publication is produced under the auspices of the International Gas Union (IGU) which holds the copyright. This publication may not be reproduced in whole or in
part without the written permission of the IGU. However, irrespective of the above, established journals or periodicals shall be permitted to reproduce this publication, or
part of it, abbreviated or edited form, provided that credit is given to IGU. This document contains strictly technical information to be distributed during the 26th World Gas
Conference in Paris, France, and has no commercial intent.
www.igu.org

3

4
Table of Contents
TABLE OF CONTENTS ................................................................................................................................. 4 INTRODUCTION ........................................................................................................................................ 6 ACKNOWLEDGEMENTS............................................................................................................................... 6 AIMS ..................................................................................................................................................... 6 METHODS .............................................................................................................................................. 6 CONCLUSIONS ......................................................................................................................................... 7 REFERENCES ............................................................................................................................................ 7
INTRODUCTION .................................................................................................................................... 8
NGV OVERVIEW ................................................................................................................................. 12
AUSTRIA .............................................................................................................................................. 15 FRANCE ............................................................................................................................................... 18 RUSSIA ................................................................................................................................................ 21
LNG : A SOLUTION TO REACH EMISSIONS LIMITS IN MARITIME THE SECTOR. ....................................... 24
CONTRIBUTION OF SHIPPING TO THE DETERIORATION OF THE AIR QUALITY: EUROPE AS A CASE STUDY ......................... 25 THE LEGISLATIVE AND REGULATORY CONTEXT IS BENEFICIAL FOR LNG IN MARITIME TRANSPORT ................................ 27 LNG AS A FUEL, AN ENVIRONMENTALLY FRIENDLY SOLUTION FOR THE MARITIME SECTOR ......................................... 28 LNG BUNKERING AS TECHNOLOGIES ............................................................................................................ 29 LNG MARITIME MARKET OVERVIEW ............................................................................................................ 32
BIOMETHANE, A HUGE LEVERAGE FOR GHG REDUCTION IN TRANSPORT, NEEDS DEDICATED POLICIES AND IMPROVED STANDARDS. ............................................................................................................ 34
BIOMETHANE PRODUCTION PROCESSES ........................................................................................................ 35 OVERVIEW OF BIOMETHANE MARKET .......................................................................................................... 36 BIOGAS CASE STUDY: SWEDEN ................................................................................................................... 39 BIOGAS CASE STUDY: FINLAND ................................................................................................................... 39
NATURAL GAS AND HYDROGEN SYNERGIES ........................................................................................ 42
HYDROGEN VEHICLE TECHNOLOGIES ............................................................................................................ 42 HYDROGEN MARKET OVERVIEW ................................................................................................................. 44 HYDROGEN CASE STUDY :GRHYD, THE FRENCH POWER-TO-GAS PROJECT WITH MOBILITY APPLICATION ...................... 46
APPENDIX 1:NGV COUNTRIES PROFILES .............................................................................................. 48
ALGERIA .............................................................................................................................................. 49 AUSTRIA .............................................................................................................................................. 51 BELGIUM .............................................................................................................................................. 53 FRANCE ............................................................................................................................................... 54 GERMANY ............................................................................................................................................ 56 JAPAN ................................................................................................................................................. 58 RUSSIA ................................................................................................................................................ 59

5
SOUTH KOREA ....................................................................................................................................... 61
APPENDIX 2: NGVA EUROPE STATISTICS FOR EUROPE ......................................................................... 63
6
Introduction
This paper provides an overview of the current world situation for natural gas vehicles (NGVs). It includes perspectives on CNG, LNG, biomethane and the potential synergies with hydrogen in terms of technologies and market development. A number of brief country case studies also are included in order to give an example of how the fuel and technologies are being applied in various regions and markets.
Acknowledgements
Mr Said AKRETCHE – NAFTAL, Algeria
Mrs Miriam DZAH-EKLO, ENGIE, France
Mr Ricardo EMILIO, Dourogas, Portugal
Ms Naoko FUKUTOME, Tokyo Gas Co., Ltd , Japan
Mr David GRAEBE, Gazprom , Germany
Dr JeongOk HAN, KOGAS, South Korea
Mr Cristian KERNEL, Nature Energy, Denmark
Mr Javier LEBRATO, NGVA Europe, Belgium
Mr Ari LAMPINEN, Suomen Finnish Finlands, Finland
Mr Eugene PRONIN, Gazprom, Russia
Mr P. J SEIDINGER, OMV Gas & Power GmbH, Austria
Dr Jeffrey SEISLER, Clean fuels consulting, Belgium
Aims
The paper is designed to highlight the progress of the NGV development worldwide. It is written for a general audience of people in search of a broad but brief overview of opportunities and challenges for methane as a vehicle fuel; be it fossil or renewable; stored as compressed or cryogenic fuels. The potential of hydrogen as a gaseous fuel alternative also is evaluated to encourage expanded thinking about the possible synergies with methane.
Methods
The report was completed by a small group of NGV stakeholders working within the structure of the International Gas Union’s (IGU) triennial work program, with the intention of providing a brief presentation at the IGU’s tri-annual World Gas Conference. It is a result of brainstorming, research with various NGV stakeholders, and from the experiences of the various authors who are integrally involved in NGV development work in their own companies in their own countries. XX people from XX countries participated in this work.

7
Conclusions
NGVs have come a long way in their global development but still have a long term opportunity to achieve a substantial share of various markets for cars, trucks, buses and, most recently, in the shipping industry. Tighter emissions regulations will encourage cleaner technologies for gasoline and diesel, however, as these vehicle technologies improve so too will the opportunity for methane as a fuel grow since it is intrinsically cleaner and cheaper than the status quo petroleum fuels. Nevertheless, linkages and synergies with the vehicle manufacturers will be crucial to the long term market penetration of NGVs. Also, the natural gas industry itself must continue to champion the market development by a continued effort to make CNG and LNG available to public drivers and commercial fleet operators (trucks, ships, and ultimately, the rail industry). Natural gas is a proven reliable, safe and economic fuel for the transportation sector as an enhancement to the on-going growth of the entire natural gas industry worldwide.
References
All references are included within the text (footnotes at the bottom of the page) or as noted with various diagrams and tables included in the text.

8
IGU WOC 5.3
Introduction1
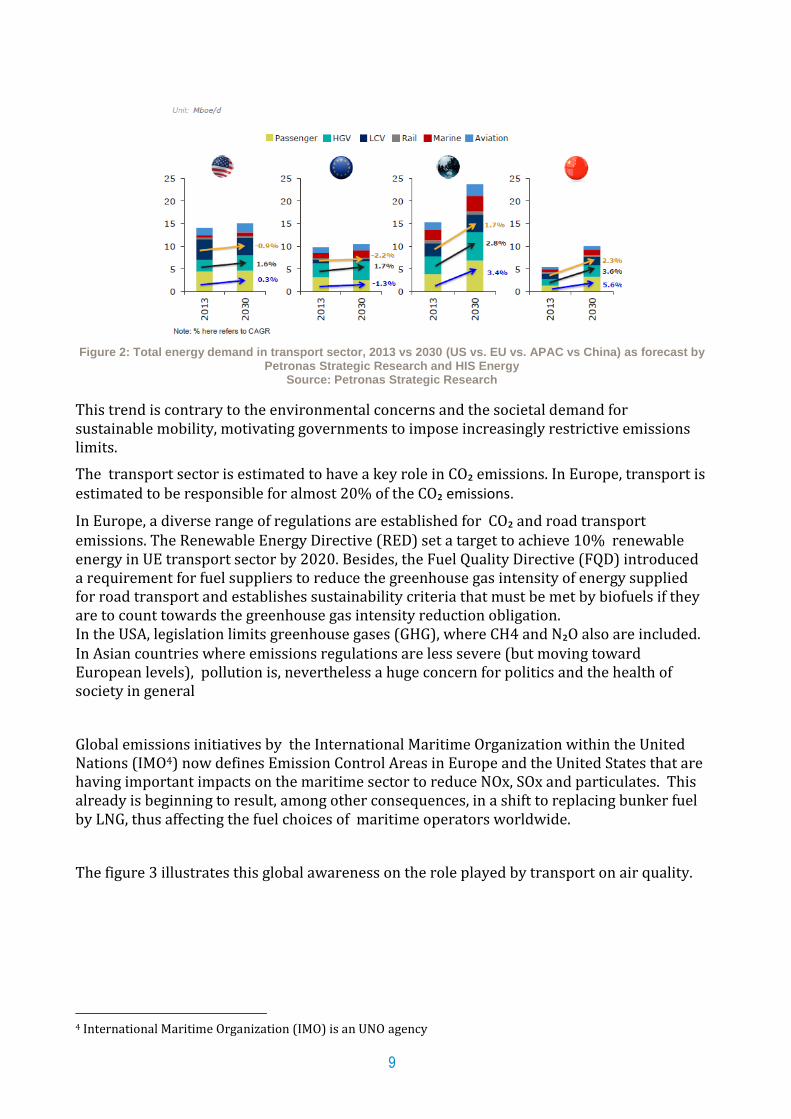
In 2012, worldwide consumption rose by 25% compared to the consumption in 2000, overpassing 45 million barrels per day2. This demand is increasing continuously. Based on the “business as usual” scenario from IEA, the energy consumption from the transportation sector should increase by 30% between 2010 and 2030, from 2 200 Mtoe (~25 600 TWh) to ~3 000 Mtoe (~34 900 TWh). By 2050, the transportation sector could represent a yearly global energy consumption of 4 500 Mtoe (~52 300 TWh).
Figure 1: Global transport demand3
If this growth applies broadly for all the regions of the world, the most important increase in the demand of energy for transport is expected to be in China and in Asia Pacific (abbreviated APAC in the figure below) where pollution issues are becoming a great concern for public authorities.
1 Prepared by Miriam Dzah-Eklo, GDF SUEZ, France
2 Source: LNG in Transportation, challenging oil’s grips, IHS 3 Source: LNG in Transportation, challenging oil’s grips, IHS
9
Figure 2: Total energy demand in transport sector, 2013 vs 2030 (US vs. EU vs. APAC vs China) as forecast by
Petronas Strategic Research and HIS Energy Source: Petronas Strategic Research
This trend is contrary to the environmental concerns and the societal demand for sustainable mobility, motivating governments to impose increasingly restrictive emissions limits.
The transport sector is estimated to have a key role in CO₂ emissions. In Europe, transport is estimated to be responsible for almost 20% of the CO₂ emissions.
In Europe, a diverse range of regulations are established for CO₂ and road transport emissions. The Renewable Energy Directive (RED) set a target to achieve 10% renewable energy in UE transport sector by 2020. Besides, the Fuel Quality Directive (FQD) introduced a requirement for fuel suppliers to reduce the greenhouse gas intensity of energy supplied for road transport and establishes sustainability criteria that must be met by biofuels if they are to count towards the greenhouse gas intensity reduction obligation. In the USA, legislation limits greenhouse gases (GHG), where CH4 and N₂O also are included. In Asian countries where emissions regulations are less severe (but moving toward European levels), pollution is, nevertheless a huge concern for politics and the health of society in general
Global emissions initiatives by the International Maritime Organization within the United Nations (IMO4) now defines Emission Control Areas in Europe and the United States that are having important impacts on the maritime sector to reduce NOx, SOx and particulates. This already is beginning to result, among other consequences, in a shift to replacing bunker fuel by LNG, thus affecting the fuel choices of maritime operators worldwide.
The figure 3 illustrates this global awareness on the role played by transport on air quality.
4 International Maritime Organization (IMO) is an UNO agency

10
Figure 3: CO₂ and GHG emissions projection
Source : Light –Duty Emission Legislation Timeline, AVL
In this context of energy transition, the transport sector (rail, route, maritime, air), has to find new environmental friendly solutions regarding fuels, technologies, logistic among many options: alternative fuels, after-treatment technologies, hybridization, combustion treatment, electrification, fuel cells and renewable fuels for internal combustion engines (ICEs).
The energy transition presents a great opportunity to commercialise natural gas as a fuel for transport. PETRONAS Strategic Research projects that the demand for gas in the transport sector will increase to more than 250 billion cubic meters/year (bcm/y). But this demand will differ in world regions, with Asia and North America anticipated to be the key growth markets by 2030 (figure below), as shown in Figure 4.
Figure 4:gas demand for transport as projected by PETRONAS Strategic Research and Wood McKenzie

11
Natural gas, as a fossil fuel or renewable resource, able to be stored as compressed gas or as a cryogenic liquid makes it unique among the energy options for transport, today and into the future.
This document, resulting from observations and assessments from the WOC 5, Study Group 5.3 of IGU on natural gas for vehicle presents an NGV market overview for different countries and market and technological overview of LNG, biomethane, hydrogen and some case studies for dissemination purposes.
Finally, NGV countries profiles are presented in appendix.

12
IGU WOC 5.3
NGV overview
Transportation fuel markets continue to be dominated by petrol and diesel. Nevertheless, natural gas in its
gaseous and liquefied forms is becoming one of the most interesting alternative fuels in many world
regions.
In many countries of South America and Asia natural gas is being adopted in the transport sector as a
partial solution growing pollution problems. The abundance of relatively inexpensive natural gas
worldwide is another motivation, as is energy security, such as the case in Europe. Figure 5 shows a
continental view of the NGV markets, also indicating their market share of the total vehicle population and
the amount of gas consumed in these markets.
Figure 5: Overview of worldwide NGV market
Source: Gazprom, 2013
Despite the steady market growth, in many countries some parameters are still hindering the development
of the global NGV markets:
Infrastructure costs: Even as synergies are expanded to include L-CNG (liquefied-to-compressed
natural gas), NGV infrastructures still require a substantial level of investment, particularly for
building fuel stations and for the connection to the grid.
Availability of natural gas vehicles: a: Despite the fact that there are over 150 manufacturers
producing nearly 600 different models of natural gas cars, trucks and buses worldwide5 , more than
any other alternative fuelled vehicles, NGV product availability in many countries is not adequate to
serve the broadest range of potential customers. The price differential between an NGV and a
traditional petrol car still is a factor in NGV market development. Typically NGVs cost 12 to 20% more
than a diesel or gasoline car.
5 Survey by Clean Fuels Consulting, 2013.

13
Public policy support: Government support for alternative fuels and NGVs specifically continues to
be a challenge to market development. The European Union has been proactive in creating legislation
to motivate new NGV and alternative fuel infrastructure for CNG and LNG but many other regions lack
the political support that could provide incentives that are important to the growth of NGV markets.
An overview of various country markets is provided in the form of national case studies.

14
Algeria6
Brief history of NGV in Algeria
NGV history in Algeria begins in 1989 with the conversion to CNG of four heavy-duty vehicles and the
building of two filling stations operated by SONELGAZ-NAFTAL. In 2000, the first NGV filling station was
opened to the public in Algiers. By 2002, 120 SONELGAZ vehicles were converted to CNG and five CNG
buses purchased.
Todaythe main gas companies of Algeria (SONATRACH-NAFTAL and SONELGAZ) are involved in the
development of this sector according to a strategy based on three axis:
1. Large development of CNG filling station network
2. Development of a program to convert heavy duty vehicles such as trucks, buses and garbage trucks to
CNG
3. Promotion of CNG
NGVs Today
A pilot project is managed during the period 2014-2018. It is focused on a trial market of more than 100
urban buses operating mainly in Algiers. Twenty vans will be purchased and twenty filling stations should
be developed.
The price attractiveness is a challenge for CNG in Algeria as other fuels are benefitting from subsidies and
public support, which maintain them at a very low and competitive prices.
The development of LNG as a fuel is also explored (to date, Algeria operates two LNG ships) while the use of biogas is only just beginning. One project has been initiated in 2014.
Figure 6: Retrofit workshop in Algeria
Source: NAFTAL
6 Author: Saïd AKRETCHE, NAFTAL, March 2015

15
Austria7
Historical developments of NGV´s in Austria
Austria has a long history with NGVs. After World War II big trucks and busses had been retrofitted to CNG (to make use of gas fields in Austria also for mobility).
First modern public CNG station was opened by OMV in 1996 (in Graz/Styria)
By 2005 around 15 additional public CNG stations were opened in Austria
Starting in 2006 Austrian gas industry, together with branded automotive fuel retailers OMV and Agip/ENI developed a modern public infrastructure for NGVs. In 2010 the 150th public retails site was opened in Austria
By the end of 2014 around 175 public CNG retail sites offer CNG, many of which are open 24 hours a day, 7 days a week.
In addition in bigger cities like Linz, St. Pölten, Wr. Neustadt and Salzburg public CNG busses are operated. Dedicated CNG refuelling infrastructure for those busses has been build up. The CNG-refueling station in Linz is one of the biggest in Europe by bus capacity and refuelling capacity.
An excellent overview of the history of NGV in Austria is provided at (in German only): http://www.erdgasautos.at/media/medialibrary/2014/04/forumspecial_2011_cng.pdf
NGV Infrastructure and vehicles in Austria
The map below shows the 175 public CNG-stations that cover Austria (the “white areas” being mainly the alps). CNG-sites focus on major capital cities (in orange) and along highways, to provide an excellent NGV network.
The CNG-infrastructure have been built to the highest technical standards (LPG-test; best refuelling times; best filling pressure during the year,…). That ensures safety as well as highest mileage from every refill. 7 Prepared by P.J Seidinger, March 2015

16
In addition to the development of NGVsites the gas industry focused on marketing “gas mobility”.
First “around the world with CNG tour” has been designed and sponsored by an Austrian gas company as main sponsor. In 142 days a factory built CNG car fuelled 100% by CNG made the long trip, the first time on CNG only, including crossing Australia. Additional CNG tanks in the car provided 3.000 km range on a single fuelling. (Details see in the Guiness Book of Records). The main purpose of sponsoring of this event was to demonstrate the high standard of CNG cars.
For some years CNG rally cars proved their competitiveness in the Austrian Championship. The Austrian gas industry sponsored several teams running their cars on CNG. The CNG-powered rally cars demonstrated the high performance of gas as an automotive fuel.
To support and ensure the best performance in daily operations for NGV´s in Austria, the Austrian Gas Industry provides additional training related to NGVs:
Training for CNG for workshops, firemen and NGV resellerss have been provided in parallel to the development of the NGV refuelling infrastructure in Austria.
Changes in local Austrian legislation to allow NGVs to use underground garages
17
NGVs have been introduced into the natural gas industry fleets as a role model to save twice: fuel economy and reduced CO₂.
Despite clear signals by Austrian politicians to support “green mobility”, no bigger political support of NGVs in Austria has been provided. The fuel tax for CNG remains low in Austria, compared to diesel and gasoline but this cannot be assumed to be a long term policy.
Since 2012 the Austrian CNG-network is fully developed, CNG demand is stable, but at a low level.
In 2014 less than 1.000 new NGVs had been sold in Austrian , representing around 0,3% of all new cars registered in Austria in 2015. The overall figure is ~ 8.300 NGVs, including approximnatley 175 CNG-busses. (Total private, light duty vehicle car parc in Austria is, overall, about 5 million cars. Today all NGVs in Austria are factory built. Retrofitted NGVs tend to be for special needs only.
To be a significant player a market share of 5% has to be reached. From today’s perspective itis unclear how and when this goal of approximately 250.000 NGVs in Austria will be reached.
All information on NGV in Austria is provided on a central NGV platform, operated by Fachverband GasWärme: http://www.erdgasautos.at/
18
France8
CNG market remains at a low level compared to other European countries
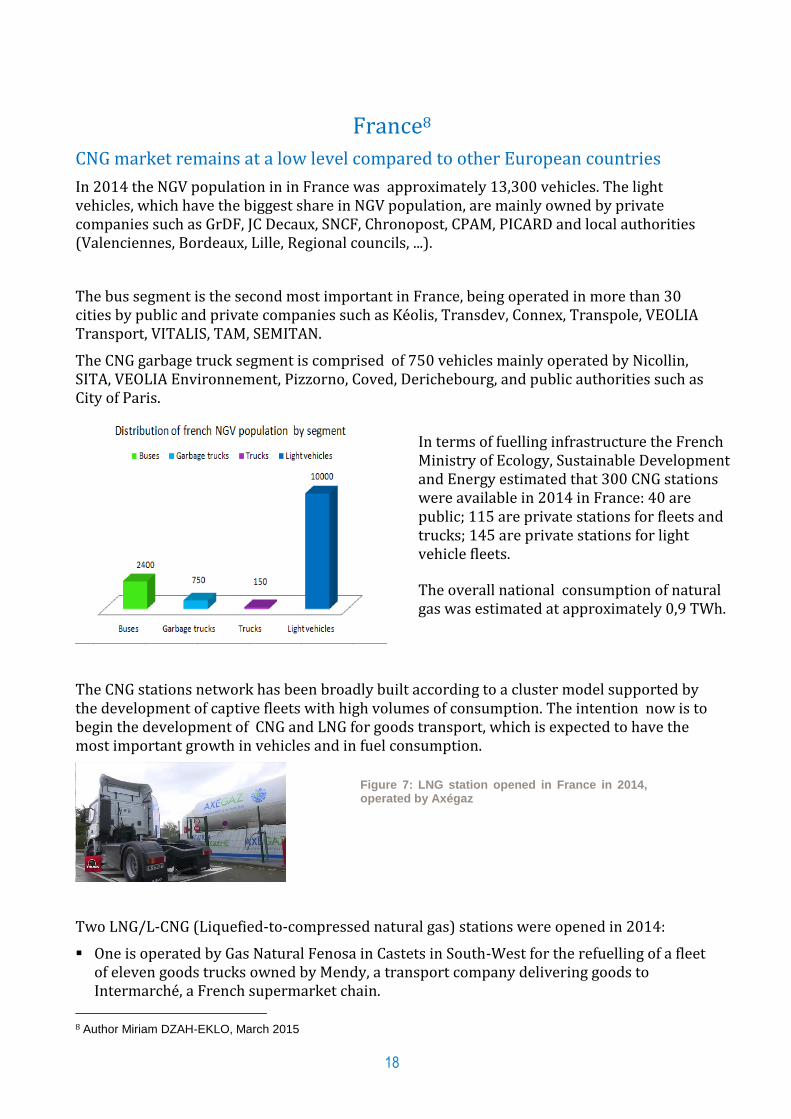
In 2014 the NGV population in in France was approximately 13,300 vehicles. The light vehicles, which have the biggest share in NGV population, are mainly owned by private companies such as GrDF, JC Decaux, SNCF, Chronopost, CPAM, PICARD and local authorities (Valenciennes, Bordeaux, Lille, Regional councils, ...).
The bus segment is the second most important in France, being operated in more than 30 cities by public and private companies such as Kéolis, Transdev, Connex, Transpole, VEOLIA Transport, VITALIS, TAM, SEMITAN.
The CNG garbage truck segment is comprised of 750 vehicles mainly operated by Nicollin, SITA, VEOLIA Environnement, Pizzorno, Coved, Derichebourg, and public authorities such as City of Paris.
The CNG stations network has been broadly built according to a cluster model supported by the development of captive fleets with high volumes of consumption. The intention now is to begin the development of CNG and LNG for goods transport, which is expected to have the most important growth in vehicles and in fuel consumption.
Two LNG/L-CNG (Liquefied-to-compressed natural gas) stations were opened in 2014:
One is operated by Gas Natural Fenosa in Castets in South-West for the refuelling of a fleet of eleven goods trucks owned by Mendy, a transport company delivering goods to Intermarché, a French supermarket chain.
8 Author Miriam DZAH-EKLO, March 2015
In terms of fuelling infrastructure the French Ministry of Ecology, Sustainable Development and Energy estimated that 300 CNG stations were available in 2014 in France: 40 are public; 115 are private stations for fleets and trucks; 145 are private stations for light vehicle fleets.
The overall national consumption of natural gas was estimated at approximately 0,9 TWh.
Figure 7: LNG station opened in France in 2014, operated by Axégaz

19
The other is operated by Axégaz for a private fleet of ten trucks owned by Jacky Perrenot in Saint-Quentin-Fallavier near Lyon.
The number of LNG/L-CNG stations should increase over the coming years as the four corridors (WE Blue, SoNor, Med-Blue, ATL-BLUE) of the European Commission-funded Blue Corridors project are planned to cross France which is part of the project. (A number of French companies are partners in the project.)
The support of public authorities is emerging in the City of Paris
Public authorities never supported CNG before 2015. But in April 2015, the public authorities of the City of Paris voted for a plan providing subsidies for the purchase of NGVs. This plan, part of the more global plan aiming at combating pollution causes, coupled with a decision taken by the Senate at the end of 2014, intends to convert part of the transport fleet to natural gas. This represents is a great opportunity for NGV development in France.
Biomethane and hydrogen both provide a great opportunityfor the development for CNG in France. Projects are now underway to produce biomethane and renewable hydrogen, exploring methods for direct injection into the grid and as a vehicle fuel usage.
The opportunity to blend biomethane or hydrogen and natural gas allows provides the possibility to create green certificates for refuelling purposes.
20
Germany9
Until the end of 2014 there were 99,621 natural gas vehicles registered in Germany with
constant growth over the past 10 years. The number of NGVs and 931 CNG filling stations, by
end 2014 makes Germany one of the biggest CNG markets in Europe.
CNG filling stations in Germany are usually integrated with conventional filling stations
providing customers with the possibility to use the same facilities, such as shop, garage or
other services as for conventional fuels. Therefore end-consumers recognise the provider of
CNG as fuel at the stations according to the branding of the oil majors. Out of the 931 public
CNG stations in Germany BP with its brand “Aral” had a market share of 20%, followed by
Esso (10%), Total (8%) and Shell (6%). The other 56% are operated by small and medium
players.. On the other hand the CNG-fuelling pumps and respective equipment at the stations
are owned by other companies. Here the largest players are E.ON with 91 stations, EWE with
80 and GAZPROM Germania with 28 stations.
At the end of 2014 roughly 270 million cubic metres of natural gas was consumed in the
transport sector. Target of the German government is to increase share of natural gas in
transport to some 2.5 bcm by 2020. Natural gas for vehicles has been explicitly mentioned as
one of the paths for environmentally friendly mobility in the “Energy Concept of the German
Government” as of autumn 2010 and in the “Fuels Strategy” of the German Government.
Due to a discount on the excise duty CNG has had a price advantage to Diesel of more than
40% on energy basis. According to the coalition contract of the current German government
the discount for CNG shall be prolonged over the year 2018 in order to further stimulate the
environmentally friendly driving. LPG also has a significant tax discount, the technology is
already accepted and furthermore the end-consumer price is published in €/l – as for
conventional fuels – which demonstrates the massive discount to Diesel a customer can
benefit from. In order to create parity in customer perception in pricing a common approach
to display also CNG prices in a liter-equivalent unit is currently being discussed with the
German government. CNG also competes with e-mobility due to very aggressive lobbying in
the public and in politics, however, it is expected that e-mobility – due to range and cost
disadvantages – will cover different market segments than NGV.
Efforts for developing the German NGV market are bundled through erdgas mobil, a joint
initiative by players from the German gas industry, aiming at increasing cooperation
between politics, car manufacturers, oil companies and the gas industry, and actively
targeting prospective customers to increase the number of NGVs in the market. Learning
from the disadvantages of a fragmented presentation of natural gas in the German market,
erdgas mobil has launched a common brand for natural gas in general and natural gas for
vehicles in particular, in order to allow for adequate recognition throughout the country.
9 Author David Graebe, Gazprom, Germany, May 2015

21
Russia10
Prepared by Eugene Pronin, Gazprom export, Russia. April 2015
History of Russian NGV market
The NGV market in the former Soviet Union was born in the mid-1980s when the federal government a national program, part of which included a large investment committed to building the national NGV industry. In a very short time (5 to 6 years) USSR began production and construction of CNG filling stations, high pressure cylinders, conversion kits, and cryogenic equipment. Additionally, Russian automakers were building and marketing OEM buses and trucks running on natural gas.
A very energetic effort resulted in the sale of one billion cubic meters of gas throughout the USSR in 1990, including 511 Mcm sold in Russia, one of the 15 Soviet republics.
Dramatic political, social and economic changes led to a steep drop of the NGV market that lasted untill 1998 when slow recovery began. It took only 8 years for a 10-times fall of CNG demand and 16 years to gain it back to the level of sales in 1991 – 435 Mcm.
Figure 8: History of the Russian NGV market since 1990
Source: Gazprom
In spite of low interest in natural gas, Gazprom – the major driver of the national NGV market – enthusiastically kept making efforts to preserve and expand the national gas fuelling infrastructure, develop national legislation and regulations, support research and development of new kinds of NGV equipment, and build up awareness of the advantages of natural gas.
Current situation and near future
The NGV market in Russia continues to grow, although at a moderate rate. According to ‘Gazprom gazomotornoye toplivo’ – the dedicated NGV company within the group - by the
10 Author Eugene Pronin, Gazprom export, Russia, April 2015

22
end of 2014 there were 111,000 methane vehicles on theroad supported by a network of 271 CNG filling stations that sold. 436 Mcm of natural gas to Russian vehicle operators.
Figure 9: Composition of Russia NGV fleet - end of 2014 Source : Gazprom
Gazprom managed to convince the Russian government to put the gasification of transport onto their priority list. In May 2013 the Russian Government resolved to switch public transport and communal vehicles to natural gas: by 2020 in cities with population of one million, at least 50% of these fleets shall be NGVs; 30% of the fleets in cities with population of 300 thousand to one million; and in smaller towns with 100 to 300 thousand residents – 10%. NGVs. Besides meeting environmental challenges, the Russian government intends to cut lower fuel costs in the national and municipal budgets. The average retail price of CNG (€ 0.23 for one normal cubic meter) is about 3 times lower than that of gasoline or diesel and 1.5 times lower than LPG. CNG in Russia is economically attractive not only for on-road vehicles but for other transportation means as well. Russian Railways – the state controlled company – also intends to replace 30% of diesel with LNG. This will total 1 million ton of LNG per year.
Figure 10: The GT-1 Gas turbine LNG locomotive Source : Russian Railways

23
The Russian Ministry of energy is targeting to have 2.5 million NGVs on the roads by 2030. This translates into at least 3,500 natural gas filling sites with a consumption of 4 – 5 Bcm of gas per year. Substantial investment will be needed toachieve these goals. It was reported that Gazprom alone may spend over € 4.6 billion to build 2,500 natural gas refuelling stations. Other Russian oil & gas majors also plan to begin their own NGV businesses. Rosneft, for instance, declared their readiness to build 1000 natural gas filling stations. Additional investment will be required to produce gas powered buses and trucks. KAMAZ is the champion of Russian NGV market. The company has developed an entire range of medium and heavy duty dedicated natural gas vehicles for various applications for both urban centers and motorways.
Figure 11: CNG KAMAZ garbage truck at a Statoil CN filling station in Stockholm

24
IGU WOC 5.3
LNG : a solution to reach emissions limits in maritime the sector11.
Liquefied natural gas (LNG) is compatible with almost all internal combustion engines (ICE) dedicated to road, marine, rail as well as air, thanks to technical upgrading of existing vehicles. However, its development should vary over the coming years according to the sector of transport considered. In a report12 published in September 2014, Cedigaz projected in a base scenario, that while the demand for rail mode should grow slowly, the demand for the road mode and for marine bunker should increase considerably to reach by 2035 respectively 96 million tons per year (mtpa) and 77 mtpa for marine.
Figure 12: Cediga's projections for LNG demand base scenario for road and marine transport
Source: Cedigaz13
Despite the interest of the question of LNG development for both the road and the marine sectors, the study group decided to focus on marine sector.
11 Prepared by Miriam Dzah-Eklo, GDF SUEZ, Franc 12 LNG in Transportation, Christoper Le Fevre, Mike Madden, Nick White, Cedigaz , September 2014 13 LNG in Transportation, Christoper Le Fevre, Mike Madden, Nick White, Cedigaz , September 2014
25
Contribution of shipping to the deterioration of the air quality: Europe as a case study
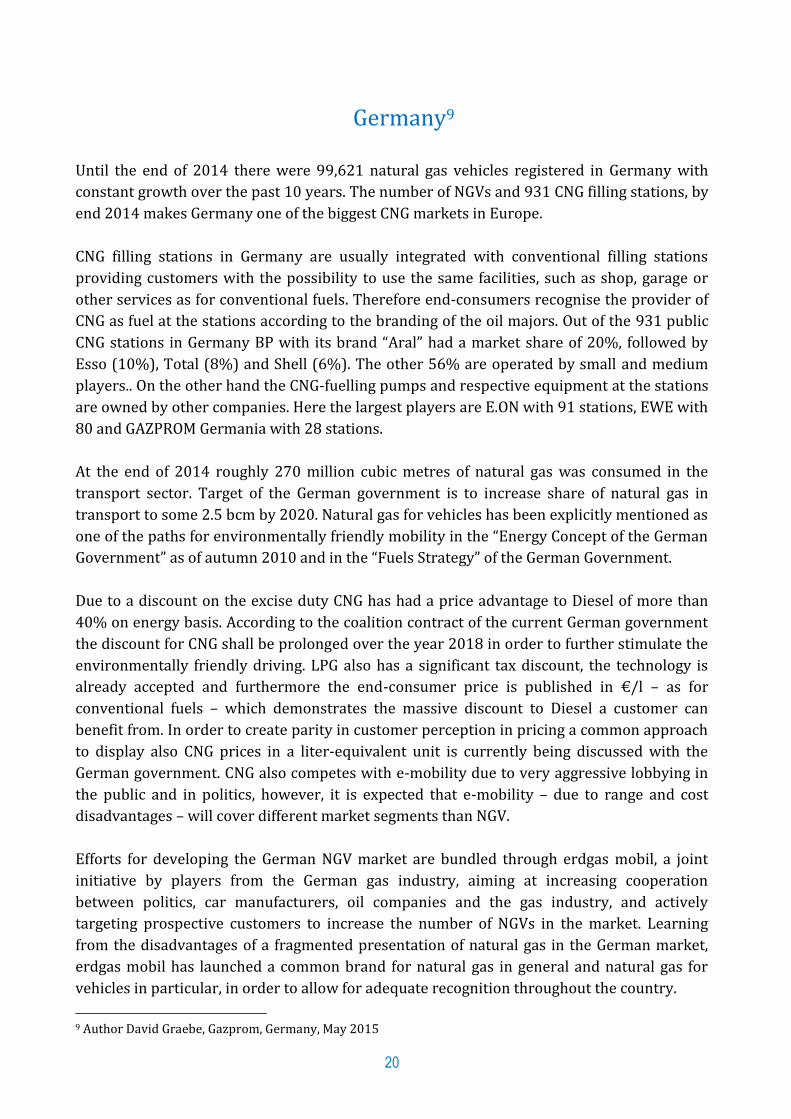
The European Environment Agency (EEA) estimated in its technical report n°4/2013, that shipping in European water contributes significantly to air pollution: from 5 to as much as 15% of the inland PM pollution.
Figure 13: Relative contribution of international shipping emissions (in %) on annual mean NO2 and PM2.5
concentrations in the year 2005 Source: European Environment Agency
14
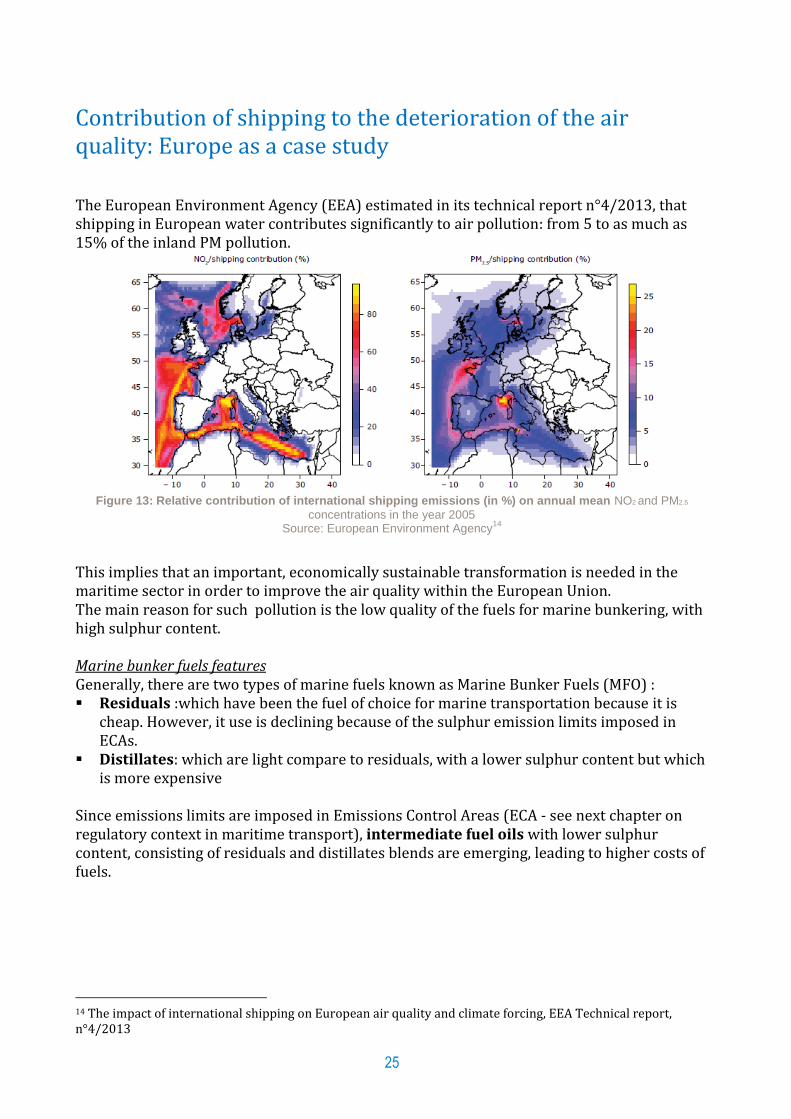
This implies that an important, economically sustainable transformation is needed in the maritime sector in order to improve the air quality within the European Union. The main reason for such pollution is the low quality of the fuels for marine bunkering, with high sulphur content. Marine bunker fuels features Generally, there are two types of marine fuels known as Marine Bunker Fuels (MFO) : Residuals :which have been the fuel of choice for marine transportation because it is
cheap. However, it use is declining because of the sulphur emission limits imposed in ECAs.
Distillates: which are light compare to residuals, with a lower sulphur content but which is more expensive
Since emissions limits are imposed in Emissions Control Areas (ECA - see next chapter on regulatory context in maritime transport), intermediate fuel oils with lower sulphur content, consisting of residuals and distillates blends are emerging, leading to higher costs of fuels.
14 The impact of international shipping on European air quality and climate forcing, EEA Technical report, n°4/2013
26
Figure 14: marine bunker fuels categories
15
Faced with more stringent emissions regulations, the maritime transport operators are turning to one of three fuel options: - Dual-fuel scenario: the ships run in ECA with low-sulphur oils or LNG and switch to the
traditional fuel when outside ECA. Low-sulphur content oils such as intermediate fuels oils are more expensive than residual fuel oil (RFO).
- Scrubber scenario: adding a scrubber in the ship to remove the sulphur in the exhaust gas, which also is an expensive option.
- Shifting to LNG fueled ship: this scenario is considered when the payback time is attractive compared to the other two scenarios.
At this moment, LNG has a very modest market share in the maritime transport. But this share is growing and is expected to continue increasing since LNG is a competitive solution that could help reduce PM, SOx, NOx and CO₂ emissions. This context is favourable to the promotion of LNG in the share of marine fuels.
15 adapted from LNG in transportaion, Cedigaz, 2014 and EEA Tehnical report, n°4/2013.

27
The legislative and regulatory context is beneficial for LNG in maritime transport The MARPOL Treaty At a global level, the International Maritime Organization (IMO) part of the United Nations, is addressing air pollution through the International Convention for the Prevention of Pollution from Ships (MARPOL) and its Annex VI. This treaty establishes limits on sulphur oxides (SOx), nitrogen oxides (NOx), ozone (O3)‑depleting substances and volatile organic compounds (VOC) from tankers. These are in force in certain sulphur oxide (SOx) Emission Control Areas (ECA) and nitrogen oxides (NOx) Emission Control Areas (NECA). The regulations are transitioning into effect, as identified in Figure 16, below.
Figure 15: adoption and entry into force and date of taking effect of special areas
Source: IMO16
ECA features Existing ECAs (Baltic Sea area, North Sea area, North American area, United States Caribbean Sea) and future potentialECAs are represented in Figure 17
Figure 16: Emissions control areas Source: Marine exhaust technology
16 http://www.imo.org/OurWork/Environment/SpecialAreasUnderMARPOL/Pages/Default.aspx

28
Ships operating in the ECAs are required to comply with SOx emission limits and can use lower sulphur oil based fuels, add sulphur oxide (SOx) exhaust scrubbers or swith to LNG. The treaty fixes a timeline for the entry in force of the limits imposed in ECA: - inside Emissions Control Areas (ECA) : limits of emission of SOx and particulate
matters (PM) - outside ECA: limits applicable for sulphur content of the fuel oils used The timeline puts pressure on maritime operators and ship-owners to look for more affordable alternatives to low-sulphur content oils.
Figure 17 : Global and inside-ECA Sulphur limit Source : MJMEnergy
NECA features
In 2015, limits for NOx are set only for North America and United States Caribbean Sea. It is focused on new ships where NOx emissions limits for engines are defined as a function of speed and installation year. Ships built between 2000 and 2016 need to be compliant with the limits fixed. By 2016, ships operating in so-called NECAs (NOX Emission Control Areas) need to comply with tighter limits.
LNG as a fuel, an environmentally friendly solution for the maritime sector In 2011, maritime transport was considered to be responsible for 38% of PM, 92% of SOx, 40% of NOx and 11% of the green house gas of the emissions of the worldwide transport sector17. Figure 19 identifies for land and marine transport the fuels, consumption and principle emissions in the global transportation sector.
17 SIA Partners
29
18 Figure 18: Fuels share in road and marine transport as summarized by Sia Partners(extract) from IEA,
IMO, IPCC, IIASA, CCNR sources Source :Sia Partners
19
In this context, LNG, which has the same environmental advantages as CNG, can make a valuable contribution to reducing emissions caused by petroleum fuels in these sectors. Hammingh et al. (2012) considered that the use of LNG in shipping would reduce NOx emission about 8% from a 2030 baseline for the North Sea. Additionally, , LNG does not emit SO₂, emits 90% less NOx and 20% less CO₂ than bunker fuels.20
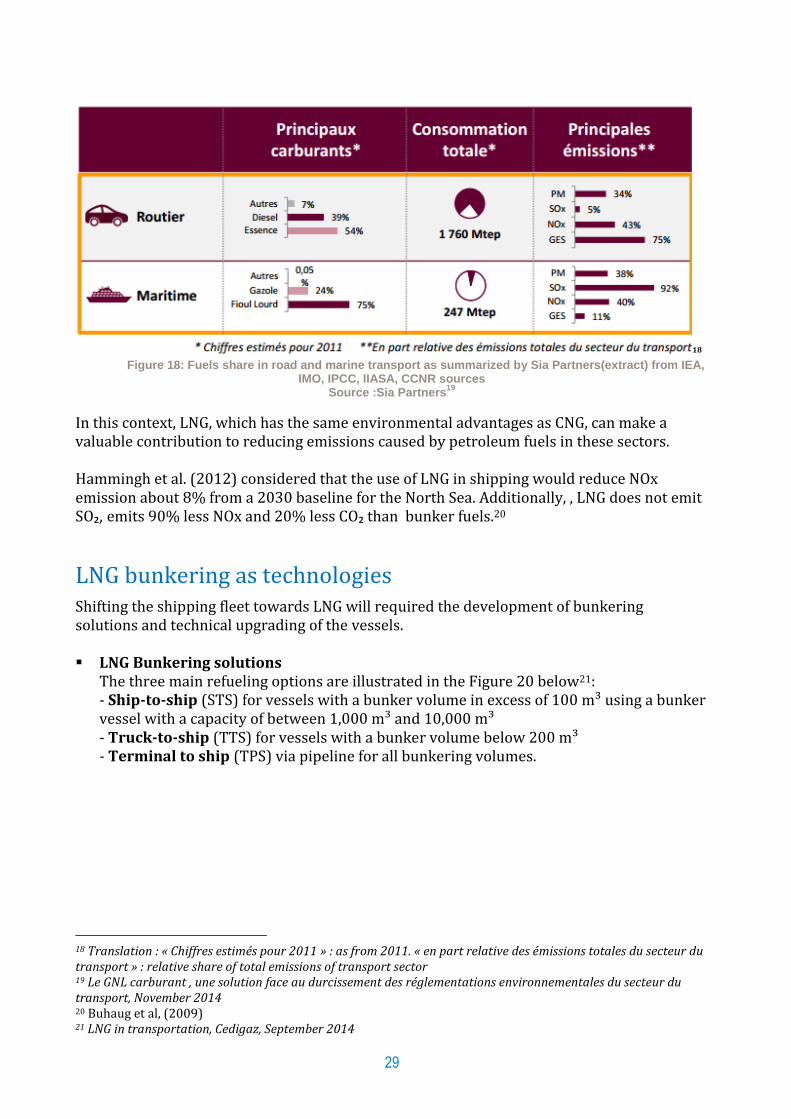
LNG bunkering as technologies Shifting the shipping fleet towards LNG will required the development of bunkering solutions and technical upgrading of the vessels. LNG Bunkering solutions
The three main refueling options are illustrated in the Figure 20 below21: - Ship-to-ship (STS) for vessels with a bunker volume in excess of 100 m³ using a bunker vessel with a capacity of between 1,000 m³ and 10,000 m³ - Truck-to-ship (TTS) for vessels with a bunker volume below 200 m³ - Terminal to ship (TPS) via pipeline for all bunkering volumes.
18 Translation : « Chiffres estimés pour 2011 » : as from 2011. « en part relative des émissions totales du secteur du transport » : relative share of total emissions of transport sector 19 Le GNL carburant , une solution face au durcissement des réglementations environnementales du secteur du transport, November 2014 20 Buhaug et al, (2009) 21 LNG in transportation, Cedigaz, September 2014

30
Figure 19: alternative LNG marine bunker solutions
Source : MJMENERGY
Vessel upgrading
The emissions limits imposed for marine transport, particularly in ECAs, will support three scenarios in the near future: (1) using low sulphur fuels in ECAs, (2) scrubber installation in the vessel, (3) shifting to LNG. The main driver for shifting to LNG is the favourable payback period. Unless LNG is readily available, shipping customers who see good payback with cleaner diesel and would adopt scrubbers rather than building new LNG fueled ships (see example of economics projected by Petronas Strategic Research, below.)
Figure 20: Economics of compliance options for container shipping
Source : Petronas Strategic Research

31
The investment costs to convert to LNG are higher than those for the scrubber alternative. Figure 18 below, from the technical report Vessel Emission Study: Comparison of various abatement technologies to meet emission levels for ECA’s, www.Greenship.org, 2012 are presented in order to give an idea of the investment levels. The calculations are based on an existing 38,500 DWT tanker vessel, NORD BUTTERFLY, from D/S NORDEN.
Figure 21: CAPEX scrubber installation
Source : www.greenship.org
Figure 22: CAPEX LNG installation
Source : www.greenship.org22
For vessel owners to convert to LNG the payback period of the investment is an essential element to be estimated.. It may vary according to the usage of the vessel (operating 100% in ECA, or less) and to the price spread between LNG and diesel. As an example, in its 2012 report Green ship of the future, www.greenship.org illustrated the sensitivity of LNG alternative to the purchasing cost of LNGWww.greenship.org. The graph in Figure 19 shows the effect on payback periods for different LNG-heavey fuel oil (HFO) price differentials.
22 Green Ship of the Future, Vessel emission study: Comparison of various abatement technologies to meet emission level for ECAs, 2012

32
Figure 23: sensitivity of payback period of LNG alternative to the spread between LNG and HFO
Source : www.greenship.org
LNG maritime market overview LNG as a maritime fuel is at its early stage. According to DNV, as of March 2014 there were, excluding LNG carriers and inland waterway vessels, 48 LNG fuelled ships operating worldwide and 53 confirmed LNG newbuilds. Additionally, there are 370 LNG carriers (most more than 100.000m3 capacity) currently in operation, of which many have been built with
turbines and gas operation capabilities23
.
According to DNGVL, 90% of all LNG fueled ships in operation are operating in Norwegian waters. But, there is an equal share of ships intended for operation in Norway, Northern Europe and North America But this growth of this market depends upon the convergence of a number of factors, including, for example: A low LNG price: The cost of LNG depends heavily on where it is purchased as there is no
global LNG pricing. The distance between LNG port terminal and pump stations generally has a strong impact on the margin as well as the level of taxes. Despite this, the LNG price is globally lower than traditional petroleum fuels. Savings could reach 35% compared to distillates oils24. The fuel price parameter is a great motivator for maritime sector in which fuel costs represents 25 to 30% of ship costs25. But the decoupling between oil and LNG prices may lead to reduce a lot this advantage (i.e. low oil price at 2015 T1).
The marine fleet renewal rate: The renewal of the world fleet is on-going, however, the life of a ship can be 20 to 30 years or more., In 2014, however, that the average age of
23 Opportunities and Challenges Fuelling LNG Ships, Erik Skramstad, DNV-GL, at CNG & LNG Safety: Perception & Reality, 9 October 2014, Brussels. Data updated 1 September 2014. 24 Main marine bunker oil prices could be found on http://www.bunkerworld.com/prices/region/maj/ 25 LNG in transportaion, Cedigaz, 2014
33
world shipping fleet (by dead-weight tonnage) was below 10 years old, confirming that the trend of rejuvenation of the world fleet is improving, which also means that more advanced, energy efficient ships are being sought. The annual growth of the world shipping fleet is about 4%, which would be an appropriate target to install LNG propulsion systems.26.
A high level of availability the technology: the availability of refueling infrastructure is a major concern. Vessels operator need to be confident of a good development of the infrastructure.
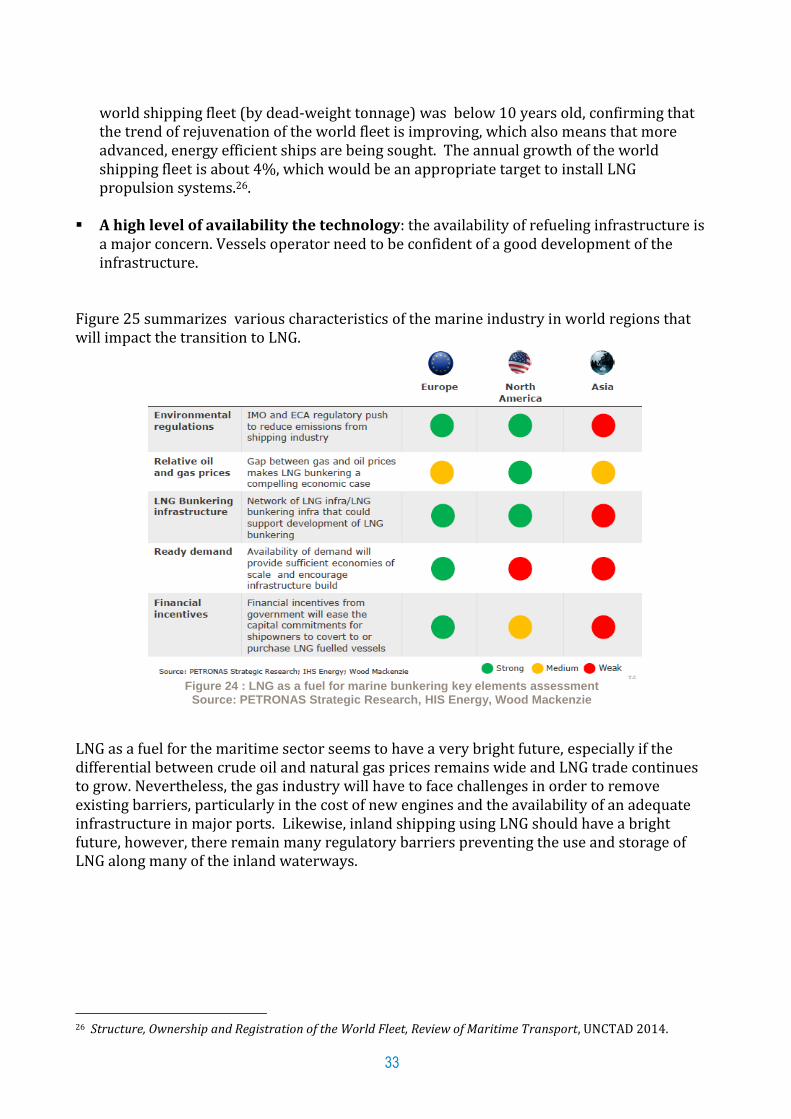
Figure 25 summarizes various characteristics of the marine industry in world regions that will impact the transition to LNG.
Figure 24 : LNG as a fuel for marine bunkering key elements assessment
Source: PETRONAS Strategic Research, HIS Energy, Wood Mackenzie
LNG as a fuel for the maritime sector seems to have a very bright future, especially if the differential between crude oil and natural gas prices remains wide and LNG trade continues to grow. Nevertheless, the gas industry will have to face challenges in order to remove existing barriers, particularly in the cost of new engines and the availability of an adequate infrastructure in major ports. Likewise, inland shipping using LNG should have a bright future, however, there remain many regulatory barriers preventing the use and storage of LNG along many of the inland waterways.
26 Structure, Ownership and Registration of the World Fleet, Review of Maritime Transport, UNCTAD 2014.

34
IGU WOC 5.3
Biomethane, a huge leverage for GHG reduction in transport, needs dedicated policies and improved standards27.
Biomethane (biogas upgraded to pipeline quality) can be used directly as a fuel for natural gas vehicles. Biomethane is receiving considerable attention in countries with mature economies where the debate regarding the “greening” of transport sector is taking on more significance. Thus, biomethane presents a significant opportunity for the development of renewable natural gas for vehicles.
The European Commission’s well-to-wheel study shows a very positive view of the green house gas reduction potential from using biogas in the transport sector. 28 The study shows that compressed biogas (CBG) and synthetic natural gas (SNG), emit far less of pollutants than the other alternative fuels. Indeed, well-to-wheel GHG emissions were found to be around 36 g CO₂ eq on average for a 2010 diesel injection spark ignition (DISI) engine when the biomethane was obtained from municipal waste. The decrease is down to-144 g CO₂ eq when the gas is made from manure. Using biomethane, NGVs can reduce their GHG output to minus 40-160% or more over typical diesel and gasoline vehicles. This is due to the benefits of waste recycling (organic waste, sewage, agricultural residues, energy crops or woody biomass`) on the one hand, while it encourages the development of local economy on the other.
Figure 26 shows the ‘virtuous circle’ of the waste-to-biomethane process for the NGV sector.
Figure 25: local economy development based on biomass valorization source: GDF SUEZ
27
This section prepared by Miriam Dzah-Eklo, GDF SUEZ, France
28 Well-to-whells Analysis of Future Automotive Fuels and Powertrains in the European Context, Appendix 1, JRC, 2014

35
Biomethane production processes Three main processes typically used to produce biomethane. are is represented in Figure 27, along with an estimate of the time that will be required to bring more biogas into the market. GAYA project has estimated the time for industrial development for each technology :
Figure 26: biomethane production processes
Source: GAYA project29
Wet biomass methanization process: based on anaerobic fermentation this process
transforms wet material such as organic wastes, effluents... into biogas. Biomethane is then obtained by removing mainly the CO₂ fraction from the biogas. The technologies in this process are mature and the methanization process is the most commonly used. The residuals from the process can be returned to the agricultural market as non-phosphate-based fertilizer. The raw biogas is used in large boilers while the upgraded, pipeline quality biomethane can be injected into the natural gas pipeline or used directly as a vehicle fuel after it has been either compressed or liquefied. Figure 28 shows the various applications of the biogas production process
Figure 27 : Biomethane production process based on methanisationce Source: GDF SUEZ
29 http://www.gayaproject.com/biomethane-generation-en.shtml

36
Dry biomass gasification process: based on a thermochemical process, the gasification process transforms dry materials (wood for example) into bio-syngas (bio synthetic gas) which, in turn, is transformed in biomethane. This technology should be mature in 2017.
Micro-algae cultivation: in this case biomethane is produced through the transformation of photosynthetic micro-algae, which are cultivated in immersed reactors and stimulated by natural light. More research and development is required to produce biogas economically on a commercial scale using micro-algae. The industrial development is expected after 2020.
The European Commission is developing a biomethane standard in order to regulate and legitimize the injection of biomethane into the pipeline network. Several countries already have a biomethane quality regulation (Sweden, Germany, and Switzerland), with the requirement to have 95% or higher methane content in the gas. Still, there are other issues associated with soloxanes (essentially silocone) that is more common when the feedstock for the gas is urban garbage. With regulations already in place for the non-discriminate access and injection of biomethane into the pipeline system, renewable natural gas should be able to play a substantial role in reducing CO2 and greenhouse gas emissions in the transportation sector and other sectors using natural gas.
Overview of biomethane market Biomethane as a fuel for transportation market is growing in mature economy regions such as Europe, United States of America and in a part of South Asia (Korea). According to IEA30, the USA is the largest consumer of biomethane for transport and a fourfold rise of the consumption in 2014 was anticipated over 2013 in the U.S.A.
In Sweden, biomethane consumption dedicated to transport was, in 2013, 869 GWh of 1,493, 150 GWh produced. The U.S. used 600 GWh of 1000 GWh and Germany 150 GWh of 500 GWh.
In Europe, the biomethane market could be hindered by the sustainability standards in Annex V of the Renewable Energy Directive (RED) (Directive 2009/28/EC), whichestablishes sustainability criteria, mandatory only for biomethane when it is used for transport sector. But since biomethane can be easily traced to its local origins, almost all originating from waste materials in the agricultural or urban environments, sustainability criteria for biogas/biomethane is much easier to achieve than any of the other liquid biofuels. In the agricultural sector, unlike food-stock diverted to liquid biofuel production, biogas is made from waste by-products, thus it will not have any issue associated with indirect land use (ILU) that surrounds the debate about liquid biofuels.
Biomethane can be liquefied to produce bioLNG better known as LBG (liquefied biogas). BioLNG production is at it very early stage. Two bioLNG production plants are known to
30 Status and Factors affecting Market Development and Trade, IEA, 2014

37
date: one in Lindköping (Sweden) that produces both gaseous and liquefied biomethane for cars, trucks and buses; and a second facility is located in the United Kingdom, in Albury.
BioNGV development receives different types of incentives in various countries. Germany, Sweden, Switzerland, the United Kingdom and Finland have provide subsidies to support the development of bioNGV. Table below gives an overview and figures of existing fiscal measures for biomethane injection and for the transport use. Figure 28 shows some of the subsidies and incentives provided for biomethane in Europe.

38
France The Netherlands Sweden Austria Switzerland Germany United Kingdom Luxembourg Finland
Injection of biomethane in the grid
Feed-in
tariff
Yes Yes, as for electricity
between 0,483
and 1,035 €/m3
Yes, as for
electricity there
is a bonus for
biomethane
Yes, as for electricity there
is a bonus for
biomethane. Moreover,
fee of 0,7 c€/kWh
Renewable Heat
Incentive (RHI)
6,8 c€/kWhPCS
Yes Measures against production of electricity from biogas
Conditio
ns/allow
ed
substrate
All subtract
except sewage
sludges and
waste from non
agro-food
industries. 15
years agreement.
All subtract except waste
from landfill
Facilities except waste
landfill using less than
200 KWh of heat
produced in situ or
facilities which inject
into the grid
Level From 4,5 up to
12,5 c€/kWh
Maximum : from 79
up to132 c€/m3(n)
8,13 c€/kWh
(6,8 p/kWh)
7,00 à 7,50 c€/kWh
Connecti
on
Approximately
0,15 c€/kWh
BioNGV
-Investment subsidy
from Swedish
Energy Agency and
agriculture
Chamber.
- Tax cut for bioNGV
-tax exemption for
bioNGV (Limpmim Law)
- Subsidies from
Fondation Centime
Climatique for bioNGV
projects
- ongoing works in
certificates models
Tax exemption for
bioNGV
Green certificates: BioNGV is eligible for Renewable Transport Fuel Obligation (RTFO)
-Tax exemption for
bioNGV
-investment subsidy for
biogas upgrade facilities
investments when
dedicated to
transport,typically 20-25 %,
but 40 % possibe for new
technology
Figure 28: Subsidies and incentives for biomethane and bioNGV development in Europe31
31 Source : GDF SUEZ, as from 2014

39
Biogas case study: Sweden Sweden is very dynamic in bioNGV development. In 2013, 869 GWh (almost 60%)out of a total of 1,493 GWh32 produced by the 53 biogas upgrading facilities was dedicated to its use. One major reason is the significantly lower tariff for ‘green’ electricity. The number of NGVs is growing constantly in Sweden. In 2012 and in 2013, the number of NGVs increased to 12% compared to the previous year. The Sweden liquefied biomethane (LBG) facility of Lindköping has a capacity of 60 Gwh per year and has been commissioned in 2012.
Biogas case study: Finland33 In September 2013 there were three companies selling biogas in public filling stations in Finland. All were CBG100 stations, i.e. selling 100 % biogas. Below are photos of the three filling stations: Metener Ltd in Laukaa (since 2002); Gasum Ltd in Lappeenranta (since 2011, currently 17 public and 1 private stations); and Haminan Energia Ltd in Hamina (since 2013). In addition, Metaenergia Ltd sold biogas at a private filling station in Haapajärvi (since 2012). There is also one public filling station selling natural gas (CNG) only. Biomethane was produced in four upgrading plants based on water scrubbing. Two of these are of Finnish origin (made by Metener and Metaenergia); one is from New Zealand (Greenlane); and one from Sweden (Malmberg). In addition, one experimental membrane upgrading unit was tested by Envor Biotech Ltd. Total annual production capacity was 28 GWh and upgrading capacity was 959 Nm3/h.
32 Biomethane, Status and Factors Affecting Market Development and Trade, IEA Bioenergy, September 2014 33 Written by Ari Lampinen, Suomen Finnish Finlands, 23.9.2014. The information is a summary of the Finnish version of the statistics publication. Both this summary and the original version are available at the website of the Finnish Biogas Association: www.biokaasuyhdistys.net.
Figure 29: Lindköping bioLNG production facility
Source: BioLNG, IEA Task 37, 2014

40
The table below shows national traffic biogas statistics since 1941. The statistics from 1941 to 1946 were collected from historical archives and published by Lampinen (2012) in Finnish. The same statistics were published in graphical form by Lampinen (2013) in English. Since 2002 the statistics have been collected from the producers and sellers directly. Traffic biogas statistics are part of the Biogas Plant Registries, which the Finnish Biogas Association has produced since 1994 in co-operation with the University of Eastern. Finland. All Biogas Plant Registries are available in electronic form at the www site of the Finnish Biogas Association.34
Glossary
CBG Compressed biogas
34http://www.biokaasuyhdistys.net/index.php?option=com_content&view=category&layout=blog&id=37&Itemid=61.
41
CBG100 100 % compressed biogas, i.e. not a blend with CNG or other type of CMG CMG Compressed methane gas from any source, including biogas and other renewable methane fuels as well as natural gas and other fossil methane fuels CNG Compressed natural gas References Lampinen Ari (2012) Liikennebiokaasun käyttöönotto Suomessa. Tekniikan Waiheita 1/2012, s. 5-20. Lampinen Ari (2013) Development of biogas technology systems for transport. Tekniikan Waiheita (Finnish Quarterly for the History of Technology) 3/2013, p. 5-37.

42
IGU WOC 5.3
Natural gas and hydrogen synergies35
Natural gas, since it is comprised of four parts hydrogen, is seen in possible complimantary ways with hydrogen into the future. The exact nature of how this possible ‘symbiosis’ is a subject of ongoing research and debate. In the short and mid-term, blends of natural gas and hydrogen could enhance the environmental impact of vehicles. A share of 20% of hydrogen in natural gas helps to decrease the NOx emissions by 10%, the greenhouse gases by 8% and to increase 7% the efficiency compared to natural gas. This had been demonstrated in France by ALTHYTUDE project. In its continuity the Hydrogen energy storage demonstration project (GRHYD), in France, launched in 2014 aims at demonstrating the benefits of blending natural gas and hydrogen for mobility among other objectives. An economical model for a 50 buses fleet has been find. Natural gas is seen by some countries such as the USA, as a possible bridge to hydrogen in the long term. The production of hydrogen from natural gas could constitute a strong relationship between the fuels and could be, according to the local economical conditions and political objectives, a less expensive option to the large-scale electrolysis process. In Europe, the main challenge is to develop renewable hydrogen produced with solar, wind or hydrokinectic power.
Hydrogen vehicle technologies To be used as a vehicle fuel hydrogen needs to be stored in fuelling stations and on-board the vehicle at pressures between 350 up to 700 bar. As with CNG, storage pressure will affect the range of the vehicle and, at the fuelling station, the time to refuel. The cost and economics of hydrogen fuelling and storage, therefore, are affected by the choice of pressure. The higher the pressure in the station, the faster the refueling operation. At the same time, the higher the pressure, the higher the investment. To date, the stations are mainly provided with 350 bar dispensers delivering fuel in approximately five minutes. Adding a 700 bar dispenser for a station optimized for 350 bar will required cooling equipments and a more complex process of delivery to the vehicle’s tank. Hydrogen can be stored at a station and delivered by tank-trucks in gaseous form as well as a cryogenic liquid form at a temperature of -253°C. As with LNG, cryogenic hydrogen also will require equipment specifically dedicated to the needs of super-cool fuels.
35 Prepared by Miriam Dzah-Eklo, GDF SUEZ, France

43
Hydrogen storage on the surface of solids through chemical reactions is another storage approach, commercially available (to see McPhy solutions). Hydrogen stations On-site hydrogen production at a fuelling station requires a range of special equipment including: a purification system, storage equipment, multi-stage compressors, as well as other systems for safety, piping, and electronic controls for fuel dispensing, not unlike what is commonly used in CNG fuelling stations. The Electric Vehicle Transportation Center has developed five categories of hydrogen stations:
- Onsite electrolysis of water : The hydrogen is produced onsite from water with the grid
electricity and is stored in high pressure tanks. This solution is a good solution to produce renewable hydrogen onsite and should develop over the next years.
- Onsite steam methane reforming: in this station, hydrogen is produced with a steam reformer which converter natural gas or biomethane into hydrogen.
- Figure 30: Configuration of an onsite Steam methane reformer station
Source : Hydrogen Fuelling Stations Infrastructure, Electric Vehicle Transportation Center, March 2014
- Liquid or gaseous hydrogen delivery: Hydrogen is produced offsite and delivered in the station by trucks.
- Pipeline delivery: Transporting hydrogen from the point of production to the station. (although there is only a very small hydrogen pipeline network typically available to very large commercial consumers of hydrogen).
- Mobile refueling: To deliver hydrogen stored in mobile tanks to a fueling site, much like the ‘mother-daughter’ system established for CNG.

44
Hydrogen vehicle technologies Hydrogen could be used as a fuel for - internal combustion engines (ICE) - in Fuel cells electric vehicles (FCEV) - in electric vehicles with range-extenders. Though some prototype ICE hydrogen vehicles have been developed, the most common application is in fuel cells. Electric vehicles with range-extenders should develop in the near future. The discussion below is focused on the FCEV and on the electric vehicles with range-extenders. FCEVs contain a fuel cell stack that converts hydrogen gas stored onboard with oxygen
from the air into electricity to drive the electric motor that propels the vehicle. The main components of a FCEV are shown in the Figure 33.
Figure 31: Fuel cells electric vehicle architecture
Source : http://www.fueleconomy.gov
FCEVs are quiet, energy efficient and emit zero local emissions other than water. Some vehicles are said to be able to achieve 600 km range.
A range-extender is a power unit added in an electric vehicle in order to increase its
autonomy. The range-extender can be fueled with hydrogen as well as with biomethane. A large development of the Electric vehicle with range-extender is expected over the coming years.
Hydrogen market overview Hydrogen as a vehicle fuel – particularly in fuel cells – has been the subject of much research and development particularly in the U.S., Europe, Japan and to a lesser degree in Southeast
45
Asia. But, as said before, it is a nascent market with only about 500 fuel cell vehicles worldwide.
Maps of hydrogen stations (in operation, planned and out of operation) is available on the web site of TÜD SÜD.
The challenges for hydrogen market development are straightforward: - The price of the vehicles is very high (60-90% more than petroleum vehicles)36; - The investments in building the fuelling stations are substantial (€0,7-2 million); - The price of hydrogen is much more than gasoline or diesel; - very few manufacturers are making FCEVs; - There is no widespread ‘hydrogen industry’ to support the fuelling station network
development (unlike the worldwide natural gas or electric industries to support their respective alternative fuel vehicles);
- The availability of hydrogen is limited for retail applications;
This high cost of the technology is due, in part, to the cost of the fuel cell but also the quantity of platinum that has to be integrated in the fuel cell battery; not to mention the durability and reliability of the battery. Despite a substantial increase of durability over the past few years, the batteries can reach approximately 120,000 km, which is only half what is needed for a good level of competition with gasoline engines. These costs and other realities should have an impact on the price of the fuel which, in turn, will vary according to the production mode chosen: on site electrolysis; steam methane reforming (SMR), or off-site production so the fuel can bedelivered in liquid or gaseous form.
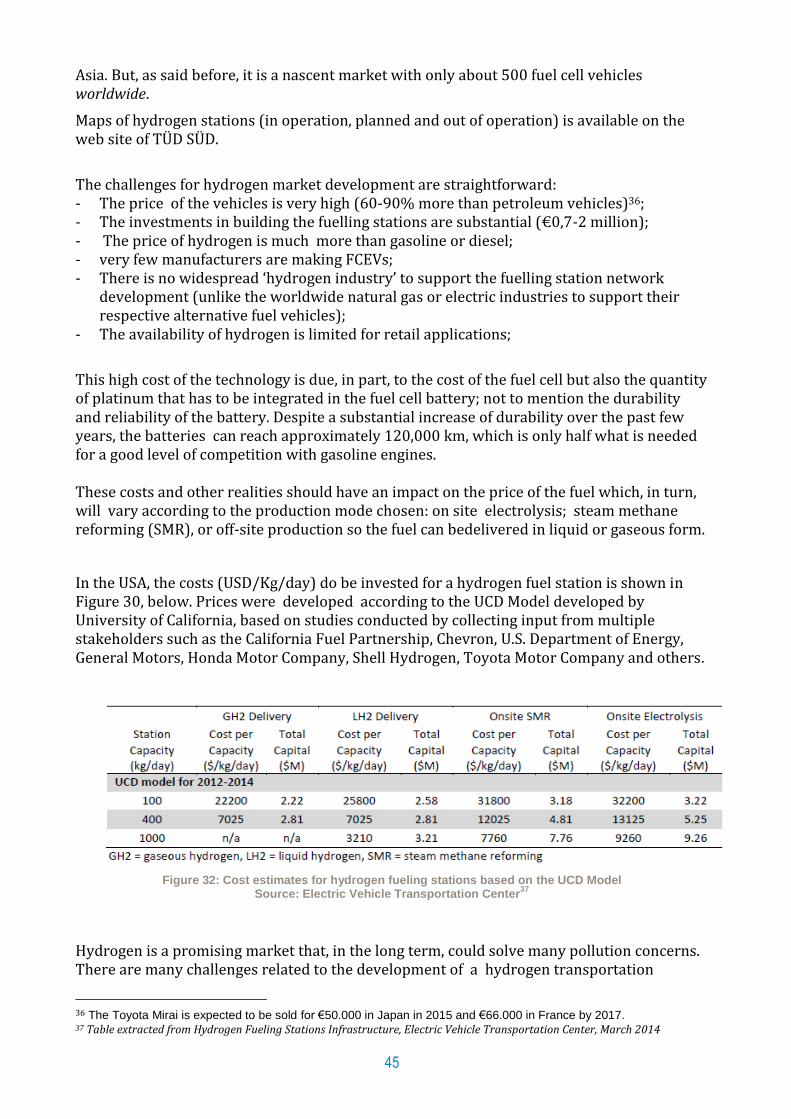
In the USA, the costs (USD/Kg/day) do be invested for a hydrogen fuel station is shown in Figure 30, below. Prices were developed according to the UCD Model developed by University of California, based on studies conducted by collecting input from multiple stakeholders such as the California Fuel Partnership, Chevron, U.S. Department of Energy, General Motors, Honda Motor Company, Shell Hydrogen, Toyota Motor Company and others.
Figure 32: Cost estimates for hydrogen fueling stations based on the UCD Model
Source: Electric Vehicle Transportation Center37
Hydrogen is a promising market that, in the long term, could solve many pollution concerns. There are many challenges related to the development of a hydrogen transportation
36 The Toyota Mirai is expected to be sold for €50.000 in Japan in 2015 and €66.000 in France by 2017. 37 Table extracted from Hydrogen Fueling Stations Infrastructure, Electric Vehicle Transportation Center, March 2014
46
market: technological; fuel infrastructure; and many other issues. In this context, the synergies between NGV and hydrogen could be seen as opportunities to building new business models for the gas industry.
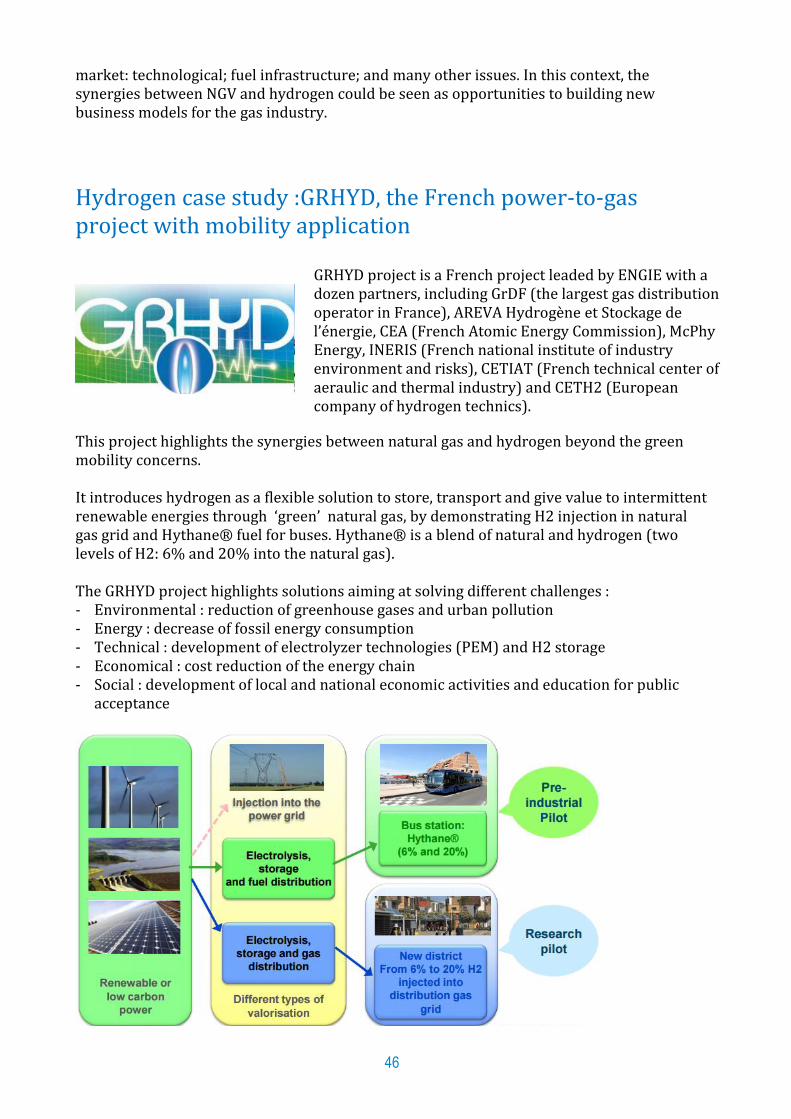
Hydrogen case study :GRHYD, the French power-to-gas project with mobility application
This project highlights the synergies between natural gas and hydrogen beyond the green mobility concerns. It introduces hydrogen as a flexible solution to store, transport and give value to intermittent renewable energies through ‘green’ natural gas, by demonstrating H2 injection in natural gas grid and Hythane® fuel for buses. Hythane® is a blend of natural and hydrogen (two levels of H2: 6% and 20% into the natural gas). The GRHYD project highlights solutions aiming at solving different challenges : - Environmental : reduction of greenhouse gases and urban pollution - Energy : decrease of fossil energy consumption - Technical : development of electrolyzer technologies (PEM) and H2 storage - Economical : cost reduction of the energy chain - Social : development of local and national economic activities and education for public
acceptance
GRHYD project is a French project leaded by ENGIE with a dozen partners, including GrDF (the largest gas distribution operator in France), AREVA Hydrogène et Stockage de l’énergie, CEA (French Atomic Energy Commission), McPhy Energy, INERIS (French national institute of industry environment and risks), CETIAT (French technical center of aeraulic and thermal industry) and CETH2 (European company of hydrogen technics).
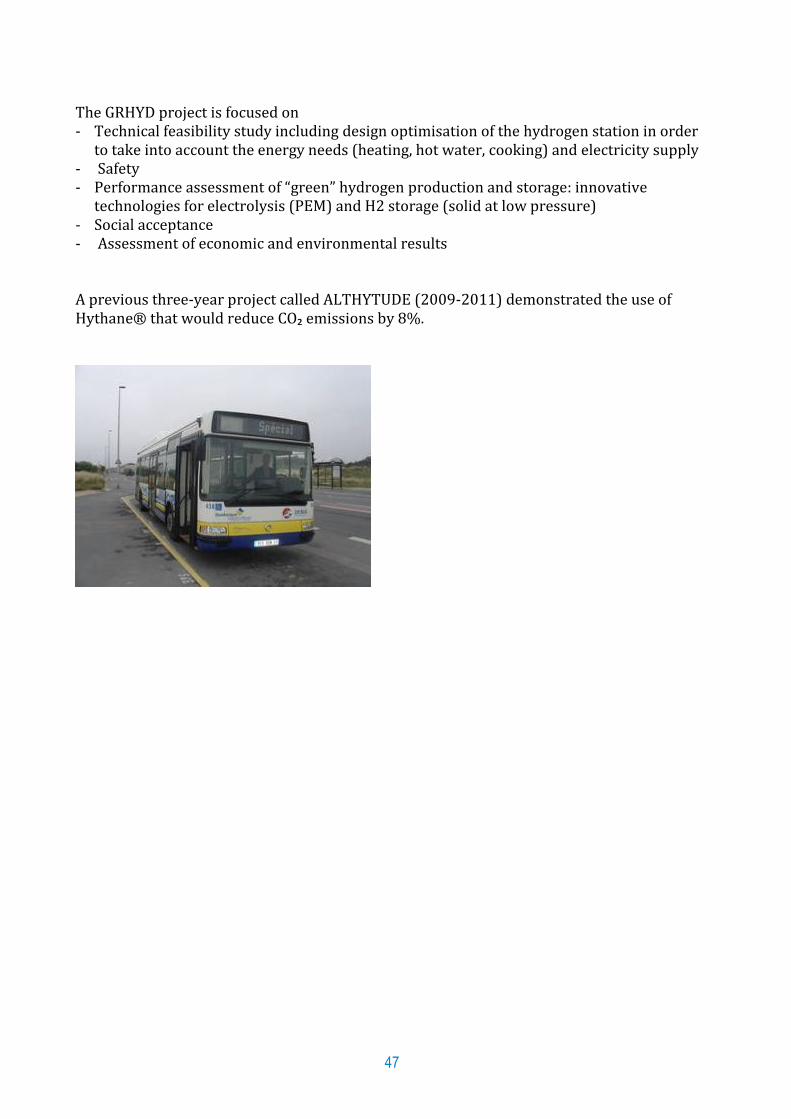
47
The GRHYD project is focused on - Technical feasibility study including design optimisation of the hydrogen station in order
to take into account the energy needs (heating, hot water, cooking) and electricity supply - Safety - Performance assessment of “green” hydrogen production and storage: innovative
technologies for electrolysis (PEM) and H2 storage (solid at low pressure) - Social acceptance - Assessment of economic and environmental results A previous three-year project called ALTHYTUDE (2009-2011) demonstrated the use of Hythane® that would reduce CO₂ emissions by 8%.

48
Appendix 1:NGV countries profiles

49
Algeria General
Country Name Job title Organization Date
ALGERIA Said AKRETCHE CHIEF EXECUTIVE OFFICER NAFTAL SPA September 7th, 2014
Phone Fax E-Mail
+213 21 38 19 18 +213 21 38 33 90 Said. AKRETCHE @naftal.dz
On-Road Vehicles
Total Cars/LDVs MD/HD Buses MD/HD Trucks
Others
Conventional vehicles
4 812 555 3 050 217 76 863 1 332 478 352 997
NGVs 125 120 05 0 0
CNG 125 120 05
LNG 0 0 0 0 0
Off-Road NGVs
Off-Road NGVs
Mining trucks Agricultural Rail road locomotives
Ships Other
0 0 0 0 0
Fuel Prices
Regular Gasoline,
€/l
Super gasoline,
€/l
Diesel, €/l LPG, €/l CNG, €/kg LNG, €/kg Biomethane, €/l
0.212 0.230 0.137 0.090 tbd / /
*:1Euro equivalent 100 DA
Conventional Filling Stations
Petrol Stations LPG Electric Other
2158 539 0 0
Types of NGV Filling Stations
Public Mother Daughter Mobile Private Slow Fill VRA
CNG 0 0 0 0 2 0
LNG 0 0 0 0 0 0
Market Statistics
Public 2010 2014 2020 2025 2030
Fleet of NGVs 125 125 48 000 109 000 197 000
Number of CNG filling stations 02 03 55 370 515
Number of LNG filling stations 0 0 2
Number of Ports with LNG bunkering 0 0 2
NG Demand / Sales 100 % 100 % 100 %

50
51
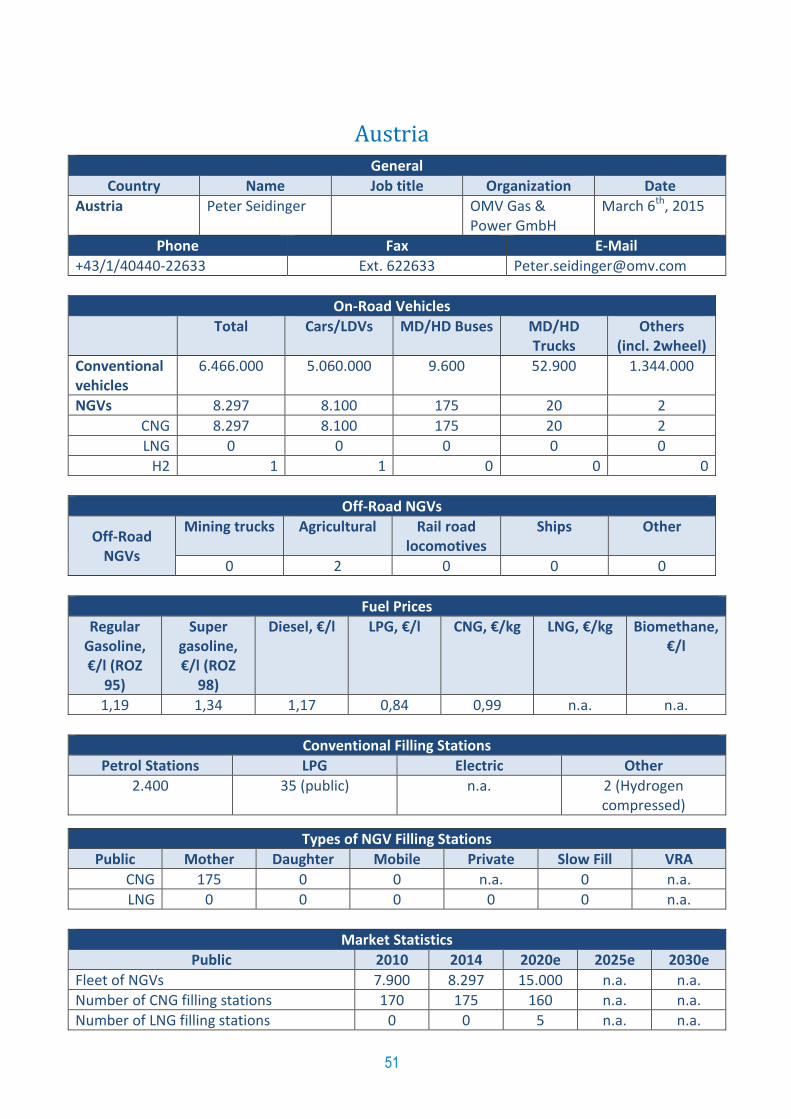
Austria General
Country Name Job title Organization Date
Austria Peter Seidinger OMV Gas & Power GmbH
March 6th, 2015
Phone Fax E-Mail
+43/1/40440-22633 Ext. 622633 [email protected]
On-Road Vehicles
Total Cars/LDVs MD/HD Buses MD/HD Trucks
Others (incl. 2wheel)
Conventional vehicles
6.466.000 5.060.000 9.600 52.900 1.344.000
NGVs 8.297 8.100 175 20 2
CNG 8.297 8.100 175 20 2
LNG 0 0 0 0 0
H2 1 1 0 0 0
Off-Road NGVs
Off-Road NGVs
Mining trucks Agricultural Rail road locomotives
Ships Other
0 2 0 0 0
Fuel Prices
Regular Gasoline, €/l (ROZ
95)
Super gasoline, €/l (ROZ
98)
Diesel, €/l LPG, €/l CNG, €/kg LNG, €/kg Biomethane, €/l
1,19 1,34 1,17 0,84 0,99 n.a. n.a.
Conventional Filling Stations
Petrol Stations LPG Electric Other
2.400 35 (public) n.a. 2 (Hydrogen compressed)
Types of NGV Filling Stations
Public Mother Daughter Mobile Private Slow Fill VRA
CNG 175 0 0 n.a. 0 n.a.
LNG 0 0 0 0 0 n.a.
Market Statistics
Public 2010 2014 2020e 2025e 2030e
Fleet of NGVs 7.900 8.297 15.000 n.a. n.a.
Number of CNG filling stations 170 175 160 n.a. n.a.
Number of LNG filling stations 0 0 5 n.a. n.a.

52
Number of Ports with LNG bunkering 0 0 0 0 0
NG Demand / Sales ( GWh/a ) 150 190 300 n.a. n.a.

53
Belgium General
Country Name Job title Organization Date
Belgium Gaetano Valicenti
Technical manager
NGVA EUROPE April 9th, 2014
Phone Fax E-Mail
+32 2 894 4829 [email protected]
On-Road Vehicles
Total Cars/LDVs MD/HD Buses MD/HD Trucks
Others
Conventional vehicles
6.983.847
NGVs 1.033 1.015 3 15
CNG
LNG
Off-Road NGVs
Off-Road NGVs
Mining trucks Agricultural Rail road locomotives
Ships Other
0 0 0 0 0
Fuel Prices
Regular Gasoline,
€/l
Super gasoline,
€/l
Diesel, €/l LPG, €/l CNG, €/kg LNG, €/kg Biomethane, €/l
1,592.60 1,402.50 0,89/1,05
Conventional Filling Stations
Petrol Stations LPG Electric Other
Types of NGV Filling Stations
Public Mother Daughter Mobile Private Slow Fill VRA
CNG 18
LNG 0
L-CNG 1
Market Statistics
Public 2010 2014 2020 2025 2030
Fleet of NGVs 566 1.033
Number of CNG filling stations 13 18
Number of LNG filling stations 0 0
Number of Ports with LNG bunkering 1 1

54
NG Demand / Sales
France General
Country Name Job title Organization Date
France Miriam Eklo Senior Project manager
GDF SUEZ September 13th, 2014
Phone Fax E-Mail
+33 6 67 04 29 30 [email protected]
On-Road Vehicles
Total Cars/LDVs MD/HD Buses MD/HD Trucks
Others
Conventional vehicles
32.558.700 25.400 471.700 354.500
NGVs
CNG 13. 300 10.000 2.400 900 0
LNG 0 0 0 0 0
Hythane 2 0 2 0 0
H2 0 0 0 0 0
Off-Road NGVs
Off-Road NGVs
Mining trucks Agricultural Rail road locomotives
Ships Other
No data available
No data available
No data available
No data available
No data available
Fuel Prices
Regular Gasoline,
€/l
Super gasoline,
€/l
Diesel, €/l LPG, €/l CNG, €/kg LNG, €/kg Biomethane, €/kg
n/a 1,5634 1,5078 0,6692 - n/a -
Conventional Filling Stations
Petrol Stations LPG Electric Other
12.000 1.700 3.400 -
Types of NGV Filling Stations
Public Mother Daughter Mobile Private Slow Fill VRA
CNG 300 0 0 260 -
LNG 0 0 0 0 0 0
Market Statistics

55
Public 2010 2014 2020 2025 2030
Fleet of NGVs
Number of CNG filling stations - 300 - - -
Number of LNG filling stations 0 0 0 0 0
Number of Ports with LNG bunkering 0 2 - - -
NG Demand / Sales (mcm, CNG+LNG) - - - - - Source : SOeS – Ministère de l’Ecologie, du développement durable et de l’Energie

56
Germany General
Country Name Job title Organization Date
Germany David Graebe Head of Gas for Transport
GAZPROM Germania
September 9th, 2014
Phone Fax E-Mail
+49-30-20195-123 +49-30-20195-583 [email protected]
On-Road Vehicles
Total Cars/LDVs MD/HD Buses MD/HD Trucks
Others
Conventional vehicles
43.900.000 76.794 4.710.972 272.877
NGVs
CNG 97.554 95.989 1.501 65 0
LNG 0 0 0 0 0
Off-Road NGVs
Off-Road NGVs
Mining trucks Agricultural Rail road locomotives
Ships Other
0 0 0 0 0
Fuel Prices
Regular Gasoline,
€/l
Super gasoline,
€/l
Diesel, €/l LPG, €/l CNG, €/kg LNG, €/kg Biomethane, €/kg
n/a 1,552 1,374 0,714 1,094 n/a 1,099
Conventional Filling Stations
Petrol Stations LPG Electric Other
14.622 6.696 1.180 15 (Hydrogen)
Types of NGV Filling Stations
Public Mother Daughter Mobile Private Slow Fill VRA
CNG 844 (public) 0 2 71 0 20
LNG 0 0 2 0 0 0
Market Statistics
Public 2010 2014 2020 2025 2030
Fleet of NGVs
Number of CNG filling stations 800 915 1.300 2.000 3.000
Number of LNG filling stations 0 0 20 100 410
Number of Ports with LNG bunkering 0 0 3 5 8

57
NG Demand / Sales (mcm, CNG+LNG) 150 225 1.000 1.900 4.000

58
Japan General
Country Name Job title Organization Date
Japan Naoko Fukutome Manager Tokyo Gas Co., Ltd. September the 1st ,2014
Phone Fax E-Mail
+81-3-5400-6772 +81-3-5400-7759 [email protected]
On-Road Vehicles
Total Cars/LDVs MD/HD Buses
MD/HD Trucks
Others
Conventional vehicles
76,090,000 59,357,000 226,000 14,696,000 1,655,000
NGVs 43,601 17,086 1,570 22,885 2,060
CNG 43,601 17,086 1,570 22,885 2,060
LNG 0 0 0 0 0
Off-Road NGVs
Off-Road NGVs
Mining trucks Agricultural Rail road locomotives
Ships Other
0 0 0 0 0
Fuel Prices
Regular Gasoline,
€/l
Super gasoline,
€/l
Diesel, €/l LPG, €/l CNG, €/kg LNG, €/kg Biomethane, €/l
164.1 JPY/l 1.18 €/l (as of 2014/Apr)
175.0 JPY/l 1.26 €/l (as of 2014/Apr)
142.6 JPY/l 1.03 €/l (as of 2014/Apr)
- -
Conventional Filling Stations
Petrol Stations LPG Electric Other
34,706 1,600
Types of NGV Filling Stations
Public Mother Daughter Mobile Private Slow Fill VRA
CNG 263 0 0 0 37 0 603
LNG 0 0 0 0 0 0 0
Market Statistics
Public 2010 2014 2020 2025 2030
Fleet of NGVs 40,429 44,600 116,000 310,000 493,000
Number of CNG filling stations 333 302 557 957 1,317
Number of LNG filling stations 0 0 0 0 0
Number of Ports with LNG bunkering 0 0 0 0 0

59
NG Demand / Sales [million m3] - 100 920 1,924 2,725 * At present, there are no LNG vehicles and filling stations in Japan; however, there is a possibility we maybe will plan to introduce and spread LNG vehicles and stations.
Russia General
Country Name Job title Organization Date
Russia Stanislav Urzhumtsev
Head of International Business Development
Gazprom gas-engine fuel
Phone Fax E-Mail
+7 812 455 02 07 [email protected]
On-Road Vehicles
Total Cars/LDVs MD/HD Buses MD/HD Trucks
Others
Conventional vehicles
48 992 563 44 782 575 399 354 3 810 634
NGVs 110 000 105 044 3 182 2 774
CNG 110 997 105 044 3 181 2 772
LNG 3 0 1 2
Off-Road NGVs
Off-Road NGVs
Mining trucks Agricultural Rail road locomotives
Ships Other
0 250 1 0 0
Fuel Prices
Regular Gasoline,
€/l
Super gasoline,
€/l
Diesel, €/l LPG, €/l CNG, €/kg LNG, €/kg Biomethane, €/kg
0,71 0,64 0,32 0,18
Conventional Filling Stations
Petrol Stations LPG Electric Other
Types of NGV Filling Stations
Public Mother Daughter Mobile Private Slow Fill VRA
CNG 253 18
LNG
Market Statistics
Public 2010 2014 2020 2025 2030
Fleet of NGVs 110 000
Number of CNG filling stations 271
Number of LNG filling stations 1

60
Number of Ports with LNG bunkering 0
NG Demand / Sales (mcm, CNG+LNG) 36 Mcm/month
Source : Gazprom gas-engine fuel LLC

61
South Korea General
Country Name Job title Organization Date
South Korea JeongOk Han Manager KOGAS October 13th , 2014
Phone Fax E-Mail
82-31-400-7531 82-31-406-1495 [email protected]
On-Road Vehicles
Total Cars/LDVs MD/HD Buses MD/HD Trucks
Others
Conventional vehicles
19,858,805 15,529,561 926,666 3,334,083 68495
NGVs 40,449 8,183 31,012 1,251 3
CNG 40,443 8,183 31,006 1,251 3
LNG 6 0 6 0 0
Source : Ministry of Transportation , As of Aug 2014
Off-Road NGVs
Off-Road NGVs
Mining trucks Agricultural Rail road locomotives
Ships Other
1
Fuel Prices
Regular Gasoline,
€/l
Super gasoline,
€/l
Diesel, €/l LPG, €/l CNG, €/㎥ LNG, €/㎥ Biomethane, €/kg
1.26 1.45 1.21 0.76 0.80 0.79
Source 1. KNOT(Korea National Oil Corporation) www.petronet.co.kr 2. KOGAS(Korea Gas Corporation)
Conventional Filling Stations
Petrol Stations LPG Electric Other
11,342 1,749
Source : Korea Association of Natural Gas Vehicles
Types of NGV Filling Stations
Public Mother Daughter Mobile Private Slow Fill VRA
CNG - 188 4 - - -
LNG - 3 - - - -
Source : Korea Association of Natural Gas Vehicles
Market Statistics
Public 2010 2014 2020 2025 2030
Fleet of NGVs(unit) 28,720 40,449
Number of CNG filling stations 170 197
Number of LNG filling stations 1 3
Number of Ports with LNG bunkering 0 0

62
NG Demand / Sales(M m3) 1,276 82,304
Source : Korea City Gas Association

63
Appendix 2: NGVA Europe statistics for Europe

64
NGVs and refuelling stations in Europe
L-CNG
stations
LNG
stationsAll stations
Total
NGVs
LD+MD
+HD
Vehicles
LD VehiclesMD+HD
Buses
MD+HD
TrucksOther
% of total
LD+MD+HD
vehicles in the
country
% of total
NGVs in the
area
Month Year Total Public Private Planned
% of total CNG
stations in the
area
Total Total Total Total population
EU countries
Austria 9 530 9 300 175 20 35 0 0,19% 0,81% May 2015 180 175 5 0 5,5% 0 0 180 0 5139700
Belgium 1 754 1 725 3 26 0 0,03% 0,15% May 2015 25 25 0 25 0,8% 1 1 27 17 6685523
Bulgaria 61 917 61 917 61 500 360 57 0 1,54% 5,24% May 2015 112 109 3 4 3,4% 0 0 112 0 4011357
Croatia 284 284 203 78 3 0 0,02% 0,02% May 2015 3 2 1 1 0,1% 0 0 3 0 1625470
Czech Republic 9 308 8 625 8 625 0 91 0 0,18% 0,79% May 2015 113 85 28 25 3,4% 0 0 113 123 5070000
Denmark 125 125 81 26 18 0 0,00% 0,01% May 2015 7 7 0 3 0,2% 0 0 7 0 2770809
Estonia 350 350 300 30 10 0 0,05% 0,03% May 2015 5 5 0 0 0,2% 0 0 5 1 705199
Finland 1 900 1 900 1 850 30 20 0 0,05% 0,16% May 2015 27 24 3 0 0,8% 0 1 28 10 3726618
France 13 450 13 450 10 150 2 400 900 0 0,36% 1,14% May 2015 310 40 270 0 9,4% 0 0 310 200 3694888
Germany 99 281 99 281 97 491 1 617 173 0 0,20% 8,41% May 2015 921 851 70 0 27,9% 0 0 921 0 49293117
Greece 1 000 1 000 800 100 100 0 0,02% 0,08% May 2015 7 7 0 7 0,2% 0 0 7 0 6552872
Hungary 6 181 6 181 6 000 96 85 0 0,17% 0,52% May 2015 20 5 15 16 0,6% 0 0 20 1 500 3555796
Ireland 0 0 0 0 0 0 0,00% 0,00% May 2015 0 0 0 9 0,0% 0 0 0 3 2208056
Italy 903 500 903 500 900 000 3 000 500 0 2,19% 76,49% May 2015 1 110 1 060 50 115 33,7% 11 1 1 122 100 41259611
Latvia 30 30 30 0 0 0 0,00% 0,00% May 2015 2 2 0 0 0,1% 0 0 2 1 1061540
Lithuania 322 322 80 241 1 0 0,02% 0,03% May 2015 9 3 6 0 0,3% 0 0 9 5 1964624
Luxembourg 306 306 266 39 1 0 0,07% 0,03% May 2015 7 6 1 2 0,2% 0 0 7 0 408437
Netherlands 10 847 10 847 9 737 680 430 0 0,12% 0,92% May 2015 144 137 7 25 4,4% 0 8 152 558 8822445
Poland 3 510 3 510 3 050 400 60 0 0,02% 0,30% May 2015 24 24 0 1 0,7% 0 0 24 40 22823475
Portugal 528 503 45 360 98 0 0,01% 0,04% May 2015 5 5 0 3 0,2% 2 0 7 0 6942050
Slovakia 1 500 1 500 1 170 260 70 0 0,07% 0,13% May 2015 14 10 4 0 0,4% 0 0 14 20 2177981
Slovenia 163 163 108 50 5 0 0,01% 0,01% May 2015 8 3 5 1 0,2% 0 0 8 5 1173757
Spain 4 590 4 416 300 1 728 2 388 174 0,01% 0,39% March 2015 25 19 6 8 0,8% 17 0 42 0 39465000
Sweden 50 102 50 102 46 975 2 315 812 0 0,97% 4,24% May 2015 218 155 63 0 6,6% 6 0 224 21 5176899
United Kingdom 698 698 20 40 638 0 0,00% 0,06% May 2015 0 0 0 0 0,0% 9 0 9 10 36489873
Total 1 181 176 1 180 035 1 148 956 13 873 6 521 174 6,31% 100,00% 3 296 2 759 537 245 100,0% 46 11 3 353 2 614 262 805 097
EFTA countries
Iceland 1 595 1 595 1 521 12 62 0 0,64% 0,14% May 2015 6 5 1 1 0,2% 0 0 6 1 250511
Lichtenstein
Norway 745 745 130 610 5 0 0,02% 0,06% May 2015 10 7 3 4 0,3% 0 0 10 0 3025699
Switzerland 11 914 11 914 11 606 174 134 0 0,25% 1,01% May 2015 141 136 5 4 4,3% 1 0 142 0 4829207
Total 13 821 13 760 12 816 777 167 61 0,91% 100,00% 165 156 9 5 100,0% 6 7 178 1 8 105 417
Other European countries
Armenia 244 000 244 000 192 000 17 300 34 700 0 55,45% 20,66% December 2011 345 345 0 0 10,5% 0 0 345 0 440000
Belarus 4 600 4 600 4 600 0 0 0 0,14% 0,39% September 2011 42 42 0 0 1,3% 0 0 42 0 3276329
Bosnia & Herzegovina 35 35 34 1 0 0 0,00% 0,00% May 2015 2 0 2 0 0,1% 0 0 2 2 921643
Georgia 3 000 3 000 3 000 0 0 0 0,53% 0,25% May 2008 50 50 0 0 1,5% 0 0 50 0 566719
Macedonia 54 54 7 47 0 0 0,02% 0,00% January 2011 1 0 1 3 0,0% 0 0 1 0 325304
Moldova 2 200 2 200 2 200 0 0 0 0,42% 0,19% September 2011 24 24 0 0 0,7% 0 0 24 0 528240
Russia 111 000 111 000 105 044 3 182 2 774 0 0,23% 9,40% May 2015 271 253 18 600 8,2% 0 0 271 4 48992563
Serbia 878 878 792 58 28 0 0,04% 0,07% June 2014 10 8 2 2 0,3% 0 0 10 3 1987456
Turkey 4 100 4 100 1 000 3 000 100 0 0,03% 0,35% May 2015 20 10 10 15 0,6% 0 0 20 0 14406247
Ukraine 388 000 387 391 19 400 232 788 135 793 19 5,13% 32,85% May 2012 324 132 192 40 9,8% 0 0 324 8 7558470
Total 757 867 757 258 328 077 256 376 173 395 19 62% 100,00% 1 089 864 225 660 100,0% 0 0 1 089 17 79 002 971
All European NGV countries 1 952 864 1 951 053 1 489 849 271 026 180 083 254 69% 100,00% 4 550 3 779 771 910 100,0% 52 18 4 620 2 632 349 913 485
* LD (Light Duty), MD (Medium Duty), HD (Heavy Duty) **VRA (small Vehicle Refuelling Appliance)
All data shown on this work sheet are the result of work conducted by NGVA Europe and the GVR. The data may not be manipulated and redistributed while maintaining the logos of NGVA Europe
and the GVR. When using data for various summaries or graphs it would, however, be appreciated if you state that the information presented is based on data supplied via NGVA Europe and the GVR.
Country
Total NGV population (other than ships, trains and aircraft) Date CNG stations
VRA **
Figure 33: 2015 NGVA Europe statistics for Europe

65