WMO/ITU Seminar Use of Radio Spectrum for … · PALSAR ERS-1/2 JERS-1/2 ALMAZ ASAR TerraSAR-L/X...
27
WMO/ITU Seminar Use of Radio Spectrum for Meteorology Earth Exploration Earth Exploration - - Satellite Service Satellite Service (EESS) (EESS) - - Active Spaceborne Remote Active Spaceborne Remote Sensing and Operations Sensing and Operations Bryan Huneycutt (USA) Charles Wende (USA) WMO, Geneva, Switzerland 16-18 September 2009 SRTM Seawinds TRMM Cloudsat JASON Radarsat
Transcript of WMO/ITU Seminar Use of Radio Spectrum for … · PALSAR ERS-1/2 JERS-1/2 ALMAZ ASAR TerraSAR-L/X...

WMO/ITU Seminar Use of Radio Spectrum for Meteorology Earth ExplorationEarth Exploration--Satellite Service Satellite Service
(EESS)(EESS)-- Active Spaceborne Remote Active Spaceborne Remote Sensing and OperationsSensing and Operations
Bryan Huneycutt (USA) Charles Wende (USA)
WMO, Geneva, Switzerland16-18 September 2009
SRTM
Seawinds TRMM CloudsatJASONRadarsat
WMO/ITU Seminar Use of Radio Spectrum for Meteorology Active Sensor DefinitionActive Sensor Definition
Active Sensor:
an instrument which obtains information by the transmission and reception of radio waves.

WMO/ITU Seminar Use of Radio Spectrum for Meteorology Active Sensor TypesActive Sensor Types
• SYNTHETIC APERTURE RADARS – Cross-track looking sensors (one side only) which collect phase and delay time of coherent radar echoes; typical products include radar images and topographical maps of the Earth's surface.
• ALTIMETERS – Downward looking sensors measuring the precise echo delay time to extract the precise altitude of the ocean's surface.
• SCATTEROMETERS - Sensors looking at various aspects to the sides of the nadir track, measuring the return echo power variation with aspect angle to determine wind direction and speed on the ocean surface or return echo on the land surface.
• PRECIPITATION RADARS – Cross-track looking sensors measuring the radar echo returned from rainfall to determine the rainfall rate.
• CLOUD PROFILE RADARS – Downward-looking sensors measuring the radar echo returned from clouds to determine cloud reflectivity profile.
WMO/ITU Seminar Use of Radio Spectrum for Meteorology Active Sensor TypesActive Sensor Types
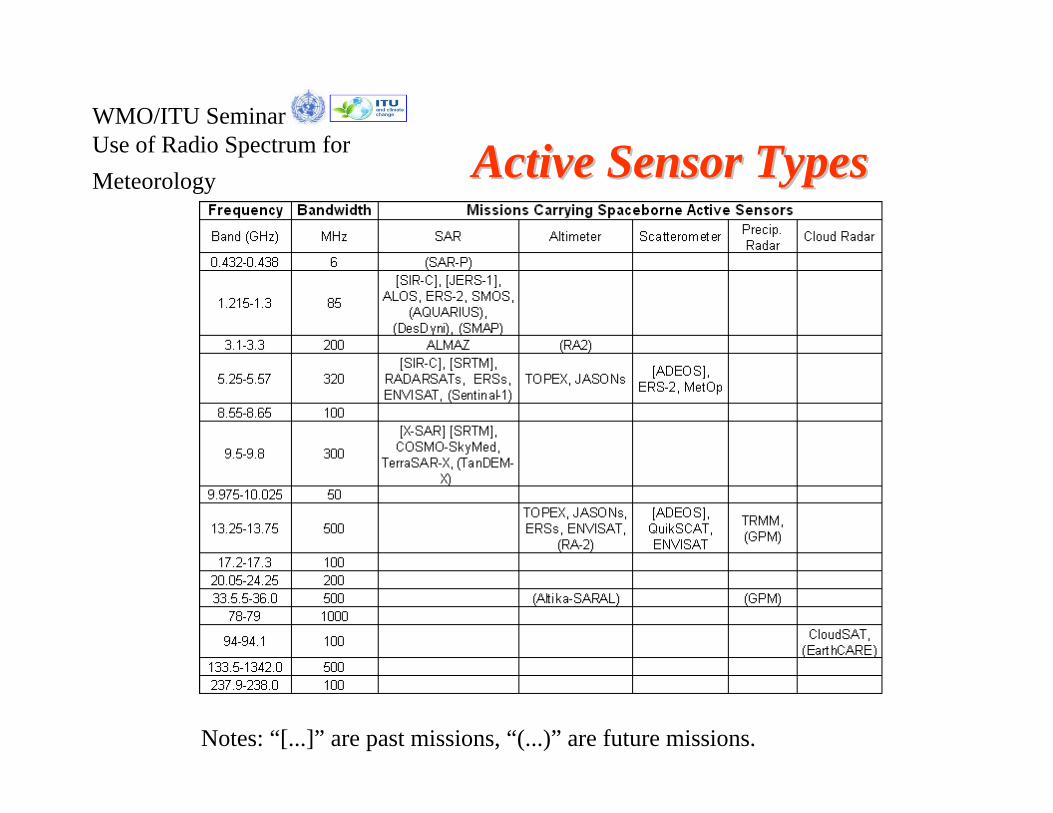
Notes: “[...]” are past missions, “(...)” are future missions.

WMO/ITU Seminar Use of Radio Spectrum for Meteorology
Synthetic Aperture Radars Synthetic Aperture Radars (SARs)(SARs)
• Provide radar images and by combining 2 images:- from different orbits →topographical maps of the Earth’s surface, or- taken at different times →maps indicating ground movement ~ centimeters
(Interferometric SAR, or InSAR)
• RF center frequency depends on the Earth’s interaction with the EM field- lower frequencies (< 2 GHz) penetrate vegetation and reflect off the ground- higher frequencies reflect off water (rain, vegetation, etc.)
• RF bandwidth affects the resolution of the image pixels
• Allowable image pixel quality degradation determines allowable interference level
WMO/ITU Seminar Use of Radio Spectrum for Meteorology
SARs (cont.)SARs (cont.)
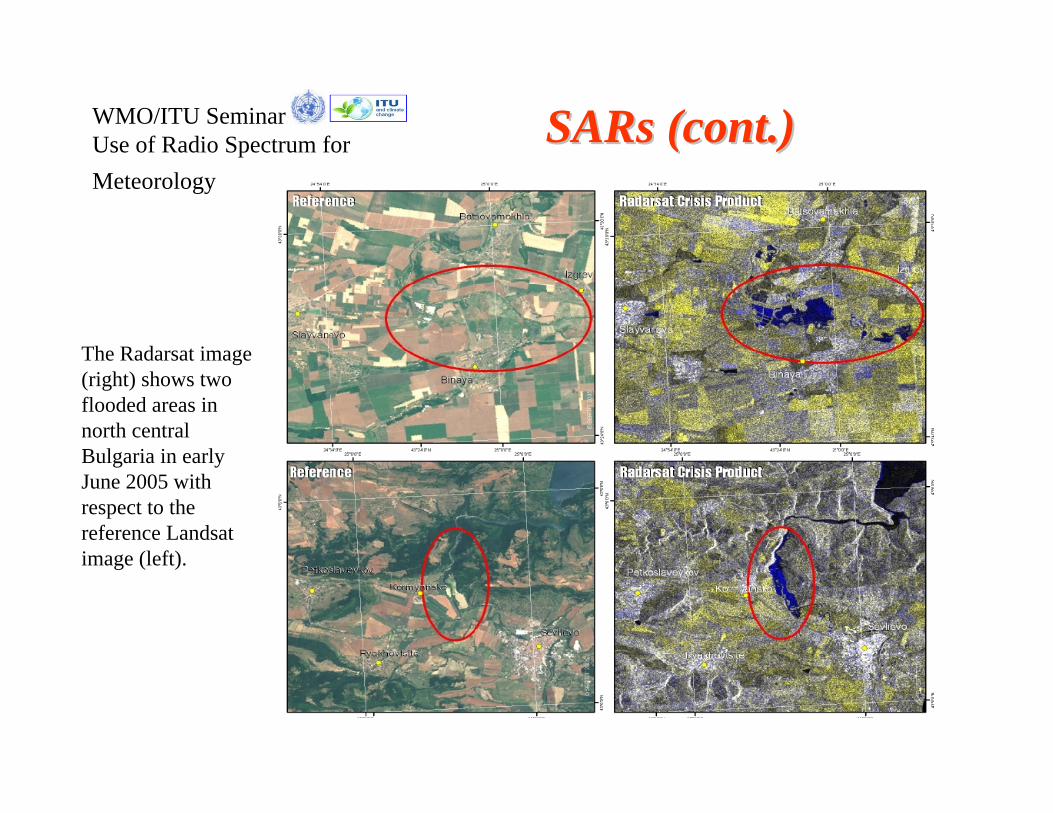
The Radarsat image (right) shows two flooded areas in north central Bulgaria in early June 2005 with respect to the reference Landsat image (left).
WMO/ITU Seminar Use of Radio Spectrum for Meteorology
SARs (cont.)SARs (cont.)
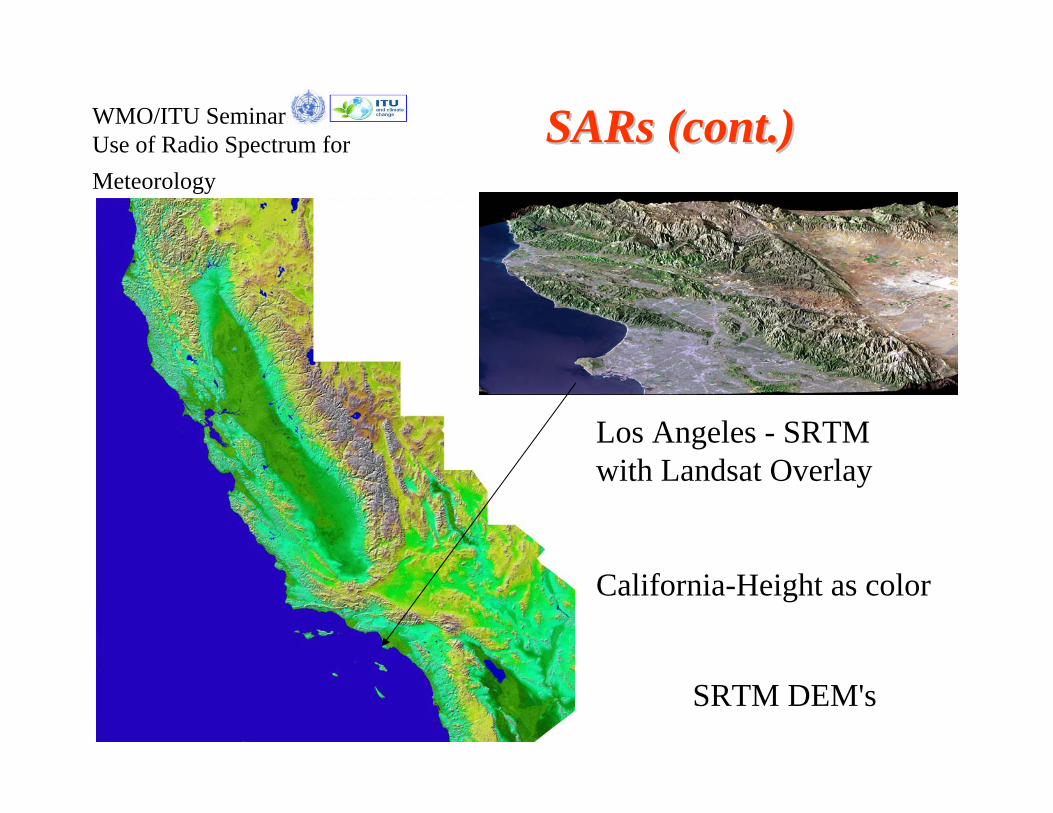
Los Angeles - SRTMwith Landsat Overlay
California-Height as color
SRTM DEM's

WMO/ITU Seminar Use of Radio Spectrum for Meteorology
SARs (cont.)SARs (cont.)
InSAR Image of the MaunaLoa Caldera in Hawaii
Ground motion indicatesDangerous undergroundvolcanic activity

WMO/ITU Seminar Use of Radio Spectrum for Meteorology
SARs (cont.)SARs (cont.)
RADARSAT-1 viewingIce off NewfoundlandAnd Labrador, Canada

WMO/ITU Seminar Use of Radio Spectrum for Meteorology AltimetersAltimeters
(a)
(b)
(c)
(d) tr td
t
t
t t
t2t1
• Provide altitude of the Earth’s ocean surface
• RF center frequency depends on the ocean surface interaction with the EM field
• Dual frequency operation allows ionospheric delay compensation
• JASON-1 uses frequencies around 13.6 GHz and 5.3 GHz
• Allowable height accuracy degradation determines the allowable interference level Illustration of Altimeter Return
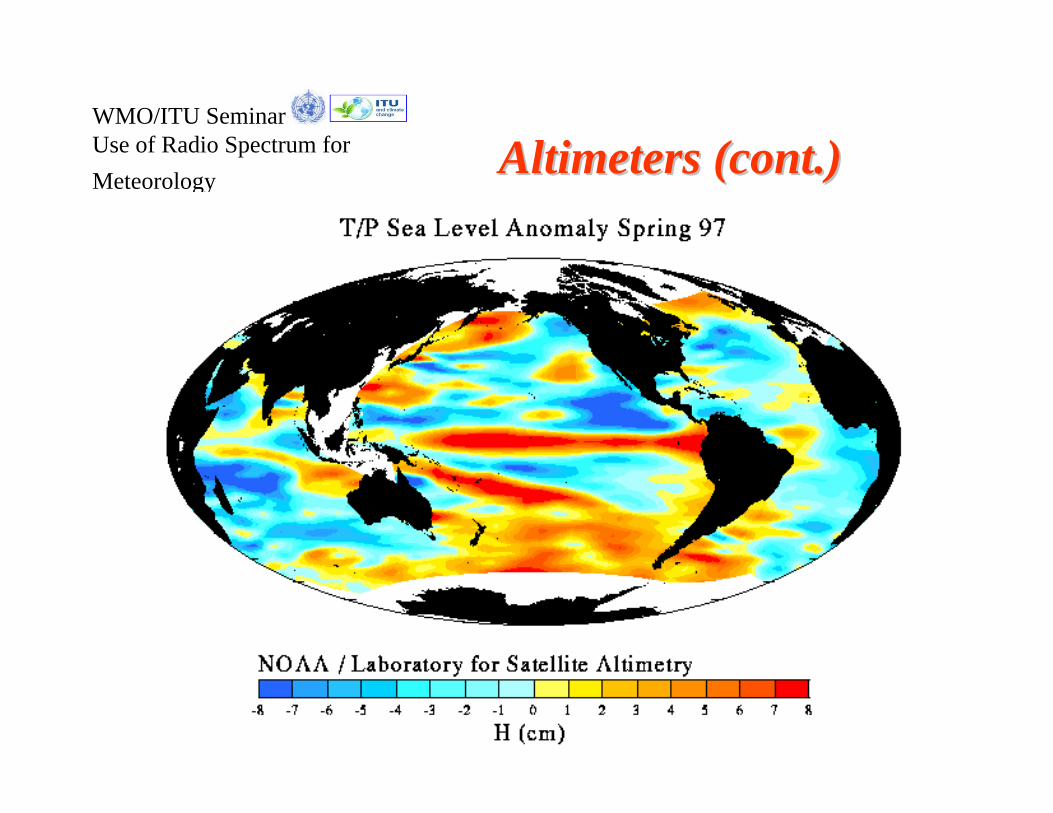
WMO/ITU Seminar Use of Radio Spectrum for Meteorology Altimeters (cont.)Altimeters (cont.)
WMO/ITU Seminar Use of Radio Spectrum for Meteorology
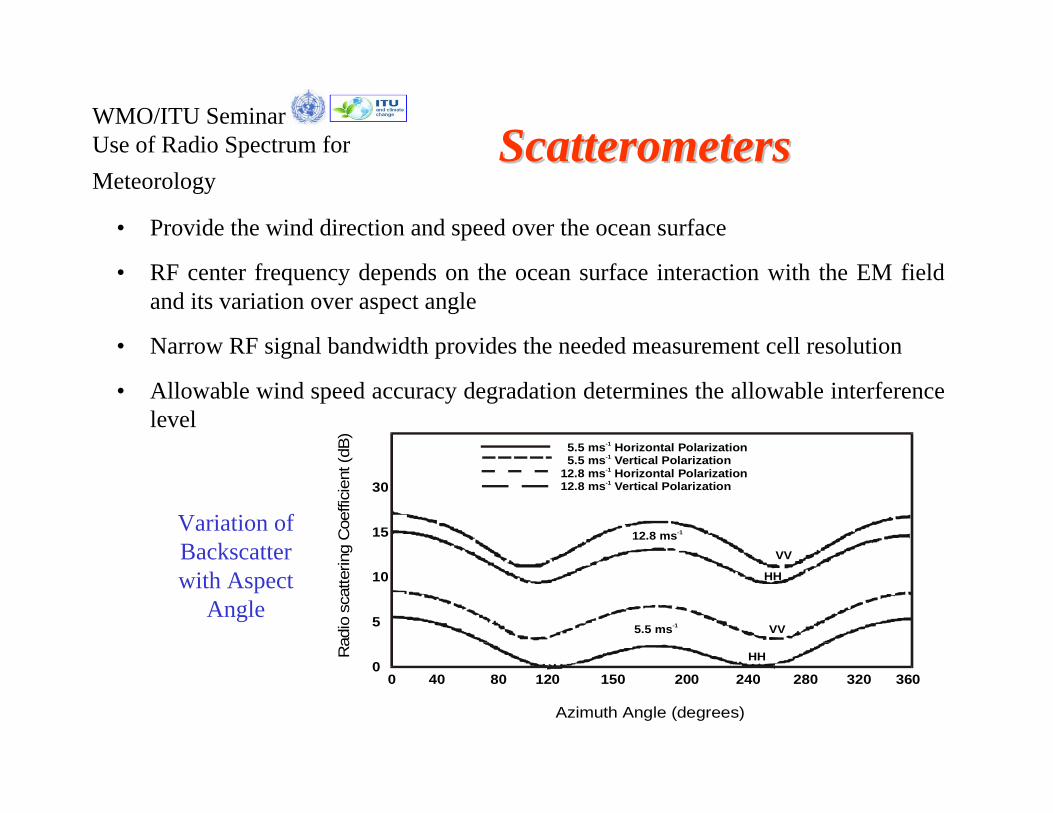
ScatterometersScatterometers• Provide the wind direction and speed over the ocean surface
• RF center frequency depends on the ocean surface interaction with the EM field and its variation over aspect angle
• Narrow RF signal bandwidth provides the needed measurement cell resolution
• Allowable wind speed accuracy degradation determines the allowable interference level
0 40 80 120 150 200 240 280 320 360
30
15
10
5
0
5.5 ms Horizontal Polarization 5.5 ms Vertical Polarization12.8 ms Horizontal Polarization12.8 ms Vertical Polarization
-1
-1
-1
-1
12.8 ms-1
5.5 ms-1
HH
HH
VV
VV
Azimuth Angle (degrees)
Rad
io s
catte
ring
Coe
ffici
ent (
dB)
Variation of Backscatter with Aspect
Angle

WMO/ITU Seminar Use of Radio Spectrum for Meteorology
Ocean scatterometersOcean scatterometersSub-Satellite
Track
Sub-SatellitePoint
MonitorCells
175km
175km
600 km 600 km
Left Wind VectorSwath
Right Wind VectorSwath
-45o
-65o
-135o
135o
115o
45o
Sea WindsOrbit Track
800 km
Nadir Track
Cross Track
250 to 800 km Swath*
900 km
700 km
Nadir
46 Degree Beam
40 deg
NSCAT illuminated the Earth’s surface at several different fixed aspect angles
SEAWINDS scanning pencil beam illuminates scans at two different look angles from nadir, and scans 360 degrees about nadir in azimuth
WMO/ITU Seminar Use of Radio Spectrum for Meteorology
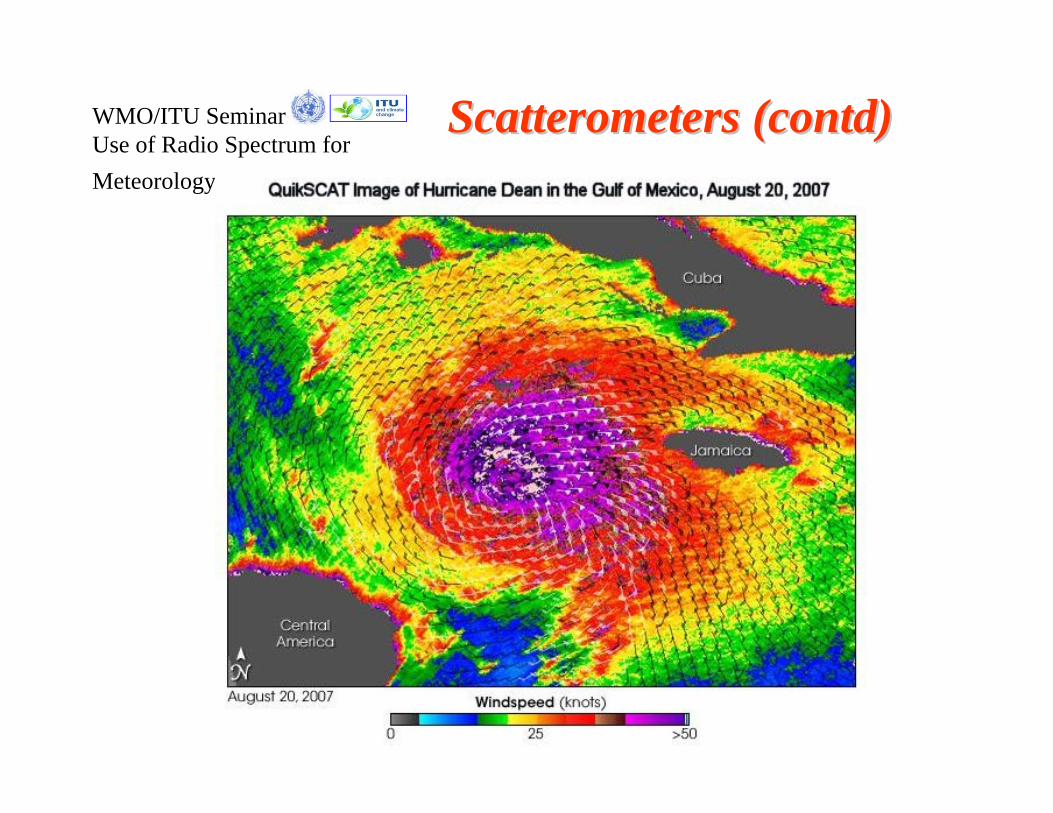
Scatterometers (contd)Scatterometers (contd)
WMO/ITU Seminar Use of Radio Spectrum for Meteorology
Scatterometers (cont.)Scatterometers (cont.)
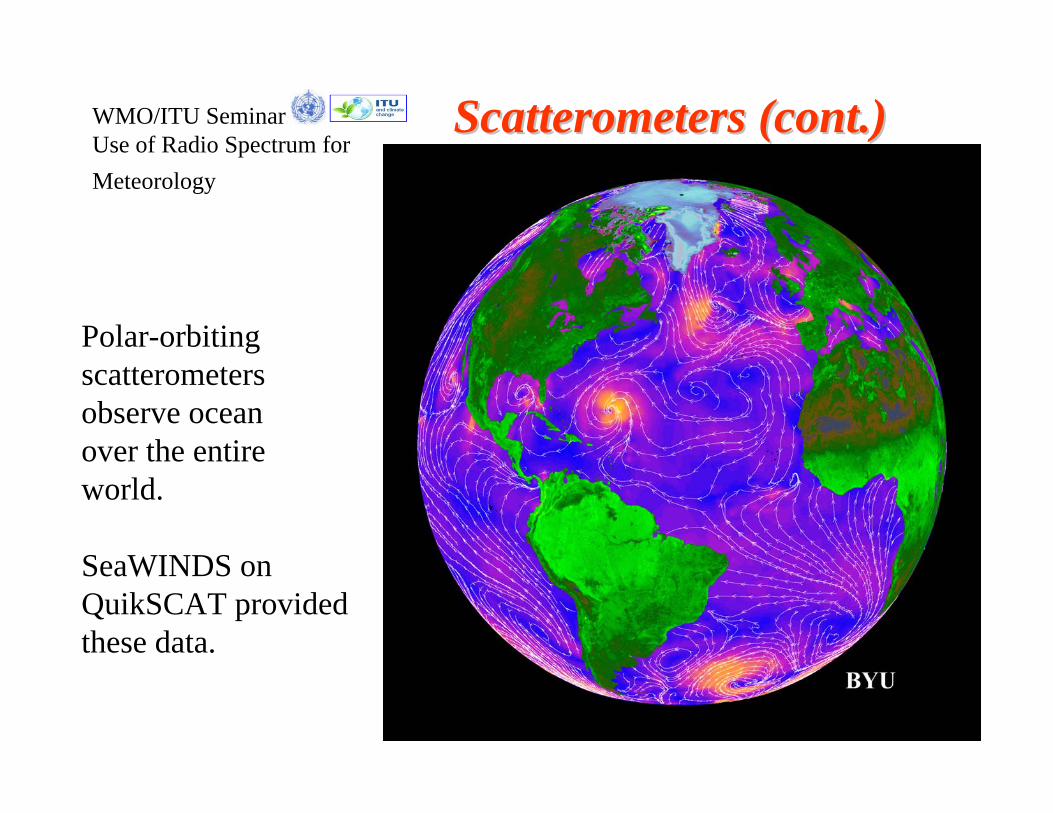
Polar-orbiting scatterometersobserve oceanover the entireworld.
SeaWINDS on QuikSCAT provided these data.

WMO/ITU Seminar Use of Radio Spectrum for Meteorology
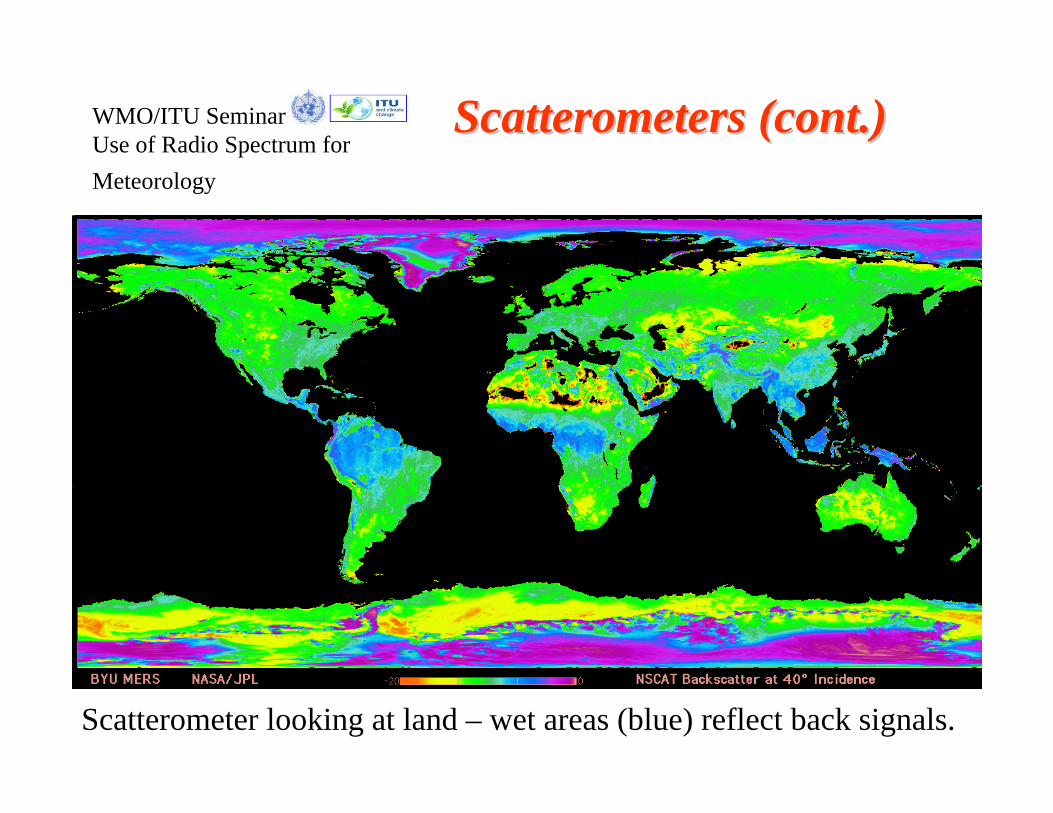
Land scatterometersLand scatterometers
Aquarius scatterometer will illuminate the Earth’s surface at several different fixed aspect/nadir angle combinations
SMAP scatterometer scanning pencil beam illuminates scans at fixed look angle from nadir, and scans 360 degrees about nadir in azimuth
WMO/ITU Seminar Use of Radio Spectrum for Meteorology
Scatterometers (cont.)Scatterometers (cont.)
Scatterometer looking at land – wet areas (blue) reflect back signals.
WMO/ITU Seminar Use of Radio Spectrum for Meteorology
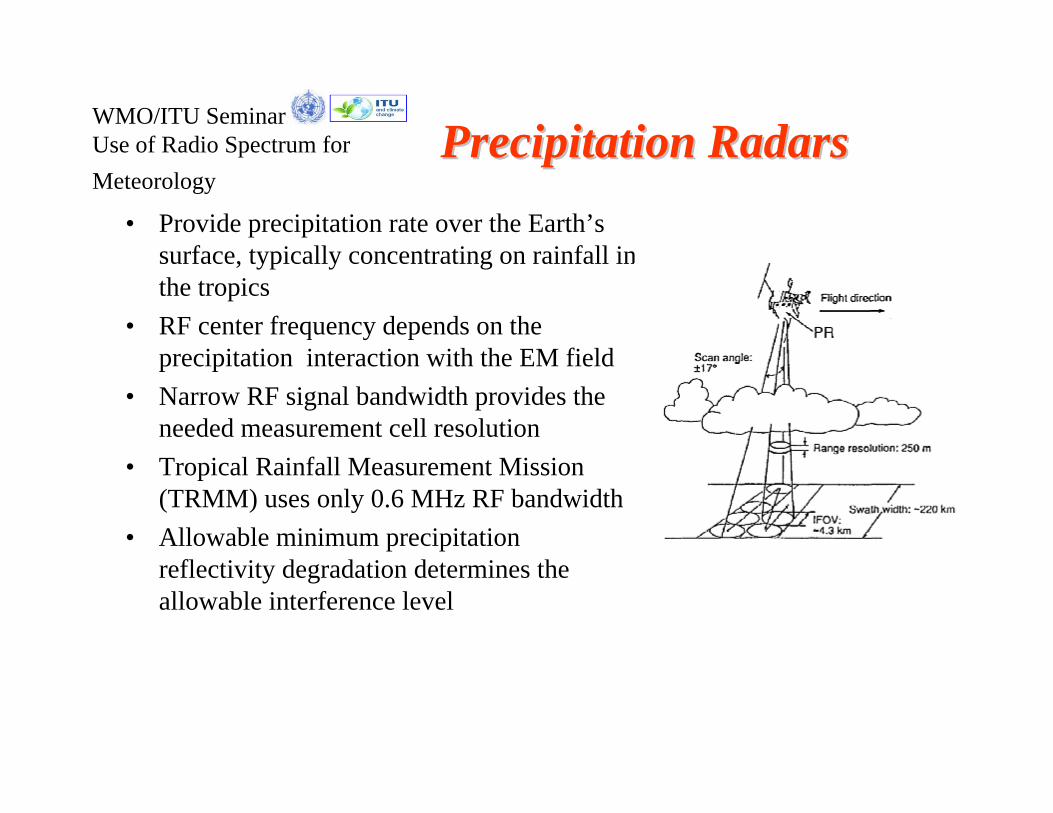
Precipitation RadarsPrecipitation Radars• Provide precipitation rate over the Earth’s
surface, typically concentrating on rainfall in the tropics
• RF center frequency depends on the precipitation interaction with the EM field
• Narrow RF signal bandwidth provides the needed measurement cell resolution
• Tropical Rainfall Measurement Mission (TRMM) uses only 0.6 MHz RF bandwidth
• Allowable minimum precipitation reflectivity degradation determines the allowable interference level

WMO/ITU Seminar Use of Radio Spectrum for Meteorology
Precip. RadarsPrecip. Radars (cont.)(cont.)
The TRMM image shows the precipitation profile of the hurricane Ernesto on 26 August, 2006, revealing several deep convective towers (shown in red) that top out over 15km.

WMO/ITU Seminar Use of Radio Spectrum for Meteorology
Cloud Profile RadarsCloud Profile Radars• Provide three dimension profile of cloud
reflectivity over the Earth’s surface• RF center frequency depends on the ocean
surface interaction with the EM field and its variation over aspect angle
• Antennas with very low sidelobes so as to isolate the cloud return from the higher surface return illuminated by the sidelobes
• Narrow RF signal bandwidth provides the needed measurement cell resolution
• Allowable reflectivity accuracy degradation determines the allowable interference level

WMO/ITU Seminar Use of Radio Spectrum for Meteorology
Cloud Profilers (cont.)Cloud Profilers (cont.)
NOAA’s GOES (top) showed Hurricane Ileana on Aug 23, 2006.
CloudSat's Cloud Profiling Radar produced profiles of Ileana's clouds (bottom).
WMO/ITU Seminar Use of Radio Spectrum for Meteorology
You have seen a variety of data products
today's instruments can produce.
Many* are available in a timely manner.
Use them to your country's advantage.
* some instruments are being demonstrated and are not in operational use.
WMO/ITU Seminar Use of Radio Spectrum for Meteorology
And you can help -
Remind your administration that these useful
instruments operate in allocated frequency bands
and are given protection from interference.
WMO/ITU Seminar Use of Radio Spectrum for Meteorology
ANNEX
Additional details about the technques
WMO/ITU Seminar Use of Radio Spectrum for Meteorology
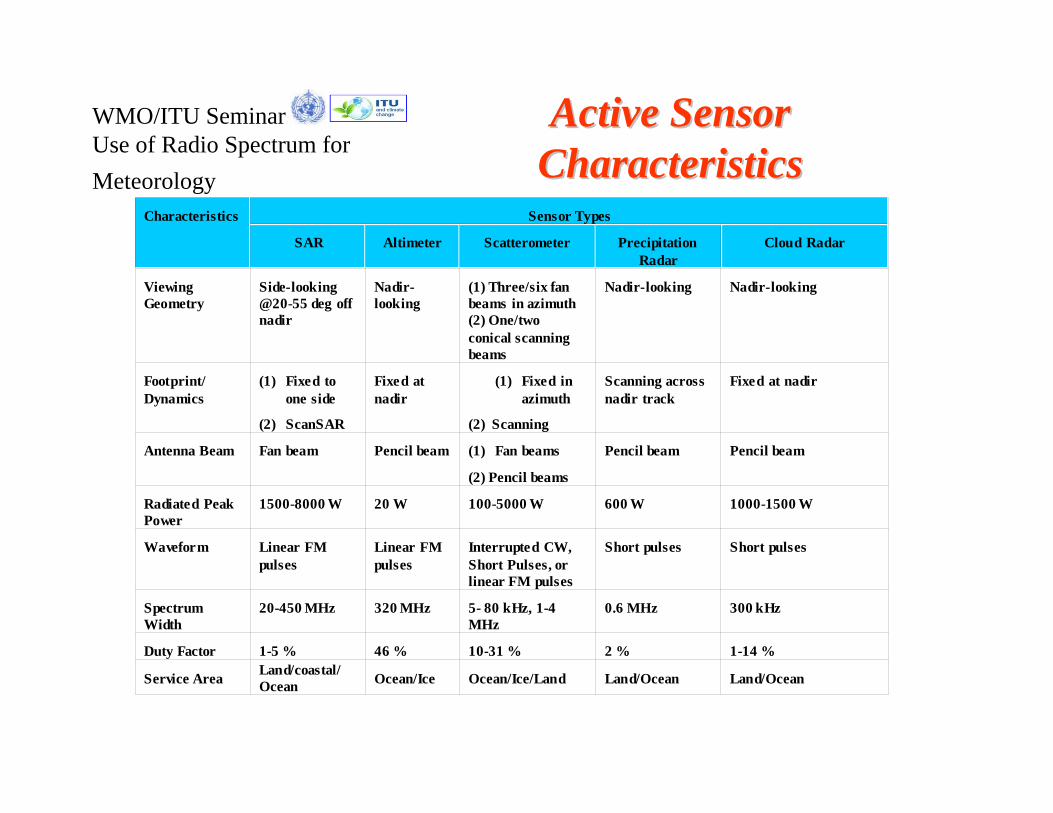
Active Sensor Active Sensor CharacteristicsCharacteristics
Characteristics Sensor Types
SAR Altimeter Scatterometer PrecipitationRadar
Cloud Radar
ViewingGeometry
Side-looking@20-55 deg offnadir
Nadir-looking
(1) Three/six fanbeams in azimuth(2) One/twoconical scanningbeams
Nadir-looking Nadir-looking
Footprint/Dynamics
(1) Fixed toone side
(2) ScanSAR
Fixed atnadir
(1) Fixed inazimuth
(2) Scanning
Scanning acrossnadir track
Fixed at nadir
Antenna Beam Fan beam Pencil beam (1) Fan beams
(2) Pencil beams
Pencil beam Pencil beam
Radiated PeakPower
1500-8000 W 20 W 100-5000 W 600 W 1000-1500 W
Waveform Linear FMpulses
Linear FMpulses
Interrupted CW,Short Pulses, orlinear FM pulses
Short pulses Short pulses
SpectrumWidth
20-450 MHz 320 MHz 5- 80 kHz, 1-4MHz
0.6 MHz 300 kHz
Duty Factor 1-5 % 46 % 10-31 % 2 % 1-14 %
Service Area Land/coastal/Ocean Ocean/Ice Ocean/Ice/Land Land/Ocean Land/Ocean
WMO/ITU Seminar Use of Radio Spectrum for Meteorology
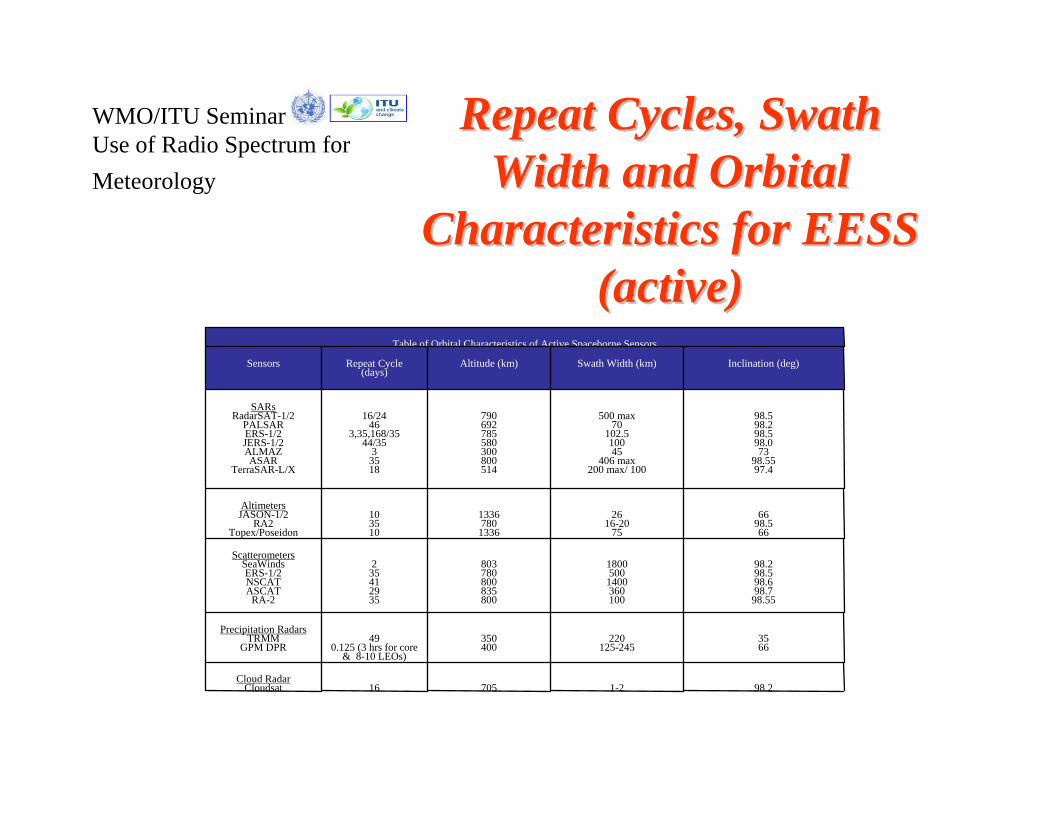
Repeat Cycles, Swath Repeat Cycles, Swath Width and Orbital Width and Orbital
Characteristics for EESS Characteristics for EESS (active)(active)
Table of Orbital Characteristics of Active Spaceborne Sensors
Sensors Repeat Cycle(days)
Altitude (km) Swath Width (km) Inclination (deg)
SARsRadarSAT-1/2
PALSARERS-1/2JERS-1/2ALMAZASAR
TerraSAR-L/X
16/2446
3,35,168/3544/35
33518
790692785580300800514
500 max70
102.510045
406 max200 max/ 100
98.598.298.598.073
98.5597.4
AltimetersJASON-1/2
RA2Topex/Poseidon
103510
13367801336
2616-20
75
6698.566
ScatterometersSeaWindsERS-1/2NSCATASCAT
RA-2
235412935
803780800835800
18005001400360100
98.298.598.698.798.55
Precipitation RadarsTRMM
GPM DPR49
0.125 (3 hrs for core & 8-10 LEOs)
350400
220125-245
3566
Cloud RadarCloudsat 16 705 1-2 98.2
WMO/ITU Seminar Use of Radio Spectrum for Meteorology
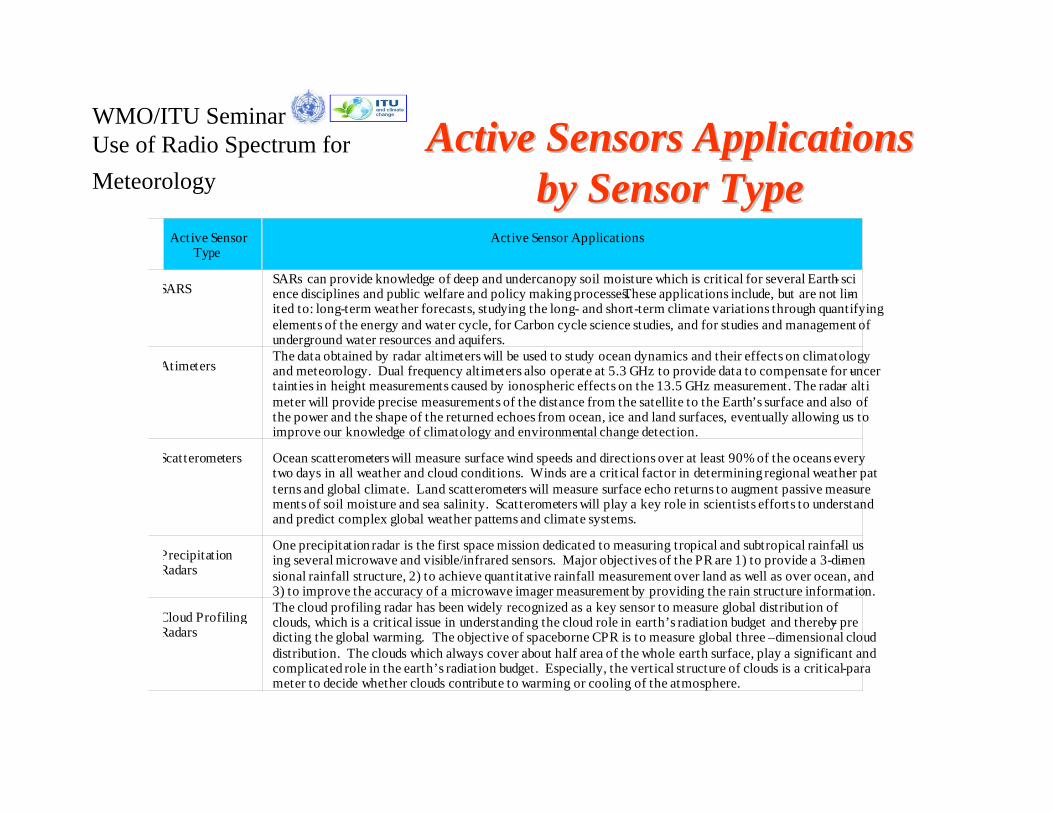
Active Sensors Applications Active Sensors Applications by Sensor Typeby Sensor Type
Active SensorType
Active Sensor Applications
SARS SARs can provide knowledge of deep and undercanopy soil moisture which is critical for several Earth sci-ence disciplines and public welfare and policy making processes. These applications include, but are not lim-ited to: long-term weather forecasts, studying the long- and short-term climate variations through quantifyingelements of the energy and water cycle, for Carbon cycle science studies, and for studies and management ofunderground water resources and aquifers.
AtimetersThe data obtained by radar altimeters will be used to study ocean dynamics and their effects on climatologyand meteorology. Dual frequency altimeters also operate at 5.3 GHz to provide data to compensate for uncer-tainties in height measurements caused by ionospheric effects on the 13.5 GHz measurement. The radar alti-meter will provide precise measurements of the distance from the satellite to the Earth’s surface and also ofthe power and the shape of the returned echoes from ocean, ice and land surfaces, eventually allowing us toimprove our knowledge of climatology and environmental change detection.
Scatterometers Ocean scatterometers will measure surface wind speeds and directions over at least 90% of the oceans everytwo days in all weather and cloud conditions. Winds are a crit ical factor in determining regional weather pat-terns and global climate. Land scatterometers will measure surface echo returns to augment passive measure-ments of soil moisture and sea salinity. Scatterometers will play a key role in scientists efforts to understandand predict complex global weather patterns and climate systems.
PrecipitationRadars
One precipitation radar is the first space mission dedicated to measuring tropical and subtropical rainfall us-ing several microwave and visible/infrared sensors. Major objectives of the PR are 1) to provide a 3-dimen-sional rainfall structure, 2) to achieve quantitative rainfall measurement over land as well as over ocean, and3) to improve the accuracy of a microwave imager measurement by providing the rain structure information.
Cloud ProfilingRadars
The cloud profiling radar has been widely recognized as a key sensor to measure global distribution ofclouds, which is a critical issue in understanding the cloud role in earth’s radiation budget and thereby pre-dicting the global warming. The objective of spaceborne CPR is to measure global three –dimensional clouddistribution. The clouds which always cover about half area of the whole earth surface, play a significant andcomplicated role in the earth’s radiation budget. Especially, the vertical structure of clouds is a critical para-meter to decide whether clouds contribute to warming or cooling of the atmosphere.