WLTP validation test results for BEV(i-MiEV) & OVC-HEV (Prius PHV)
20
National Traffic Safety and Environment Laboratory National Traffic Safety and Environment Laboratory JAPAN JAPAN NTSEL NTSEL WLTP validation test results for BEV(i-MiEV) & OVC-HEV (Prius PHV) National Traffic Safety and National Traffic Safety and Environment Laboratory Environment Laboratory WLTP-DTP-ElabProc-071rev WLTP-DTP-ElabProc-071rev 1
-
Upload
lynne-cross -
Category
Documents
-
view
223 -
download
3
description
BEV Validation Test Results (i-MiEV) Vehicle condition: 2009 Model Odometer : 7352 km (before the test) Mode Range* [km] Electric energy consumption [Wh/km] Low 127.3 130 Mid 112.1 132 High 108.1 135 Ex-High 82.4 200 All 104.0 142 *) note : stop conditions are slightly different from draft gtr requirement
Transcript of WLTP validation test results for BEV(i-MiEV) & OVC-HEV (Prius PHV)

National Traffic Safety and Environment LaboratoryNational Traffic Safety and Environment Laboratory JAPANJAPANNNTTSS EELLNTSEL
WLTP validation test results for BEV(i-MiEV) & OVC-HEV (Prius PHV)
National Traffic Safety and National Traffic Safety and Environment LaboratoryEnvironment Laboratory
WLTP-DTP-ElabProc-071revWLTP-DTP-ElabProc-071rev
1

National Traffic Safety and Environment LaboratoryNational Traffic Safety and Environment Laboratory 、、 JAPANJAPANNNTTSSEELLNTSEL
BEV Validation Test Results (i-MiEV)
2
Mode Range*[km]
Electric energy consumption [Wh/km]
Low 127.3 130Mid 112.1 132High 108.1 135
Ex-High 82.4 200All 104.0 142
Vehicle condition:2009 ModelOdometer : 7352 km (before the test)
*) note : stop conditions are slightly different from draft gtr requirement

National Traffic Safety and Environment LaboratoryNational Traffic Safety and Environment Laboratory 、、 JAPANJAPANNNTTSSEELLNTSEL
Energy vs Driving Distance
0
2000
4000
6000
8000
10000
12000
14000
0 20 40 60 80 100 120
Cha
rged
Ene
rgy W
h
Driving Distance km
WLTP CL 3 V51st Cycle 2nd Cycle 3rd Cycle 4th Cycle 5th Cycle

National Traffic Safety and Environment LaboratoryNational Traffic Safety and Environment Laboratory 、、 JAPANJAPANNNTTSSEELLNTSEL
020406080
100120140
0 100 200 300 400 500 600
車速
[km
/h]
時間 [sec]
基準車速
実車速
≪High≫
020406080
100120140
0 100 200 300 400 500 600
車速
[km
/h]
時間 [sec]
基準車速
実車速
≪ex-High≫
020406080
100120140
1000 1100 1200 1300 1400 1500 1600
車速
[km
/h]
時間 [sec]
基準車速
実車速
≪all≫
Battery indicator
Battery indicator
Battery indicator
The test vehicle was controlled to trace each speed pattern in tests as much as the driver was able to do.
The vehicle’s behavior in ends of test drives
020406080
100120140
0 100 200 300 400 500 600
車速
[km
/h]
時間 [sec]
基準車速
実車速
020406080
100120140
0 100 200 300 400 500 600
車速
[km
/h]
時間 [sec]
基準車速
実車速
≪Low≫
42nd cycle
Battery indicator
41st cycle
26th cycle
10th cycle
020406080
100120140
0 100 200 300 400 500 600
車速
[km
/h]
時間 [sec]
基準車速
実車速
≪Mid≫
Battery indicator
24th cycle5th cycle
Speed pattern
Measured speedSpeed pattern
Measured speed
Speed pattern
Measured speed
Speed pattern
Measured speed
Speed pattern
Measured speed
Speed pattern
Measured speed
Time (sec)
Time (sec)Time (sec)
Time (sec)
Time (sec)
4s deviation
National Traffic Safety and Environment LaboratoryNational Traffic Safety and Environment Laboratory 、、 JAPANJAPANNNTTSSEELLNTSEL
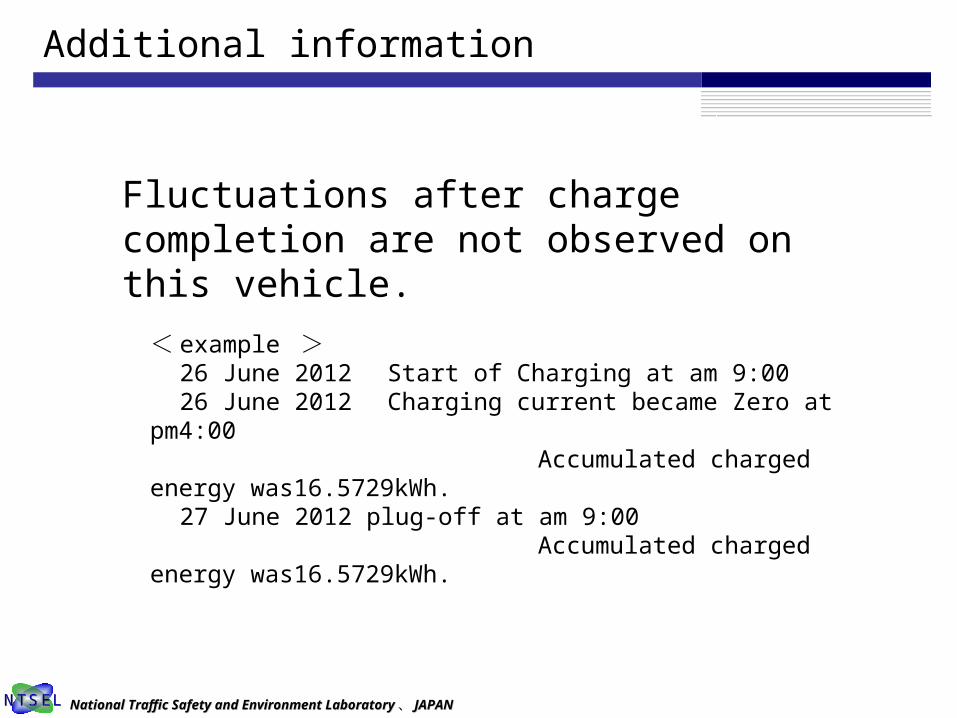
Additional information
Fluctuations after charge completion are not observed on this vehicle.
< example > 26 June 2012 Start of Charging at am 9:00 26 June 2012 Charging current became Zero at pm4:00 Accumulated charged energy was16.5729kWh. 27 June 2012 plug-off at am 9:00 Accumulated charged energy was16.5729kWh.

National Traffic Safety and Environment LaboratoryNational Traffic Safety and Environment Laboratory 、、 JAPANJAPANNNTTSSEELLNTSEL
OVC-HEV Validation Test Results (Prius PHV)
6
index WLTP (CL3 V5)
Combined fuel consumption km/L 38.1 CS fuel consumption km/L 24.6
CD fuel consumption km/L 65.0
CD range km 35.5
Equivalent EV range km 17.7
Electric energy per charging kWh 3.06
Electric energy consumption km/kWh 5.8
Vehicle condition:2012 ModelOdometer : 4311 km (before the test)
Note : apply current Japanese regulation for calculation

National Traffic Safety and Environment LaboratoryNational Traffic Safety and Environment Laboratory 、、 JAPANJAPANNNTTSSEELLNTSEL
0
2000
4000
6000
8000
10000
12000
14000
0 20 40 60 80 100 120
Cha
rged
Ene
rgy W
h
Driving Distance km
WLTP CL 3 V51st Cycle 2nd Cycle 3rd Cycle 4th Cycle
Charged Energy Profile (Prius PHV)

National Traffic Safety and Environment LaboratoryNational Traffic Safety and Environment Laboratory 、、 JAPANJAPANNNTTSSEELLNTSEL
CD CS Transient Profile
1st cycle 2nd cycle 3rd cycle 4th cycle
① SOC(Start/End) [%] 85.0 / 36.0 34.1 / 27.0 25.8 / 27.0 26.2 / 27.0
② Fuel Economy [km/L] 233.36 27.38 24.96 25.05
③ Fuel consumption [L] 0.10 0.85 0.93 0.93
④ Equivalent ΔAh×2%Calculated from Fuel
consumption
0.09 0.75 0.82 0.82
⑤ ΔAh 11.40 1.57 0.29 0.21
⑥ CD / CS determination (④ >⑤ ) CD CD CS CS
⑦ CO2 [g] 771.1 2014.6 2211.5 2204.4
Apply current Japanese regulation.
This will be reviewed with other validation results.

National Traffic Safety and Environment LaboratoryNational Traffic Safety and Environment Laboratory 、、 JAPANJAPANNNTTSSEELLNTSEL
Comparison of each phase Results (Prius PHV)
9
index Low Mid Hi Ex-Hi All
Combined fuel consumption km/L 59.5 53.2 45.1 27.0 38.1 CS fuel consumption km/L 30.0 30.3 26.3 18.5 24.6
CD fuel consumption km/L 339.5 181.4 120.5 43.8 65.0
CD range km 32.4 29.5 31.4 32.5 35.5
Equivalent EV range km 25.4 19 18.9 14.1 17.7
Electric energy kWh 2.99 3.03 (2.98)※ (2.99) ※ 3.06
Electric energy consumption km/kWh 8.5 6.3 (6.3) ※ (4.7) ※ 5.8 ※ The electric energy was measured before tests,
Need further analysis whether combined (all phases and/or specific phases) results can be obtained from each phase result or not. If not, independent combined test is necessary.

National Traffic Safety and Environment LaboratoryNational Traffic Safety and Environment Laboratory 、、 JAPANJAPANNNTTSSEELLNTSEL
y = 1.8444x + 2.9365R² = 0.9682
0
2
4
6
8
10
-1 0 1 2
Fuel
Con
sum
ptio
n L/1
00km
ΔAh
y = 0.2656x + 3.9593R² = 0.9942
0
2
4
6
8
10
-1 0 1 2Fu
el C
onsu
mpt
ion L
/100
kmΔAh
y = 0.6767x + 5.1858R² = 0.9927
0
2
4
6
8
10
-1 0 1 2
Fuel
Con
sum
ptio
n L/1
00km
ΔAh
y = 0.7754x + 3.5732R² = 0.9892
0
2
4
6
8
10
-1 0 1 2Fu
el C
onsu
mpt
ion L
/100
kmΔAh
y = 1.1989x + 3.1004R² = 0.9926
0
2
4
6
8
10
-1 0 1 2
Fuel
Con
sum
ptio
n L/1
00km
ΔAh
Fuel Consumption in CS Operation
≪Low≫
≪Mid≫
≪Hi≫
≪Ex-Hi≫ ≪All≫
Fuel consumption was increased as the increase of speed.

National Traffic Safety and Environment LaboratoryNational Traffic Safety and Environment Laboratory 、、 JAPANJAPANNNTTSSEELLNTSEL
y = 43.666x + 69.692R² = 0.9753
0
20
40
60
80
100
120
140
160
-1 0 1 2
CO
2g/
km
ΔAh
y = 16.1x + 123.18R² = 0.9929
0
20
40
60
80
100
120
140
160
-1 0 1 2
CO
2g/
km
ΔAh
y = 6.304x + 94.076R² = 0.9941
0
20
40
60
80
100
120
140
160
-1 0 1 2C
O2g/
kmΔAh
y = 18.463x + 84.889R² = 0.9892
0
20
40
60
80
100
120
140
160
-1 0 1 2C
O2g/
kmΔAh
y = 28.493x + 73.656R² = 0.9926
0
20
40
60
80
100
120
140
160
-1 0 1 2
CO
2g/
km
ΔAh
CO2 emission in CS operation
≪Low≫
≪Mid≫
≪Hi≫
≪Ex-Hi≫ ≪All≫

National Traffic Safety and Environment LaboratoryNational Traffic Safety and Environment Laboratory 、、 JAPANJAPANNNTTSSEELLNTSEL
Additional Pollutants in CS operation
No obvious relationship between the AP constituents and ΔAh was observed
N2O
0.0E+001.0E-062.0E- 063.0E- 064.0E- 065.0E- 06
-1 0 1 2ΔAh
g/km
NH3
0.0E+001.0E-032.0E-033.0E-034.0E-035.0E-03
-1 0 1 2ΔAh
g/km
NO2
0.0E+002.0E-044.0E- 046.0E- 048.0E- 041.0E- 03
- 1 0 1 2ΔAh
g/km
CH4
0.0E+001.0E-042.0E- 043.0E- 044.0E- 045.0E- 04
- 1 0 1 2ΔAh
g/km

National Traffic Safety and Environment LaboratoryNational Traffic Safety and Environment Laboratory 、、 JAPANJAPANNNTTSSEELLNTSEL
Additional information
Fluctuations in charging were not observed.
0
500
1000
1500
2000
2500
0 1 2 3
Char
ging
Pow
er W
0
500
1000
1500
2000
2500
0 10 20 30
軸ラ
ベル
hours

National Traffic Safety and Environment LaboratoryNational Traffic Safety and Environment Laboratory 、、 JAPANJAPANNNTTSSEELLNTSEL
appendix

National Traffic Safety and Environment LaboratoryNational Traffic Safety and Environment Laboratory 、、 JAPANJAPANNNTTSSEELLNTSEL
Utility Factor used for this study (i.e. defined in Japanese regulation)
0
0.2
0.4
0.6
0.8
1
0 100 200 300
UF
daily trip distance km
Rcd = 35.5 km
UF = 0.57

National Traffic Safety and Environment LaboratoryNational Traffic Safety and Environment Laboratory 、、 JAPANJAPANNNTTSSEELLNTSEL
Calculation formulas
0
2000
4000
6000
8000
10000
12000
14000
0 20 40 60 80 100 120
Cha
rged
Ene
rgy W
h
Driving Distance km
WLTP CL 3 V51st Cycle 2nd Cycle 3rd Cycle 4th Cycle
CD Running Ratio during transition cycle
Engine startcycle
Transitioncycle
First CScycle
k = CO2(1st cycle)
CO2(CS cold) - CO2(2nd cycle)
CD rangeRcd = 23,262×(1+k)
Rev = CO2(CS cold)
CO2(CS cold) - CO2(1st cycle)
Equivalent EV range
23,262×
CO2(CS hot)
CO2(CS hot) - CO2(2nd cycle)
+
CS Fuel Economy(FEcs) =
1
CO2(CS cold) 0.25
+ CO2(CS hot) 0.75
CD Fuel Economy(FEcd) =
k/(23,262)
FE(1st cycle) 1
+FE(2nd cycle) k

National Traffic Safety and Environment LaboratoryNational Traffic Safety and Environment Laboratory 、、 JAPANJAPANNNTTSSEELLNTSEL
Calculation functions
Combined Fuel Economy = 1
FEcd UF
+FE(cs) 1-UF UF=0.57(@Rcd)
Electricity Power efficiency =Rev
AC Charged Energy kWh

National Traffic Safety and Environment LaboratoryNational Traffic Safety and Environment Laboratory 、、 JAPANJAPANNNTTSSEELLNTSEL
Vehicle weight
Motor
Drivebattery
Control system
Driving method
Type
Max. output
Max. torque
Max. speed
Type
Rated voltage
Rated capacity
[kg]
[kW/min-1]
[Nm/min-1]
[min-1]
[V]
[kWh]
1,100
Permanent magnetsynchronous motor
47 / 3,000 ~ 6,000
180 / 0 ~ 2,000
8,500
Lithium-ion cells
330
16
Inverter control
Rear-wheel drive
2009 years model
Vehicle spec.
Vehicle condition (7/2012) Odometer : 5269 km
Non-blended regenerative brake system
18

National Traffic Safety and Environment LaboratoryNational Traffic Safety and Environment Laboratory 、、 JAPANJAPANNNTTSSEELLNTSEL
Operation room Vehicle test room
Chassis dynamometer
<Dynamo meter ( Fr or Rr or 4WD ) > Alternating current system ・ Absorption power : 220kW ・ Motoring power : 200kW Electrical inertia method ・ 2WD total : 570 – 2750 kg ・ 4WD total : 800 – 3500 kg
<MEIDACS – DY6200P>
19

National Traffic Safety and Environment LaboratoryNational Traffic Safety and Environment Laboratory JAPANJAPANNNTTSS EELLNTSEL
CAN monitorProve
Measurement machine
Rear
Front
・ Vehicle speed・ Battery voltage・ Motor current・ Accessory current・ Air-conditioner / Heater current・ Outdoor / Room temperature
Connector
Data loggerPC
telecommunication equipment
20