WLN Lab Report
8
WLN (G.W) Page 1 31-1-2010 Report Removal efficiency of Silver impregnated Ceramic filters A study of the removal of pathogenic bacteria. Basic information: In India a lot of households don’t ha ve the privilege of using healthy drinki ng wate r without the threat of b eing infected with pat hogenic micro-organisms. Still they are in need of healthy drinking water or water needed for preparing food. The water they can use now is water filtered through ceramic filters impregnated with silver. Experiments in the past proved that ceramic fi lters can reduce substa ntially the amount of microorganisms in the water when it is p assed through the ceramic wall. The question now is, how much can be removed with an intact filter when it is impregnated with silver. Is the reduction enough that the ceramic fi lters can be used to purify surface water so it can be used as drinking water without becoming ill from bacteria, viruses or protozoa which are normally present in the surface water. According to the NSF norm in the USA for water filters when selling them as water purifiers the reductions have to be at le ast: For bacteria 99.9999% ( 6 log), for viruses 99. 99% (4 log) and for protozoa 99.9% (3log). However, the aim of this study is not to meet the NSF norm. The ceramic filters used in India however are expected to reduce bacteria by about 99% ( 2 log) . The following experiments are proposed to quantify the reduction in bacteria by using the Ceramic Filter impregnated with silver compared to filters without silver impregnation. Experiments : Ceramic filters wi th and without silver impreg nation are compared. The Filters are tested with known concentrati ons of bacteria . The bacteria st rain which is used is E.coli WR1. This microorganism is also used in the Dutch guidelines for Quantitative Microbiological Risk Analysis. In where E.coli WR1 is used as an indicator for the removal of pathogenic bacteria in purification of surface water to drinking water. The concentration of E.coli which is used as influent for the Ceramic Filters is approximately 10 6 CFU/liter. Experiments are carried out at a flow rate of 6 liter /hour and 3 liter/hour. To get information which resembles the use in practice as much as possible and within a time of about two weeks the following procedure was used. Certificated analysis Certificated analysis
-
Upload
greengogreen -
Category
Documents
-
view
220 -
download
0
Transcript of WLN Lab Report

8/9/2019 WLN Lab Report
http://slidepdf.com/reader/full/wln-lab-report 1/8
WLN (G.W) Page 1 31-1-20
Report
Removal efficiency of Silver impregnated Ceramic filters
A study of the removal of pathogenic bacteria.
Basic information:
In India a lot of households don’t have the privilege of using healthy drinking water without the threat of being infected with pathogenic micro-organisms. Still they are in need of healthy drinking water or water needed for preparing food.The water they can use now is water filtered through ceramic filters impregnated withsilver. Experiments in the past proved that ceramic filters can reduce substantially the amount of microorganisms in the water when it is passed through the ceramic
wall.The question now is, how much can be removed with an intact filter when it isimpregnated with silver. Is the reduction enough that the ceramic filters can be usedto purify surface water so it can be used as drinking water without becoming ill from
bacteria, viruses or protozoa which are normally present in the surface water. According to the NSF norm in the USA for water filters when selling them as waterpurifiers the reductions have to be at least:For bacteria 99.9999% ( 6 log), for viruses 99.99% (4 log) and for protozoa 99.9%(3log).
However, the aim of this study is not to meet the NSF norm.The ceramic filters used in India however are expected to reduce bacteria by about99% ( 2 log) .The following experiments are proposed to quantify the reduction in bacteria by using the Ceramic Filter impregnated with silver compared to filters without silverimpregnation.
Experiments :
Ceramic filters with and without silver impregnation are compared. The Filters aretested with known concentrations of bacteria. The bacteria strain which is used is
E.coli WR1. This microorganism is also used in the Dutchguidelines for Quantitative Microbiological Risk Analysis. In where E.coli WR1 is used as an indicator for the removal of pathogenic bacteria in purification of surface water todrinking water.The concentration of E.coli which is used as influent for theCeramic Filters is approximately 106 CFU/liter.Experiments are carried out at a flow rate of 6 liter /hourand 3 liter/hour.To get information which resembles the use in practice asmuch as possible and within a time of about two weeks the
following procedure was used.
Certificated
analysis
Certificated
analysis
8/9/2019 WLN Lab Report
http://slidepdf.com/reader/full/wln-lab-report 2/8
WLN (G.W) Page 2 31-1-20
After the first dose of microorganism at the correct flow rate and after sampling, themaximum flow rate (with a pump, 50l/hour) is used to flush the filter withapproximately 1000 liter of water. After flushing, the filter is scrubbed with aScotchbrite pad followed by measuring the filter diameter. Scrubbing removes asmall layer of the outside filter material.
After every 1000 liters of flushing we measure the diameter of the ceramic filter afterscrubbing, the removal of E.coli and the concentration silver in the effluent water.This is done until approximately 8000 liter of water is flushed through the filter.By using a maximum flush flow rate the time needed for these tests could be reducedfrom several months to a few weeks.
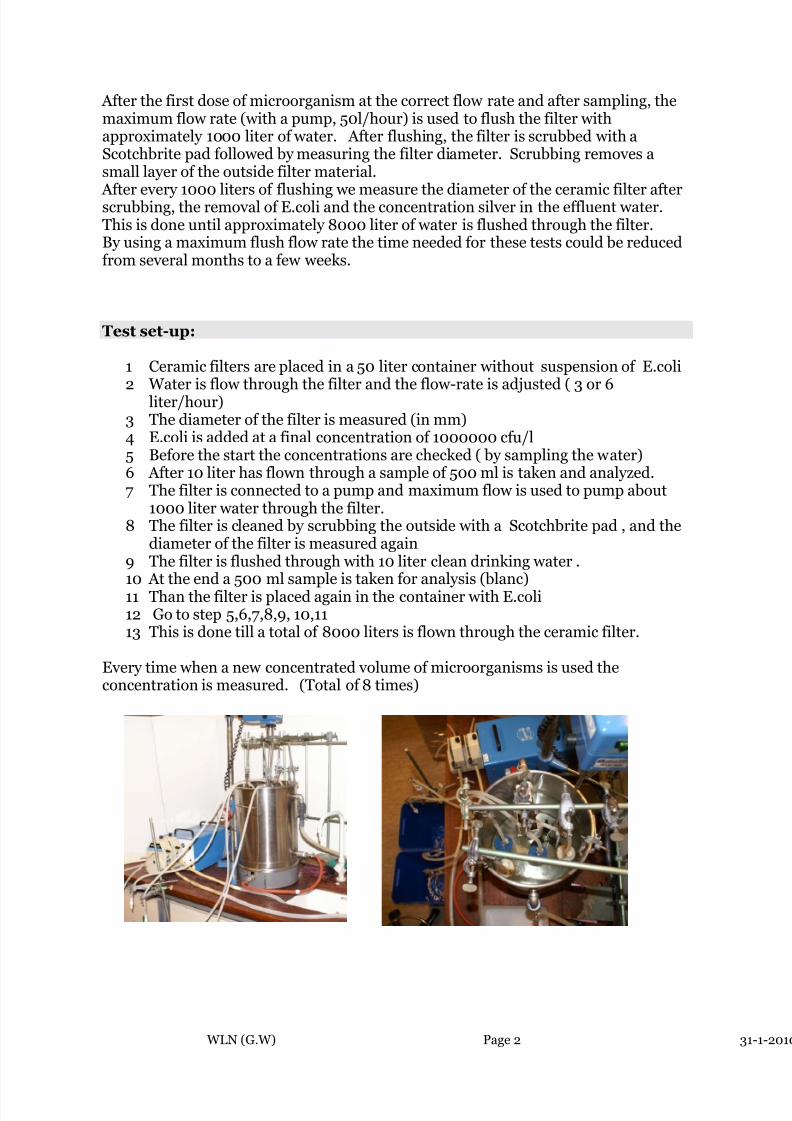
Test set-up:
1 Ceramic filters are placed in a 50 liter container without suspension of E.coli
2 Water is flow through the filter and the flow-rate is adjusted ( 3 or 6liter/hour)
3 The diameter of the filter is measured (in mm)4 E.coli is added at a final concentration of 1000000 cfu/l5 Before the start the concentrations are checked ( by sampling the water)6 After 10 liter has flown through a sample of 500 ml is taken and analyzed.7 The filter is connected to a pump and maximum flow is used to pump about
1000 liter water through the filter.8 The filter is cleaned by scrubbing the outside with a Scotchbrite pad , and the
diameter of the filter is measured again9 The filter is flushed through with 10 liter clean drinking water .
10 At the end a 500 ml sample is taken for analysis (blanc)11 Than the filter is placed again in the container with E.coli12 Go to step 5,6,7,8,9, 10,1113 This is done till a total of 8000 liters is flown through the ceramic filter.
Every time when a new concentrated volume of microorganisms is used theconcentration is measured. (Total of 8 times)

8/9/2019 WLN Lab Report
http://slidepdf.com/reader/full/wln-lab-report 3/8
WLN (G.W) Page 3 31-1-201
Interpreting the measurements:
The results of the analysis can be used to determine the reduction of the
microorganism by the ceramic filter.The reduction is presented as the DEC value of the filter. This means the decimalelimination capacity of the filter . And this is expressed in the logarithm value of thereduction
Example:
90% reduction DEC =1.099% reduction DEC =2.099.9% reduction DEC= 3.0
Reliability of the results:
All the microbiological analyses which are done are certified methods. The followingmethods are provided:
E.coli according to NEN-ISO 9308-3
In these experiments 2 filters without silver impregnation and two with silverimpregnation were tested at two different flow rates. So it is not possible to givestatistical calculations or interpretations of the results.
8/9/2019 WLN Lab Report
http://slidepdf.com/reader/full/wln-lab-report 4/8
WLN (G.W) Page 4 31-1-201
Results:
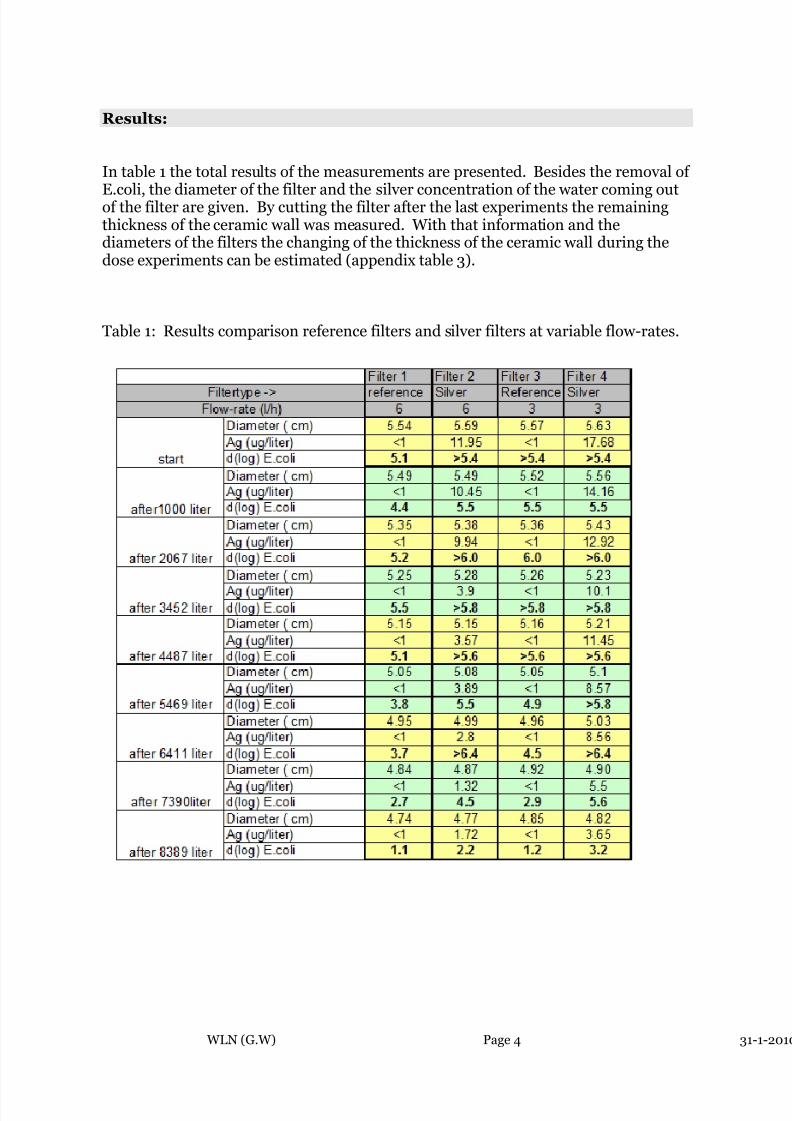
In table 1 the total results of the measurements are presented. Besides the removal of
E.coli, the diameter of the filter and the silver concentration of the water coming outof the filter are given. By cutting the filter after the last experiments the remainingthickness of the ceramic wall was measured. With that information and thediameters of the filters the changing of the thickness of the ceramic wall during thedose experiments can be estimated (appendix table 3).
Table 1: Results comparison reference filters and silver filters at variable flow-rates.

8/9/2019 WLN Lab Report
http://slidepdf.com/reader/full/wln-lab-report 5/8
WLN (G.W) Page 5 31-1-20
Discussion:
Be aware of the fact that we only have the results of two filters impregnated withsilver and that it is just an indication of what these kind of filters are capable of. So
the results can not just be translated to every filter which is provided by themanufacturer. To do this more filters have to be tested to be sure that the productionis reliable and that always the same quality is produced.Comparison of the filters impregnated with silver against the reference filters gavedifferent and promising results. As expected the silver impregnated filters showed ahigher reduction of E.coli. In the beginning of the experiment all filters removedalmost totally the added concentration of E.coli, which was between 100.000 and1.000.000 per ml.Filter 1 (reference filter without silver and with a flow rate of 6 litre/hour) was thefirst filter in which some E.coli came through after passing only through a few litresof water. The second reference filter with a flow rate of 3 litre/hour (filter 3) leaked
E.coli after 5000 litre of water had passed the filter. The first silver-impregnatedfilter which leaked E.coli was filter 2 (flow-rate of 6 litre /hour) and this was also after5000 litre. Filter 4 (silver impregnated and a flow rate of 3 litre/hour) first gave signsof leakage after more than 7000 litre of water had passed through. Although Filter 2had a sporadic E.coli in the effluent after 5000 litre. Later on after 6500 litre noE.coli was spotted in the effluent. So the one measured after 5000 litre possibly could
be an artefact of the experiments.
Figure 1: Removal of E.coli and wall thickness of silver-impregnated filters

8/9/2019 WLN Lab Report
http://slidepdf.com/reader/full/wln-lab-report 6/8
WLN (G.W) Page 6 31-1-201
In figure 1 the relation between removal of E.coli and the diminishing thickness of theceramic wall is presented. Although there are more differences between both filters(as flow-rate and silver concentration) there seems to be a clear effect on removingthe E.coli by the thickness of the wall. This relation seems much more evident thanother factors.
In the silver-impregnated filters used in this experiment it seems that the silverconcentration is high enough even after 7500 litre of water to be effective againstE.coli at high concentration. However it should be remembered that the bulk volumeof about 7000 litre is not heave polluted with bacteria. We used for flushing drinking
water at maximum flow-rate of about 50 l/hour. In real practice it could be that inheavily polluted water with more bacteria consuming the silver in the ceramic filtersand therefore the lifetime could be shortened significantly.Further experiments with surface water are needed to give answers to this question.
Another striking question will be how these filters decrease the amount of viruses
from polluted water. Viruses are much smaller and if it is really the case that theremoval of organisms is mainly due to the thickness of the wall it is to be expectedthat the removal of viruses will be much lower than it is found for E.coli.On the other hand silver is also effective against viruses and maybe the concentrationof the silver is still enough to efficiently reduce the viruses.
The effect of different flow rate at E.coli removal is not clear. After around 7000 litre bacterial leakage was substantially more at the higher flow rate.In surface water with a high particle content clogging of the filters becomes animportant issue. In that case the filters have to be scrubbed earlier than after filtering1000 litre of water.
Figure 2: removal of E.coli by the four tested filters presented in logarithm ranges
8/9/2019 WLN Lab Report
http://slidepdf.com/reader/full/wln-lab-report 7/8
WLN (G.W) Page 7 31-1-20
WLN is accredited by the Raad voor Accreditatie, which is accepted by the DutchGovernment. The used analyses in this Report are all certified by the RVA.
References:
NEN-EN-ISO 9308-3, Bepaling van E.coli in water met behulp van 96 wells MPN.
(1999). NNI, Anonymous
Waterlife , Functioning of Ceramic Filters ( 2008) Anonymous,( http://www.water4life.eu )
D.S. Lantange, Investigation of the Potters for Peace Colloidal Silver-impregnated Ceramic filter: Intrinsic effectiveness and Field Performance in Rural Nicaragua.(200?)
Basic Water Needs India : Instruction leaflet Ceramic filters. 2008
Waterlaboratorium Noord20 may 2008
Drs. G. H. WubbelsMr. I. Duran
Mr. P. Willemse
Certificated analysis
Certificated analysis

8/9/2019 WLN Lab Report
http://slidepdf.com/reader/full/wln-lab-report 8/8
WLN (G.W) Page 8 31-1-20