Witwatersrand Consolidated Gold Resources Ltd.
86
Witwatersrand Consolidated Gold Resources Ltd. Technical Report on the Scoping Study for the Bloemhoek Project, Southern Free State Goldfield May 2008 G.I. Cunningham B Eng (Chemical), Pr Eng T.V. Spindler B Sc (Mining), Pr. Eng Turnberry Projects
Transcript of Witwatersrand Consolidated Gold Resources Ltd.
Witwatersrand Consolidated Gold Resources Ltd.
Technical Report on the Scoping Study for the Bloemhoek Project,
Southern Free State Goldfield
May 2008 G.I. Cunningham B Eng (Chemical), Pr Eng T.V. Spindler B Sc (Mining), Pr. Eng Turnberry Projects
Bloemhoek Project Technical Report– May 2008
Table of Contents
1 SUMMARY .................................................................................................................................... 1 2 INTRODUCTION AND BACKGROUND....................................................................................... 3
2.1 Sources of Information ........................................................................................................................... 3 2.2 Site Visit ................................................................................................................................................. 3 2.3 Reliance of other experts ....................................................................................................................... 3
3 DISCLAIMERS .............................................................................................................................. 4 4 PROJECT DESCRIPTION & LOCATION..................................................................................... 6
4.1 Project Area ........................................................................................................................................... 6 4.2 Location and Legal Title ......................................................................................................................... 6 4.3 Neighbouring Properties ........................................................................................................................ 8 4.4 South African Regulatory Environment .................................................................................................. 8 4.5 Environmental Liabilities ........................................................................................................................ 9 4.6 Permitting............................................................................................................................................... 9
5 ACCESSIBILITY, CLIMATE, ETC .............................................................................................. 10 5.1 Access ................................................................................................................................................. 10 5.2 Topography.......................................................................................................................................... 10 5.3 Climate................................................................................................................................................. 10 5.4 Surface Rights ..................................................................................................................................... 10 5.5 Infrastructure........................................................................................................................................ 10
6 HISTORY..................................................................................................................................... 12 7 GEOLOGY OF THE BLOEMHOEK PROJECT AREA .............................................................. 13
7.1 Regional geological setting of the Bloemhoek Project ......................................................................... 13 7.2 Stratigraphy.......................................................................................................................................... 13 7.3 Structural Geology ............................................................................................................................... 14 7.4 Sedimentology of the Conglomerate Reefs.......................................................................................... 17 7.5 Water Potential..................................................................................................................................... 18
8 DEPOSIT TYPE........................................................................................................................... 19 9 MINERALISATION...................................................................................................................... 20 10 DRILLING.................................................................................................................................... 22 11 EXPLORATION........................................................................................................................... 2212 SAMPLING METHOD AND APPROACH................................................................................... 27 13 SAMPLE PREPARATION, ANALYSES, AND SECURITY........................................................ 28 14 DATA VERIFICATION ................................................................................................................ 29 15 ADJACENT PROPERTIES......................................................................................................... 30 16 MINERAL PROCESSING & METALLURGICAL TESTING....................................................... 31
16.1 Metallurgical Testwork ......................................................................................................................... 31 16.2 Metallurgical Processing ...................................................................................................................... 31 16.3 Future Requirements ........................................................................................................................... 31
17 MINERAL RESOURCE ESTIMATE............................................................................................ 33 18 OTHER RELEVANT DATA AND INFORMATION ..................................................................... 37 19 ADDITIONAL REQUIREMENT FOR TECHNICAL REPORTS.................................................. 38
19.1 Resource to Production Conversion..................................................................................................... 38 19.2 Conceptual Mine Design ...................................................................................................................... 38 19.3 Mine Engineering ................................................................................................................................. 50 19.4 Metallurgical Processing ...................................................................................................................... 51 19.5 Project Schedule .................................................................................................................................. 54 19.6 Environmental ...................................................................................................................................... 56 19.7 Capital Expenditure.............................................................................................................................. 58 19.8 Working Costs...................................................................................................................................... 59 19.9 Staffing................................................................................................................................................. 60 19.10 Economic Valuation ............................................................................................................................. 60 19.11 Project Risks and Up-side Potential ..................................................................................................... 66
20 RECOMMENDATIONS ............................................................................................................... 68 21 CONCLUSIONS .......................................................................................................................... 69 22 CERTIFICATES........................................................................................................................... 70 23 APPENDICES ............................................................................................................................. 75
i

Bloemhoek Project Technical Report– May 2008
List of Tables
Table 1 - Annual Production statistics to December 2006 for Neighbouring Mines ............................................... 30 Table 2 - Beatrix Reef cut-off grade-tonnage data................................................................................................. 33 Table 3 - B Reef cut-off grade-tonnage data ......................................................................................................... 34 Table 4 - Kalkoenkrans Reef cut-off grade-tonnage data ...................................................................................... 34 Table 5 - Leader Reef cut-off grade-tonnage data................................................................................................. 35 Table 6 - Leader Upper Reef cut-off grade-tonnage data...................................................................................... 35 Table 7 - Resource details at 300cm.g/t cut-off ..................................................................................................... 36 Table 8 - Bloemhoek Resource modified with Flow of Ore Factors ....................................................................... 38 Table 9 - Surface Shaft Level Spacing .................................................................................................................. 43 Table 10 - Capital Expenditure Summary.............................................................................................................. 59 Table 11 - Operating Cost Summary ..................................................................................................................... 59 Table 12 - Metal Prices used for Project evaluation .............................................................................................. 60 Table 13 - Economic Evaluation - Sensitivity Data at 5% Discount ....................................................................... 62 Table 14 - Economic Evaluation - Sensitivity at 10% Discount.............................................................................. 63 Table 15 - Gold Price Sensitivity............................................................................................................................ 64 Table 16 - Mining Royalty Sensitivity..................................................................................................................... 65 Table 17 - Project Parameters............................................................................................................................... 66
List of Figures
Figure 1 - Location of Wits Gold Project Areas........................................................................................................ 6 Figure 2 - Location of Bloemhoek in Relation to SOFS town of Virginia.................................................................. 8 Figure 3 - Stratigraphic column for the Southern Free State Goldfields ................................................................ 14 Figure 4 - Structural Geology and distribution of SOFS Projects........................................................................... 16Figure 5 - Bloemhoek Prospecting Area – Blue area around Bloemhoek Shaft ........................................................ Figure 6 - Distribution of gold values in the VS5 / Beatrix Reef ............................................................................. 23 Figure 7 - Distribution of gold values in the Kalkoenkrans Reef ............................................................................ 24 Figure 8 - Distribution of gold values in the B Reef................................................................................................ 25 Figure 9 - Distribution of gold values in the Leader Reef....................................................................................... 26 Figure 10 - Estimated Uranium Head Grade ......................................................................................................... 31 Figure 11 - Project location and Neighbouring Mines ............................................................................................ 40Figure 12 - Structure contours for the Beatrix Reef and the proposed shaft position ............................................ 39Figure 13 - Bloemhoek Shaft Schematic Layout.................................................................................................... 44 Figure 14 - Production Profile - Tonnage and Gold ounces................................................................................... 49 Figure 15 - Individual Reef Production Profile ....................................................................................................... 49 Figure 16 - High Level Project Gantt Chart............................................................................................................ 55 Figure 17 - Bloemhoek Cash Flow ........................................................................................................................ 62 Figure 18- Sensitivity Analysis Graph.................................................................................................................... 63 Figure 19 - IRR variation with changing Gold Price ............................................................................................... 65 Figure 20 - NPV variation at Discount Rates for changing Gold Price................................................................... 65
ii

Bloemhoek Project Technical Report– May 2008
1 SUMMARY
The Bloemhoek Project is located 14km south of Virginia in the Free State Province of South Africa and 284km by national road from Johannesburg. On 24 February 2006, Wits Gold was granted New Order Prospecting Rights for a period of five years over 12055 hectares in the Southern Free State Goldfield that includes the Bloemhoek Project area. A total of 38 boreholes have intersected Witwatersrand reefs at Bloemhoek where the geological setting is similar to the adjacent Beatrix and Joel Mines. Since late 2006, Wits Gold has completed drilling at three sites in the Project and a further five boreholes are planned. The mineral resource estimate that forms the basis of this Scoping Study on the Bloemhoek Project was presented in an NI43-101 compliant report by Snowden Mining Industry Consultants (Snowden) dated November 2007. This technical report is entitled ‘Witwatersrand Consolidated Gold Resources Limited: Mineral Properties in the Southern Free State, Potchefstroom and Klerksdorp Goldfields, South Africa’, prepared by George Gilchrist and Shaun Hackett. The resource statement estimates an Indicated Resource of 52.3Mt at an average grade of 6.7g/t, containing 11.3Moz of gold. The gold-bearing reefs on the Bloemhoek property do not outcrop at surface but are preserved at depths of between 1300 metres and 2400 metres below surface. These conglomerate reefs are folded about a northerly-plunging axis resulting in variable dips of the order of 10-20 degrees. There are three potentially economical bodies present on the property, namely the Beatrix, Kalkoenkrans and Leader Reefs. Other reef horizons are present but as yet they are uneconomical but may be regarded as up-side potential for the Project. The current simplistic geological and structural model has been developed by Wits Gold and audited by Snowden. For the sake of this Technical Report, the Beatrix and Kalkoenkrans Reefs are interpreted as a single reef zone for mine planning purposes with structural and other geological losses taken into account in the resource estimate. The current mine plan assumes a single block of reef with mine extraction based on a gold cut-off grade of 300cm.g/t. The entire mineral resource above the cut-off grade is to be extracted using a traditional Witwatersrand mine layout and the anticipated production schedule has been based on this proposed mine configuration. It is anticipated that the stoping width will be 15cm greater than the defined channel width of the reef, resulting in the inclusion of dilutionary waste material. This is subject to a minimum practical stoping width of 100cm. This stoping width has been further diluted by an additional 10%, to a tramming width of 135cm. These dilutions have been used to modify the original in situ resource estimate for all tonnage and grade calculations in this Technical Report. Sedimentological observations indicate a channel width varying from 77 to 119cm, and thus the stoping width will vary from 100 to 134cm across the mine. To adequately access this ore deposit, it is proposed that the most cost effective method will be via a twin vertical shaft system located in the centre of the deposit. The depth precludes the use of open pit techniques and multiple decline technology does not access the ore deposit quickly enough, whilst traversing un-pay blocks. This assessment is based on twin vertical shafts to a depth of 1 981m below surface. The expected production rate will be 200 000 tonnes per month of reef plus working cost waste production of 40 000 tonnes per month. The Bloemhoek mine is expected to produce 11 800 kg of gold per annum in dore (380 000 oz Au). The Bloemhoek area is situated adjacent to the Beatrix Gold Mine, south of Welkom in the Southern Free State Goldfield, South Africa. This Technical Report is undertaken by the independent consultant, Gordon Cunningham (the “Qualified Person”) from Turnberry
1
Bloemhoek Project Technical Report– May 2008
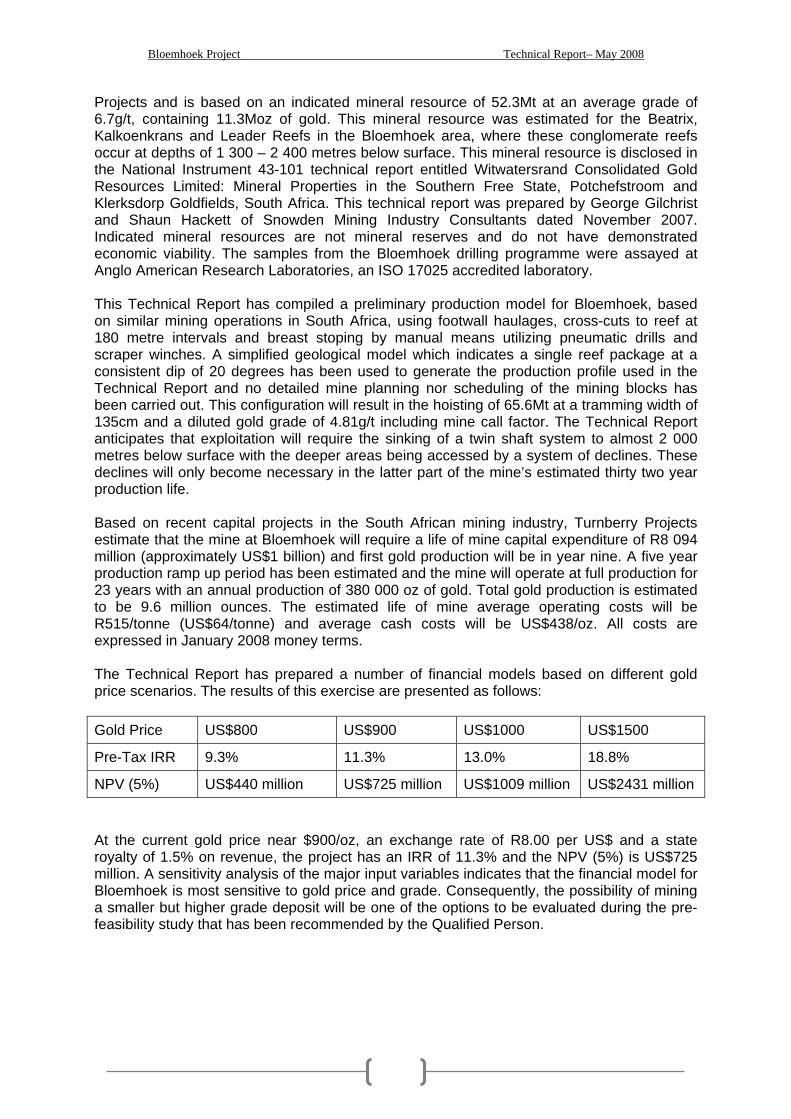
Projects and is based on an indicated mineral resource of 52.3Mt at an average grade of 6.7g/t, containing 11.3Moz of gold. This mineral resource was estimated for the Beatrix, Kalkoenkrans and Leader Reefs in the Bloemhoek area, where these conglomerate reefs occur at depths of 1 300 – 2 400 metres below surface. This mineral resource is disclosed in the National Instrument 43-101 technical report entitled Witwatersrand Consolidated Gold Resources Limited: Mineral Properties in the Southern Free State, Potchefstroom and Klerksdorp Goldfields, South Africa. This technical report was prepared by George Gilchrist and Shaun Hackett of Snowden Mining Industry Consultants dated November 2007. Indicated mineral resources are not mineral reserves and do not have demonstrated economic viability. The samples from the Bloemhoek drilling programme were assayed at Anglo American Research Laboratories, an ISO 17025 accredited laboratory. This Technical Report has compiled a preliminary production model for Bloemhoek, based on similar mining operations in South Africa, using footwall haulages, cross-cuts to reef at 180 metre intervals and breast stoping by manual means utilizing pneumatic drills and scraper winches. A simplified geological model which indicates a single reef package at a consistent dip of 20 degrees has been used to generate the production profile used in the Technical Report and no detailed mine planning nor scheduling of the mining blocks has been carried out. This configuration will result in the hoisting of 65.6Mt at a tramming width of 135cm and a diluted gold grade of 4.81g/t including mine call factor. The Technical Report anticipates that exploitation will require the sinking of a twin shaft system to almost 2 000 metres below surface with the deeper areas being accessed by a system of declines. These declines will only become necessary in the latter part of the mine’s estimated thirty two year production life. Based on recent capital projects in the South African mining industry, Turnberry Projects estimate that the mine at Bloemhoek will require a life of mine capital expenditure of R8 094 million (approximately US$1 billion) and first gold production will be in year nine. A five year production ramp up period has been estimated and the mine will operate at full production for 23 years with an annual production of 380 000 oz of gold. Total gold production is estimated to be 9.6 million ounces. The estimated life of mine average operating costs will be R515/tonne (US$64/tonne) and average cash costs will be US$438/oz. All costs are expressed in January 2008 money terms. The Technical Report has prepared a number of financial models based on different gold price scenarios. The results of this exercise are presented as follows: Gold Price US$800 US$900 US$1000 US$1500
Pre-Tax IRR 9.3% 11.3% 13.0% 18.8%
NPV (5%) US$440 million US$725 million US$1009 million US$2431 million At the current gold price near $900/oz, an exchange rate of R8.00 per US$ and a state royalty of 1.5% on revenue, the project has an IRR of 11.3% and the NPV (5%) is US$725 million. A sensitivity analysis of the major input variables indicates that the financial model for Bloemhoek is most sensitive to gold price and grade. Consequently, the possibility of mining a smaller but higher grade deposit will be one of the options to be evaluated during the pre-feasibility study that has been recommended by the Qualified Person.
2
Bloemhoek Project Technical Report– May 2008
2 INTRODUCTION AND BACKGROUND
This Technical Report has been prepared by Turnberry Projects (Pty) Ltd for Witwatersrand Consolidated Gold Resources Limited (Wits Gold or the Company) in compliance with the disclosure requirements of the Canadian National Instrument 43-101 (NI 43-101). This report is prepared as a result of a press release on 25 April 2008 titled “WITS GOLD COMPLETES A POSITIVE SCOPING STUDY ON THE BLOEMHOEK PROJECT IN THE SOUTHERN FREE STATE GOLDFIELD”. It represents a Qualified Person’s evaluation of the project’s technical and economic potential based on the geology and mineral resources as detailed in the Technical Report dated November 2007 and titled “WITWATERSRAND CONSOLIDATED GOLD RESOURCES LIMITED: MINERAL PROPERTIES IN THE SOUTHERN FREE STATE, POTCHEFSTROOM AND KLERKSDORP GOLDFIELDS, SOUTH AFRICA” as prepared by Snowden Mining Consultants. The Qualified Persons (QP’s) for the preparation of this Technical Report are Gordon Cunningham and Timothy Spindler. Unless otherwise stated, the information and data contained in this study report, or used in its preparation have been supplied by Wits Gold. This report includes technical information which requires subsequent calculations to derive production rates, totals and averages. Such calculations may involve some rounding, however Turnberry Projects does not consider these differences to be material. Unless so stated, all currencies are expressed in South African Rand (ZAR) at an exchange rate of R8.00 to US$1.00 where applicable.
2.1 Sources of Information The following key sources of information and/or data have been used to prepare the Technical Report :
• Snowden Technical Report dated November 2007 - “Witwatersrand Consolidated Gold Resources : Mineral Properties in the southern Free State, Potchefstroom and Klerksdorp Goldfields, South Africa”. This report was compiled by Qualified Persons, George Gilchrist and Shaun Hackett.
2.2 Site Visit A site visit was conducted by Timothy Spindler to the Bloemhoek Project site during June 2008. Gordon Cunningham has been to the vicinity of the project area on numerous occasions.
2.3 Reliance on other experts The QP’s have relied on the following inputs: The Technical Report and all qualifications as detailed by Snowden in the technical report referred to in Section 2.1. Turnberry has also relied on plans and information which were compiled by Dr. Marc Watchorn and Dirk Muntingh of Wits Gold.
3

Bloemhoek Project Technical Report– May 2008
3 DISCLAIMERS
In preparing this Technical Report the authors relied upon:
o Geological and assay information supplied by Wits Gold. o Drill hole analytical and survey data compiled by Wits Gold. o ‘In-house’ Turnberry experience and available data base information o The Snowden Technical report dated November 2007
Other than as disclosed here in, the outside sources of information were relied upon without extensive inquiry and review. The authors make no particular representation to the degree of accuracy of that information and do not bear liability thereto. This document was prepared as a Technical Report to provide an initial assessment of the economic potential of the Bloemhoek Project. This report and the conclusions are based on
o Geological and economic information available at the time of preparation o An empirical database compiled by Turnberry Projects as well as the Consultant’s
technical experience o The assumptions, conditions, and qualifications set forth in this report
This report is intended to be used by Wits Gold, subject to the terms and conditions of its contract with the authors and contributing persons. The contract permits Wits Gold to file this document as a Technical Report but warns that there has been limited confirmation of the assumptions used in this evaluation and thus, any use of this Technical Report by any third party is at that party’s sole risk. Certain statements in this Technical Report may constitute forward-looking information within the meaning of securities laws. In some cases, forward-looking information can be identified by use of terms such as “may”, “will”, “should”, “expect”, “believe”, “plan”, “scheduled”, “intend”, “estimate”, “forecast”, “predict”, “potential”, “continue”, “anticipate” or other similar expressions concerning matters that are not historical facts. Forward-looking information may relate to management’s future outlook and anticipated events or results, and may include statements or information regarding the future plans or prospects of the Company. Without limitation, statements about the development of the mine at Bloemhoek, required capital expenditures, the time required for the mine at Bloemhoek to enter production, the length of time the mine at Bloemhoek will operate at full production, the annual production of gold at the Bloemhoek mine and other related statements are forward-looking information. Forward-looking information involves known and unknown risks, uncertainties and other important factors that could cause the actual results, performance or achievements of the Company to be materially different from the future results, performance or achievements expressed or implied by such forward looking information. Such risks, uncertainties and other important factors include among others: economic, business and political conditions in South Africa; decreases in the market price of gold; hazards associated with underground and surface gold mining; the ability to attract and retain qualified personnel; labour disruptions; changes in laws and government regulations, particularly environmental regulations and mineral rights legislation including risks relating to the acquisition of the necessary licences and permits; changes in exchange rates; currency devaluations and inflation and other macro-economic factors; risk of changes in capital and operating costs, financing, capitalization and liquidity risks, including the risk that the financing required to fund all currently planned exploration and related activities may not be available on satisfactory terms, or at all; the ability to maximize the value of any economic resources. These forward-looking statements speak only as of the date of this document.
4

Bloemhoek Project Technical Report– May 2008
The reader should not place undue importance on forward-looking information and should not rely upon this information as of any other date. The Company undertakes no obligation to update publicly or release any revisions to these forward-looking statements to reflect events or circumstances after the date of this document or to reflect the occurrence of unanticipated events except where required by applicable laws.
5
Bloemhoek Project Technical Report– May 2008
4 PROJECT DESCRIPTION & LOCATION
4.1 Project Area Wits Gold was incorporated in December 2002 as an exploration company focussed on identification and acquisition of gold resources in the Witwatersrand Basin in central South Africa. The Department of Mineral and Energy (DME) has granted a total of thirteen New Order Prospecting Rights to Wits Gold covering 102 512 hectares in the Southern Free State, Potchefstroom and Klerksdorp Goldfields. The area of interest to this Technical Report is the Bloemhoek Project in the Southern Free State and covers an area of approximately 4 463 hectares. Gold mining has been active in the Southern Free State since 1956. Such mining occurred within 10km of the Bloemhoek Project boundaries at mines such as Beatrix (Gold Fields), Joel (Harmony Gold) and Merriespruit (Harmony Gold). Historical gold production from these mines is available but is not detailed in this study. Current production data is detailed in Table 1.
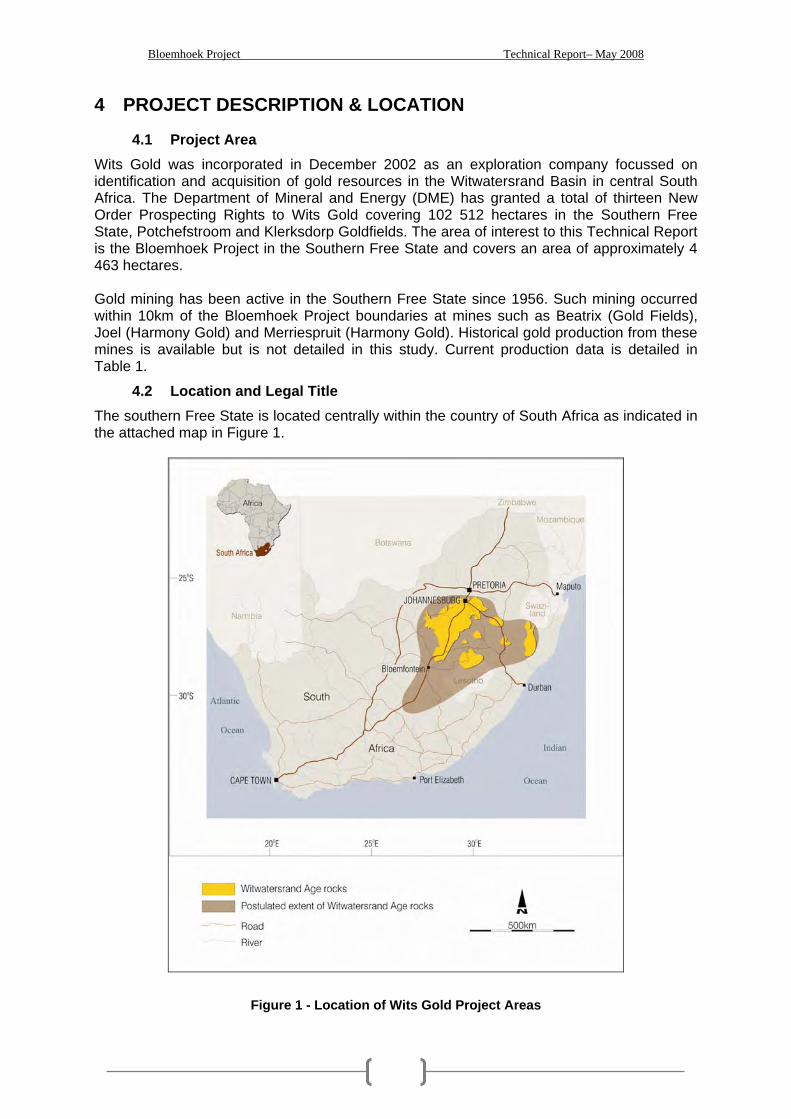
4.2 Location and Legal Title The southern Free State is located centrally within the country of South Africa as indicated in the attached map in Figure 1.
Figure 1 - Location of Wits Gold Project Areas
6

Bloemhoek Project Technical Report– May 2008
The Bloemhoek Project is situated some 12 kilometres south-southwest of the Free State town of Virginia. The nearest other towns are Welkom (24km to the north) and Bloemfontein (136km to the south). The main centre of Johannesburg is situated 284km to the northeast and is linked by national roads. The boundaries for the SOFS Prospecting Rights (FS76PR) have been drawn from prospecting plans which were compiled by Mr K P Landsman, who is a professional mining surveyor registered with PLATO and a fellow of IMSSA. Plans were constructed from Surveyor-General data in support of Wits Gold’s Prospecting Rights. On surface, the Prospecting Rights are defined by farm fences. The Bloemhoek Project falls with the SOFS New Order Prospecting Rights granted to Wits Gold on 24 February 2006. These Prospecting Rights cover an area of 12 055 hectares and were allocated the reference FS76PR by the Department of Minerals & Energy. They were subsequently registered with Mining Titles on 14 March 2006 and are valid for gold, silver and uranium until 23 February 2011. In terms of a legal agreement with the Harmony JV, the Company undertook to fund exploration on the Prospecting Rights to the completion of a bankable feasibility study. Once this study has been completed, the Harmony JV will have a once-off opportunity to acquire a 40% interest in the future mining venture. Alternatively should Wits Gold elect t sell the rights to those minerals, the Harmony JV will be entitled to a 50% share of those proceeds, less a three times multiple of the exploration costs incurred by Wits Gold. Furthermore, third parties were granted subscription rights to acquire between 5% and 7.5% of the shares in any new mining company that exploits the prospecting rights. The surface topography is gently undulating and varies from 1 300 to 1 360 metres above mean sea level (amsl). The area is traversed by a number of small seasonal drainage channels. For the sake of this report, the Southern Free State Goldfield is situated to the south of an ephemeral stream, the Sand River that flows in a westerly direction through the town of Virginia. In the central part of the Project a proposed shaft complex is located at GPS coordinates S28-11.911 and E26-48.615.
7
Bloemhoek Project Technical Report– May 2008
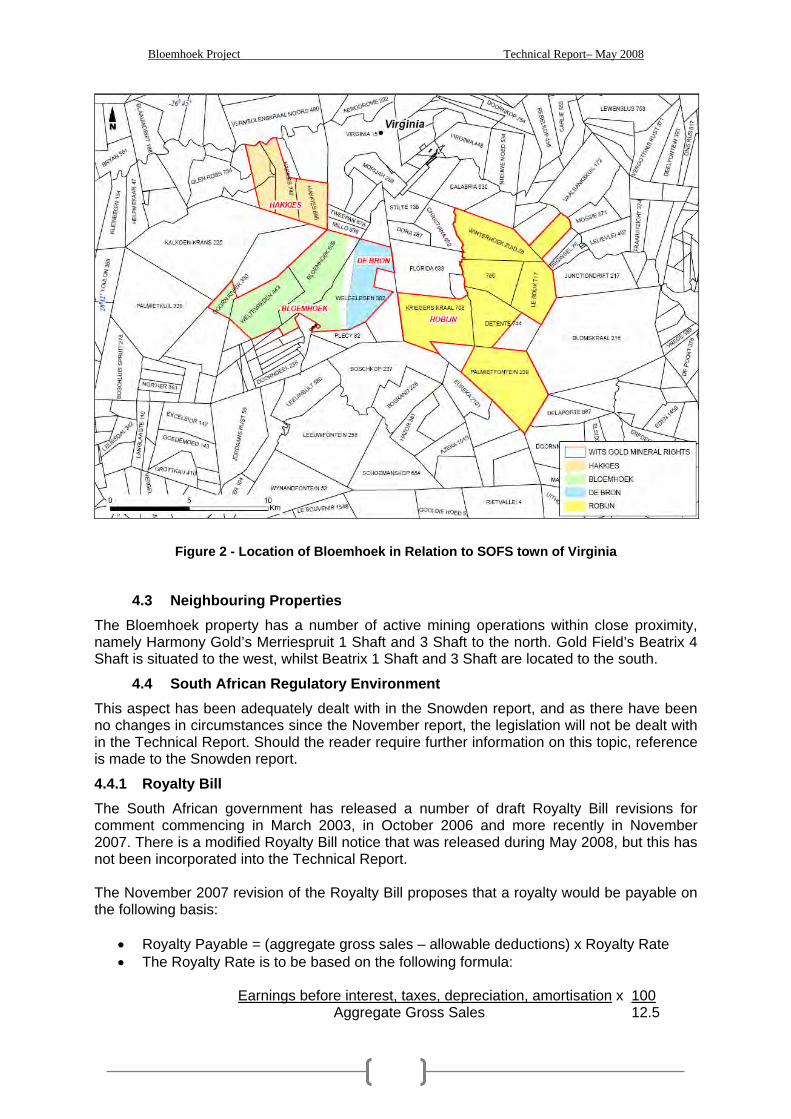
Figure 2 - Location of Bloemhoek in Relation to SOFS town of Virginia
4.3 Neighbouring Properties The Bloemhoek property has a number of active mining operations within close proximity, namely Harmony Gold’s Merriespruit 1 Shaft and 3 Shaft to the north. Gold Field’s Beatrix 4 Shaft is situated to the west, whilst Beatrix 1 Shaft and 3 Shaft are located to the south.
4.4 South African Regulatory Environment This aspect has been adequately dealt with in the Snowden report, and as there have been no changes in circumstances since the November report, the legislation will not be dealt with in the Technical Report. Should the reader require further information on this topic, reference is made to the Snowden report.
4.4.1 Royalty Bill The South African government has released a number of draft Royalty Bill revisions for comment commencing in March 2003, in October 2006 and more recently in November 2007. There is a modified Royalty Bill notice that was released during May 2008, but this has not been incorporated into the Technical Report. The November 2007 revision of the Royalty Bill proposes that a royalty would be payable on the following basis:
• Royalty Payable = (aggregate gross sales – allowable deductions) x Royalty Rate • The Royalty Rate is to be based on the following formula:
Earnings before interest, taxes, depreciation, amortisation x 100
Aggregate Gross Sales 12.5
8

Bloemhoek Project Technical Report– May 2008
This revision is different to previous versions that proposed a fixed royalty rate would be applied to the aggregate gross sales – the royalty rate would be different for each mineral. In the October 2006 revision, the royalty rate was 3% for unrefined gold and 1.5% for Uranium oxide (yellow cake). Due to the uncertainty of the progression of the Royalty Bill revisions, the Technical Report is based on a Royalty Rate of 1.5% of gross revenue for gold and uranium. The Royalty Bill is expected to be promulgated during 2008 and enforced from 01 March 2009.
4.5 Environmental Liabilities In accordance with the Mineral Resources and Petroleum Development Act of 2002 (MPRDA), all Environmental Management Plans (EMP’s) have been submitted to the DME together with financial guarantees for the project area for exploration activities. A comprehensive EMP has not been compiled for the Project area to consider exploitation and this aspect will form part of a future more detailed feasibility study.
4.6 Permitting Turnberry is satisfied that Wits Gold has all the necessary permits to conduct prospecting activities on the project area but no mining licence has been applied for nor issued for Bloemhoek.
9

Bloemhoek Project Technical Report– May 2008
5 ACCESSIBILITY, CLIMATE, ETC
5.1 Access The primary access to the Bloemhoek Project area is via National Highway (N1) from Johannesburg to Bloemfontein and to regional tarred roads (R73, R70 and R34) from the N1. This property is accessed by paved roads, all weather gravel roads and/or farm roads branching from these main routes.
5.2 Topography Wits Gold’s Bloemhoek Project is located almost exclusively on agricultural properties that are cultivated for maize or sunflowers or farmed with cattle or sheep. This Project occurs at an average elevation of 1300m above mean sea level and is slightly undulating with a peak elevation of 1360m above mean sea level. Vegetation at Bloemhoek is typically grassland with some trees along water courses. Grass species include Giant Spear grass (Trachypogon spicatus), Broadleaf Bluestem (Diheteropogon amplectens), Caterpillar Grass (Harpochloa falx), White Buffalo Grass (Panicum coloratum), Love grass (Eragrotis curvula) and Red grass (Themeda triandra). Wooded vegetation includes various species of Acacia.
5.3 Climate The Bloemhoek Project area falls with the dry Highveld grassland region of South Africa. The climate is typical of a continental plateau with a wide diurnal temperature range that reaches a maximum of 19 degC in the dry winter months. Winters are cold to mild with severe frost occasionally. Summers are hot and generally wet. Prevailing winds are predominantly northerly and northeasterly with the wind speed seldom exceeding 20kph. Summer temperature varies from 11 to 30degC whilst winter temperatures vary from 0 to 21degC. The average rainfall is 536mm with a maximum of 807mm and a minimum of 316mm. Thunderstorms are less frequent in the southern Free State with infrequent hail storms. Snowfalls have been recorded only once in the last 40 years.
5.4 Surface Rights Wits Gold does not have title to any surface rights in the Bloemhoek Project area. The Company owns a 42 hectare plot near Potchefstroom to the north where it stores all drill cores from Bloemhoek. It is understood by Snowden and Turnberry Projects that Wits Gold is allowed to utilise the surface of properties for which it has been granted Prospecting Rights, but only for activities necessary to prospect and mine for precious metals.
5.5 Infrastructure In the region surrounding the Bloemhoek Project, there is a large and well established mining industry, based on gold and uranium extraction. As a result, the infrastructure is well established with a network of highways and roads, electrical power lines, telephone and general communications systems, water networks and small towns. Equipment and services required for exploitation of minerals and mining projects are readily available with experienced and general labour also being available in the greater Free State area. Water is a scarce resource in the regional sense around Bloemhoek, but pipelines are available to deliver water to new mines.
10

Bloemhoek Project Technical Report– May 2008
Recently, electric power has been highlighted as a critical resource in South Africa with the national electrical power generator (ESKOM) being forced to restrict power supplies to the mining industry and commercial consumers. This has forced new mining ventures to consider the installation of alternative power generation capacity whilst waiting for grid power. This will add considerable capital expenditure as well as operating costs to all new ventures. It is unlikely that ESKOM power will be readily and reliably available in sufficient quantity to operate a future mine at Bloemhoek until after 2015.
11

Bloemhoek Project Technical Report– May 2008
6 HISTORY
The historical ownership, drilling and resource estimate for the Bloemhoek Project is adequately and appropriately detailed in the Snowden report. No mining has ever been conducted in the Bloemhoek Project area.
12
Bloemhoek Project Technical Report– May 2008
7 GEOLOGY OF THE BLOEMHOEK PROJECT AREA
The geological model and structural interpretation are based on the Snowden report dated November 2007. This Technical Report will repeat appropriate sections of the Snowden report for easier reference as required.
7.1 Regional geological setting of the Bloemhoek Project The Bloemhoek Project is part of the Southern Free State Goldfield which is situated in the Free State Province of central South Africa. Centred on the town of Virginia, it is approximately 284km by national road from Johannesburg. It is located in the southern closure of the Witwatersrand Basin where the economically important Central Rand Group is preserved in a northerly plunging synform.
7.2 Stratigraphy The rocks of the Karoo Sequence extend over the entire Bloemhoek Project area at surface. These strata vary in thickness from 45 m to 960m. Below the Karoo Sequence the stratigraphy of the Ventersdorp Supergroup shows considerable lateral variability across Bloemhoek. Within the eastern third of the project area this sequence is comprised of thick (up to 1 200m) coarse clastic sediments of the Platberg Formation. A strong unconformity at the base of the Platberg Formation locally removed the auriferous reefs along a small portion in the east - southeast of the project area. As the Platberg Formation thins, it is firstly underlain and eventually replaced by westwards thickening Klipriviersberg Lava that is up to 1 000m thick in the extreme west. The Ventersdorp strata are underlain by the economically important Central Rand Group of the Witwatersrand Supergroup, which comprises the Johannesburg and Turffontein Subgroups. In the Johannesburg Subgroup, five unconformity bounded sequences (UBS’s) have been recognised, with the Virginia Formation at the base, passing upwards into the St Helena, Welkom and Dagbreek Formations (Figure 3). The Harmony Formation, which hosts the prolific Basal Reef, sub-crops against the Dagbreek Formation to the north of Bloemhoek and is therefore not preserved in the project area. In the overlying Turffontein Subgroup, three UBS’s have been identified, with the lowermost Spes Bona Formation overlain by the Aandenk and Eldorado Formations (Figure 3). Gold and uranium bearing conglomerates are developed on the basal unconformities of each of these subdivisions, including the Leader Reef (Dagbreek Formation), the B Reef (Spes Bona Formation), the Kalkoenkrans Reef (Aandenk Formation) and the Beatrix/VS5 Reef (Eldorado Formation).
13

Bloemhoek Project Technical Report– May 2008
Figure 3 - Stratigraphic column for the Southern Free State Goldfields A three-dimensional reconstruction of the Central Rand Group stratigraphy in the Southern Free State Goldfield indicates a progressive southerly thinning of the sequence into the Bloemhoek Project area. This attenuation of the Central Rand Group is related to uplift during the latter phase of deposition in the Basin, causing erosion by superimposed, on-lapping unconformities. These erosional relationships and the resulting sub-cropping of strata are the primary control on the distribution of the four gold-bearing reefs within the Bloemhoek Project area. This resulted in the partial, and sometimes irregular, preservation of the Leader Reef, the B Reef and the Kalkoenkrans Reef within the project area while the Beatrix/VS5 Reef, occurring on the youngest of these unconformities, is extensively preserved.
7.3 Structural Geology The Beatrix/VS5 unconformity at the base of the Eldorado Formation is developed across the entire SOFS Goldfield and therefore represents a reference surface for the construction of a structural map of the area (Figure 4). The resultant structure contours indicate that the Central Rand Group is deformed in a broad syncline, with smaller parasitic folds marking the
14

Bloemhoek Project Technical Report– May 2008
southern limit of the prospective Witwatersrand Basin. This compression was responsible for active uplift towards the southern margin of the Goldfield that resulted in a complex interplay between a series of superimposed unconformity surfaces. Repeated erosion of the footwall sequences caused the incorporation of this detritus into the reefs overlying the unconformities. The northeasterly-plunging fold has been off-set by later normal faults related to the regional Platberg-age extensional event. The normal faults generally strike north-south, the most significant being the De Bron Fault, which has a relative down-throw of more than 1,000 m towards the west. The De Bron Fault forms the natural eastern boundary of the Bloemhoek Project area and also constitutes the eastern margin of the half graben within which the Platberg sediments accumulated. A series of smaller thrust faults, that cause only minor stratigraphic duplication in places, is also present. These thrusts may be related to the Merriespruit Thrust Fault which is a southerly-verging compressional structure that has an effective vertical displacement of 50m to 100m to the east of the De Bron Fault. The scale and distribution of the Platberg faults represent the structural event that most influences the economic potential of the Bloemhoek Project area. These structures divide the project area into 11 discrete domains in which the depth of the reefs occur between 1 300m and 2 400m below surface. The general high intersection rate of the reef in historic exploration boreholes is an indication that the degree of deformation within these main structural blocks is relatively low. The dip direction of the reefs is quite variable, but relatively shallow dipping at between 10º and 24º.
15

Bloemhoek Project Technical Report– May 2008
Figure 4 - Structural Geology and distribution of SOFS Projects
16

Bloemhoek Project Technical Report– May 2008
7.4 Sedimentology of the Conglomerate Reefs In the past, a number of exploration companies have assessed different parts of the SOFS Goldfield independently, resulting in the identification of up to eight different reefs. Since acquiring a complete set of this historical information, including the borehole core, Wits Gold has collated this previous work, and been able to observe the progressive stratigraphic and lateral reef variations across the Goldfield. This has resulted in a significant simplification of the geological model that now distinguishes only four reefs that can be regionally correlated within the SOFS area, including the Bloemhoek Project area.
7.4.1 Beatrix/VS5 Reef The Beatrix/VS5 Reef at the base of the Eldorado unconformity is the most widely developed gold-bearing reef zone within the Goldfield. It covers the whole of the Bloemhoek Project area except where it has been eroded along the axis of the Platberg graben immediately west of the De Bron Fault. Based on the revised geological model, it is now apparent that the VS5 and Beatrix Reefs represent facies variations that are time equivalents within the same braided alluvial system, characterized by broad open channels. These channels are 1 km to 2 km wide and trend northwest-southeast. The two main facies types overlying the Eldorado unconformity are controlled primarily by the erosion of the underlying Aandenk reefs. Consequently, the Beatrix Reef dominates areas beyond the sub-crop of the Aandenk Formation, where the Eldorado unconformity has eroded and incorporated the underlying Aandenk conglomerates. In this situation, the Beatrix Reef is characterized by large durable clasts and heavy minerals, including gold mineralisation derived from underlying oligomictic conglomerates characteristic of the Aandenk Formation. In areas where this erosion has not occurred, the highly polymictic VS5 conglomerates immediately overlie the Eldorado unconformity, where they tend to contain lower gold values that are generally less than 100 cm.g/t. The Beatrix and VS5 Reefs represent end members of this sedimentary model, whilst a transitional facies change is developed in the vicinity of the sub-crop of the Aandenk reefs. Based on these observations, which can be mapped as discrete geozones, the primary exploration target in the Bloemhoek Project area is the Beatrix Reef and its adjacent transitional phase.
7.4.2 Kalkoenkrans Reef Historically, the identification and lateral continuity of conglomerate reefs in the Aandenk Formation were poorly understood due to their irregular preservation below the Eldorado unconformity. These correlation problems resulted in the recognition of up to five different reefs in the Aandenk Formation, all of which were considered to be laterally discontinuous bodies. To address this uncertainty, Wits Gold has undertaken a re-evaluation of all of the available surface drill holes as well as published information from underground exposures at Beatrix No.4 Shaft. This has resulted in a simplified geological model that has correlated all of the lower Aandenk conglomerates with the Kalkoenkrans Reef. The distribution of the Kalkoenkrans Reef at Bloemhoek is a function of preservation below the overlying Beatrix/VS5 unconformity. The low angle of this unconformity (0.4º) as well as the channelling at the base of both the Beatrix/VS5 Reef and at the base of the Kalkoenkrans Reef has resulted in an irregular preservation pattern of the Kalkoenkrans Reef. The Kalkoenkrans Reef is preserved over large area over the southwest of Bloemhoek where the Aandenk Formation may be up to 8.3 m thick and in a small area in the north-eastern extreme of the Project area. The lateral variability in the characteristics of the Kalkoenkrans Reef can now be related to channel development at the base of the reef, a situation that has been recognised in the adjacent mining operation at Beatrix No.4 Shaft. The recognition of the lateral continuity of the Kalkoenkrans Reef, albeit with some internal variation due to channelling, has significantly elevated the importance of this reef at Bloemhoek.
7.4.3 B Reef These polymictic conglomerates overlie an unconformity at the base of the Spes Bona Formation. The B Reef is preserved only in the northeastern extreme of the Bloemhoek
17

Bloemhoek Project Technical Report– May 2008
Project area. Regionally, the B Reef is one of the most unpredictable reefs, due to its variable geological characteristics as well as gold content. Over short distances it may vary from a barren pebble lag to a thick (up to 3m) coarse conglomerate with spectacular gold values. Generally, high gold values are associated with the presence of large, rounded pyrite grains and carbon. The variability of this reef is generally attributed to narrow, often deeply incised, channels that can only be delineated by dense drilling or with underground on-reef development. The B Reef, due to its very limited preservation and geological variability, has very limited gold resource potential in the Bloemhoek Project area and consequently has not been considered in the Technical Report.
7.4.4 Leader Reef The Leader Reef is a tabular body at the base of the Dagbreek unconformity that is only preserved over the northern portion of the SOFS Goldfield, where it sub-crops against either the Eldorado or Aandenk unconformities. It is present over roughly the northern 40% of the Bloemhoek Project area. The lower portion of the Dagbreek Formation is generally characterized by interbedded lithic proto-quartzites, conglomerates, pebbly quartzites and scattered pebble zones that may be several metres thick. These conglomerates are typically oligomictic with medium to small quartz and chert pebbles. Elevated gold values above 500cm.g/t are generally associated with cumulative conglomerate thicknesses of greater than 50 cm which contain flyspeck carbon. These facies conditions are not generally developed within the Bloemhoek Project Area, but fairly substantial areas have moderate mineralisation of between 300cm.g/t and 450cm.g/t. Two distinct stratigraphic zones of conglomerate were historically recognised in this area, where they were locally known as the Leader and Upper Leader Reefs. Based on recent work by Wits Gold, it is apparent that the upper conglomerate bands are relatively lenticular, whereas the underlying Leader Reef is a continuous unit comparable to the body that has been exploited over large areas of the Free State Goldfield. The Leader Reef is considered at best to make a modest, secondary contribution towards a multi-reef mining operation. It has consequently been modeled to be exploited only towards the end of the life of mine in the Technical Report.
7.5 Water Potential To date, the historic geological drilling by previous companies and subsequent drilling conducted by Wits Gold, has encountered significant ground water. The mining operations in the Southern Free State likewise have significant fissure water production. It is thus reasonable to assume that underground water will be a concern to any producing mine on this property. This will need to be confirmed during a future feasibility study phase of the project.
18
8 DEPOSIT TYPE
Gold and uranium deposits in the SOFS Goldfield and in the Project area are hosted by quartz-pebble conglomerates developed on laterally continuous unconformity surfaces. These reefs are generally characterised by shallow dips of between 10 and 25 degrees and a thickness of 100cm to 250cm that make them suitable for exploitation by means of typical narrow stoping techniques. However, central to the establishment of any mining operation within the Wits Gold project area (such as Bloemhoek) is the delineation of sufficiently large areas of laterally continuous bodies of economically mineralised conglomerate. Geometrically, Witwatersrand reefs can be classified into two broad end-members, related to the original sedimentary environment within which they accumulated. The first type comprises tabular reefs which have continuous sheet-like conglomerate developed over large areas. These conglomerates are typically overlain by orthoquartzites and are believed to have been deposited in braided rivers that were subsequently reworked during marine transgressions. Examples of these reefs are the Beatrix and Leader Reefs in the SOFS Goldfield. These tabular reefs present the economically most attractive ore bodies due to their blanket extractability and they consequently represent the primary exploitation targets within the Wits Gold project areas. The second reef type is channelised and is represented by less regular conglomerates. These channelised deposits generally have fair continuity parallel to channel axes but tend to be discontinuous across the paleo-transport direction. These channelised reefs can be mined selectively, but rarely have the potential to support a mining operation on their own. The Kalkoenkrans and B reefs at Bloemhoek are typical of these channelised deposits. This Technical Report and the view of Wits Gold is that the channelised reefs are potentially important supplementary contributors in a multi-reef operation where they are mined from the same development as has been established for the tabular reefs.
19

9 MINERALISATION
Three primary reef horizons containing gold and uranium are developed on well-defined regional unconformities in the Bloemhoek Project area. These include the Beatrix, Kalkoenkrans and Leader Reefs, all of which have been mined extensively in the Southern Orange Free State. Of these the Beatrix Reef is the most widely developed conglomerate where it is the principal orebody at the Beatrix and Joel Gold Mines. Above the Eldorado unconformity, there is a strong facies control on the distribution of gold mineralisation. Consequently, the polymictic VS5 Reef is poorly mineralised and has not been intensively prospected, as it contains gold values that are very seldom above 200cm.g/t. In contrast, the oligomictic Beatrix Reef facies contains the highest gold values that generally range between 250 and 1500cm.g/t. Similarly, the basal mature phase of the Transitional Reef facies also have elevated gold values, ranging between 300 and 1 200cm.g/t. Optimum gold grades usually occur within the lower 100cm to 150cm of the Beatrix and Transitional Reefs. The Leader, B and Kalkoenkrans Reefs all sub-crop against the Beatrix/VS5 unconformity. This unconformity is channelised, so sub-crop patterns are complex. The erosion and reworking of underlying reefs is believed to play a strong role in controlling the gold and uranium mineralisation in the Beatrix Reef. Consequently, gold mineralisation increases south of the respective sub-crops, as the Beatrix Reef becomes more oligomictic due to re-work of the underlying material. This coincides with the development of Transitional Facies and Beatrix Reef facies. An extensive region of high gold values occurs in the Kalkoenkrans Reef over the eastern portion of Beatrix No.4 Shaft, where the mineralisation is associated with channel conglomerates. These conglomerates are the current focus of mining from Beatrix 4 Shaft. In the adjacent Wits Gold project areas a northwest-southeast strip of higher gold values occurs through the central portion of the Bloemhoek area. Vertically within the reef zone, the highest gold grades invariably occur in the basal conglomerate. Flyspeck carbon may be present and is particularly common close to the De Bron Fault. The B Reef contains erratic gold mineralisation, with conglomerate development and higher gold grades relating to areas of narrow, deeply incised channelling. Generally, higher gold grades are associated with the presence of large rounded pyrite grains and carbon, but there is no consistent control on the vertical or lateral distribution of these features. The Leader Reef has been mined extensively at Harmony Gold Mine, although there is a regional southwesterly decrease in gold content to between 250 and 500cm.g/t. The Leader Reef is typically bottom loaded with respect to both gold and uranium mineralisation over the lower 100cm. The best grades are related to thick conglomerate development and the distribution of flyspeck carbon. All three reefs contain uranium bearing minerals, although the quantities are regarded as uneconomic at current price levels and this has not been included in this Technical Report valuation model. This may be reviewed during future studies.
20

10 DRILLING
From 1947 to 2004, a total of 36 diamond boreholes were drilled in the Bloemhoek Project. Most of this drilling was completed by Anglo American during the 1980’s, when the gold-bearing reefs were intersected at depths ranging between 1300 m to 2400 m below surface. The resulting core together with the assay information was subsequently acquired by the Harmony JV in a transaction that involved the purchase of the Freegold mining rights from Anglo American in the Free State Goldfield. The diamond drill core and records were acquired by Wits Gold from the Harmony JV in terms of a legal agreement signed on 29 April 2004. Since August 2006, two additional boreholes, DBH 18 and DBH 19 have been drilled by Wits Gold.
Figure 5 - Bloemhoek Project Area – yellow area with proposed Bloemhoek Shaft
The railway line shown on Figure 5 coincides closely with the De Bron Fault that forms the geological boundary between the Bloemhoek Project and the De Bron Project areas.
21

11 EXPLORATION RESULTS
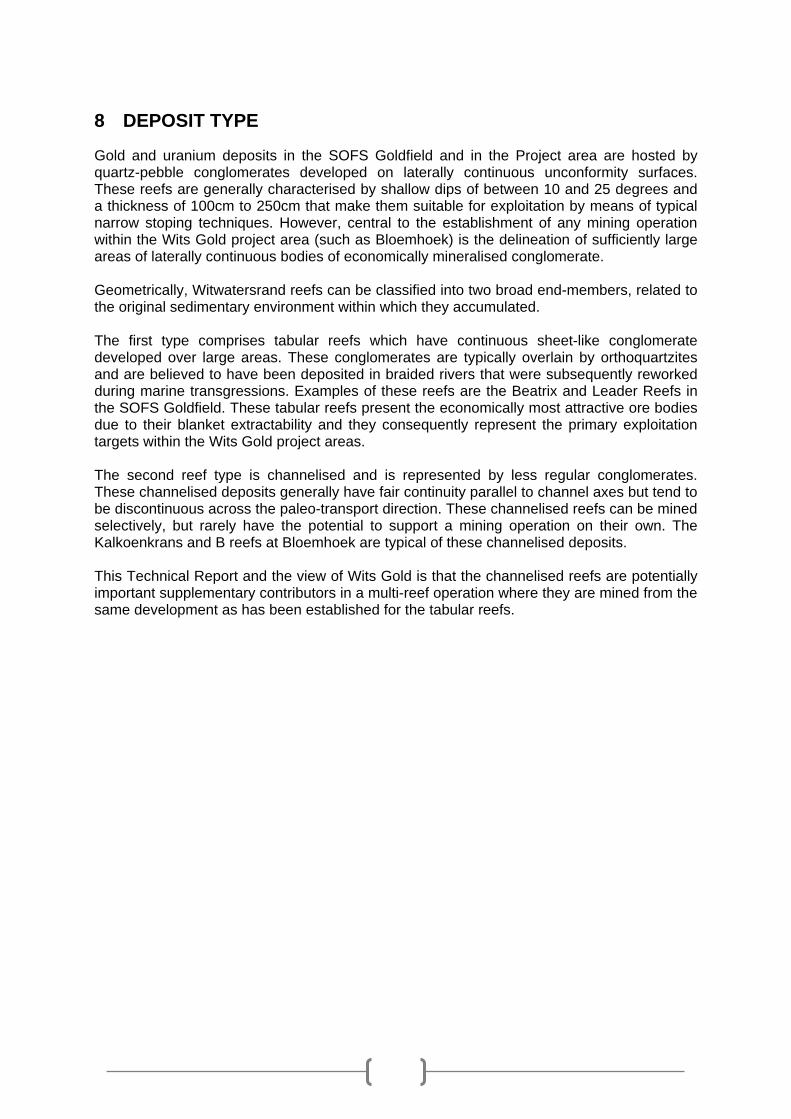
. Diamond drilling has indicated that the Bloemhoek Project covers an irregular east-west area extending across the axis of the large north-easterly plunging syncline that forms the southern closure of the Witwatersrand Basin (see Figure 4). The distribution of the four primary auriferous reefs in this Project area, namely the Beatrix/VS5, Kalkoenkrans, B and Leader Reefs is controlled by the southwards on-lapping arrangement of the associated Eldorado, Aandenk, Spes Bona and Dagbreek Unconformities (see Figure 4). The Beatrix / VS5 Reef zone is prevalent over the entire area at depths ranging between 1 300m and 2 400m below surface. The most continuous gold mineralisation above 300cm.g/t occurs within the Beatrix Reef in the eastern third of the Project area (see Figure 6). The underlying Kalkoenkrans Reef has an irregular distribution throughout the SOFS Goldfield due to channelling. However, it is most continuously preserved over the central portion of the Bloemhoek Project area (see Figure 7) where it represents an important supplementary gold resource. The Leader Reef is preserved below the Eldorado unconformity over the northern 40% of the Bloemhoek. Consequently, these three conglomerates, namely the Beatrix, Kalkoenkrans and Leader Reefs are considered to represent the principal geological resource in the Bloemhoek Project. The Upper Leader generally contains gold values lower than the 300cm.g/t Au cut-off, whilst the B Reef is only preserved in the northeastern extreme of the area and therefore has limited tonnage potential.
22
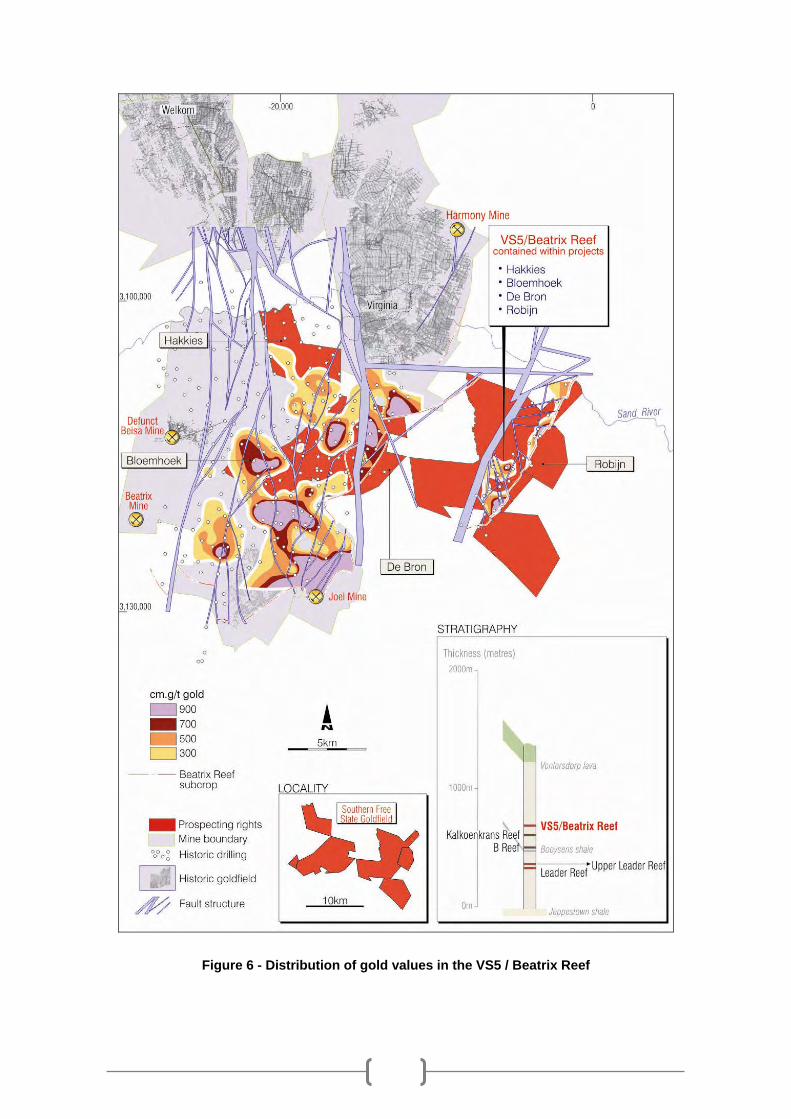
Figure 6 - Distribution of gold values in the VS5 / Beatrix Reef
23
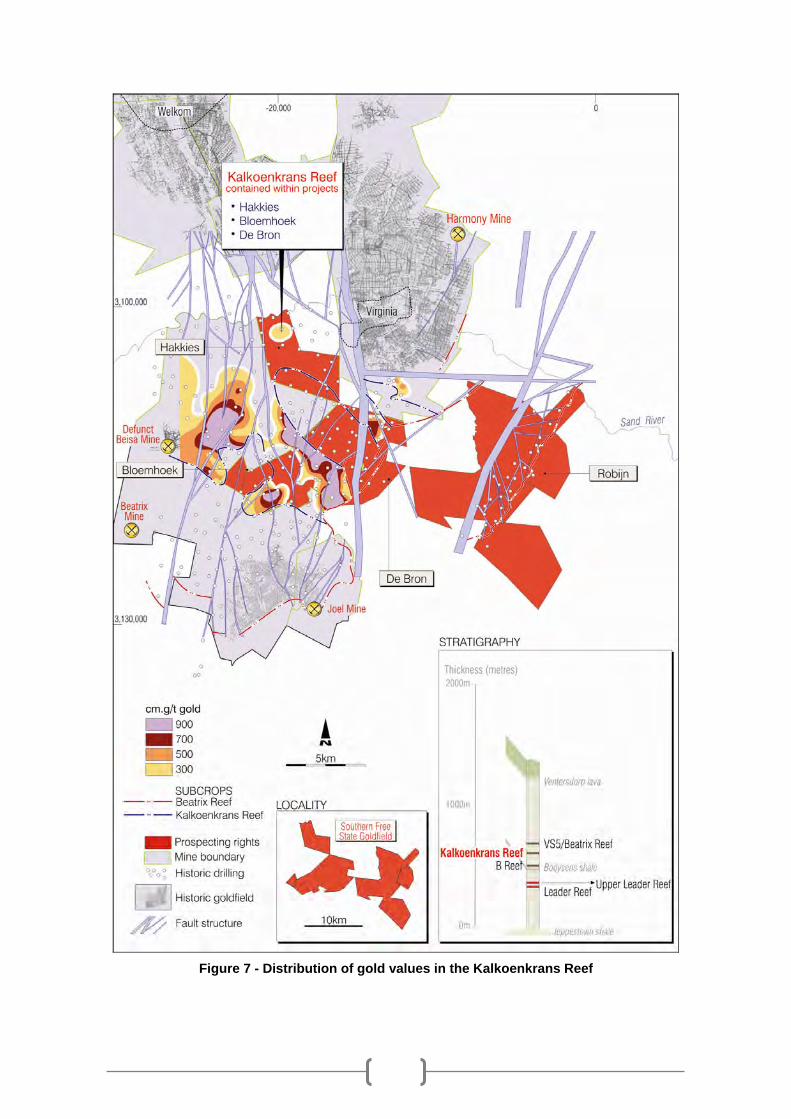
Figure 7 - Distribution of gold values in the Kalkoenkrans Reef
24
Figure 8 - Distribution of gold values in the B Reef
25

Figure 9 -Distribution of gold values in the Leader Reef
26
12 SAMPLING METHOD AND APPROACH
A standard policy was adopted by Anglo American in the sampling of all of the recognised Witwatersrand reefs in the Bloemhoek Project. A similar protocol has been employed by Wits Gold, although the mark up of the core samples and cutting are conducted at the Company’s facility in Potchefstroom. The general procedure was applied by Anglo American as follows: 1. The stratigraphy intersected in a borehole would be continuously monitored by the
Project Geologist who would inform the drilling supervisor of the anticipated depth of the target reef or reefs. When the designated depths of individual reef zones were drilled, the 6 m core barrel would be pulled out and left unopened by the drill crew.
2. On arrival at the drill site, the Project Geologist would open the core barrel and remove the core. The reef depths (top and bottom) would be marked, the core placed in new cardboard core boxes and removed from site by the Project Geologist. The core would then be transported to the regional exploration office.
3. The Exploration Manager would confirm the identification of the reef and recorded depths. The Project Geologist would complete a 1:10 scale detailed log of the reef intersection and prepare a sampling sheet. The core would be marked for sampling.
4. A midline would be drawn along the core, perpendicular to the dip as indicated by the basal contact of the reef. Samples would then be marked out to no less than 15 cm, and not more than 50 cm in length. The sample containing the basal contact of the reef would include 2 cm to 5 cm of footwall rock, and the sample containing the upper contact would include 2 cm to 5 cm of hanging wall rock.
5. At least two samples above and two samples below the reef would be included in a batch of samples.
6. Individual samples would be numbered from the base upwards to ensure that the two barren footwall samples would pass first through the laboratory analytical system.
7. The numbering system used would be unique to the exploration office concerned with no duplication of sample numbers.
8. The Project Geologist would transport the core to Head Office in Johannesburg. There the Consulting Geologist would examine it on arrival and the reef correlation would be verified, together with a preliminary evaluation on the acceptability of the intersection.
9. The Project Geologist would then split the core lengthwise along the dip line with a diamond saw. Sample numbers would be recorded on both halves of each sample.
10. The Consulting Geologist would again check the core and a representative half selected for analysis. The same half would be used throughout the length of the intersection. A final decision on the acceptability would be made, and signed for by the Consulting Geologist based on the following: o Geological Acceptance. No faulting, excessive veining or other geological
disturbance of the reef evident. o Physical Recovery. No chips missing, carbon seams intact, core not shattered or
ground. 11. The samples would be individually bagged by the Project Geologist and placed in
sealed batches for transport by Head Office staff to the analytical laboratory. The sampling sheets would be completed with the relevant batch numbers, sampling numbers and signatures and copies for both the exploration centre and Head Office.
27

13 SAMPLE PREPARATION, ANALYSES, AND SECURITY
All of the samples from the boreholes in the Bloemhoek Project were assayed at Anglo Research Laboratories, a facility that is still used by Wits Gold. As standard procedure, gold is determined by the fire assay fusion method that heats a mixture of the finely pulverised ore with a flux until the product reaches a fluid consistency. The object of this fusion is to convert the gangue of the ore into a slag, whilst the precious metals form a lead-gold-silver alloy. The gold and silver contents of the original sample are separated from the alloy by means of cupellation that oxidises the lead at 960°C to 1,000°C in a furnace. The silver component is removed from the precious metal prill by digestion in nitric acid prior to weighing. The mass of the remaining gold prill is measured using an electronic mass balance (gravimetric method) or an AA (atomic absorption) or ICP (inductively coupled plasma optical emission spectroscopy) technique. In verifying its own assay results generated from the current drilling exercise, Wits Gold routinely graphs the results from the certified standards for comparison with the accepted “between laboratory” recommended concentration. All new assay information is validated by Snowden prior to addition into the database. In addition to the external QA/QC implemented by Wits Gold, Anglo Research Laboratories have developed internal quality control procedures. Barren quartz material is milled between batches to avoid contamination. For each tray of samples processed blanks, certified reference material and duplicates are included for internal quality control.
28
14 DATA VERIFICATION
In 2005 and 2007 staff of Snowden visited the Wits Gold site office where borehole core from the SOFS Goldfield was being logged. The logging and sampling procedures were discussed and reef intersections from the SOFS Goldfield were examined. The construction of the updated geological model for the SOFS Project was examined on a hole-by-hole basis. No major discrepancies between the drillholes and the geological model were identified. Staff of Snowden visited the De Bron and Bloemhoek Projects on 22 August 2007, when a reef intersection on DBH19 was observed being extracted from the hole and retrieved from the core barrel by the geologist in charge. Drilling is conducted under appropriate safety conditions and sound environmental management as required by drilling permits. The site was well established, and very well organised. Snowden reviewed with Camden Geoserve the Wits Gold drilling, core handling, description and sampling procedures. Snowden is satisfied that all procedures are conducted according to industry standard practices. Snowden is of the opinion that the quality of the current exploration database for the De Bron and Bloemhoek Projects is sufficient to allow reasonable interpretation of the lateral continuity of the gold-bearing reefs. Snowden is satisfied that the sample security procedures are adequate - mineralised intersections are kept in a locked storage room at Wits Gold’s Potchefstroom core yard facility. In the opinion of Snowden, the sampling and assaying data acquired since 2004 is considered of sufficient quality for the purpose of resource estimation. Snowden recommends additional quality assurance and quality control measures designed to improve the accountability and integrity of assay data. In particular, Snowden recommends that core sample blanks are inserted within reef intersection samples and that approximately 10% of random sample pulps are submitted with control samples to an umpire laboratory for re-assaying.
29

15 ADJACENT PROPERTIES
Based on information contained in the 2005, 2006 and 2007 annual reports published by Harmony and Gold Fields it is evident that most of the mines in the Southern Free State Goldfield are shallow by Witwatersrand standards as their reserves are generally less than 2 500m below surface. To the north of the Sand River, the mines are now managed almost exclusively by Harmony with most of the operations exploiting the Basal Reef, although supplementary resources are provided by the Leader, Middle, A and B Reefs. This applies to the Bambanani Mine as well as to the Merriespruit section of Harmony Gold Mine, both situated immediately to the north of the Prospecting Rights granted to Wits Gold. However since the sub-crop of the Basal Reef coincides quite closely with the surface position of the Sand River, the two mining operations to the south of the Sand River are working stratigraphically higher reef bands. These include the Beatrix Mine operated by Gold Fields and the Joel Mine managed by Harmony (Figure 11), both situated in the extreme southern closure of the Central Rand Basin. These mines were originally founded on reserves on the Beatrix Reef at the base of the Eldorado Formation, although in the west, the Beatrix No.4 Shaft is also mining the Kalkoenkrans Reef that is a mineralogically more mature facies of the BPM. Based on current production levels, and without the conversion of resource to reserve, the current life of mine models for these operations suggest that some of them are likely to continue working for at least 10-15 years.
Mine Shafts Established Gold
Production (oz/yr)
Average Grade
(g/tonne)
Cash Costs (ZAR/tonne)
Cash Cost ($US/oz)
Life of
Mine Beatrix 1, 2, 3 1985 543,505 4.7 432 377 34 Beatrix 4 1987 Included in above Joel North 2005/6 58,595 4.20 426 498 7 Joel South 1988 Included in above Merriespruit 1 1 1956 48,069 3.60 373 501 12
Merriespruit 2 3 1956 43,691 3.00 340 554 5
Table 1 - Annual Production statistics to December 2006 for Neighbouring Mines
It should be noted that the QP’s were unable to verify the geological and production information from the adjacent properties and that it is not necessarily indicative of the mineralisation in the Bloemhoek Project.
30

16 MINERAL PROCESSING & METALLURGICAL TESTING
16.1 Metallurgical Testwork No metallurgical test work has been conducted on the different reefs from Bloemhoek, but as a result of the consistency of the metallurgical performance reported from the neighbouring mines and the Free State mines in general, it is fair and reasonable to expect that a high gold recovery across the gold plant of 95% may be achieved. These reefs also contain significant quantities of uranium with a potential plant feed grade averaging 100ppm. However, this diluted grade is regarded as too low to consider being economically attractive, since the principal reefs contain less than this grade for the majority of the life of the mine. Therefore, the processing of uranium has not been considered appropriate for Bloemhoek, although this conclusion will need to be tested during any future project phase. The annual expected feed grade for uranium is shown in Figure 10 which indicates that for many years, the uranium grade is below the economic cut off of approximately 100ppm.
0.00
20.00
40.00
60.00
80.00
100.00
120.00
140.00
Uranium Grade (ppm)
Figure 10 - Estimated Uranium Head Grade
16.2 Metallurgical Processing The reefs from the Bloemhoek underground mine will require standard metallurgical processing to recover the contained gold. Preliminary mineralogical studies suggest that the Bloemhoek reefs are similar to those of neighbouring mines and thus conventional gold processing using cyanide will be applicable. More details on the process plant are reported in Section 19.4 of this Technical Report. Uranium will not be recovered from this project and therefore no process description will be included in the Technical Report, although this decision may need to be reviewed as metal prices change.
16.3 Future Requirements Only limited mineralogical examination of the geological core from the current drilling campaign at Bloemhoek has been conducted to date. Consequently, there is no clear indication of the likely metallurgical performance from a possible Gold Plant to be located at
31

Bloemhoek. In addition, no metallurgical test work has been conducted on any of the produced geological core. It is necessary that during the next phase of the project, further mineralogical and metallurgical examinations should be conducted to verify the assumed similar performance to neighbouring or district gold recovery plants.
32
17 MINERAL RESOURCE ESTIMATE
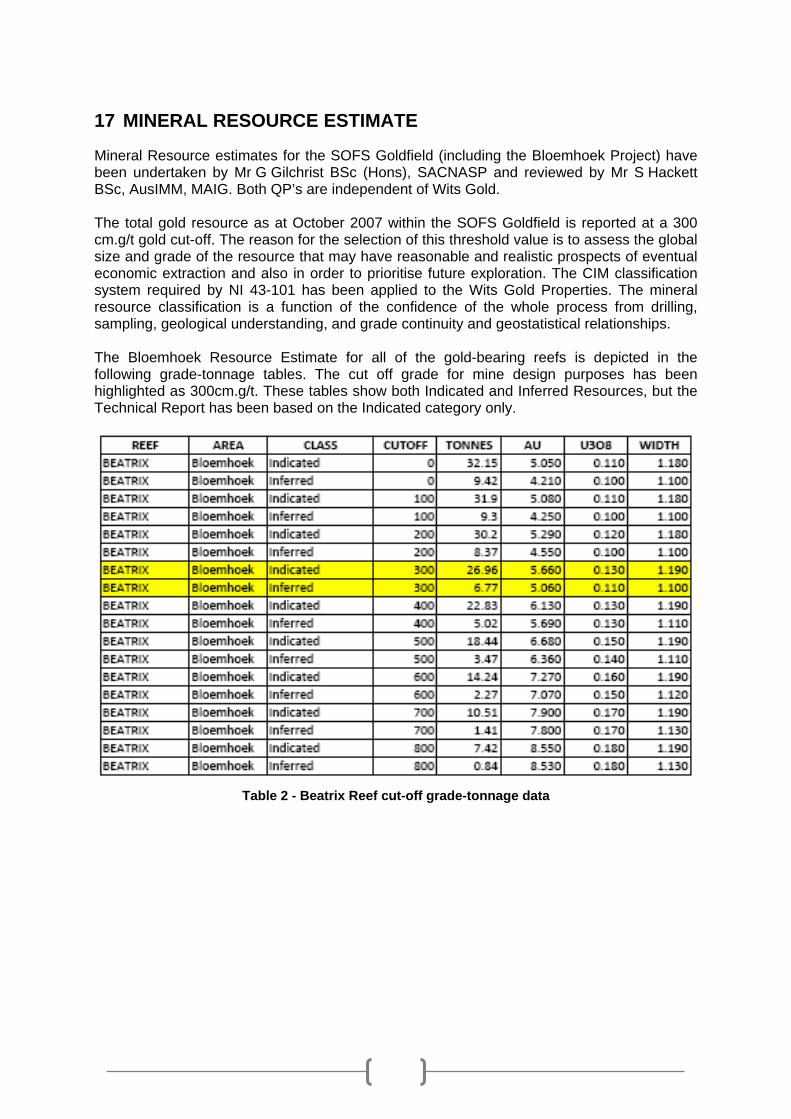
Mineral Resource estimates for the SOFS Goldfield (including the Bloemhoek Project) have been undertaken by Mr G Gilchrist BSc (Hons), SACNASP and reviewed by Mr S Hackett BSc, AusIMM, MAIG. Both QP’s are independent of Wits Gold. The total gold resource as at October 2007 within the SOFS Goldfield is reported at a 300 cm.g/t gold cut-off. The reason for the selection of this threshold value is to assess the global size and grade of the resource that may have reasonable and realistic prospects of eventual economic extraction and also in order to prioritise future exploration. The CIM classification system required by NI 43-101 has been applied to the Wits Gold Properties. The mineral resource classification is a function of the confidence of the whole process from drilling, sampling, geological understanding, and grade continuity and geostatistical relationships. The Bloemhoek Resource Estimate for all of the gold-bearing reefs is depicted in the following grade-tonnage tables. The cut off grade for mine design purposes has been highlighted as 300cm.g/t. These tables show both Indicated and Inferred Resources, but the Technical Report has been based on the Indicated category only.
Table 2 - Beatrix Reef cut-off grade-tonnage data
33

Table 3 - B Reef cut-off grade-tonnage data
Table 4 - Kalkoenkrans Reef cut-off grade-tonnage data
34
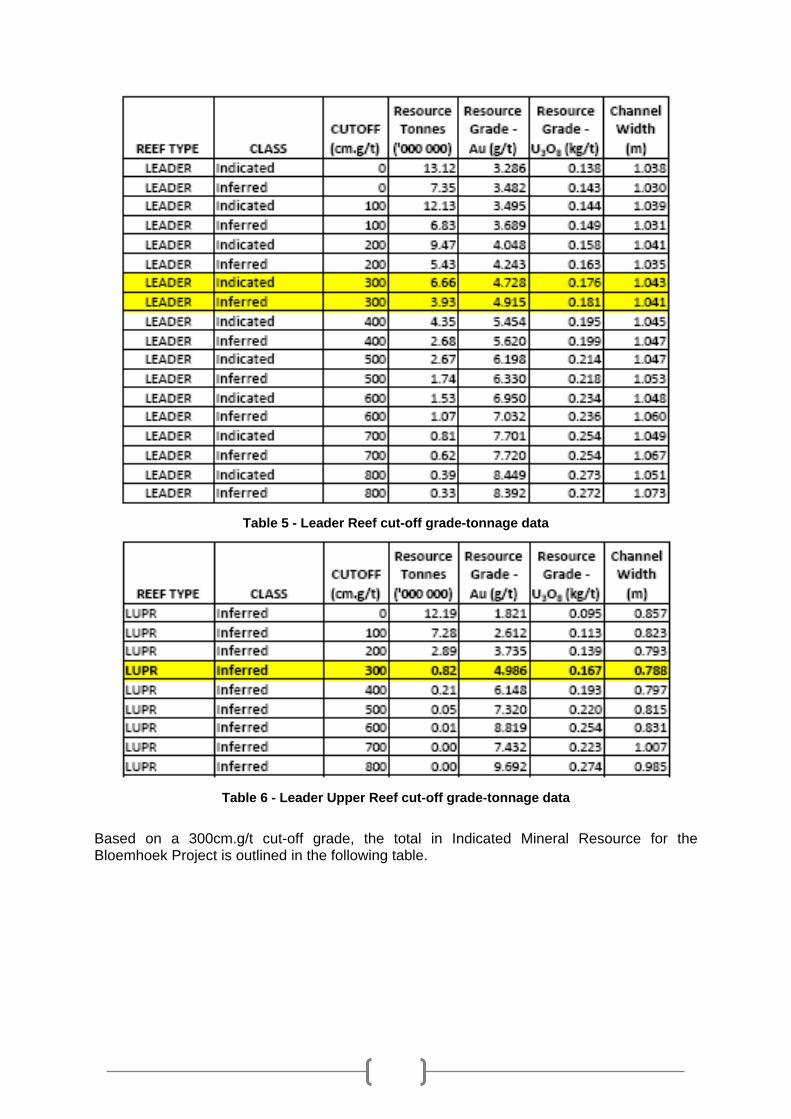
Table 5 - Leader Reef cut-off grade-tonnage data
Table 6 - Leader Upper Reef cut-off grade-tonnage data
Based on a 300cm.g/t cut-off grade, the total in Indicated Mineral Resource for the Bloemhoek Project is outlined in the following table.
35

Table 7 – Indicated Mineral Resource at a 300cm.g/t Au cut-off
36

18 OTHER RELEVANT DATA AND INFORMATION
Turnberry Projects is not aware of any other relevant data or information that are not already presented in this Technical Report.
37

19 ADDITIONAL REQUIREMENT FOR TECHNICAL REPORTS
19.1 Resource to Production Conversion The resource as defined in Table 7 represents an in situ resource at a cut-off grade of 300cm.g/t Au. These data have been modified to accommodate the dilution due to mining factors by applying reasonable industry standard modifying flow of ore factors as defined in Section 19.2.10 of this Technical Report. These factors include a 15cm addition for stoping and a further 10% for tramming. The subsequent tonnages and diluted grades (Table 8) have been used in the production scheduling in the mining section of the Technical Report. Consequently the modified resource to be delivered to the gold plant is depicted in the following table.
Table 8 - Bloemhoek Resource modified by the Mine Flow Factors
The mine design is based on the Indicated Resource as shown in Table 8 under the column labelled ‘MCF Effect’. This amounts to 65.64 million tonnes of reef at a grade of 4.805g/t gold and 0.1kg/t uranium. It must be noted that no additional losses have been incurred from the resource tonnage depicted in Table 7 to that shown above. This is based on significant geological losses being incorporated into the geological model as well as the ‘tonnage loss’ with the selection of the cut-off grade at 300cm.g/t. The above available tonnage to mine is regarded by the Qualified Persons as a reasonable estimate for Technical Report purposes.
19.2 Conceptual Mine Design A number of potential options were considered for the Technical Report but were rejected in favour of a twin shaft access into the central portion of the Bloemhoek Project area as being the most viable. Other options will be considered during future study phases. The selected option may not be optimal but is regarded by Turnberry Projects as a fair and reasonable approach to the exploitation of the Indicated Resource. The project area is detailed in Figure 11 showing the surface location in relation to other mining properties in the area.
38
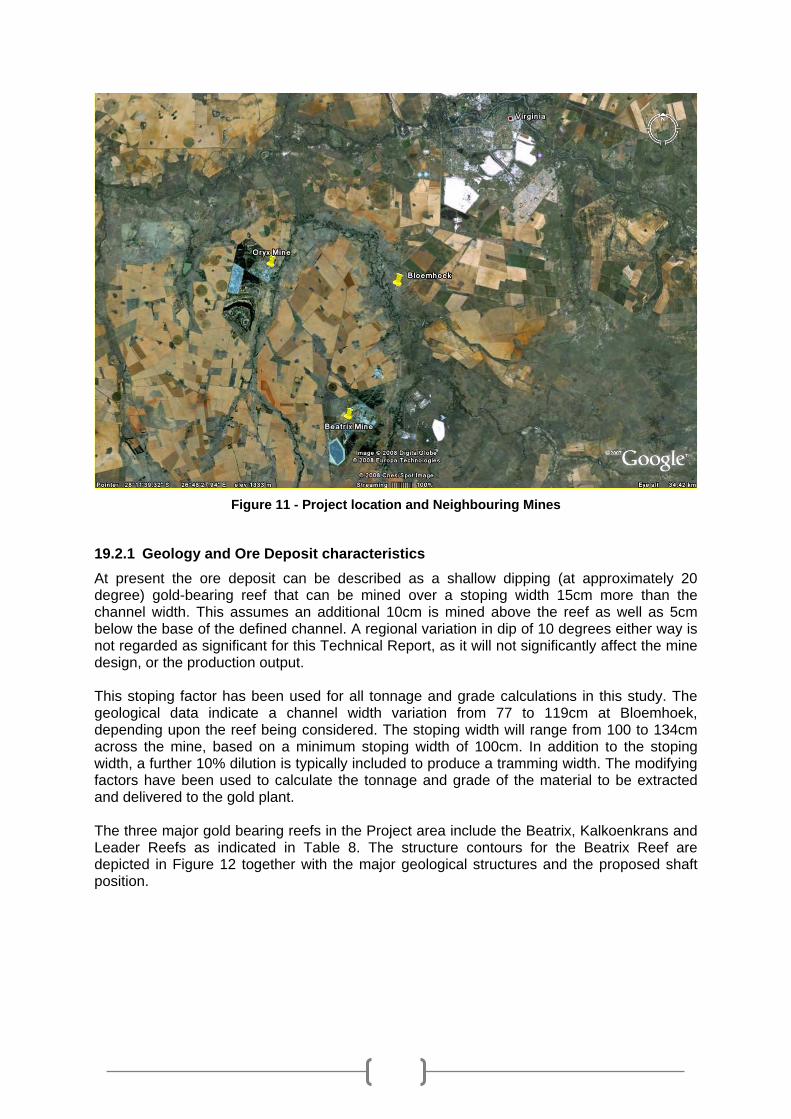
Figure 11 - Project location and Neighbouring Mines
19.2.1 Geology and Ore Deposit characteristics At present the ore deposit can be described as a shallow dipping (at approximately 20 degree) gold-bearing reef that can be mined over a stoping width 15cm more than the channel width. This assumes an additional 10cm is mined above the reef as well as 5cm below the base of the defined channel. A regional variation in dip of 10 degrees either way is not regarded as significant for this Technical Report, as it will not significantly affect the mine design, or the production output. This stoping factor has been used for all tonnage and grade calculations in this study. The geological data indicate a channel width variation from 77 to 119cm at Bloemhoek, depending upon the reef being considered. The stoping width will range from 100 to 134cm across the mine, based on a minimum stoping width of 100cm. In addition to the stoping width, a further 10% dilution is typically included to produce a tramming width. The modifying factors have been used to calculate the tonnage and grade of the material to be extracted and delivered to the gold plant. The three major gold bearing reefs in the Project area include the Beatrix, Kalkoenkrans and Leader Reefs as indicated in Table 8. The structure contours for the Beatrix Reef are depicted in Figure 12 together with the major geological structures and the proposed shaft position.
39

Figure 12 – Structure contours for the Beatrix Reef and the proposed shaft position
The Kalkoenkrans Reef has a higher in situ gold grade of 8.89g/t relative to the Beatrix Reef with 5.66g/t and the Leader Reef with 4.73g/t. However, the Technical Report has been based on mining the average grade from the Kalkoenkrans and Beatrix Reefs with the
40

Leader Reef being mined in the latter phase of the Life of Mine. No detailed mining plan of the three individual reefs has been developed, instead they are assumed to be a single reef for modelling purposes at this level of study. This is regarded as a reasonable assumption at this stage, although it is an oversimplification of the geology. Only with a detailed three dimensional geological model can appropriate mine planning of the Project area be completed to estimate the full production capability of the Project. The ore deposit is deformed by several major faults breaking it up into discrete blocks (estimated at 11 by geological interpretation), each of which may require separate access development as well as mining and engineering infrastructure. However, this possibility has not been included in this Technical Report, apart from the deeper northerly section of the ore body, which will be accessed by a multiple decline system. The geological and mine models presented in this report may change in some of the details but they are likely to remain valid as far as predicting the overall nature of the ore deposit and the infrastructure required to exploit it. The Mineral Resource which forms the basis for this Technical Report is categorised as an Indicated Resource, but as it is not a Reserve appropriate caution still needs to be applied to results of this Technical Report. Based on the size of the resource and the requirement for a long life mine plus current production rates achieved by comparable shaft complexes, it is proposed by Turnberry Projects that the production rate for Bloemhoek be 200 000 tonnes per month. It has not been proven that the ore body can sustain this level of production, but it is regarded as reasonable to expect this to be achieved, considering the number of production levels on the mine. This production rate will need to be confirmed with detailed geological modelling and more intense mine planning. It is anticipated that between 40 and 60 000 tonnes per month of waste will be generated in addition to the 200 000 tonnes per month of reef.
19.2.2 Surface considerations As there is no surface outcrop and the shallowest reef occurs 1 300m below surface, a twin shaft complex will be required to access the ore body. This means that the necessary surface infrastructure required for a conventional underground mine will be required with approximately 400 hectares for the shaft, general infrastructure and plant plus an additional 250 hectares for the tailings dam. A number of surface drainage channels occur in the Bloemhoek Project area and these need to be avoided when locating the surface infrastructure. Flood lines will need to be developed for the Project area during the full Environmental Impact Assessment (EIA) process, but for this study, a distance of 100m from the centre line of any drainage channel or indicated ‘swamp’ area has been assumed as a potential flood plain. The site chosen in this study for a vertical shaft to best exploit the resource is positioned in the centre of the ore deposit. This occurs in a lower grade portion of the ore body and does not present any surface complications. The surface rights are not currently owned by Wits Gold but by local farmers and are therefore subject to negotiation. The shaft location is marked on Figure 11. The surface prospecting area and the location of the shaft is also depicted in Figure 12.
19.2.3 Access to Ore Deposit As the shallowest portions of the ore deposit are some 1 300 metres below surface, the option to access the ore deposit via a decline system has been rejected as inappropriate since such a decline would have to be more than 8 000 metres long. The only alternative will be to access the mining blocks as quickly as possible, and this will be via a twin surface shaft system.
41

Primary access to all parts of the mine is to be provided by the twin vertical shaft system down to approximately 2000 metres below surface. This depth allows for the use of proven and readily available winding plant. In addition, the ore body dictates that at the selected location, a 2 000m deep shaft will provide access to sufficient reef to achieve the planned output. This may be reviewed during subsequent studies. The shaft system will have intake and return air facilities that will support production of 200 000 tonnes per month of reef. The Main Shaft will be 8.6 m in diameter and will have two Man Winders and one Service Winder, whilst the brattice walled Ventilation Shaft will be 8.6 m in diameter and have one Rock Winder and one Service Winder that will be used as the second outlet from the mine. The shaft sizes have been selected to suit the ventilation requirements of the mine as detailed in Section 19.2.8. This winder configuration may change to reduce the risk to the Project with an additional rock winder potentially being installed The shaft system is to be situated to the southeast of the centre of the ore deposit, to allow the shaft to be located in an un-pay zone and to allow early access to possible high grade reef zones, although this has not been included in the production schedule. A shaft pillar of 250 m radius will be left and possibly extracted at the end of the shaft’s life, subject to gold price. These dimensions must still be verified by normal rock engineering processes but are considered fair and reasonable. The shaft will have multiple access levels to the ore body from ten levels. Each of the levels accessing the respective mining districts will be developed from the Main Shaft. The deeper northerly section will be accessed by establishing a triple decline system (main decline 4.5m wide x 5m high) from 228 Level to 288 level. The top of the decline system will be approximately 2 000 m from the shaft system. For the purpose of this Technical Report, it is assumed that all blocks will be exploited by conventional haulages from the shaft or decline within the block. Development of the declines will be done using LHD’s to the tip positions on the lowest shaft level. The service declines will not initially be equipped with winders or rails but will be large enough to accommodate chairlifts and LHD’s. The air flow down the declines will be a limiting factor to production from the northern block.
19.2.4 Shaft Configuration The twin shaft system will be developed to a depth of 1 981.2 metres below surface. The shaft will be located at 1 320m amsl or 508.8m below datum (datum is 6 000 feet above mean sea level or 1 828.8m elevation) The 20 degree dipping nature of the reef results in a level spacing in the shaft of 60 metres, such that the raise lengths in the stoping horizon will be about 200 metres. Analysing the data in Table 9, the first level in the shaft will need to be at about 645 metres below surface (Level 115) to allow intermediate pumping activities with the first production level for top access to the reef horizon at 1 291.2m below surface (level 180). The shaft arrangement will be as indicated in Figure 13 3, showing the locations of each level to be cut into the shaft barrel on both shafts. This shaft information is summarised in Table 9.
42
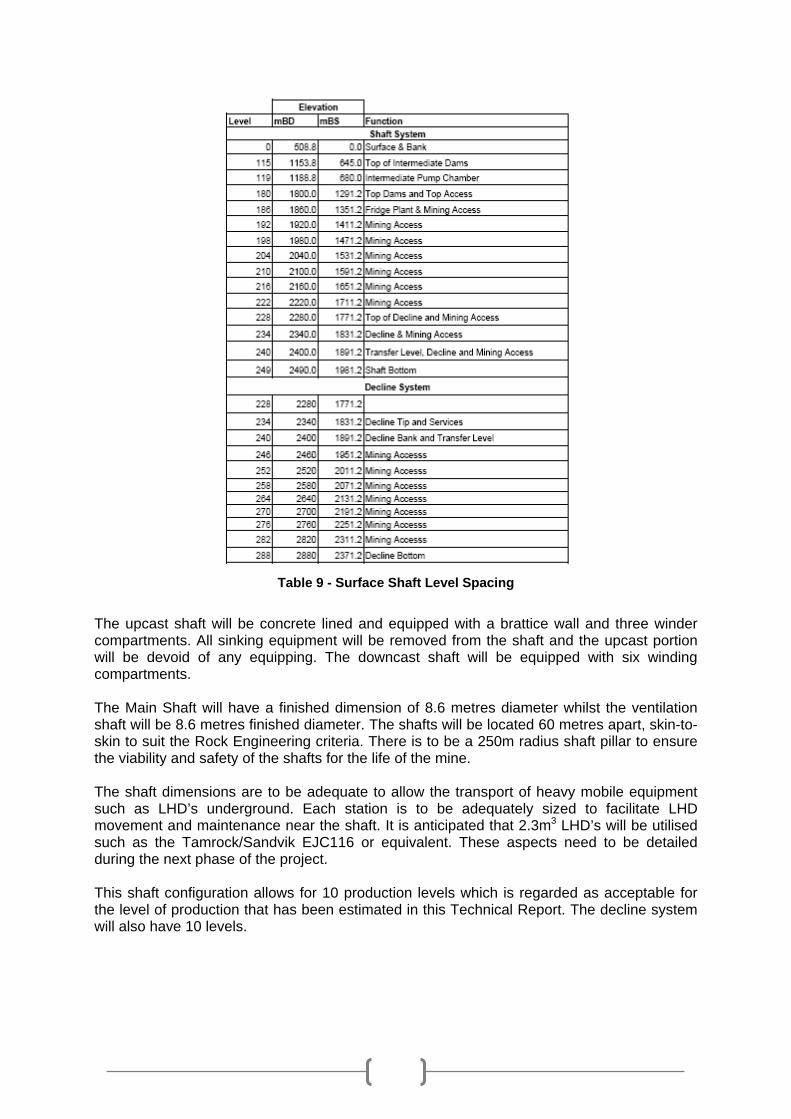
Table 9 - Surface Shaft Level Spacing
The upcast shaft will be concrete lined and equipped with a brattice wall and three winder compartments. All sinking equipment will be removed from the shaft and the upcast portion will be devoid of any equipping. The downcast shaft will be equipped with six winding compartments. The Main Shaft will have a finished dimension of 8.6 metres diameter whilst the ventilation shaft will be 8.6 metres finished diameter. The shafts will be located 60 metres apart, skin-to-skin to suit the Rock Engineering criteria. There is to be a 250m radius shaft pillar to ensure the viability and safety of the shafts for the life of the mine. The shaft dimensions are to be adequate to allow the transport of heavy mobile equipment such as LHD’s underground. Each station is to be adequately sized to facilitate LHD movement and maintenance near the shaft. It is anticipated that 2.3m3 LHD’s will be utilised such as the Tamrock/Sandvik EJC116 or equivalent. These aspects need to be detailed during the next phase of the project. This shaft configuration allows for 10 production levels which is regarded as acceptable for the level of production that has been estimated in this Technical Report. The decline system will also have 10 levels.
43

Figure 13 - Bloemhoek Shaft Schematic Layout
44

19.2.5 Stoping method The two major reefs at Bloemhoek are the Kalkoenkrans and Beatrix reefs. For the purposes of this study they will be mined as a single reef, at the average grade of the two reefs. The Leader Reef will be mined after the extraction of the overlying major reef in that particular area. This is an oversimplification that assumes a single reef with a dip of 20 degrees. Proper mine scheduling of individual areas is necessary to get a more complete picture of the production capability of the orebody. The reef width and dip dictate that on-reef stoping will be carried out by conventional hand held means as currently practised in the Witwatersrand Goldfields and the neighbouring Free State Mines in particular. During subsequent work, each area will have to be accessed and mined according to its own characteristics. Block development will be by rail-bound strike haulages, situated 50 metres into the footwall of the reef to be mined. Drilling is to be by conventional, handheld pneumatic jackhammers. Face cleaning will be by face winches in each panel, scraping into strike gullies and from there to ore passes or centre gully scraper lines. Panel length will be affected by faulting, but will be between 30 and 35 metres. A panel length of 30 metres is used in this study. Face advance of 5 metres per month is planned for the total face length available and this will result in a production rate of 7 300 tonnes per month per raise line. There will be three raise lines per level in production - with raising, ledging and vamping this results in an average of 25 000 tonnes per level. Eight levels will achieve the targeted 200 000 tonnes per month output. This level of production is high for a twin shaft complex and will require considerable infrastructure around the shaft for men, material and rock to be handled efficiently. Reef will be removed from the stoping environment by rail bound means and tipped at the shaft ore pass system for hoisting from the mine to surface.
19.2.6 Block development Footwall drives, 3.4m by 3.0m, are to be carried 50 metres below reef. This study is based on all flat, block development being track bound. The potential exists to do this development with LHD’s and to tram the waste rock with the LHD’s or trucks to the decline tips, subject to the overall distance (LHD’s are adequate up to 200m). Raise spacing is 180 metres on strike. Raise dimensions are 2.5m by 1.5m. At each raise position, a crosscut to reef for services and access is developed. In the cross-cut a number of box holes, 2.4m by 1.2m, are developed to reef for reef removal from the stopes. Level spacing can vary but given the reasonably flat dip of the reef, should not exceed 60 metres giving raise lengths of approximately 200 metres. Return Air Way’s on strike will be planned as required. On each level (i.e. north and south), six raises will be in various stages of stoping. This allows production of 25 000 reef tonnes per month per level.
45

19.2.7 Rock Engineering No geotechnical rock engineering evaluations have been carried out on the Bloemhoek Project area and thus the Technical Report is based on sound industry practice in the vicinity of the Project. The footwall lithology 50 metres below the reef horizons may not be ideal for the development of the permanent access ways to the stoping environment, but this will need to be tested during subsequent evaluations. It has been assumed that the stoping environment will be relatively stable from a rock engineering and hanging wall support aspect and will not require systematic regional support pillars. The hanging wall will be supported by localised support rock pillars, wooden sticks and composite wooden/concrete packs. To achieve the necessary in-stope support, it is expected that the geological losses and low grade material will provide adequate localised support, thus not impacting upon the reef extraction percentage. The twin shaft location will be required to remain stable for the life of the mine and as such a shaft pillar of up to 250 meter radius will be required, in which no stoping can be implemented. The shaft has been located in a lower grade region of the ore body and thus it is unlikely that there will be economic reef to be mined in the shaft pillar region. All the above assumptions will need to be tested by ore body modelling during the pre-feasibility and possible feasibility study phases of the project. This may require additional drilling of the project area with deflections.
19.2.8 Ventilation Requirements Production ventilation requirements will determine the ultimate dimensions of the shaft. Detailed design work by underground ventilation specialists has not yet been carried out. It has been assumed that 840 cubic metre/sec of air will be delivered into the mine, corresponding to 3.5m3/sec per ktonne per month – this is an acceptable design parameter and within industry norms. The downcast Main Shaft will be 8.6 metres diameter whilst the upcast bratticed walled Ventilation Shaft (upcast cross section will be 70% of available area) will be 8.6 metres diameter, resulting in a down flow velocity of 11.1m/sec and an up flow velocity of 21.4m/sec in the respective shafts. Each mining level will be accessed by twin haulages, one for intake and the other for return air. On the bottom level of the mine, where the decline system will be developed to access the remote blocks of ground, further horizontal development will be required to provide additional air for the decline system, with large sized haulages for intake and return air. It is estimated that these haulages will need to be 40m2 in cross section to enable air to escape the mine. A third decline will be needed to exhaust the used air from the workings. As a result of the depth of the mining blocks, it will be required that refrigeration be installed from early on in the mine’s life, initially with surface Bulk Air Cooler installations and eventually with underground refrigeration plants and chilled water reticulation. The entire ventilation and refrigeration requirements for the mine will need to be confirmed during any subsequent studies.
19.2.9 Modus Operandi for Sinking and Development The conceptual modus operandi for the project has been used to develop the Project Schedule (see Figure and Appendix B) and can be described as being fast tracked from implementation into production. This means that most early equipment for shaft sinking, (e.g. sinking winders, compressors, etc.) will be supplied as part of the sinking contractor’s
46

equipment and not an early purchase by the Bloemhoek Project, unless good quality appropriate pre-owned equipment can be secured by the mine. It is assumed that no construction work will commence on the project until the go-ahead has been received from Wits Gold and any future partners. This means that only conceptual drawings will be developed for the mine layout and associated infrastructure. In addition, no ordering has been done for long lead items such as winders, compressors, mills etc. It is anticipated that the Pre-Feasibility Study (PFS) will commence in the 2008 calendar year and will be completed in approximately nine months, ahead of the decision point to proceed with a full Definitive Feasibility Study (DFS) and eventually to implement the full project. During the DFS, sufficient detail will have been requested and received from the major sinking contractors to allow a final decision to be taken for the shaft sinking contractor selection and major equipment purchases (e.g. winders, transformers, compressors, etc.), without the necessity to again submit enquiry documents – this is expected to occur in late 2010. It is expected that both the Main and Ventilation Shafts will commence at approximately the same time. In the programme, it is proposed that the Ventilation Shaft is sunk as rapidly as possible and this will be used to commence the ‘in circle’ development and ore pass systems. The brattice wall will be installed from the Ventilation shaft bottom, after the Main Shaft has been equipped. As the Ventilation Shaft will be equipped, this shaft will not be completed significantly earlier than the Main Shaft, but the ‘in circle’ development, ore pass systems, silos and dams will be commenced utilising the hoisting facilities of the Ventilation Shaft. Other options to speed up development, such as mid-shaft loading, cannot be ruled out. It is assumed that no reef mining will occur whilst the Main Shaft is unavailable for hoisting. Reef mining, even ‘on-reef’ development is to be delayed until after the Main Shaft and the ore pass system are available for continuous production. When the Main Shaft is available, the primary development will be accelerated on the critical levels to allow a more rapid build up of access points to reef.
19.2.10 Ore Flow Factors The ore flow factors used in the production and financial models for Bloemhoek can be summarised as follows:
o Channel Width (CW) is the width of the conglomerate reef zone containing gold as reported during the drilling campaign.
o Stoping Width (SW) is defined as the width required to achieve optimum correct recovery of reef from the stope face. The SW consists of the channel width of the reef zone plus a total 15cm over-break on the hanging and footwall horizons, thus making a total of 15cm additional material beyond the Channel Width. As can be seen in Table 8, the channel width for the Beatrix Reef is 119cm and the stoping width has been increased to 134cm. This results in additional tonnage at zero grade and a corresponding reduction in stope grade.
o Tramming Width (TW) - Stope Dilution is defined as the additional tonnage generated at zero grade as a direct result of the mining activities. In the production forecast, a figure of 10% has been used for stope dilution. This is made up of 5% as a direct result of the necessity for stope gullies, winch beds, etc., resulting from the necessity to access the reef horizon without discarding any reef. In addition, the gold mining industry has a norm of 4% over-break within the stoping horizon (due to hanging and foot wall breakage), plus an allowance of 1% for the mine tonnage
47

excess / shortfall calculation. This results in the allocation of the 10% dilution factor, increasing tonnage, decreasing grade but maintaining the same kilogram allocation.
o Block Factor for this project has been set at 100%. The block factor is the reconciliation between the block grade and the currently mined grade as defined by in-stope sampling. At Bloemhoek, it is assumed that the block and the mined grade will be the same and thus the factor is 100%.
o Mine Call Factor for this project has been set at 90%. The mine call factor is the reconciliation between the currently mined grade as defined by the in-stope sampling and the grade presented to the processing plant. The gold mining industry has a historical mine call factor of between 75 and 95%, depending upon the nature of the gold in the deposit and management of factors affecting the MCF. There is no reason to expect that the mine call factor will be greater than 90%.
o Processing Recovery for this project has been estimated from industry standard and norms at 95% - there is no reason to suspect that the reef from Bloemhoek will be different from neighbouring mines. This is regarded as fair and reasonable until such time as future metallurgical test work indicates an alternative processing recovery.
Applying all of these factors to the Bloemhoek geological and ore flow models, results in changes of tonnages, metal contents and grades. Table 8 above summarises the effects of these changes.
19.2.11 Production Scheduling As indicated above in Section 19.2.5, each level in the mine will be capable of delivering 25 000 tonnes per month. The total in situ tonnage, as indicated in Table 8 is 52.33 million tonnes. Using ore flow parameters as detailed elsewhere, this will result in a milled tonnage of 65.64 million tonnes. The proposed shaft complex envisaged for Bloemhoek will be capable of delivering approximately 200 000 tonnes per month of reef and thus the anticipated mine life on all gold bearing reefs will be 375 months or more than 30 years. This is regarded as fair and reasonable for this project. Analysing the above information, the desired throughput of 200 000 tonnes per month will be achieved from eight production levels in the mine. This tonnage will come from the eight separate mining levels and there will be at least one new level in preparation, acting as ‘spare’ in case of loss of production due to equipment failure, geological losses caused by low grades or unexpected faults, etc. In the simplistic production scheduling developed for the Technical Report, it has been assumed that it will take six years to develop the mine adequately to achieve the full production of 200 000 tpm. This is regarded by Turnberry Projects as a fair and reasonable production ramp up.
19.2.12 Steady State Production It is expected that the mine will be capable of consistently producing 200 000 tonnes of reef per month from between eight and ten producing levels. The production profile for tonnage and gold is depicted in Figure . This production profile has been selected, as it does not have the disadvantage of a long production tail at the end of the mine life, although it must again be noted that only simplistic mine planning has been applied to this ore body.
48
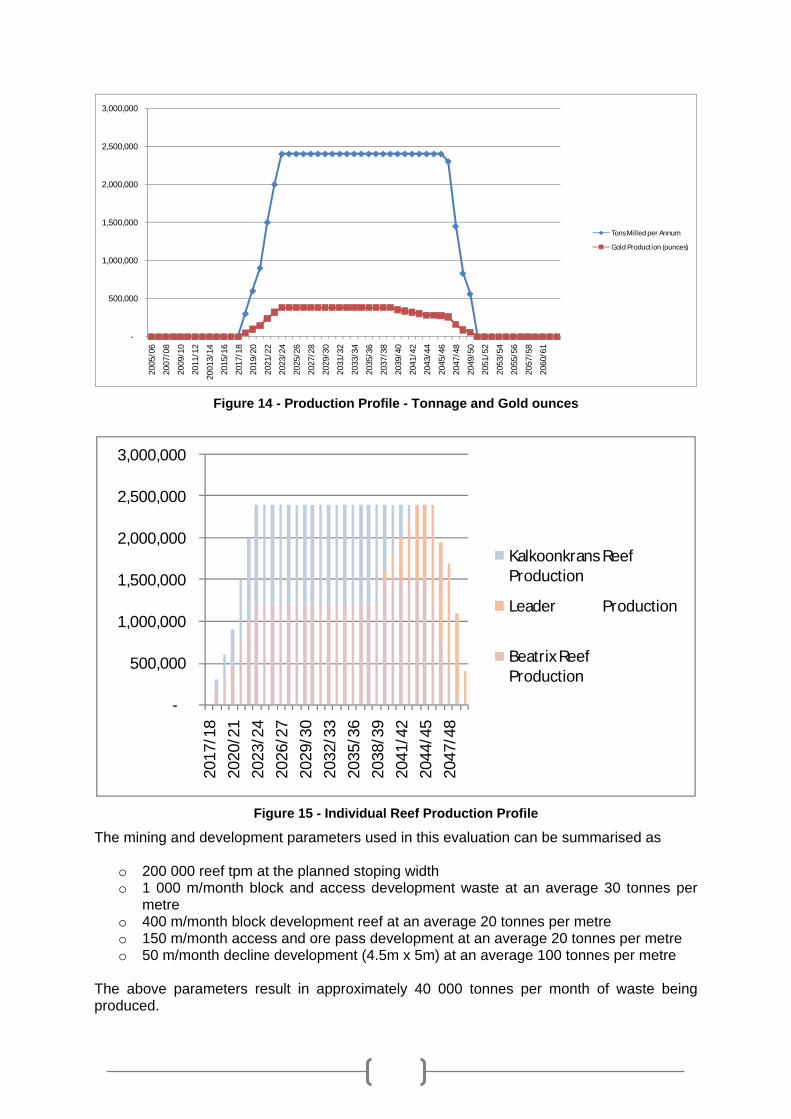
-
500,000
1,000,000
1,500,000
2,000,000
2,500,000
3,000,000
2005
/06
2007
/08
2009
/10
2011
/12
2001
3/14
2015
/16
2017
/18
2019
/20
2021
/22
2023
/24
2025
/26
2027
/28
2029
/30
2031
/32
2033
/34
2035
/36
2037
/38
2039
/40
2041
/42
2043
/44
2045
/46
2047
/48
2049
/50
2051
/52
2053
/54
2055
/56
2057
/58
2060
/61
Tons Milled per Annum
Gold Production (ounces)
Figure 14 - Production Profile - Tonnage and Gold ounces
-
500,000
1,000,000
1,500,000
2,000,000
2,500,000
3,000,000
2017
/18
2020
/21
2023
/24
2026
/27
2029
/30
2032
/33
2035
/36
2038
/39
2041
/42
2044
/45
2047
/48
Kalkoonkrans Reef Production
Leader Production
Beatrix Reef Production
Figure 15 - Individual Reef Production Profile
The mining and development parameters used in this evaluation can be summarised as
o 200 000 reef tpm at the planned stoping width o 1 000 m/month block and access development waste at an average 30 tonnes per
metre o 400 m/month block development reef at an average 20 tonnes per metre o 150 m/month access and ore pass development at an average 20 tonnes per metre o 50 m/month decline development (4.5m x 5m) at an average 100 tonnes per metre
The above parameters result in approximately 40 000 tonnes per month of waste being produced.
49
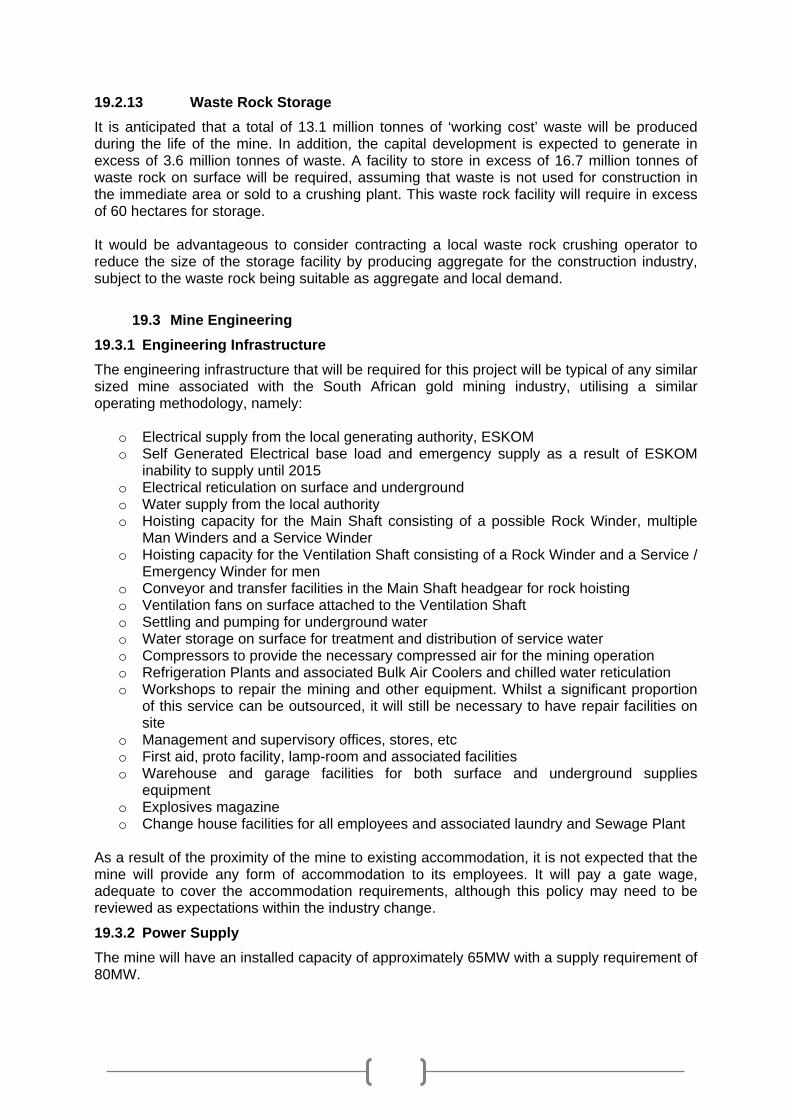
19.2.13 Waste Rock Storage It is anticipated that a total of 13.1 million tonnes of ‘working cost’ waste will be produced during the life of the mine. In addition, the capital development is expected to generate in excess of 3.6 million tonnes of waste. A facility to store in excess of 16.7 million tonnes of waste rock on surface will be required, assuming that waste is not used for construction in the immediate area or sold to a crushing plant. This waste rock facility will require in excess of 60 hectares for storage. It would be advantageous to consider contracting a local waste rock crushing operator to reduce the size of the storage facility by producing aggregate for the construction industry, subject to the waste rock being suitable as aggregate and local demand.
19.3 Mine Engineering 19.3.1 Engineering Infrastructure The engineering infrastructure that will be required for this project will be typical of any similar sized mine associated with the South African gold mining industry, utilising a similar operating methodology, namely:
o Electrical supply from the local generating authority, ESKOM o Self Generated Electrical base load and emergency supply as a result of ESKOM
inability to supply until 2015 o Electrical reticulation on surface and underground o Water supply from the local authority o Hoisting capacity for the Main Shaft consisting of a possible Rock Winder, multiple
Man Winders and a Service Winder o Hoisting capacity for the Ventilation Shaft consisting of a Rock Winder and a Service /
Emergency Winder for men o Conveyor and transfer facilities in the Main Shaft headgear for rock hoisting o Ventilation fans on surface attached to the Ventilation Shaft o Settling and pumping for underground water o Water storage on surface for treatment and distribution of service water o Compressors to provide the necessary compressed air for the mining operation o Refrigeration Plants and associated Bulk Air Coolers and chilled water reticulation o Workshops to repair the mining and other equipment. Whilst a significant proportion
of this service can be outsourced, it will still be necessary to have repair facilities on site
o Management and supervisory offices, stores, etc o First aid, proto facility, lamp-room and associated facilities o Warehouse and garage facilities for both surface and underground supplies
equipment o Explosives magazine o Change house facilities for all employees and associated laundry and Sewage Plant
As a result of the proximity of the mine to existing accommodation, it is not expected that the mine will provide any form of accommodation to its employees. It will pay a gate wage, adequate to cover the accommodation requirements, although this policy may need to be reviewed as expectations within the industry change.
19.3.2 Power Supply The mine will have an installed capacity of approximately 65MW with a supply requirement of 80MW.
50

Considering the stress that has been placed on the national power grid prior to 2007 and the expectation that additional generating capacity will not be available prior to 2015, it is required that alternative prime power sources will be required to be installed to cater for all consumption requirements until this time. It is expected that ESKOM will be able to provide a portion of the construction power at perhaps 2MW whilst the anticipated sinking requirement will be approximately 30MW – the shortfall will be supplied by diesel generation (5MW) and the remaining 23MW with heavy fuel oil (HFO) generation, subject to availability of the HFO.
19.3.3 Water Supply The mine is expected to consume approximately 7 500m3 of water per day based on a water balance. This water can be supplied from underground sources or from the local authorities. As a result of the expectation that there will be a significant quantity of fissure water from the underground mining activities, it is anticipated that the supply of potable water from local authorities will be reduced to 5 000m3 per day.
19.3.4 Capital Requirement Provision has been made in the Capital Forecast for all the above aspects of R2 628 million, including a provision for the underground mining fleet. There is an additional requirement from about year 11, to allow the introduction of additional infrastructure to sustain the production from the mine. This is additional to that required in achieving the initial production targets during the first few years of production. The total engineering infrastructure capital requirement is estimated to be R1 650 million for the equipment supply (excluding the Gold Plant and Tailings Dam at R590 million) plus the EPCM portion of the project, estimated to be about R350 million.
19.3.5 Operating Costs The cost to operate the engineering infrastructure detailed above is included in the current Operating Cost estimate. The services to the mine, namely electric power and water, are costed separately and shown as a line item in the financial model. The power requirement is based on 40kWhr/tonne milled for the Gold Plant and 100kWhr/tonne mined for the remainder for the other infrastructure. In addition, it has been assumed that the water consumed by the mine will be 0.5m3/tonne milled for the gold plant and 0.5m3/tonne mined for the remainder of the mine. During the next phase of the project, these service requirements will need to be determined from a complete mine power and water balance.
19.4 Metallurgical Processing 19.4.1 Metallurgical Testwork No metallurgical test work has been conducted on the reef from Bloemhoek, but as a result of the consistency of the metallurgical performance of the neighbouring mines and the Free State mines in general, it is fair and reasonable to assume that a high gold recovery across the gold plant of 95% will be achieved. The reef contains significant quantities of uranium with a potential plant feed grade averaging 100ppm – this is regarded as too low to consider being economically attractive as the predominant reefs contain less than this value for the majority of the life of the mine. The
51

processing of uranium has not been considered appropriate for Bloemhoek but this will need to be tested during any future project phase.
19.4.2 Metallurgical Processing The reef from the Bloemhoek underground mine will require metallurgical processing to recover the contained gold at a Technical Report rate of 200 000 tpm. There are a number of possible process routes to consider for the operation, namely:
1. Conventional processing consisting of: o Run of mine milling, cyanide leaching, carbon in pulp, carbon elution and
producing a smelted dore (as practiced at Beatrix No.2 Plant and Joel Gold Plant) o Run of mine milling, carbon in leach with cyanide, carbon elution and producing a
smelted dore (as practiced at Beatrix No.1 Plant) o Tailings disposal to a tailing storage facility o Dore to be refined at the Rand Refinery
2. Toll treatment of the reef from Bloemhoek at a neighbouring mine, provided that there is sufficient capacity available and a mutually beneficial toll treatment agreement can be reached
Considering the above options, the only viable process route is the first, as the toll capacity of neighbouring operations is not expected to be adequate to treat the 200 000 tonnes per month to be produced at Bloemhoek. In addition, the nearest possible tolling facility is some 12km by road from Bloemhoek and considering a transport cost of R1.20 per wet tonne plus a tolling premium of R10 per dry tonne, the overall premium for tolling will amount to R25.16 per tonne milled or R60.4 million per annum. All existing facilities in the area have been in operation for several decades and will require overhaul before the Bloemhoek reef could be processed and this would be additional costs. Considering the long life of the mine in excess of 23 years at full production plus the above mentioned considerations, the economics of tolling do not favour this as an appropriate processing option. The capital infrastructure associated with a gold refinery is not warranted considering that the Rand Refinery is situated in Johannesburg. It has been assumed that refining of the dore will be conducted at the Rand Refinery at a charge of R600 per kg (approximately $2.35 per ounce). Thus, the process option to be recommended for Bloemhoek will consist of a conventional milling, leaching with carbon-in-leach, carbon elution and tailings disposal. The gold dore will be refined at the Rand Refinery. The tailings will be stored on a local tailings dam. The Gold Plant will have a capacity of 200 000 tonnes per month or 6 700 tonnes per day or 300 tonnes per hour at an availability of 92.5%. This size of processing plant is within industry norms, is based on standard, proven technology and is considered to have little technical risk.
19.4.3 Process Description Whilst limited mineralogical studies but no metallurgical test work have been performed on the gold-bearing reefs at Bloemhoek, it is reasonable to expect that the metallurgical performance will be similar to that of the neighbouring mines. Whilst this expectation cannot be guaranteed, the assumption is considered reasonable for this Technical Report. Waste rock will be hoisted separately from the mine and discharged into a receiving bin on surface. The rock will be trucked or conveyed away to the waste rock dump for storage or additional processing to manufacture aggregate.
52

Reef will be hoisted from underground via the Main Shaft and deposited into a receiving bin next to the headgear. A conveyor will remove the reef from the headgear and it will be primary crushed to smaller than 150mm. This crushed ore will be stockpiled ahead of the Gold Plant to de-couple the underground mine from the processing plant. The crushed ore will be reclaimed from the stockpile and fed into the Semi-Autogeneous Grinding (SAG) circuit in closed circuit with a classifier. The finer fraction will be directed to the carbon-in-leach circuit whilst the coarser fraction could be returned back to the SAG Mill. The leach will be adjusted to a pH of 10.5 and cyanide will be added to dissolve the contained gold – the gold will be adsorbed onto the carbon. The barren tailings will be discarded to the tailings dam via a tailings thickener and cyanide destruction system. This is essential to meet the current and future concerns regarding cyanide disposal and to meet the International Cyanide Management Institute (ICMI) guidelines. The loaded carbon will be eluted with the resultant gold being electro-won prior to smelting into dore. This process technology is conventional and is in force at the neighbouring Beatrix mine.
19.4.4 Metallurgical Performance The plant performance is expected to be good at 95% gold recovery, irrespective of the head grade.
19.4.5 Plant Security The gold plant is a high risk environment and significant precautions need to be taken to reduce the risk of theft. The entire plant will be double fenced with security cameras installed to cover the fence area and all processing plant areas with a risk profile, including milling, carbon handling, smelting, sample preparation and anywhere where gold may accumulate in the process. All employees, contractors and visitors will be searched upon exiting the plant and potentially on entry as well. All workers will be expected to enter and exit the plant through a clean/dirty change house facility incorporated into the security access control. All employees will also be subjected to metal detector technology to ensure that the metal profile of the individual has not changed during the work period.
19.4.6 Tailings Disposal Considering that the expected milled tonnage will be in excess of 65 million tonnes, the tailings dam capacity requirement will need to be approximately 65 million tonnes. This will require a dam with a capacity of 46.9 million m3. A footprint of about 250 hectares would be required for a tailings dam, return water facility and safety margin with the dam height of 30 m. Current tailings disposal regulations may require the dam to be lined to prevent the contamination of ground water from cyanide bearing solutions. Water run off from the dam will be contained and returned to the processing plant. It is expected that without lining of the dam, the water return will be between 40 and 50% of the water delivered to the tailings storage facility.
19.4.7 Process Plant Costs A gold plant with the above processing capability is expected to cost approximately R500 million (in December 2007 money terms), including all associated infrastructure. In addition, the tailings dam is expected to cost R90 million which has been assumed to be all required in one phase as a result of the flat nature of the foot print - this may be reviewed during the feasibility study phase of the project. The operating cost of the plant is expected to be approximately R33.50 per tonne milled, excluding toll refining charges and services such as electricity and water supply.
53

Tailings disposal is estimated to be R1.50 per tonne processed.
19.4.8 Refining Terms & Conditions The anticipated refining terms and conditions from Rand Refinery are subject to a contract with the Refiner. This Technical Report has assumed that the gold recovery will be 99.90% with a treatment charge of R600 per kilogram of gold in dore and silver recovery will be 95% with a treatment charge of R40 per kg of silver. These terms and charges are subject to negotiation and do not necessarily reflect the final condition. These assumptions are considered to be reasonable within the context of industry practice and are based on refining cost and recovery data published by Rand Refinery. There will be minimum quality conditions applied to the dore, and these have been assumed to be the following
o Gold content – 90% o Silver content – 8% o Base metal content – 2%
If the base metal content is not achieved, penalties could be applied and for this Technical Report, penalties have not been assumed.
19.4.9 Analytical Facilities It is anticipated that all analytical requirements will be outsourced to experienced analytical laboratories located in the Welkom area. The mine will only have a preparation facility included in the design.
19.4.10 Future Metallurgical Testwork As previously stated, only limited mineralogical examination of the geological core from the current drilling campaign at Bloemhoek has been conducted to date, and consequently there is little indication of the likely metallurgical performance from the Gold Plant. In addition, no metallurgical test work has been conducted on any of the produced geological core. It is necessary that during the next phase of the project, some further mineralogical and metallurgical examinations be conducted to verify the assumed likelihood of similar performance to neighbouring or district gold recovery plants.
19.5 Project Schedule The entire project has been scheduled as per the attached Gantt Chart in Figure 6. A more detailed schedule is depicted in Appendix A. The PFS is to be initiated in the third quarter of 2008 for completion in first quarter 2009. The DFS will commence when the PFS has been presented and will be complete during the first quarter 2010. Project financing will take 3 to 4 months to put in place and thus the sinking contract can be awarded during the third quarter 2010 with site establishment and first blast for sinking during fourth quarter of 2010.
54
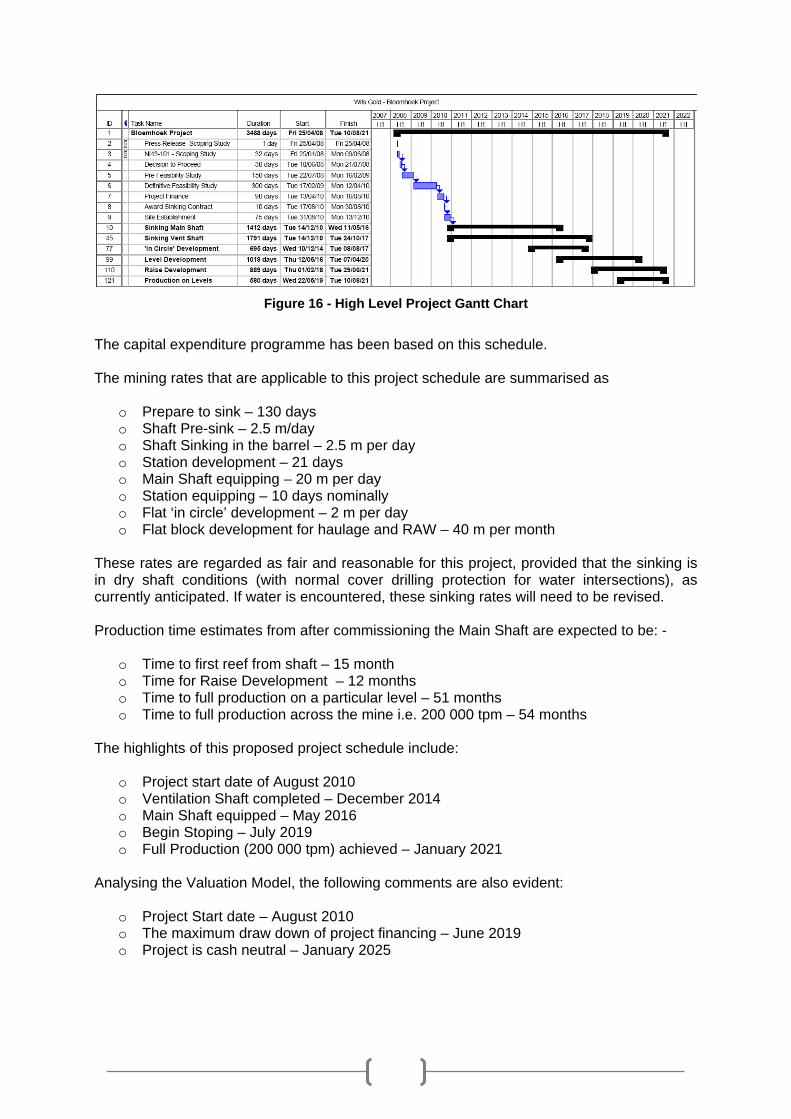
Figure 16 - High Level Project Gantt Chart
The capital expenditure programme has been based on this schedule. The mining rates that are applicable to this project schedule are summarised as
o Prepare to sink – 130 days o Shaft Pre-sink – 2.5 m/day o Shaft Sinking in the barrel – 2.5 m per day o Station development – 21 days o Main Shaft equipping – 20 m per day o Station equipping – 10 days nominally o Flat ‘in circle’ development – 2 m per day o Flat block development for haulage and RAW – 40 m per month
These rates are regarded as fair and reasonable for this project, provided that the sinking is in dry shaft conditions (with normal cover drilling protection for water intersections), as currently anticipated. If water is encountered, these sinking rates will need to be revised. Production time estimates from after commissioning the Main Shaft are expected to be: -
o Time to first reef from shaft – 15 month o Time for Raise Development – 12 months o Time to full production on a particular level – 51 months o Time to full production across the mine i.e. 200 000 tpm – 54 months
The highlights of this proposed project schedule include:
o Project start date of August 2010 o Ventilation Shaft completed – December 2014 o Main Shaft equipped – May 2016 o Begin Stoping – July 2019 o Full Production (200 000 tpm) achieved – January 2021
Analysing the Valuation Model, the following comments are also evident:
o Project Start date – August 2010 o The maximum draw down of project financing – June 2019 o Project is cash neutral – January 2025
55

19.6 Environmental The proposed Bloemhoek Project will be situated near the town of Virginia in the Free State Province. The project is a greenfield’s site that will be near a number of similar mining sites in the area. The greater Welkom district is a heavily industrialised area with a strong mining culture. A detailed environmental study will need to be undertaken prior to work commencing on the project site. The objectives of the environmental study will be to:
• Identify the issues associated with the Bloemhoek Project, which are most likely to affect the biophysical and socio-economic aspects of the surrounding environment;
• Conduct a review of the applicable environmental legislation; • Determine and document the aspects of the project, which will require further
detailed investigation. In order to meet the objectives the following activities will need to be undertaken:
• Site visits; • Review of existing information; • Review of the applicable legislation; • Compilation of a Scoping Report according to the requirements of the Minerals
and Petroleum Resources Development Act: • Brief description of the environmental setting; • Envisaged impacts on the environmental aspects of concern; • Nature and extent of proposed specialist investigations. • Outline of the environmental processes and authorisations applicable to the
Bloemhoek Project. The environmental consequences of the proposed project, both positive and negative, are to be addressed in the Environmental Impact Assessment / Environmental Management Programme. The specific requirements, which must be implemented, to prevent unnecessary environmental degradation, whilst promoting economical and social upliftment are to be included in these documents. The process is to be conducted in an open and transparent manner to ensure that all aspects and issues of concern are taken into account. No public participation meetings with the Interested and Affected Parties (IAP) have been held at this stage of the Technical Report. As soon as the official ‘go ahead’ for the Definitive Feasibility Study (if not earlier) has been given, this activity as well as the compilation of the EMPR and other documents will need to be instigated, whilst the engineering design is progressing and before activities have commenced on site.
19.6.1 Ground Water Removal The removal of ground water as the dewatering of the lower workings of the mine begin development, is most likely to result in the lowering of the water table in the immediate vicinity of the mine. In addition, this could cause the water table to be lowered in the general area of the mine during production ramp up, but may be especially noticeable when the mine is in full production. This aspect could thus render any neighbouring surface borehole dry. This aspect is likely to cause concern during the public meetings with the IAP’s.
19.6.2 Rehabilitation Fund The potential funding of the requirements for the Mine’s Rehabilitation Fund has not been taken into account as a separate cost element within the current working cost model. The rehabilitation fund may also be assisted with financing from the sale of assets (although a
56

minimal revenue is expected) at the end of the mine’s life and any gold recovered from plant clean up.
19.6.3 Current Environmental Concerns There are no current environmental concerns on the property. No significant agricultural activities are practiced on the property.
19.6.4 Cyanide Management The ICMI guidelines for cyanide management require that cyanide be destroyed prior to disposal to storage facilities. The Weak Acid Dissociable (WAD) cyanide content of water to be discharged is to be less than 0.5ppm. This can only be achieved by the use of improved technology cyanide destruction techniques.
19.6.5 Tailings Dam A tailings disposal facility will be required to contain up to 67 million tonnes of ore. Considering the bulk density of this material and the anticipated height restriction of 30m, the footprint of the tailings dam will need to be approximately 200 hectares with the entire impoundment facility requiring up to 250 hectares.
19.6.6 Waste Rock Dump A waste rock dump will be required to contain in excess of 16.7 million tonnes of waste rock. Considering the bulk density of the rock and the anticipated height restriction of 30m, the footprint of the waste rock dump will need to be approximately 50 hectares with the entire impoundment area being 60 hectares. A smaller facility could be required if an agreement can be entered into with a local producer for crushing rock for aggregate purposes.
19.6.7 Infrastructure The infrastructure required for the mine operation, apart from the tailings dam and waste rock dump will require approximately 350 hectares and will include, but is not limited to the following: -
• Shaft system • Shaft bank area • Compressor house and cooling towers • Workshops and stores • Offices • Sewage plant • Water storage and treatment plant • Mud and dirty water storage • Ventilation plant • Parking area for mine vehicles • Access roads • Flood lines of local streams • Parking area for private vehicles
In addition, the Gold Plant will require an area of about 50 hectares as a footprint.
19.6.8 Social and Labour Plan A detailed Social and Labour plan will need to be developed during the future phases of the project as this is a requirement for obtaining a Mining License, as well as being a ‘good’ corporate citizen in rural South Africa. There do not appear to be significant relocation issues associated with the Bloemhoek Project area.
57

19.7 Capital Expenditure The capital expenditure as detailed in Table 10 is a current estimate of the required funding to achieve the desired level of production and sustainability for the project. The capital estimate is based on developing a mine and gold plant facility only. The costs indicated are based on data base information and no quotations have been received from contractors or vendors to support the indicated costs. Cost estimates as such are ‘order of magnitude’ estimates only. There are a number of types of costs included in Table 10, namely
o “Wits Gold” Costs - Costs prior to Definitive Feasibility Study o “Project” Costs – Definitive Feasibility Study o Phase 1 Capital Costs o Phase 2 Capital Costs o On going Capital Cost Requirements
These costs are defined and further explained as below: The “Wits Gold” Costs are those costs which will be incurred by Wits Gold up to the time when a Pre-Feasibility Study has been completed and may include current geological drilling and seismic survey data purchase, initial geological modelling and some geo-statistical evaluation, initial metallurgical test work, initial mine planning based on the geological modelling and structural plans, the costs of the scoping and pre-feasibility studies and the ongoing Wits Gold management costs. Included in these costs are the historical costs already incurred on the project by Wits Gold, but excludes the purchase of the mineral or surface rights. The “Project” Costs are those that will be incurred between the time when Wits Gold agrees to a Pre-Feasibility Study proceeding and the completion of the DFS. This will include comprehensive metallurgical test work, additional geological drilling, finalisation of the geological model, structural model and geo-statistical analysis, additional mine planning details, the definitive feasibility study costs, land purchase for surface infrastructure and ongoing project management costs by Wits Gold. Included in these costs will be the EMPR and EIA documentation requirements. The Phase 1 Capital Costs details the expected capital cost to achieve full production from the underground mine and will include all necessary surface infrastructure, metallurgical plant, shaft systems, mining equipment, underground development to the initial production areas and the access to the stoping areas to achieve 200 000 tonnes per month. The Phase 2 Capital Costs details the expected capital cost on infrastructure to sustain the levels of production for the life of the mine. This includes any additional surface infrastructure required, start of the underground decline system development to access all production blocks; additional tailings dam capacity and additional mining equipment. This expenditure should be funded out of revenue generated by production and the positive mine cash flow. The On-going Capital Cost Requirement details the costs associated with upgrading the infrastructure during the production life of the mine and includes mining fleet, processing plant and infrastructure upgrade. This expenditure should be funded out of revenue generated by production and the positive mine cash flow. The total capital expenditure in January 2008 money terms is estimated to be R8 095 million for the entire project excluding the Wits Gold costs and this is summarised in Table 10 below.
58

As previously stated, these costs exclude any provision for housing of employees.
Table 10 - Capital Expenditure Summary
In this capital estimate, no provision has been made for accommodation of the workforce. The accuracy of the above capital estimate is anticipated to be plus or minus 30%. This cost is comparable to the reported cost estimates of similar sized projects within the South African mining industry and is considered reasonable for a project of this size and scope.
19.8 Working Costs The operating cost estimates have been derived by benchmarking the operating costs of similar projects in the South Africa gold mining industry. The impact of mining depth has been factored in, using prior experience of the study team. The cost estimates used for this study are summarised in Table 11 and indicate a total ‘On Mine’ cost of less than R516 per tonne milled to produce gold dore and refine the product at the Rand Refinery. These costs exclude any royalty payments or penalties that may be incurred.
Table 11 - Operating Cost Summary
59

As discussed above, these study estimates are factored or benchmarked cost estimates only. It is believed that they are within 25% accuracy. More accurate zero based estimates should be done during the next phase of the overall project. As stated previously, no specific provision has been made in these costs for the rehabilitation fund requirement. It is currently assumed to be included in the Operating Cost estimate.
19.9 Staffing It is expected that the mine will provide employment for about 6 400 people. This should be verified by a detailed manning study in the next phase of the work. This aspect is extremely important as the project area has a high level of unemployment due to the down turn of the mining industry. The area in which the mine is located has been near a mining district and supplying labour to the mines for many decades. The available labour is expected to be sufficiently industrialised to provide trained manpower to Bloemhoek and this labour will be available to work with minimal additional training having been conducted, without compromising safety. As stated previously, it is anticipated that Bloemhoek will pay a gate wage, adequate to cover all accommodation expenses and thus there will be no accommodation units constructed for any employees. This aspect has been excluded from the capital schedules, but is implicitly included in the Operating Cost estimate. This decision may need to be reviewed as expectations change with future aspirations.
19.10 Economic Valuation 19.10.1 Metal Prices and Revenue The revenue to the mine is based on metal prices and exchange rates as at May 2008 and is indicated in Table 12.
Table 12 - Metal Prices used for Project evaluation
The metal price used in the economic evaluation is R250 775 per kg of gold, R4 500 per kg of silver and R 1320 per kg of uranium. Based on technical assumptions, uranium is not considered to be economically viable at the expected grades to be mined.
19.10.2 Marketing of the Product The markets for the gold product are not a concern to Wits Gold or any other South African gold producer. Gold dore will be sold to the Rand Refinery and Wits Gold will be credited with the funds within a few days, subject to the contractual conditions at the time. Gold marketing is a function of the Rand Refinery. Silver is marketed by the Rand Refinery as a by-product of the gold marketing.
60
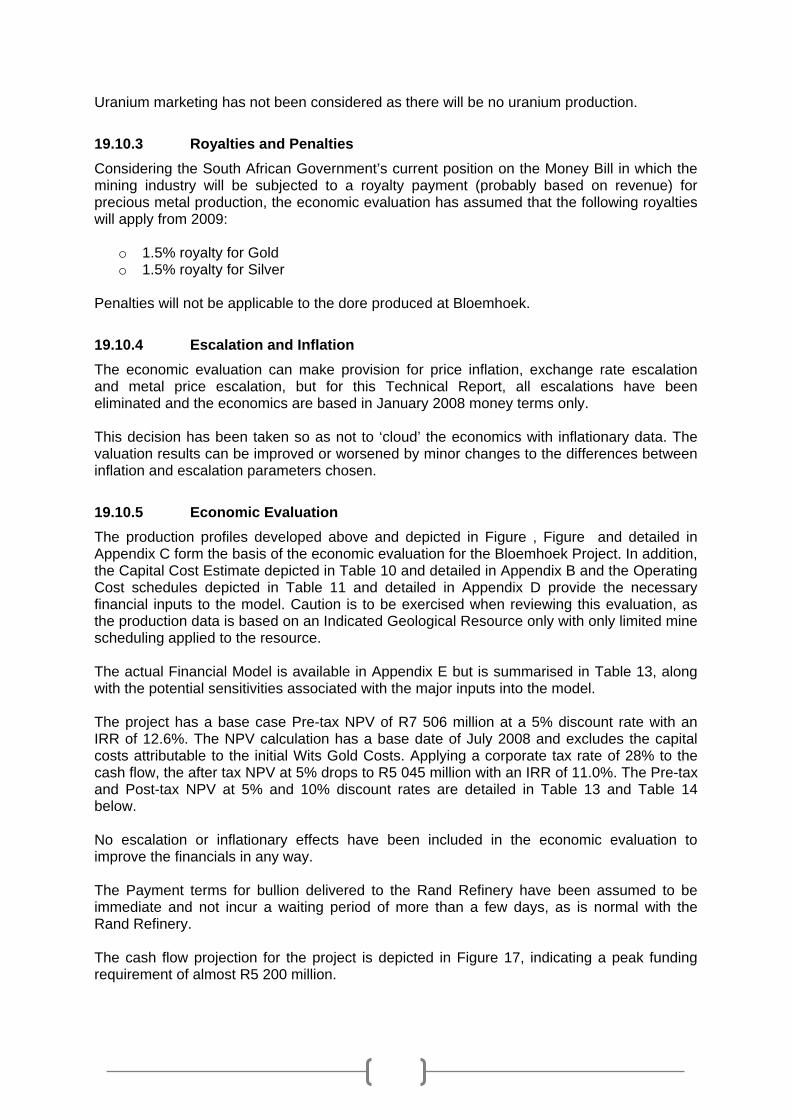
Uranium marketing has not been considered as there will be no uranium production.
19.10.3 Royalties and Penalties Considering the South African Government’s current position on the Money Bill in which the mining industry will be subjected to a royalty payment (probably based on revenue) for precious metal production, the economic evaluation has assumed that the following royalties will apply from 2009:
o 1.5% royalty for Gold o 1.5% royalty for Silver
Penalties will not be applicable to the dore produced at Bloemhoek.
19.10.4 Escalation and Inflation The economic evaluation can make provision for price inflation, exchange rate escalation and metal price escalation, but for this Technical Report, all escalations have been eliminated and the economics are based in January 2008 money terms only. This decision has been taken so as not to ‘cloud’ the economics with inflationary data. The valuation results can be improved or worsened by minor changes to the differences between inflation and escalation parameters chosen.
19.10.5 Economic Evaluation The production profiles developed above and depicted in Figure , Figure and detailed in Appendix C form the basis of the economic evaluation for the Bloemhoek Project. In addition, the Capital Cost Estimate depicted in Table 10 and detailed in Appendix B and the Operating Cost schedules depicted in Table 11 and detailed in Appendix D provide the necessary financial inputs to the model. Caution is to be exercised when reviewing this evaluation, as the production data is based on an Indicated Geological Resource only with only limited mine scheduling applied to the resource. The actual Financial Model is available in Appendix E but is summarised in Table 13, along with the potential sensitivities associated with the major inputs into the model. The project has a base case Pre-tax NPV of R7 506 million at a 5% discount rate with an IRR of 12.6%. The NPV calculation has a base date of July 2008 and excludes the capital costs attributable to the initial Wits Gold Costs. Applying a corporate tax rate of 28% to the cash flow, the after tax NPV at 5% drops to R5 045 million with an IRR of 11.0%. The Pre-tax and Post-tax NPV at 5% and 10% discount rates are detailed in Table 13 and Table 14 below. No escalation or inflationary effects have been included in the economic evaluation to improve the financials in any way. The Payment terms for bullion delivered to the Rand Refinery have been assumed to be immediate and not incur a waiting period of more than a few days, as is normal with the Rand Refinery. The cash flow projection for the project is depicted in Figure 17, indicating a peak funding requirement of almost R5 200 million.
61
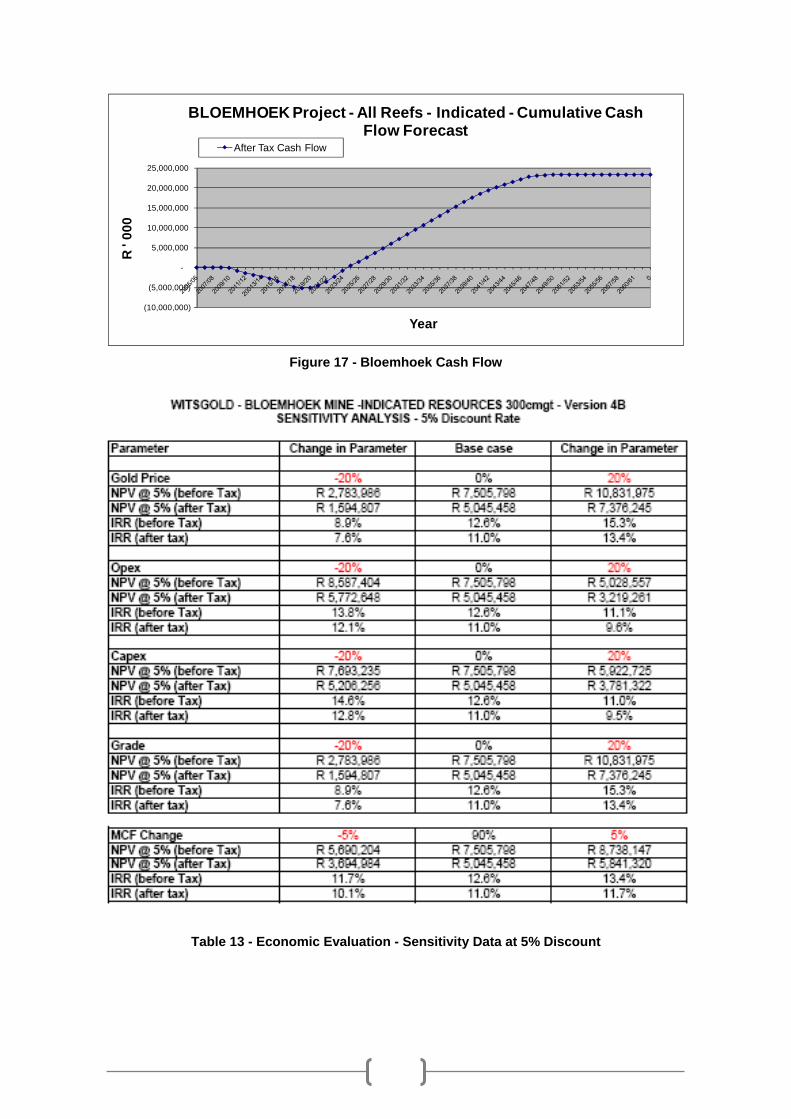
(10,000,000)
(5,000,000)
-
5,000,000
10,000,000
15,000,000
20,000,000
25,000,000
R '
000
Year
BLOEMHOEK Project - All Reefs - Indicated - Cumulative Cash Flow Forecast
After Tax Cash Flow
Figure 17 - Bloemhoek Cash Flow
Table 13 - Economic Evaluation - Sensitivity Data at 5% Discount
62

Table 14 - Economic Evaluation - Sensitivity at 10% Discount
0.0%
2.0%
4.0%
6.0%
8.0%
10.0%
12.0%
14.0%
16.0%
-20% 0% 20%
IRR
% Change in Parameter
WITSGOLD - BLOEMHOEK Project - All Refs - Indicated - Sensitivity Analysis
Gold Price
OPEX
CAPEX
Grade
Figure 18- Sensitivity Analysis Graph
63

The above table and graph indicate the sensitivity of the project economics (at a discount rate of 5%) to changes in the input parameters. The factors are based on revenue and expenditures and flexed by plus and minus 20%. In addition, due to the sensitivity of the project to MCF, the changing of the MCF by plus or minus 5% is also indicated. The project will be cash neutral in November / December 2024, some 15 years from committing to the project. The cash neutral position is 60 months from the commencement of production, all subject to the zero escalation and zero inflation aspects of the project. This is shown in Figure . The maximum project funding requirement will be R5.19 billion at the end of June 2019, as first stoping will commence third quarter 2019. The project is most sensitive to gold price and grade delivered to the mill. As a result, during any future studies, the option of high grading the project will be evaluated. In addition, selective mining of the higher grade reefs will also be investigated, even if these options mean processing a lower tonnage. These results indicate that the project is robust and is likely to be financially viable, provided that the gold price remains above $US800 per ounce with an exchange rate in excess of R8.00.
19.10.5.1 Sensitivity to Gold Price The project is sensitive to gold price and as such different gold price scenarios were developed for the same capital and operating costs. The gold prices selected are as detailed in Table 12. In summary the sensitivities to the above are depicted in Table 15 below.
Table 15 - Gold Price Sensitivity
The data presented in the above table was released in the press release dated 25 April 2008. Analysing the gold price sensitivity data, the change is IRR (Figure ) and NPV at various discount rates (Figure 20) is indicated graphically for clarity.
64
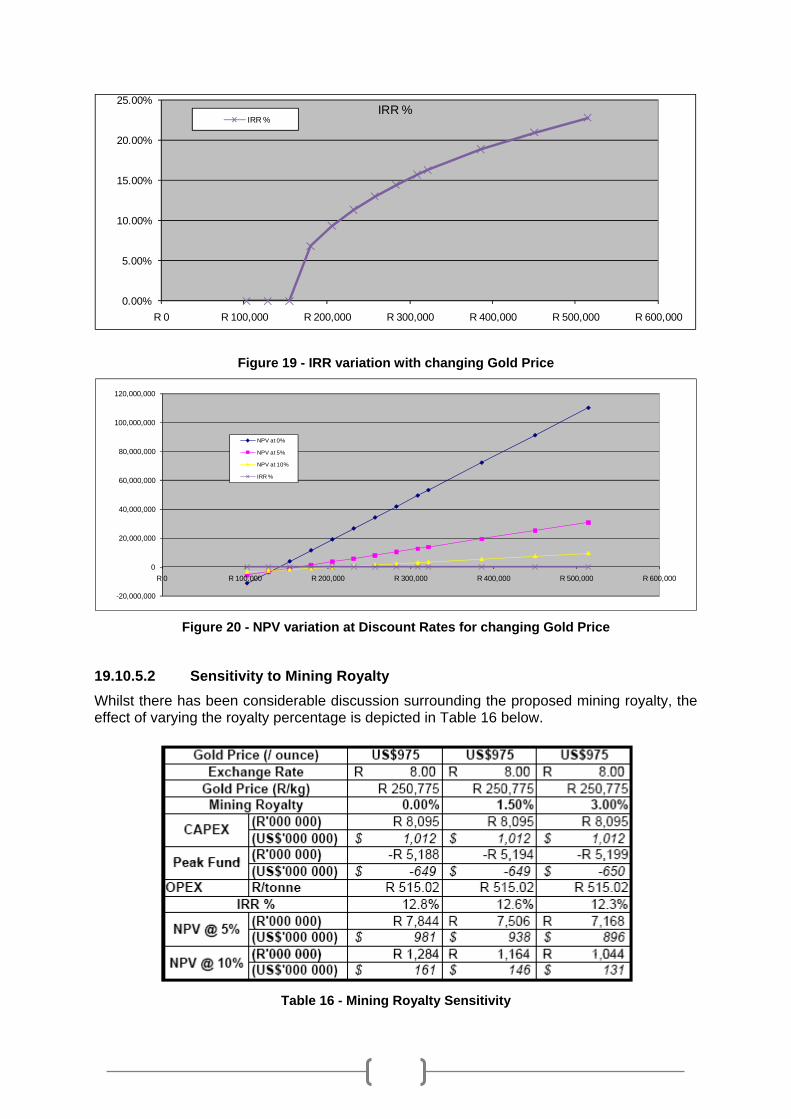
0.00%
5.00%
10.00%
15.00%
20.00%
25.00%
R 0 R 100,000 R 200,000 R 300,000 R 400,000 R 500,000 R 600,000
IRR %IRR %
Figure 19 - IRR variation with changing Gold Price
-20,000,000
0
20,000,000
40,000,000
60,000,000
80,000,000
100,000,000
120,000,000
R 0 R 100,000 R 200,000 R 300,000 R 400,000 R 500,000 R 600,000
NPV at 0%
NPV at 5%
NPV at 10%
IRR %
Figure 20 - NPV variation at Discount Rates for changing Gold Price
19.10.5.2 Sensitivity to Mining Royalty Whilst there has been considerable discussion surrounding the proposed mining royalty, the effect of varying the royalty percentage is depicted in Table 16 below.
Table 16 - Mining Royalty Sensitivity
65

It should be noted that the project is relatively insensitive to the proposed mining royalty.
19.10.6 Project Parameters The important parameters that have been developed for the Bloemhoek Project are detailed in Table 17 below. This table lists the production parameters as well as the CAPEX and OPEX developed for the Technical Report. This table needs to be read in conjunction with the financial evaluation numbers depicted in the above tables.
Table 17 - Project Parameters
19.11 Project Risks and Up-side Potential The identified risks associated with this project can be summarised as
o Geological risk associated with the grade evaluation o Geological structure risk associated with the interpretation of the blocks o Rock Engineering and hanging wall stability o Geo-hydrological risk associated with the potential for ground water inflows o Normal risks associated with underground mining o ESKOM power supply risk and cost o Water supply risk from local authorities o Mineralogical evaluation has not been implemented o Metallurgical test work has not been implemented o The stoping width of 15 cm more than the channel width cannot be achieved, thus
causing additional dilution o The Block Factor of 100% is not achieved due to overvaluation of the drilling results o The Mine Call Factor of 90% (industry high) is not achieved o The capital cost estimate accuracy o The operating cost estimate accuracy o Capital cost inflation o Operating cost inflation o Availability of Skilled labour o Accommodation of all classes of labour considering current aspirations o The project schedule is not achieved
66

o The production schedule is delayed o The production ramp-up is not achieved o Metal price, exchange rate and operating cost volatility o Country risk o Political Risk and Mining Charter o Royalty Bill o AIDS risk with the impact on the workforce o Industrial Action o Environmental, both surface and underground
These project risks are not materially different to those facing any South African gold project with similar depth and mineralogy. The up-side potential associated with the project can be summarised as
o Additional drilling to bring inferred resources into the indicated category o Additional economic reef zones identified o The Block Factor of 100% is exceeded o The project has used a Mine Call factor of 90% whilst some underground operations
in the gold industry report MCF’s in excess of 90% o Stoping width reduction to better than 15 cm more than the channel width o Improved gold plant recovery as a result of the high head grades and process
optimisation o Additional tonnage processed through the plant as a result of improved availability
and control o Tribute mining potential of neighbouring properties o Utilisation of existing neighbouring processing facilities to treat the ore o Simpler geological / structural than the current interpretation o Increased mechanisation in the stoping environment to reduce costs
67
20 RECOMMENDATIONS
As a result of the apparent economic robustness of the project as indicated by the economic evaluation, it is recommended that the following be continued for the Bloemhoek Project area.
1. Geological drilling is to continue to improve the confidence in the geological model 2. Increase additional resource tonnage from Inferred to Indicated category 3. Obtain larger diameter diamond drill core samples for mineralogical examination and
initial metallurgical testing 4. Participate in seismic survey that may be conducted across the Bloemhoek property 5. Conduct initial Mine Planning and design using Mine24D or equivalent 3D software
packages 6. Environmental Technical Report is commenced
When the above has been adequately completed, it is proposed that a more detailed Pre-Feasibility study be completed to decide the way forward for the project.
68
21 CONCLUSIONS
The Bloemhoek Project may produce at a rate of 2.4 million tonnes per annum for a period of 23 years at full production with a 5 year ramp up phase and a 4 year closure phase, i.e. a total of 32 years in production. The mine will require 8 years to develop before production can commence. The total reef tonnage to be milled will be 65.64 million tonnes. The mine will be a stand-alone operation and will not rely on any mining or processing plant infrastructure from other sources. There is to be a twin shaft system from surface to a depth of 1 981.2m below surface. A processing plant to treat 200 000 tonnes per month will be constructed with an associated tailings disposal facility. The bullion produced from the processing plant will be refined at the Rand Refinery in Johannesburg. The estimated life of mine Capital Cost for the project is R8 094 million with peak funding requirement of about R5 200 million. The mine will be cash neutral in year 15. The estimated working cost will be R515 per tonne milled, $US64 per tonne milled or $US438 per ounce. The project is robust and is likely to be economically viable under the current cost and revenue scenarios. It is recommended that the following be continued for the Bloemhoek Project area.
o Geological drilling is to continue to improve the confidence in the geological model o Improve the resource from inferred to indicated category o Review the core currently drilled for geo-technical competence and understand the
support requirements for stoping activities and conducting preliminary rock engineering modelling to better understand the in-stope and regional support requirements
o Obtain larger diameter diamond drill core samples for mineralogical examination and initial metallurgical testing
o Participate in the currently planned seismic survey to be conducted across the Bloemhoek property
o Conduct initial Mine Planning and design using Mine24D or equivalent 3D software packages
o Environmental Scoping Study is commenced
It is recommended by the Qualified Person’s that Wits Gold progress the Bloemhoek Project to a Pre-feasibility study, as the technical and economic risks, as well the outlook for the gold price, support the potential development of the project.
69

22 CERTIFICATES
The certificates for the authors of this document, namely T.V. Spindler and G.I. Cunningham are attached for reference.
70

71
72

73

74

APPENDICES
Appendix A – Detailed Project Schedule Appendix B – Capital Cost Estimate Schedule Appendix C – Production Profile Appendix D – Operating Cost Schedule Appendix E – Financial Model
75

APPENDIX A
Detailed Project Schedule – Gantt chart
76
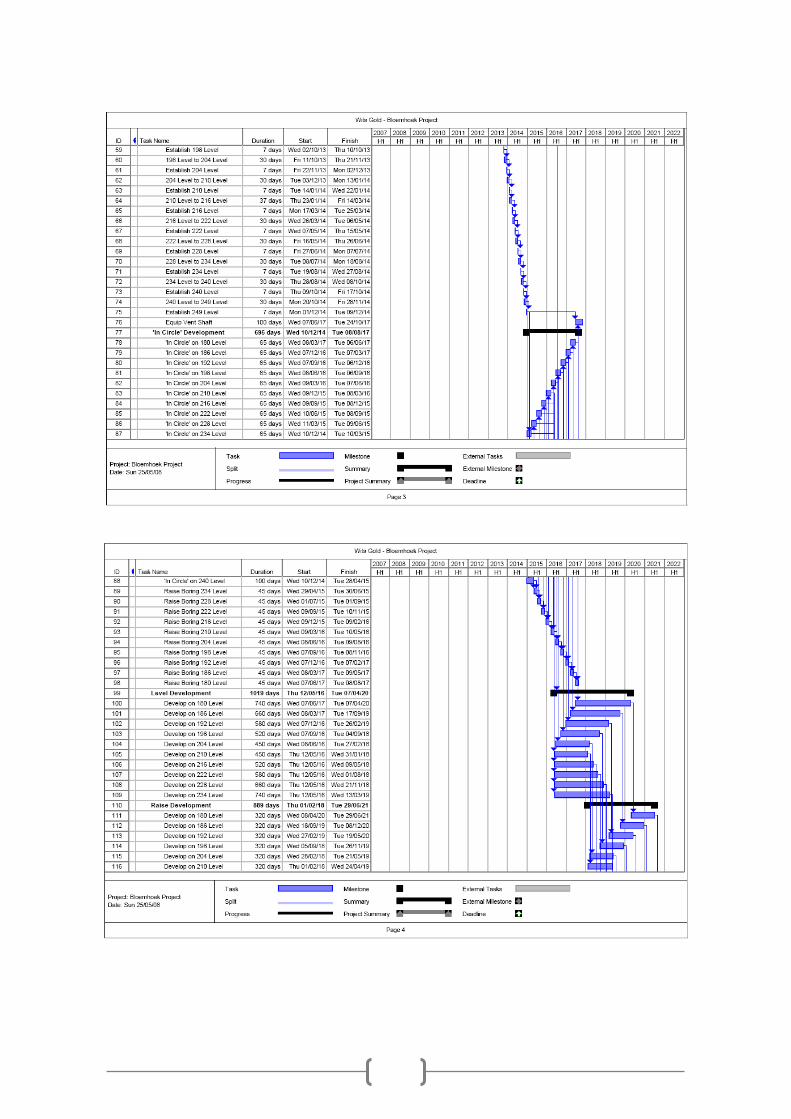
77

APPENDIX B
Capital Expenditure Schedules
78

79

APPENDIX C
Production Profile
80

APPENDIX D
Operating Cost Schedules
81

82

APPENDIX E
Valuation Model
83