Within and Between Firm Trends in Job Polarization: Role of Globalization and Technology
47
TYÖPAPEREITA | WORKING PAPERS 308 Within and Between Firm Trends in Job Polarization: Role of Globalization and Technology* Sari Pekkala Kerr Terhi Maczulskij Mika Maliranta
-
Upload
palkansaajien-tutkimuslaitos -
Category
Government & Nonprofit
-
view
242 -
download
1
Transcript of Within and Between Firm Trends in Job Polarization: Role of Globalization and Technology

TYÖPAPEREITA | WORKING PAPERS 308
Within and Between Firm Trends in Job Polarization: Role of Globalization and Technology*
Sari Pekkala KerrTerhi MaczulskijMika Maliranta

Palkansaajien tutkimuslaitos
Labour Institute for Economic Research
Pitkänsillanranta 3 A
00530 Helsinki
www.labour.fi
Työpapereita | Working Papers 308
ISBN 978-952-209-152-9 (pdf)
ISSN 1795-1801 (pdf)
Helsinki 2016
* Corresponding author: Sari Pekkala Kerr (Wellesley College). Other author affiliations: Terhi Maczulskij (Labour Institute
for Economic Research) and Mika Maliranta (ETLA and University of Jyväskylä). The authors are grateful to the Academy
of Finland for financial support (project no. 127796 and 303693).
The authors wish to thank the following for helpful comments and suggestions on the paper: David Autor Dhaval Dave,
ASSA 2015 conference participants, ETLA and PT seminar audiences, NBER Productivity Lunch seminar audience and
the participants in the IAES 2015 conference in Boston as well as the SOLE 2016 conference in Seattle.
Sari Pekkala Kerr, e-mail: [email protected]
Terhi Maczulskij, e-mail: [email protected]
Mika Maliranta, e-mail: [email protected]

Tiivistelmä
Tutkimuksessa tarkastellaan ammattirakenteiden polarisaatiota sekä yrityksissä että
yritysrakenteiden muutoksen välityksellä. Aineistona käytetään Suomen yritys-
työntekijäaineistoja, jotka ulottuvat pitkälle aikavälille ja kattavat suuren osan yrityksistä.
Ammattirakenteiden polarisaatio on jatkunut Suomessa jo vuosikymmeniä. Keskitason
tuotantotehtäviä ja toimistotehtäviä sisältävien ammattien osuus on pienentynyt. Samaan
aikaan matalan osaamistason palveluammattien ja korkean osaamistason
erityisasiantuntija-ammattien osuus on puolestaan ollut kasvussa. Kehityskulut ovat
tapahtuneet osin jatkavien yritysten sisällä, mutta osin myös yritysten välillä
tapahtuneiden rakennemuutosten kautta. Osa polarisaatiosta johtuu siitä, että kasvavien
yritysten ammattirakenteet poikkeavat pienentyvien yritysten ammattirakenteista sekä
siitä, että uusien yritysten ammattirakenteet poikkeavat poistuvien yritysten rakenteista.
Palveluammattien osuutta on kasvattanut se, että uusissa yrityksissä palveluammattien
osuus on ollut suuri ja poistuvissa yrityksissä pieni. Toisaalta palveluammattien osuus on
kasvanut myös jatkavissa yrityksissä. Erilaisia keskitason rutiinitehtäviä on kadonnut sekä
yritysten sisällä että yritysten vaihtuvuuden kautta. Sen sijaan korkean osaamistason
ammattien osuuden kasvu selittyy ennen kaikkea yrityksien sisällä tapahtuneiden
muutosten kautta. Jatkavissa yrityksissä tapahtunut ammattirakenteiden muutos on
kytkeytynyt sekä tavaroiden ja palveluiden ulkomaankauppaan että tehtävien
ulkoistamiseen maasta. Paljon T&K:hon panostavat ja ICT:tä käyttävät yritykset vähentävät
tuotantotyöntekijöitä.
JEL koodit: J24, J31, O33
Avainsanat: Työpaikkojen polarisaatio, ulkoistaminen, kansainvälinen kauppa, yritys,
toimipaikka, , teknologia, T&K, ICT

2
Abstract
This paper analyzes occupational polarization within and across firms using
comprehensive matched employer-employee panel data from Finland. The occupational
distribution in Finland has been polarizing over the last few decades, with mid-level
production and clerical jobs eroding while low-skill service occupations and high-skill
specialist occupations gain share. We find that the phenomenon is taking place within
existing firms, as well as due to firm entry and exit. Service jobs are increasing through the
entry-exit dynamics, but also via establishment level restructuring among continuing firms.
Routine jobs, including mid-level plant operating jobs, are being destroyed both among
continuing firms and at the entry-exit margin. The share of high-level occupations
increases largely within continuing firms. Within the continuing firms the job polarization
appears to be related to the trade of goods and services, as well as the outsourcing of tasks.
Firms with high R&D expenditures and ICT use are more prone to lay off process and
production workers.
JEL Codes: J24, J31, O33
Keywords: Job polarization, offshoring, international trade, firm, establishment,
technology, R&D, ICT
I. Introduction
One of the most pervasive recent labor market trends is the polarization of the job
distribution. Those trends have been documented in most western economies and are
often found to coincide with the polarization of the income distribution. To date there are
numerous papers analyzing the phenomenon, beginning with the Autor, Levy, and Murnane
(2003) study which introduced the idea that the skill content of the technological change
works as the driver of polarization. Most of the existing work concentrates on estimating
the degree of polarization at the aggregate labor market level, and some studies attempt to
link the observed polarization of labor markets to other phenomena such as the
introduction of ICT, wage inequality or global trade.1 Conversely, very few studies look at
the role of firms in this process, even though it is obvious that the aggregate level trends
are generated by individual companies and their production and employment decisions,
and thus the micro-level dynamics of the polarization triggered by production and
employment decisions of the businesses remain largely uncovered. The current study
addresses that gap by bringing the role of firms to the front and center of the polarization
debate.
To a large degree the absence of firms in the job polarization literature has simply been
caused by the lack of appropriate data. The current study is able to draw from the national
level matched employer – employee database on all Finnish companies and their workers,
linked to firm-level surveys and administrative data. The core of our data platform covers
the entire business sector of Finland and spans the period of 1995-2012.2 Into that
database we bring in firm-level information on global trading activities of goods and
services, changes in the use of ICT, investments into internal and external R&D activities, as
well as changes in the firm-level pattern of outsourcing. Together these data create a
unique opportunity to understand job polarization within and across firms (i.e. at the
1 See e.g., Autor, Katz and Kearney (2006), Bockerman et al. (2012), Bockerman et al. (2013), Michaels et al. (2014). 2 Due to the availability of auxiliary survey data we have chosen to focus our analysis to the period 2000-2009. We report trends covering the years before and after our period of analysis.
2
intensive and extensive margin) and to evaluate the firm-level mechanisms and forces that
may be driving the aggregate patterns.
As most previous studies, we find evidence of labor market polarization at the
aggregate level during 2000-2009. We show that the observed trend stems from a within
firm destruction of mid-level occupations and a simultaneous increase in the highly skilled
jobs and service jobs within existing firms, although a pattern of polarization is also quite
evident in the occupational patterns of firm-level restructuring involving reallocation of
employment between continuing firms as well as entries and exits of firms. Indeed, the
entering firms are showing a much higher job concentration in the service and elementary
occupations relative to the exiting firms. Within the continuing firms, those with high-level
of job polarization are characterized by a high level of trade of goods and services, as well
as some offshoring and outsourcing of tasks, high R&D activity and intensity of ICT use. In
that respect, our findings align with other studies analyzing the drivers of polarization. To
the extent that is feasible using data on shocks in international trade we instrument for the
imports and exports of goods, as well as for the outsourcing of business activities. The
instrumental variables regressions are generally in line with the OLS in terms of the export
related results, but provide also stronger evidence that firms are replacing in-house
production jobs by importing goods from abroad. The 2SLS results for outsourcing reveal
interesting differences between domestic and foreign outsourcing. For example, a decline
in the share of routine production jobs is related to foreign outsourcing, but firms engaging
in domestic outsourcing actually increase those jobs while reducing elementary jobs.
The rest of this paper is organized as follows. The next section discusses the relevant
empirical and theoretical literature, and outlines the conceptual framework for our
polarization analysis. The third section describes the Finnish register and survey data and
presents aggregate level statistics based on the FLEED employer-employee database. The
fourth section discusses our empirical decomposition approach in detail, followed by an
analysis of aggregate level patterns and the within and between firm decomposition
analysis. The fifth section explains our regression approach, including the instrumental
variables idea, and provides the results of the regression analysis disentangling the
potential drivers of within firm job polarization. The final section concludes the paper by

3
setting our findings into the larger context of the literature, and suggests several firm-level
analysis extensions to the current paper.
II. Previous Literature and Conceptual Framework
Labor market polarization has been the subject of numerous studies over the last two
decades. One of the classics, Autor, Levy and Murnane (2003), shows that computer
technology advances were behind the routine-biased technological change that has been
driving the employment decline of workers performing routine tasks.3 Goos and Manning
(2007) elaborated on the idea that labor markets are polarizing into “good and bad” jobs,
finding evidence for job polarization in the US and in the UK, while Goos, Manning and
Salomons (2009) show that the phenomenon extends to the rest of Europe as well. Autor,
Katz and Kearney (2006) emphasize the role of IT in complementing the tasks performed
by highly educated workers (abstract) and substituting for those tasks typically performed
by workers with mid-level education (routine). Writing a comprehensive literature survey
is beyond the scope of the current study, but many of the relevant papers are discussed in
Acemoglu and Autor (2011), and Oesch and Rodriguz Menes (2010). The careful analysis of
firm-level patterns, and the focus on the extensive versus intensive margin of polarization
is a key contribution of our work. Below we focus on papers that are particularly relevant
to the setting of the current study.
First, while previous studies have looked at job polarization within countries and
industries, firms are notoriously absent from most of the literature.4 One of the exceptions
is Bockerman et al. (2013, 2016) who use similar underlying Finnish data to evaluate
whether the ubiquitous technology-based explanations are also relevant at the firm level.
3 Hynninen, Ojala and Pehkonen (2013) show that technology has historically had impacts on wage premiums already well before the computerization. They utilize the invention of steam engines and argue that it had a polarizing effect on wage patterns. 4 One bridge study between the aggregate level and firm level literatures is the study by Goos, Manning and Salomons (2014) who analyze polarization at the industry level. They find relatively strong polarization in Finland during 1993-2010, ranking it number 7 among the 16 EU countries analyzed.
4
They find weak evidence for polarization at the firm level and argue that ICT adoption and
R&D efforts by firms may be behind some of the observed patterns. Maliranta (2013)
applies a micro-level decomposition of occupational employment changes from the FLEED
firm-level data utilized also in the current study and argues that global firms are
significantly contributing to the polarization of jobs in Finland.5 Keller and Hale (2015) use
similar data from Denmark, arguing that a large proportion of the mid-wage employment
decline can be accounted for by import competition from China. Interestingly, the mid-
skilled individuals who lose their jobs can move either up or down in the job hierarchy,
depending on their specific skill set.
More recently, firm-level studies have been published using both French data
(Harrigan, Reshef and Toubal, 2016) and data from the UK (Cortes and Salvatori, 2015).
Harrigan et al. find that international trade and “technology” seem to be connected in
explaining job polarization in French firms. Cortes and Salvatori use establishment level
data from the UK and find significant specialization across establishments into routine and
non-routine tasks. The increase in the number of establishments specializing in non-
routine tasks seems to explain much of the job polarization, but adoption of new
technologies does not seem to be associated with a low employment growth within an
establishment.
The theoretical mechanism behind ICT and job polarization suggests that ICT capital
would act as a substitute for middle-skilled labor, whereas it might complement high-
skilled labor and have relatively little connection to low-skilled labor. During times of
increasing ICT intensity job polarization would ensue. Findings in the empirical literature
appear to match the theory. Studies looking at the effects of R&D and ICT include the
aforementioned paper by Bockerman et al. (2013), Bockerman et al. (2012), and Michaels
et al. (2014). The latter find that industries with faster ICT growth exhibited greater
increases in the demand for skilled professionals and faster decline in the demand for
medium-skilled workers. Recently, a few studies have also looked at international trade as
5 Maliranta finds that mid-wage occupations are declining and low-wage occupations gaining share both via the mechanism of industry and firm level occupational restructuring, while high-wage occupations are gaining share mainly within firms that stay in existence throughout the period 2000-2006.
5
an explanation for employment polarization.6 Michaels et al. (2014) find that explanations
based on trade openness are not robust to controlling for related factors such as R&D
intensity. Van Reenen (2011) argues that international trade does have a role in the
polarization of the labor market, but it acts via technological change rather than directly.
We specifically contribute to the existing literature by looking at firm-level direct evidence
for the hypothesis that these various forces related to technological progress are behind
the polarization of jobs.7
Our study also contributes to the polarization literature by considering arguably
exogenous instruments to deal with the endogeneity of firm-level exports and offshoring of
jobs. This follows recent studies using Scandinavian employer-employee data that exploit
firm specific trade patterns together with country specific trade patterns in very detailed
product categories (Hummels et al., 2014; Nilsson Hakkala & Huttunen, 2014). Those
studies focus on the wage and employment effects of offshoring, but a similar instrumental
variables strategy can be exploited in the current study. The key assumption is that
worldwide shocks in export supply and import demand are exogenous to firms in small
countries (e.g. Denmark and Finland), and that they vary by partner country and product.
Hummels et al. (2014) claim that controlling for endogeneity in decisions to offshore is
crucial for understanding how it affects employment and wages.8 A similar instrumental
variables strategy is used by Nilsson Hakkala and Huttunen (2014) for Finland.9 The
construction of the instrumental variables is discussed in detail in section 4 below.
Böckerman and Maliranta (2013) have studied Finnish linked employer-employee data
to see how offshoring activities of firms are associated with perceived well-being of
employees. They find indication of “polarization” in job satisfaction as a result of offshoring.
6 Keller and Hale (2015) certainly focus on international trade. See also Autor (2010) for a discussion on the role of trade based explanations and offshoring 7 This hypothesis was put forward by Autor, Levy & Murnane (2003), and elaborated on by Autor, Katz & Kearney (2006). 8 They find that offshoring significantly reduces the firm’s domestic employment, but the reduction mainly takes place among the low-skilled employees. Among the employees that stay, wages are reduced for the low-skilled workers but increased for the high-skilled workers. 9 They find that firm-level offshoring has a positive impact on overall employment, and especially increases the employment of production workers.

6
Unsurprisingly, offshoring involves job destruction and worker separation especially when
the destination is a low-wage developing country. In these circumstances the job
satisfaction of staying employees is found to decrease. Interestingly, offshoring to high-
wage countries stimulates the vertical mobility of employees in affected firms and is
reflected in improved perceived employee wellbeing in terms of better prospects for
promotion. Offshoring to low-wage countries is typically accompanied by increasing shares
of knowledge workers10, who generally have much higher overall job satisfaction and are
involved in mostly abstract and non-routine work tasks.
Finally, in the United States, the occupational polarization of employment has also been
argued to coincide with the polarization of wages (e.g. Autor et al., 2006; Autor &
Acemoglu, 2011), yet the wage polarization does not seem to be equally common in other
countries.11 The current study will present some cursory evidence on changes in the wage
distribution, but shows that job polarization and increasing wage inequality do not really
move in tandem in Finland. This is likely explained by the very different wage setting
institutions in Finland as compared to the United States.
III. Data and Statistics
Finnish Employer-Employee Data
This paper makes extensive use of the Finnish Longitudinal Employer-Employee Data
(FLEED), which is created for research purposes by Statistics Finland and is based on
various administrative registers that have been linked together using the unique
identification codes for persons, companies and plants. The registers combined to form the
FLEED include e.g. employment and wage statistics, educational registers, taxation records,
the business register, and financial statement statistics. The FLEED covers the entire labor
force of Finnish private enterprises subject to value-added tax (VAT), making it a
10 Here knowledge worker refers to a broad category consisting of managers, professionals, technicians and associate professionals and clerks. 11 There are some contradicting views on the explanatory power of the job polarization phenomenon as the driver of increasing wage inequality (see e.g. Mishel et al., 2013).
7
representative data source on the whole national economy. The Statistics Finland allowed
us to exploit the total FLEED for statistical analyses for the purposes of the current study.
Information on the occupation of individuals, a key variable for our paper, originates
from the employment statistics register. The current vintage of the occupation variable is
based on the ISCO-88 classification, and it is reported for years 1995, 2000 and 2004-2012.
A new classification was introduced in 2010, but it is possible to compare data before and
after 2010. The occupational classification before the mid-1990s was not compatible to
that used in 1995 and 2000, making it questionable how well one could characterize the
shifts in the occupation distribution before 1995. The post-recession period is excluded
because the polarization pattern is not identical across different time periods.12 As many of
our key explanatory variables are also measured in the early 2000s we have chosen to
focus on the period 2000-2009, and comment on the longer run evolution of the patterns
where feasible.
Descriptive statistics for the FLEED data are shown in Table 1a, where we include firms
that have at least 10 employees and drop employees who worked for the firm for less than
6 months during the year.13 In total the data includes over 14 thousand firms per year, with
around 750 thousand employees each year. The most prevalent occupations for these
employees include technical, professional and service occupations. The level of education
and average earnings vary greatly by occupation, managers and professionals being the
most highly educated and with the highest earnings. Evident in the data is also a relatively
rapid skill upgrading among the employed Finnish labor force, partly caused by the aging
out of labor force by the less educated baby-boomer generation.
The auxiliary data sources combined into FLEED include the Finnish customs export
and import data for goods and services, the ICT and R&D surveys collected by the Statistics
Finland, as well as the survey on the offshoring of business activities. Each of these data
sources is described below. Table 1b summarizes the coverage of these data sets.
12 For example, the change in the job distribution shows a decrease in the share of service jobs between 2000 and 2012 but not between 2000 and 2009. 13 The earnings are also winsorized to deal with some extreme outliers (top and bottom 1%), although this winsorizing has little effect on the reported mean.

8
The Finnish Customs Data
The Finnish Customs data cover both the exports and imports of goods at the level of
firms for the period 1999-2013 and include the total values of imports and exports to/from
all partner countries, as well as the imports and exports to/from EU countries. Per our
specific request we obtained the euro values of trade at the most detailed goods category
level (up to 8-digit level). Statistics Finland has also calculated in the data for each firm the
number of CN categories (i.e. “combined nomenclature”) and the number of countries the
firm imports to and exports from. According to the OECD recommendation, the euro values
are “free on board” (FOB) for exports, and “cost, insurance and freight” (CIF) for imports.14
The worldwide exports from Finland and imports to Finland are described in Figure A1
(relative to GDP), along with the exports that remain within the EU and imports than stem
from other EU countries.15 Other than the dip in 2008-9 related to the great recession the
level of exports has remained relatively steady over the entire time period.
It should be noted that the import and export data are a census of all importing and
exporting firms, and once merged with the FLEED data (census of all private firms
operating within Finland) a missing value for exports/imports simply means that the firm
was not engaged in these activities. A total of 2,818 of our final regression sample of stayer
firms (N=7,091) report that they have imported or exported in at least one goods category
in 2000-2009. Also, 668 of our regression sample firms were found in the service import
and export survey in 2002.
14 Before 2009, the total value of international trade of the firm had to exceed 1,000 euros to be included in the Customs data. After 2009 all firms with very small values of international trade are also included. 15 In 2010, for example, Finland’s GDP was 187 billion euros and goods imports within EU were around 27.9 billion euros and non-EU imports around 24.1 billion euros. Exports external to EU were 28.7 billion euros and imports from outside of EU 24.3 billion euros. Service trading was of a somewhat smaller magnitude, with EU exports around 10.5 and EU imports at 4.6 billion euros, and world exports at 4.9 and world imports at 7.1 billion euros. However, service trade has been growing much faster than goods trade, and Finland exports services particularly to Sweden, USA, UK and China.

9
Data on service exports and imports
The services exports and imports data cover 2002-2012 and are shown as a separate
series in Figure A1, and similar figures are also shown for imports. To put the trade flow
magnitudes in context, Finland’s GDP in 2010 was 187 billion Euros, while the total goods
exports were about 55 billion euros and total good imports around 50 billion euros. The
service trading data are based on a survey that covers the census of all large companies
that employed at least 100 persons, or had in the previous year reported that they we
engaged in international services trade, or were owned by a foreign entity, or owned
affiliates in a foreign entity. In addition, the data include a ~16% random sample of
medium-sized firms (20-100 employees) and a ~10% random sample of small firms (less
than 20 employees). The Great Recession is not as clearly reflected in the international
movement of services. The most important categories of services exported include data
processing services and international intra-corporate services (including overheads paid
by international subsidiaries related to HR- and IT-services), while Finland mostly imports
data processing services and services in the category of “other business functions” (e.g.
translation and security) (see also Haller et al., 2014).
ICT survey
The ICT surveys are available in a uniform format for the period 2000-2009 and
describe the adoption and use of ICT by Finnish private companies, as well as their
practices related to e-commerce. The sample includes the universe of large firms (with
more than 100 employees) and each year a separate random sample of smaller firms (5-99
employees). The sampling frame excludes the following industries: arts and entertainment,
veterinary activities, financial and insurance activities, agriculture, forestry and fishing, and
all public sector service activities. Each year roughly 3,000 firms answer the survey. Of our
final regression sample of stayer firms 819 were found in the ICT survey in 2000 (i.e. the
year we utilize to describe the baseline situation in our sample firms). During the
observation period practically all companies surveyed had adopted some basic ICT tools,

10
but the share of workers using the tools varied from company to company, and on average
increased from less than 60 percent (in 2001) to over 70 percent (in 2009) (Figure A2).
R&D survey
The R&D Surveys are available at the firm level in a uniform format for the period
1998-2011. The statistics are based on data obtained from enterprises, universities, central
university hospitals, polytechnics and public sector organizations. In each year, the survey
covers all large firms (with more than 100 employees), all smaller firms (less than 10
employees) that received public R&D subsidies, and a random sample of medium firms
(with 10-100 employees), totaling about 4,000 firms per year. The survey questions cover
in detail each firm’s R&D activities and expenditures. Of our regression sample firms 1,091
were present in the R&D survey in the baseline year 2000. According to the survey, the
overall average R&D expenditures were about 13,000 euros per worker in 2000 and have
slightly increased from that level after 2006 (Figure A3). When considering the total firm
level R&D expenditure (not shown in the figure) a brief dip was seen in 2007-2008, after
which the R&D expenditures have again continued to increase slowly. The number of R&D
employees dropped even more sharply in 2006-2007, making the expenditure per worker
more or less flat until 2007. Descriptive statistics on the R&D survey are reported in Table
1b.
International sourcing survey
The international sourcing survey is an important globalization-related source of data
revealing whether a firm has moved some of its business functions abroad (i.e., offshored
certain jobs during a given period).16 This information pertains to years 2001-2006. The
international sourcing survey is a census for those firms that employ more than 100
persons and a random sample for smaller firms (the response rate was 83%). It covers 552
16 For more details see Statistics Denmark et al., 2008.
11
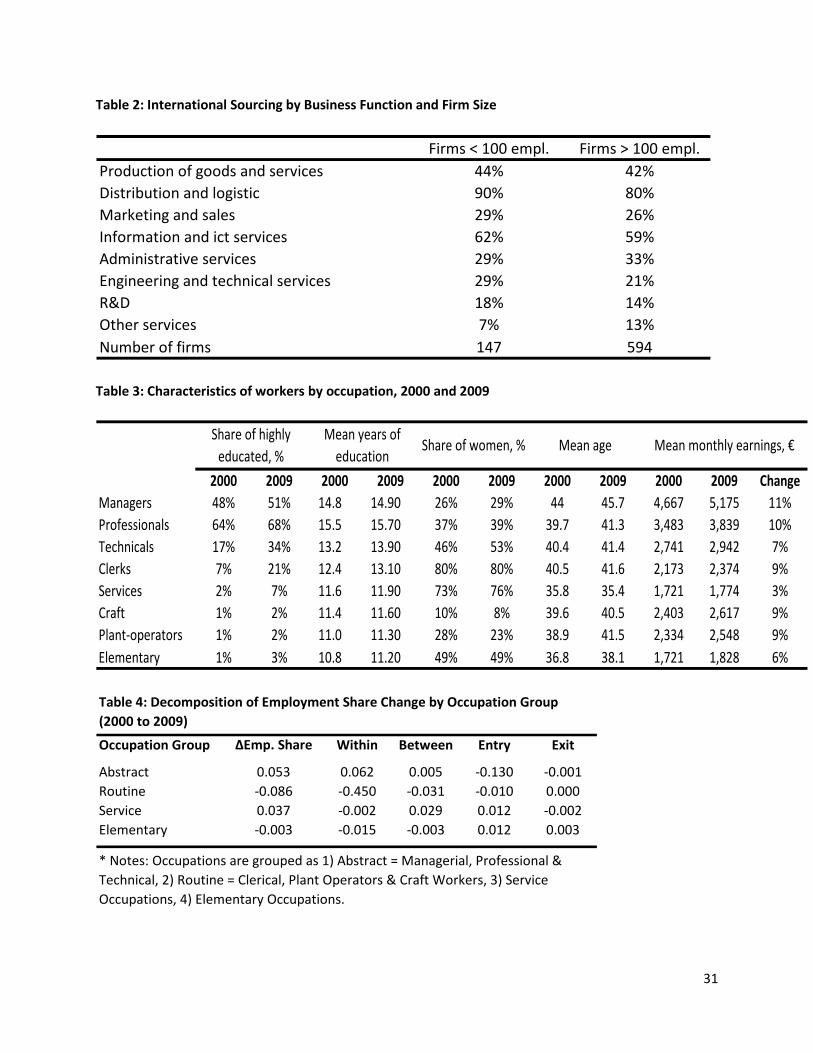
firms (out of 7,091) in our final regression sample of stayer firms. In total 19 percent of
firms covered by the sourcing survey reported that they were already sourcing business
functions internationally in 2001-2006 (Table 1b). In addition, 7 percent of the firms
responded that they were planning to increase their international sourcing, or remain at
the same level of offshoring as in the previous 5-year period. The most typical locations for
offshoring were the new EU-12 countries, and the most typical tasks included ICT services
and production of goods and services (Table 2). Large firms outsource more than smaller
firms, both internationally and within Finland (Figure A4).
IV. Aggregate Level Analysis and Decomposition Results
Decomposing Aggregate Changes
The main goal of this study is to decompose changes in occupational shares to changes
taking place within and across Finnish firms, and to relate changes in occupational shares
to the various firm characteristics described above. We start with a series of simple
analyses of the employment share changes of occupations and continue with the
decomposition.17 Since FLEED allows us to identify individual establishments as well as
firms it is interesting to also include a component accounting for that also. Establishment-
level analyses have two main advantages: 1) they capture restructuring within firms that
takes place as some firms simultaneously increase employment in certain production units
and decrease in others, or establish entirely new production units and shut down older
ones (Maksimovic and Gordon, 2002), and 2) they are less sensitive to artificial entry and
exit of units and allow focusing on organic employment growth that is not confounded e.g.
by mergers and acquisitions.
17 As we do not have data on the actual hours worked by each employee, the shares are measured simply as percentage of employees in each occupation. We tested the sensitivity of the polarization patterns to this definition by calculating the employment shares as a percentage of total numbers of months worked by all employees associated with the occupation and found that the pattern is essentially unchanged regardless of the measure used.

12
Specifically, using a formula originally proposed by Vainiomäki (1999), we decompose
the change of aggregate occupation share of occupation j, ∆𝑆𝑗 (measured by number of
persons) into four components:
∆𝑆𝑗 = ∑ ∆𝑆𝑖𝑗𝐶𝑊�𝑖𝐶 + ∑ 𝑆�̅�𝑗𝐶∆𝑊𝑖𝐶 + 𝑊𝑁�𝑆𝑗𝑗𝑁 − 𝑆𝑗𝑗𝐶� + 𝑊𝐷�𝑆𝑗,𝑗−1
𝐶 − 𝑆𝑗,𝑗−1𝐷 �,𝑖∈𝐶𝑖∈𝐶 (1)
for j = 1, …, 8 occupation groups. Superscript C denotes continuing establishments (i.e.
those appearing both in t-1 and t), N the entrants (i.e. those appearing in t but not in t-1),
and D the exiting establishments (i.e. those that exist in t-1 but not in t). ∆𝑆𝑖𝑗𝐶 = 𝐿𝑖𝑖𝑖𝐿𝑖𝑖
− 𝐿𝑖𝑖,𝑖−1
𝐿𝑖,𝑖−1
is the change of employment share of occupation j from year t-1 to t in continuing
establishment i. 𝑊�𝑖𝐶 = 0.5 �𝐿𝑖,𝑖−1𝐿𝑖−1
− 𝐿𝑖𝑖𝐿𝑖� is the average employment share of establishment i
in years t and t-1 among continuing establishments, and 𝑆�̅�𝑗𝐶 = 0.5 �𝐿𝑖𝑖,𝑖−1
𝐿𝑖,𝑖−1− 𝐿𝑖𝑖𝑖
𝐿𝑖𝑖� is the
average employment share of occupation j in continuing establishment i in years t and t-1.
∆𝑊𝑖𝐶 = 𝐿𝑖𝑖
𝐿𝑖− 𝐿𝑖,𝑖−1
𝐿𝑖−1 is the change of employment share of establishment i from year t-1 to t
among continuing establishments. 𝑊𝑁 = 𝐿𝑖𝑁
𝐿𝑖 is the employment share of new /entering
establishments (in year t) and 𝑊𝐷 = 𝐿𝑖−1𝐷
𝐿𝑖−1 the employment share of exiting establishments
(in year t-1). 𝑆𝑗𝑗𝑁 and 𝑆𝑗𝑗𝐶 are the shares of occupation group j among new establishments
and continuing establishments in year t, respectively. 𝑆𝑗,𝑗−1𝐶 and 𝑆𝑗,𝑗−1
𝐷 are the shares of
occupation group j among exiting establishments and continuing establishments in year t-
1, respectively.
The first term on the right-hand side of Equation (1) gauges the change of aggregate
employment share of occupation j within establishments. To put differently, it is a weighted
average change of the employment shares in the continuing establishments, where each
establishment is weighted by its average employment share in year t-1 and t. The second
term measures the change of aggregate employment share of occupation j attributable to
shifts in employment shares between continuing establishments with varying occupation
structures. The sum of the two first components is the aggregate change of employment

13
share of occupation j among continuing establishments. The third component indicates the
contribution of entries, which is positive when the employment share of occupation j in
new establishments is higher than in continuing establishments (i.e. 𝑆𝑗𝑗𝑁 > 𝑆𝑗𝑗𝐶). The fourth
component indicates the contribution of exits, which is positive when the employment
share of occupation j in exiting establishments is lower than in continuing establishments.
Note that according to Equation (1) the net effect of entries and exits on the employment
share change of occupation j is the difference of the change among all establishments and
the change among the continuing establishments only. In other words, the net entry is
equal to∆𝑆𝑗 − ∆𝑆𝑗𝐶 .
Aggregate Level Patterns
It is interesting to first look at the aggregate level trends in job polarization using
descriptive analysis and techniques that are prevalent in the literature. To begin with, we
utilize the earliest years of available data that have a consistent occupational classification
(1995 and 2000) to see whether there is any evidence of job polarization in the late 1990s.
This analysis does not reveal any consistent pattern of polarization (Figure A5). Splitting
the data into surviving firms versus entering and exiting firms shows some minor peaks
and dips (not shown here), but overall the pattern is quite stagnant and does not resemble
the U-shaped curves found in many other studies. In a stark contrast, if we instead look at
the 2000-2009 period the overall pattern of job polarization becomes evident regardless of
the level of occupational classification used. Figure 1 shows the change in the share of jobs
between 2000 and 2009 by occupation using the 1-digit ISCO88-classification. The increase
(~2%) in professional occupations corresponds to around 30 thousand jobs, while the
change (~2%) in services translates roughly to 20 thousand jobs. The occupations that
have lost the most jobs are related to industrial and clerical tasks.
An alternative way to characterize the polarization of job distribution is to rank
occupations based on their initial wage (i.e. annual earnings in 2000), and then look at
changes in employment across those occupations. Figure 2b show this at the 2-digit
14
occupational level.18 Notably, when analyzing the data at this 2-digit (or finer) occupational
classification it is clear that the polarization patterns are not identical across occupations
that are quite similar in terms of their initial wage, but instead the pattern shows peaks and
troughs. The largest peaks are associated with occupations 51 (“Personal and Protective
Service Workers”), 34 (“Other Associate Professionals”), and 12 (“Corporate Managers”),
whereas the biggest dips represent occupations 82 (“Machine Operators and Assemblers”)
and 72 (“Metal, Machinery and Related Trades Workers”). Occupations 51 and 34 are
relatively large (accounting for 4.9% and 8.1% of the total jobs in the non-agricultural
business sector in 2000), and cover a wide variety of professions including child-care
workers, hairdressers, police officers (in occupation 51), as well as finance dealers,
insurance reps and sales reps (in occupation 34).
A description of the characteristics of workers by occupation in 2000 and 2009 is
shown in Table 3. The relative skill content ranking of the occupations has remained
unchanged although the share of workers with a lower or upper tertiary degree and the
average years of education have increased in every occupation. There is a considerable
degree of gender segregation across occupation, which, if anything, appears to be
increasing over time. All occupations except services seem to be aging, and managers have
the highest average age among the occupations. There are large differences in the average
monthly earnings across occupations and the salaries are growing fastest in the highest
earning occupations. The relative wage increases are smallest in those occupations whose
share of total employment has been declining over time, but the differences are not very
large.
Decomposition Results
Figures 3a and 3b show the results of the decomposition in Equation (1). Figure 3a
displays the total change in the occupation share, along with the proportion of the total
change that can be attributed to the within-establishment component among the stayer
firms. The difference between these two lines is then examined in figure 3b, where the 18 The smoothed changes are created using the nonparametric LOWESS-method, i.e. the locally weighted scatterplot smoothing. Mitrunen (2013) also performed similar analyses with Finnish data for period 1995-2008.

15
between-establishment component is shown along with the entry and exit components.
Importantly, the figures demonstrate that the “left-hand side of polarization” is essentially
a within-establishment phenomenon, i.e. the share of high-wage occupations has increased
within continuing establishments. However, a comparison of the aggregate and within-
establishments patterns reveals that less than half of the “right-hand side of the
polarization” can be attributed to changes within establishments and a significant part to is
related to establishment-level restructuring that include shifts in employment share among
continuing establishments (i.e. the between component) as well as entries and exits of
establishments. These figures also show that a sizeable part of the increase in employment
share of the service occupations can be attributed to entries, i.e. the employment share of
service occupations is typically larger among new establishments than (older) continuing
establishments. The exit of establishments has played an insignificant role. On the other hand,
the between-component has also contributed to the pattern by having a negative effect on the
employment change of plant operators and craft employees. This indicates that that there is a
negative correlation between the employment share of those occupations and the growth of
establishments in terms of total employment. On the other hand, establishments that had a
relatively large share of elementary and service occupations increased their total employment
share among continuing establishments. 19, 20
Finally, earlier studies have used occupational tasks to group them into more versus
less skill-intensive occupations.21 Here we classify occupations into four main groups based
on the typical tasks they involve: abstract, routine, service and elementary. Just like the
19 This analysis is done using all firms if they had at least one employee in 2000 and/or 2009. The firm level regression analysis uses only those firms that had at least 10 workers during the year of observation. We re-calculated the employment shares by occupation and firm type to see if the overall pattern is sensitive to the size limitation. The pattern is quite robust to excluding the smallest firms, even though the number of firms is reduced quite dramatically (from about 28 thousand to 6 thousand firms per year). 20 Figure A6 plots the occupational distribution in the 2000 firms that stay until 2009 versus those that exit after 2000. 2009 occupational distribution is shown for firms that continued to exist since 2000 versus those entering after 2000. This shows that exiting firms had a similar job distribution as surviving firms, although some more jobs in craft occupations. Entering firms were more concentrated on service and elementary jobs relative to existing firms that had a larger share of jobs in technical and professional occupations, as well as in clerical occupations. 21 Specifically, earlier studies typically characterize occupations as mostly involving abstract, routine or service tasks (Acemoglu and Autor, 2010). Some studies derive task intensity measures for 2-digit ISCO occupation using ONET data and converting the ISCO classification to the SOC classification used in the US-based ONET (e.g. Goos, Manning and Salomons, 2010).
16
more detailed graphs above, this analysis (in Table 4) demonstrates how occupations
associated with routine tasks have declined in share while both abstract and service
occupations have increased. The decline in routine occupations is driven both by the within
and between components (among the continuing firms), while firm entry and exit have had
a much smaller role. For abstract occupations the within-component dominates, while the
between-component is most important in the growth of service occupations. These results
are largely in line with earlier studies (e.g. Bockerman et al., 2016; Goos et al., 2010).
To summarize, based on the various descriptive analyses and decompositions,
regardless of the approach taken to characterize or group occupations, we reach the same
conclusion: mid-level jobs are disappearing while top- and bottom-level jobs are growing.
Interestingly, unlike in the United States, this polarization of employment shares is not
really reflected in the wage distribution (Figure A7). Mean earnings have exhibited steady
growth across the board, although the gap between top- and bottom-occupations has
slightly risen. There does not appear to be any declining trend in earnings associated with
mid-level occupations.
V. Regression Approach: OLS and 2SLS
Next we estimate a model for the occupational share changes using the FLEED data by
occupation group at the firm level, where the dependent variable is the change in the share
of occupation group j within the firm i from 2000 to 2009. The model includes the 2000
average log wage of employees in firm i, average age of employees in the firm and industry
dummies. The latter are intended to capture any economy-wide shifts that are taking place
in the industry. The estimated equation is of the general form:
ΔSijt+1,t = α + β1Fit + β2log(wijt) + β3ageit + β4Iit +εit , (2)
where S is the employment share, w is the average annual salary of j workers in firm i, age
is the average age of employees in the firm in 2000, and I is a vector of industry dummies.
Firm level factors of interest captured in F will include measures related to import and
export activity, outsourcing, R&D expenditures and ICT use.
17
One potential identification concern is related to firm-level shocks (e.g. in product or
service demand, or firm-level productivity) that might have a simultaneous impact on the
firm’s trading activities and its occupational employment decisions. Dealing with this
concern requires an instrumental variable that impacts the firm’s international activities
(in particular exports, imports and outsourcing) but is uncorrelated with the employment
decisions. We use the instrumental variables approach utilized in recent studies by
Hummels et al. (2014), and Nilsson Hakkala and Huttunen (2014, 2016). To be more
specific, we create a firm-product-country level measure of exposure to increased world
supply using very detailed data from the Finnish Customs and the UN Comtrade database.
The Comtrade data is a comprehensive register of all export and import flows between
each country pair and includes goods classifications all the way to the most detailed 6-digit
HS2002 level. From those data we calculate for each good – reporting country pair the total
imports from the world market minus the imports from Finland, and the total exports to
the world market minus the exports to Finland. The Finnish customs data is at the firm –
goods classification – partner country level, and allows us to characterize the exact import
and export pattern of each trading firm at the most detailed (8-digit) goods category
level.22 The customs data allow us to calculate the share of the specific good – partner
country as a percentage of the firm’s total imports and exports that can be then used as a
weight to take into account how significant any world import or export shock is to any
specific firm. Any shocks in the world trading environment (such as the China WTO
membership in 2001) would have firm-specific effects depending on how much each
Finnish firm is engaged in trade within the specific goods category affected.
The instrument for firm-level imports is based on the world export supply measure,
WESckt, which is country c’s total supply of product k to the world market in year t,
excluding the supply to Finland. To create the instrument, we weight each firm i’s product k
from country c at time t with the share of c - k product in the firm’s total material imports 22 One difference between the Comtrade and Finnish Customs data is related to the country classification. While Comtrade reports the trade flows between each individual country pair, Finnish Customs data only reports individual countries to the extent that they are among the major export and import partners of Finland. Outside of those, countries are aggregated by continent. This needs to be accounted for in the generation of the instrumental variable. The amount of trading that takes place between Finnish companies and the non-major trading countries is relatively small: less than 5 percent of total imports and exports in 2000.

18
in 2000. We then generate the firm-level measure by aggregating across all products from
all countries, and weighting each product c-k with its share in firm’s imports in the first
period the firm is observed in the trade data. The time-varying instrument for each firm i in
year t is as follows:
IVEit = ΣsickWESckt. (3)
Since our regression analysis is looking at first-differences (i.e. comparing the firm-level
change in 2000-2009) we use the 2000-2009 change in the IVEit as our instrumental
variable. We would expect the WES-based instrument to have a positive impact on the
firm’s imports, as an increase in the world export supply should encourage additional
importing by Finnish firms within the specific goods category. Like Hummels et al. (2014),
we assume that firms have pre-existing trading relationships that make it advantageous to
source specific goods and services from specific countries, and likewise to export specific
goods and services to specific countries. To some extent, these trading relationships are
pre-determined. Over time, external shocks in the international environment impact the
extent to which such trading relationships remain advantageous.
Again, following Hummels et al. (2014), we create a similar instrument based on the
world import demand (WID) to be used for the firm level exports. The instrument is
calculated as follows:
IVIit = ΣsickWIDckt, (4)
where WIDckt is the world import demand. It is calculated as country c’s total purchases of
good or service k from the world market (minus any purchases from Finland) at time t. In
general, WID might increase / decrease because of a shock to demand such as consumers’
change of tastes or firms change of their use of the specific product). A change in WID might
also results from a loss in country c’s comparative advantage in product k. We would
expect the WID-based instrument to have a positive impact on the firm’s exports, as an
increased world import demand should encourage additional exporting by Finnish firms
within the specific goods category. We report the first stage results for our instruments in
the regression tables discussed in the next section.

19
VI. Role of Globalization and Technology: Regression Results
Description of the Firm Sample Across Data Sets
This section first shows some descriptive statistics and coverage analysis for the sample
of firms included in the regressions. We estimated the regressions using the total FLEED
that covers all firms and all of their workers in the employment register and follows them
over time. It should be noted that the definition of entry, exit and stayer is done using the
business register and therefore excludes any workers of entities that are not considered to
be private firms. This includes, for example, public sector entities such as municipalities,
towns and other large public sector employers. We acknowledge that the job distribution is
rather different in those entities than in private sector firms, but including public sector
jobs is outside the scope of the current analysis due to the very different decision making
process in those entities and their exclusion from all firm surveys and customs data utilized
below for the regression analyses. 23 Below we first characterize the final firm sample and
the various data sets that are combined into the total FLEED. For estimation, we include
firms that had at least 10 employees in the focal year, and exclude employees who worked
for the firm for less than 6 months during the year or had zero earnings from the firm
during the year. These selection criteria do not affect the results markedly.24
As the FLEED covers all private sector employees and firms it includes a large number
of observations both at the worker and firm level. Customs data on trade of goods can also
be considered a census of importing and exporting firms, and the absence of a firm from
those data simply indicates that the firm is not engaged in international trade of goods or
services (i.e. the value of the goods imported and exported by those firms is zero). Of the
7,091 firms that are observed in the business register with an entry date before 2000 and
either no exit date or an exit date later than 2009 a total of 2,818 (40%) report a positive
amount of imported or exported goods in 2000 or 2009. In addition, 668 report a positive
23 Appendix figure A8 shows the change in the occupational distribution in the public sector between 2000 and 2009, and figure A9 the overall polarization chart that includes both the public and private sector jobs. Very interestingly, the public sector exhibits a slightly U-shaped job distribution, and hence including the public sector into the private sector analysis mitigates the polarization pattern. 24 Upon request we will provide robustness checks using only firms that have at least 20 employees, or where we drop persons whose earnings are in the top or bottom 1% of the FLEED earnings distribution.
20
value of service imports or exports.25 The average size of firms in those groups is 105
employees in 2000 (111 employees in 2009) for goods exporters / importers and 282
employees in 2000 (272 employees in 2009) for service exporters / importers,
respectively.26
Coverage related to the three other sets of auxiliary survey data is more limited,
although large firms are generally covered by every survey. Of the 7,091 firms 978 are
covered by the 2001 ICT survey and the average size of the covered firms is about 140 in
2000 (and 152 in 2009). The firms not covered are much smaller on average, about 36
employees in 2000 (41 in 2009). Similarly, the international sourcing survey covers only
552 of the firms and is heavily focused on larger companies. The average size of covered
firms in that survey is 313 employees in 2000 (320 in 2009). Again, the firms not covered
have on average 38 employees in 2000 (44 in 2009). Finally, the R&D survey also
oversamples large firms and covers 1,061 of the regression sample firms in 2000 with an
average size of 131 employees (134 in 2009). The firms not part of the 2000 R&D survey
have an average of 41 employees in 2000 (49 in 2009). The part of the sample that is
covered by all three surveys contains just 322 firms with an average size of 381 employees
in 2000 (380 in 2009). These limitations and their implications for the regression analysis
are discussed below.
Continuing Firms: Ordinary Least Squares Results
Analyses that follow focus only on continuing firms, i.e. those that exist both in 2000
and 2009. Exiting and entering firms are described separately below. Before commencing
with the regression analysis it is worth reminding that employment polarization is taking
place also within the sample of continuing firms (Figures 3a and 3b).27 The first set of
25 In some sense, the service import and export data can also be considered “a census” because the sample attempts to include all firms with known or suspected service import or export. We test for the sensitivity of our findings to the treatment of the service trade data in the regression analysis discussed below. 26 The average size of a non-importing and non-exporting firm was 19 employees in 2000 and 23 employees in 2009. For the service imports and exports, the firms not engaged in those activities had an average of 25 employees in 2000 and 29 employees in 2009. 27 In additional analyses (not shown here) we confirm that polarization among continuing firms is evident both at the 1-digit as well as the 2-digit level.
21
regressions uses data at the firm level and combines occupations into four broad groups: 1)
managers, professionals and technical personnel (i.e. abstract occupations), 2) plant
operators, craft and clerical occupations (i.e. routine occupations), 3) service occupations,
and 4) elementary occupations. We should keep in mind that the regressions look at
changes in occupation shares within firms (i.e. firm employment composition), and not
changes in the number of employees. Since the next several tables provide a complex set of
regression results and specification checks, the simple summary below will outline the
main findings that survive the inclusion of additional controls and other robustness checks.
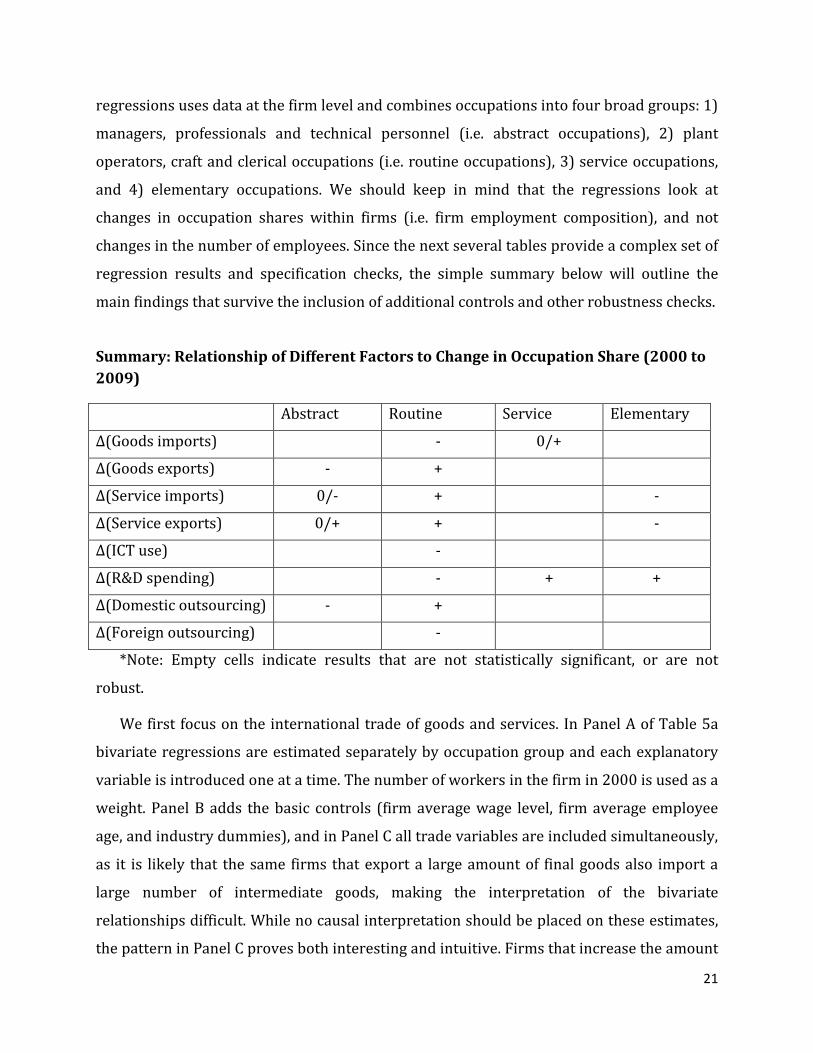
Summary: Relationship of Different Factors to Change in Occupation Share (2000 to 2009)
Abstract Routine Service Elementary
Δ(Goods imports) - 0/+
Δ(Goods exports) - +
Δ(Service imports) 0/- + -
Δ(Service exports) 0/+ + -
Δ(ICT use) -
Δ(R&D spending) - + +
Δ(Domestic outsourcing) - +
Δ(Foreign outsourcing) -
*Note: Empty cells indicate results that are not statistically significant, or are not
robust.
We first focus on the international trade of goods and services. In Panel A of Table 5a
bivariate regressions are estimated separately by occupation group and each explanatory
variable is introduced one at a time. The number of workers in the firm in 2000 is used as a
weight. Panel B adds the basic controls (firm average wage level, firm average employee
age, and industry dummies), and in Panel C all trade variables are included simultaneously,
as it is likely that the same firms that export a large amount of final goods also import a
large number of intermediate goods, making the interpretation of the bivariate
relationships difficult. While no causal interpretation should be placed on these estimates,
the pattern in Panel C proves both interesting and intuitive. Firms that increase the amount

22
of traded goods are more likely to increase the share of production occupations (group 2)
and reduce the share of professional occupations (group 1). The share of service (group 3)
occupations are not really affected by the changes in exports and imports, while the
elementary occupations (group 4) are increased particularly in firms that increase the
amount of goods imported.
In the alternative polarization specification (last column) we attempt to create a single
index to characterize the relative polarization at the firm level, and use that index as the
dependent variable in our regressions. Here, occupations are grouped into 3 groups,
combining service and elementary occupations into a single category (G3). The index is
calculated as
PI = 0.5 * (dG1 + dG3) – dG2, (5)
where d signals the percentage share change of the occupation group between 2000
and 2009, and the groups are as follows. G1 includes managers, professionals and technical,
G2 contains plant operators, craft and clerical occupations, and G3 has elementary and
service occupations. The OLS results using the single polarization index as the dependent
variable are in line with the findings by occupation group. Most importantly, increase in
trade of goods is negatively associated with the overall pattern of job polarization at the
firm level.
Table 5b focuses on the international trade of services. The service imports and exports
do not play a large role in most cases, although firms increasing their service exports and
imports tend to somewhat reduce the share of elementary occupation workers. Conversely,
firms increasing their trade in services seem to increase their production and clerical
worker share. For the other occupations, especially once we include the other firm-level
controls, the estimated effects are essentially zero (Panel B). In Panel C we include controls
for the firm’s changes in the imports and exports of goods, which does not significantly
impact the finding related to elementary occupations or the production and clerical
occupations. Finally, Panel D shows estimations where we include also those firms that
were not part of the survey asking about the international service trade activities. As we
explained above, it is reasonable to assume that most of the non-interviewed firms had

23
zero imports and exports of services, given how the sample frame was formed. When we
use polarization index as the outcome variable, we find that increase in firms’ trade in
services tend to diminish the job polarization pattern in those firms.
Table 6a looks at the firm characteristics reported in the various survey data sets, and
similarly starts with bivariate regressions in Panel A, adds the basic firm level controls in
Panel B, and further explores splitting the sourcing survey (Panel C) and the R&D survey
(Panel D) into more detailed components. The results from these regressions are
somewhat harder to compare across specifications as each survey covers a somewhat
different sample of firms. Also, while interpreting the results one should not be assigning a
cause-and-effect relationship for these variables, and the estimated coefficients are not
always statistically significant. With that in mind, there are some interesting relationships
that emerge from the results. For example, in Panel B, firms where a large share of
employees use ICT at the beginning of the period are more likely to reduce the share of
production and clerical workers (group 2) who perform routine tasks. In that sense, our
results line up with those reported by Bockerman et al. (2016). Similarly, firms investing a
lot in R&D tend to reduce the share of routine workers, although that result is very
different depending on whether we look at internal versus external R&D spending (Panel
D): firm with more external R&D spending actually increase the share of the routine
occupation group and reduce managerial, professional and technical employment share.
The results regarding R&D are robust to the use of polarization index as the outcome
variable. We are also able to split outsourcing activities more finely, resulting in some
interesting observations. Elementary worker (group 4) share falls in firms that are
planning to outsource activities, but the change in the service worker (group 3) share
shows no significant correlation with any kind of outsourcing. Interestingly, routine worker
share is increased in firms that outsource domestically, but reduced in those firms that
outsource tasks abroad. This may be related to the type of tasks that are being outsourced.
Domestic outsourcing tends to be related to tasks such as cleaning services, while
production tasks may be outsourced to foreign locations. Below we attempt to provide a
more causal interpretation for some of these findings. The results using the single
polarization index as the dependent variable are in line with these findings. In particular,
24
the overall occupational polarization pattern is positive (negative) in firms that outsource
domestically (abroad). The results using the single polarization index as the dependent
variable are in line with these findings. In particular, the overall occupational polarization
pattern is positive (negative) in firms that outsource domestically (abroad).
Two-Stage Least Squares Results
When modeling firm-level choices on employment and engagement in trading activities
we generally need to resort to an instrumental variables approach to deal with the fact that
many firms are importing intermediate goods and exporting the final goods, and it is
therefore difficult to disentangle each of these separate effects without more detailed goods
category level data. Using data from the Finnish Customs we can separate out the imports
and exports by goods category, and continue with the instrumental variables estimation.
We take the firm-product-country-level Customs data and combine it with Comtrade trade
flow data to form instrumental variables (as explained in more detail above).
Table 5a reports the results of the 2SLS regressions for the goods imports and exports,
and table 6b for the offshoring and outsourcing related variables. The results are generally
in line with the OLS analysis discussed above, although the estimates are less precise and
point estimates somewhat smaller. The only exception is the single polarization index for
which we find larger and statistically significant point estimates. For the goods imports and
exports (bottom panel), the 2SLS results verify the OLS conclusion that managerial and
professional jobs are declining in firms that increase their goods exports, while those same
firms appear to increase their share of routine workers. Conversely, routine worker shares
are declining as firms increase the imports of goods from abroad. These results seem quite
consistent with our expectations. Finally, changes in the share of elementary workers and
service workers are largely unrelated to the goods imports and exports, apart from the
positive relationship between service worker share and good importing.
For the outsourcing / offshoring model that pertains to the firm’s activities and plans in
the early-2000s we obtained from the Comtrade data for an earlier time period (1999-
2002) to better fit the timing related to the decision of the firm to begin offshoring (table

25
6b). The instrument performs reasonably well, with F-statistics often exceeding 10. We
would nevertheless view these results as less robust than those related to goods and
service trading. Based on these findings, it appears that all forms of outsourcing (domestic,
foreign and planned) are unrelated to changes in managerial occupations and service
occupations. Outsourcing abroad is negatively related to the occupation share change in
production related occupations, while domestic and planned outsourcing seem positively
related to those occupations. Conversely, elementary occupations see shrinking shares
with domestic and planned outsourcing. We view these results as plausible, but somewhat
tentative given the smaller sample size and less powerful first stage in the 2SLS. Further
research into the role of outsourcing could be done, especially related to the specific tasks
and functions that the firms have outsourced.
VII. Conclusions
This paper analyzes the extent of job polarization in Finland using a unique firm level data
platform where firm-worker panel data have been augmented to include measures of
goods and service imports and exports, outsourcing and offshoring, and technology
intensity and usage (e.g. R&D and ICT). We begin by comparing the polarization patterns in
the 1990s and 2000s and note that there was very little evidence of the U-shaped pattern in
the 1990s, whereas polarization became quite evident in the 2000s. We then analyze the
degree to which the polarization in the 2000s stems from changes within existing surviving
firms versus via firm-level restructuring involving employment reallocation between
continuing firms as well as entries and exits of firms. In this analysis we make use of
establishment data that is less prone to artificial entries and exits due to ownership or
other organizational changes over time plagued in company data. We find that the source
of the changes varies across occupations: while the increase in managerial and professional
occupations is coming essentially from changes within firms, the entries and reallocation of
employment between continuing firms substantially contribute to increase in service
occupations. The craft occupations are likewise declining both within firms and through
reallocation of employment between firms, whereas the entry and reallocation of
26
employment between firms account for a large share in the decline of plant operator
occupations.
Simple descriptive regressions show that firms with increasing exports are more likely
to increase the share of production occupations and reduce the share of professional
occupations within the continuing firms. On the other hand, the share of service and
elementary occupations are reduced particularly in firms that import a lot of goods. Firms
that outsource globally are more likely to reduce workers in elementary occupations,
whereas firms outsourcing domestically reduce the number of workers in service
occupations. Following recent studies by Hummels et al. (2014) and Hakkala and Huttunen
(2014, 2016) we develop an instrumental variables approach to deal with the endogeneity
between occupational employment changes and the outsourcing decisions and
import/export choices that the firms make.
This paper demonstrates the importance for including the firm in analyses of aggregate
labor market trends. While it is true that job polarization exists at the level of the labor
market, the mechanisms and driving forces are quite different for each occupation. This is
especially important if we try to consider policy measures and other potential responses to
these polarization patters that are pervasive in most developed countries. This paper has
taken the first step at describing the firm- and establishment level patterns underlying the
aggregate level labor market polarization, and in establishing a link between firm-level
polarization and the various international activities that the firms engage in. Much work is
still required to fully understand the specific mechanisms and links at the firm level, and
the data available in Finland (and other Nordic countries) provides opportunities for future
research to delve into those questions.

27
References
Acemoglu, D. and D. Autor (2011). Chapter 12 - Skills, Tasks and Technologies: Implications for Employment and Earnings. Volume 4, pp. 1043-1171. Elsevier.
Asplun R., Barth E. and Lundborg P. (2011) Polarization of the Nordic Labor Markets. Finnish Economic Papers 24(2): 87-110.
Autor D. (2010) The Polarization of Job Opportunities in the U.S. Labor Market. The Hamilton Project and the Center for American Progress, April 2010, pp. 1-40.
Autor D. and Dorn D. (2013) The Growth of Low-Skill Service Jobs and the Polarization of the US Labor Market. American Economic Review 103(5): 1553-1597.
Autor, D., L. Katz, and A. B. Krueger (1998). Computing Inequality: Have Computers Changed the Labor Market? Quarterly Journal of Economics 113 (4): 1169-1213.
Autor, D., F. Levy, and R. Murnane (2003). The Skill Content of Recent Technological Change: An empirical exploration. Quarterly Journal of Economics 118 (4): 1279-1333.
Autor, D. H., L. F. Katz, and M. S. Kearney (2006). The Polarization of the US Labor Market. The American Economic Review 96 (2): 189-194.
Berman, E., J. Bound, and S. Machin (1998). Implications of Skill-Biased Technological Change: International Evidence. Quarterly Journal of Economics 113 (4): 1245-1279.
Bound, J. and G. Johnson (1992). Changes in the Structure of Wages in the 1980's: an Evaluation of Alternative Explanations. American Economic Review 82 (3): 371-92.
Bresnahan, T., E. Brynjolfsson, and L. Hitt (2002). Information Technology, Workplace Organization, and the Demand for Skilled Labor: Firm-Level Evidence. Quarterly Journal of Economics 117 (1): 339-376.
Bockerman P, Laaksonen S. and Vainionmaki J. (2013) Is There Job Polarization at the Firm Level? Tampere Economic Working Papers 91.
Bockerman P, Laaksonen S. and Vainionmaki J. (2016) Are Jobs More Polarized in ICT Firms? IZA Working Papers 9851.
Bockerman P, Kauhanen A. and M. Maliranta (2012). ICT and Occupation-Based Measures of Organisational Change: Firm and Employee Outcomes. ETLA Discussion Papers No. 2.
Böckerman P. and M. Maliranta (2013). Outsourcing, Occupational Restructuring, and Employee Well-Being: Is There a Silver Lining? Industrial Relations: A Journal of Economy and Society, 52(4), 878-914.
Card, D. and J. DiNardo (2002). Skill-biased technological change and rising wage inequality: Some problems and puzzles. Journal of Labor Economics 20 (4): 733-783.
Cortes G.M. and A. Salvatori (2015) Task Specialization within Establishments and the Decline of Routine Employment. Mimeo.
DiNardo, J. E. and J.-S. Pischke (1997). The Returns to Computer Use Revisited: Have Pencils Changed the Wage Structure Too? The Quarterly Journal of Economics 112 (1): 291-303.

28
Goos, M. and A. Manning (2007). Lousy and Lovely Jobs: The Rising Polarization of Work in Britain. The Review of Economics and Statistics 89 (1): 118-133.
Goos, M., A. Manning, and A. Salomons (2009). Job polarization in Europe. American Economic Review 99 (2): 58-63.
Goos, M., A. Manning, and A. Salomons (2010). Explaining Job Polarization in Europe: The Roles of Technology, Globalization and Institutions. CEP Discussion Papers (1026).
Goos, M., A. Manning, and A. Salomons (2014) Explaining Job Polarization: Routine-Biased Technological Change and Offshoring. American Economic Review 104(8): 2509-2526.
Guadalupe, M. and J. Wulf (2010). The Flattening Firm and Product Market Competition : The Effect of Trade Liberalization on Corporate Hierarchies. American Economic Journal: Applied Economics 2 (4): 105-127.
Haller, S. A., Damijan, J., Kaitila, V., Kostevc, Č., Maliranta, M., Milet, E., Mirza D., Rojec, M. (2014). Trading Firms in the Services Sectors: Comparable Evidence from Four EU Countries. Review of World Economics, 1-35.
Harrigan J., A. Reshef and F. Toubal (2016) The March of the Techies: Technology, Trade, and Job Polarization in France, 1994-2007. Mimeo.
Hummels D., R. Jorgensen, J. Munch and C. Xiang (2014) The Wage Effects of Offshoring: Evidence from Danish Matched Worker-Firm Data. American Economic Review 104 (6): 1597–1629.
Juhn, C., K. M. Murphy, and B. Pierce (1993). Wage Inequality and the Rise in Return to Skill. Journal of Political Economy 101 (3): 410-442.
Katz, L. F. and K. M. Murphy (1992). Changes in Relative Wages, 1963-1987: Supply and Demand Factors. Quarterly Journal of Economics 107 (1): 35. Keller W. and H. Utar (2015). International Trade and Job Polarization: Evidence at the Worker Level. Mimeo.
Lindbeck, A. and D. Snower (1996). Reorganization of Firms and Labor-Market Inequality. American Economic Review 86 (2): 315-321.
Machin, S. and J. Van Reenen (1998). Technology and Changes in Skill Structure: Evidence from Seven OECD Countries. The Quarterly Journal of Economics 113 (4): 1215-1244.
Maliranta M. (2013). Globalization, Occupational Restructuring and Firm Performance. ETLA Discussion Papers No. 5.
Meisenheimer, J. (1998). The Services Industry in the Good versus Bad Jobs Debate. Monthly Labor Review 121(2): 22-45.
Michaels, G., A. Natraj, and J. Van Reenen (2014). Has ICT Polarized Skill Demand? Evidence from Eleven Countries Over 25 Years. Review of Economics and Statistics 96 (1): 60-77.

29
Mishel, L., Shierholz, H. and J. Schmitt (2013). Don’t Blame the Robots: Assessing the Job Polarization Explanation of Growing Wage Inequality. EPI---‑CEPR Working Paper, November.
Mitrunen M. (2013) Työmarkkinoiden polarisaatio Suomessa. Government Institute for Economic Research Memorandum 33.
Nilsson Hakkala K. and Huttunen K. (2014) Displacing Tasks: Understanding the Employment Effects of Offshoring, mimeo.
Nilsson Hakkala K. and Huttunen K. (2016) Worker Level Consequences of Import Shocks, VATT Working Paper 74.
Oesch D. and Rodriguez Menes J. (2010) Upgrading or polarization? Occupational change in Britain, Germany, Spain and Switzerland, 1990-2008. MPRA Paper 21040.
Spitz-Oener, A. (2006). Technical Change, Job Tasks and Rising Educational Demands: Looking Outside the Wage Structure. Journal of Labor Economics 24 (2): 235-270.
Van Reenen J. (2011). Wage inequality, technology and trade: 21st century evidence. Labour Economics 18 (6): 730–741.
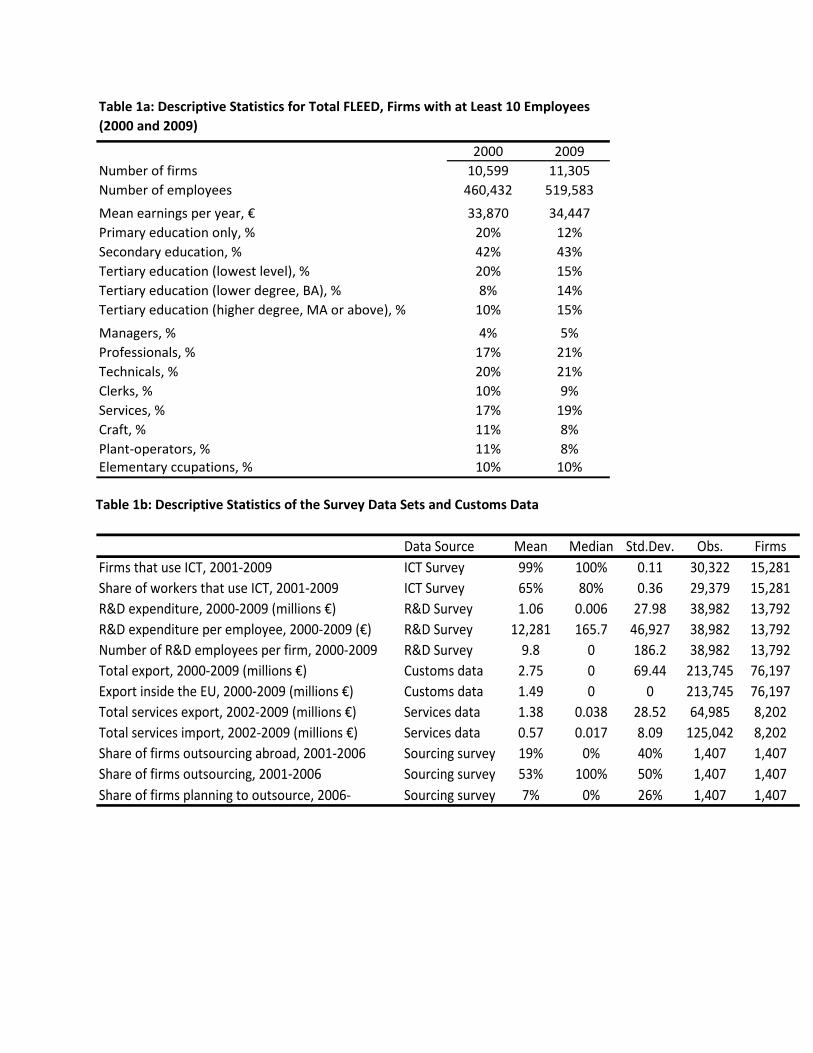
Table 1b: Descriptive Statistics of the Survey Data Sets and Customs Data
2000 2009Number of firms 10,599 11,305Number of employees 460,432 519,583Mean earnings per year, € 33,870 34,447Primary education only, % 20% 12%Secondary education, % 42% 43%Tertiary education (lowest level), % 20% 15%Tertiary education (lower degree, BA), % 8% 14%Tertiary education (higher degree, MA or above), % 10% 15%Managers, % 4% 5%Professionals, % 17% 21%Technicals, % 20% 21%Clerks, % 10% 9%Services, % 17% 19%Craft, % 11% 8%Plant-operators, % 11% 8%Elementary ccupations, % 10% 10%
Table 1a: Descriptive Statistics for Total FLEED, Firms with at Least 10 Employees (2000 and 2009)
Data Source Mean Median Std.Dev. Obs. FirmsFirms that use ICT, 2001-2009 ICT Survey 99% 100% 0.11 30,322 15,281Share of workers that use ICT, 2001-2009 ICT Survey 65% 80% 0.36 29,379 15,281R&D expenditure, 2000-2009 (millions €) R&D Survey 1.06 0.006 27.98 38,982 13,792R&D expenditure per employee, 2000-2009 (€) R&D Survey 12,281 165.7 46,927 38,982 13,792Number of R&D employees per firm, 2000-2009 R&D Survey 9.8 0 186.2 38,982 13,792Total export, 2000-2009 (millions €) Customs data 2.75 0 69.44 213,745 76,197Export inside the EU, 2000-2009 (millions €) Customs data 1.49 0 0 213,745 76,197Total services export, 2002-2009 (millions €) Services data 1.38 0.038 28.52 64,985 8,202Total services import, 2002-2009 (millions €) Services data 0.57 0.017 8.09 125,042 8,202Share of firms outsourcing abroad, 2001-2006 Sourcing survey 19% 0% 40% 1,407 1,407Share of firms outsourcing, 2001-2006 Sourcing survey 53% 100% 50% 1,407 1,407Share of firms planning to outsource, 2006- Sourcing survey 7% 0% 26% 1,407 1,407
31
Table 2: International Sourcing by Business Function and Firm Size
Table 3: Characteristics of workers by occupation, 2000 and 2009
Firms < 100 empl. Firms > 100 empl.Production of goods and services 44% 42%Distribution and logistic 90% 80%Marketing and sales 29% 26%Information and ict services 62% 59%Administrative services 29% 33%Engineering and technical services 29% 21%R&D 18% 14%Other services 7% 13%Number of firms 147 594
2000 2009 2000 2009 2000 2009 2000 2009 2000 2009 ChangeManagers 48% 51% 14.8 14.90 26% 29% 44 45.7 4,667 5,175 11%Professionals 64% 68% 15.5 15.70 37% 39% 39.7 41.3 3,483 3,839 10%Technicals 17% 34% 13.2 13.90 46% 53% 40.4 41.4 2,741 2,942 7%Clerks 7% 21% 12.4 13.10 80% 80% 40.5 41.6 2,173 2,374 9%Services 2% 7% 11.6 11.90 73% 76% 35.8 35.4 1,721 1,774 3%Craft 1% 2% 11.4 11.60 10% 8% 39.6 40.5 2,403 2,617 9%Plant-operators 1% 2% 11.0 11.30 28% 23% 38.9 41.5 2,334 2,548 9%Elementary 1% 3% 10.8 11.20 49% 49% 36.8 38.1 1,721 1,828 6%
Share of highly educated, %
Mean age Mean monthly earnings, €Mean years of
educationShare of women, %
Occupation Group ΔEmp. Share Within Between Entry Exit
Abstract 0.053 0.062 0.005 -0.130 -0.001Routine -0.086 -0.450 -0.031 -0.010 0.000Service 0.037 -0.002 0.029 0.012 -0.002Elementary -0.003 -0.015 -0.003 0.012 0.003
Table 4: Decomposition of Employment Share Change by Occupation Group (2000 to 2009)
* Notes: Occupations are grouped as 1) Abstract = Managerial, Professional & Technical, 2) Routine = Clerical, Plant Operators & Craft Workers, 3) Service Occupations, 4) Elementary Occupations.
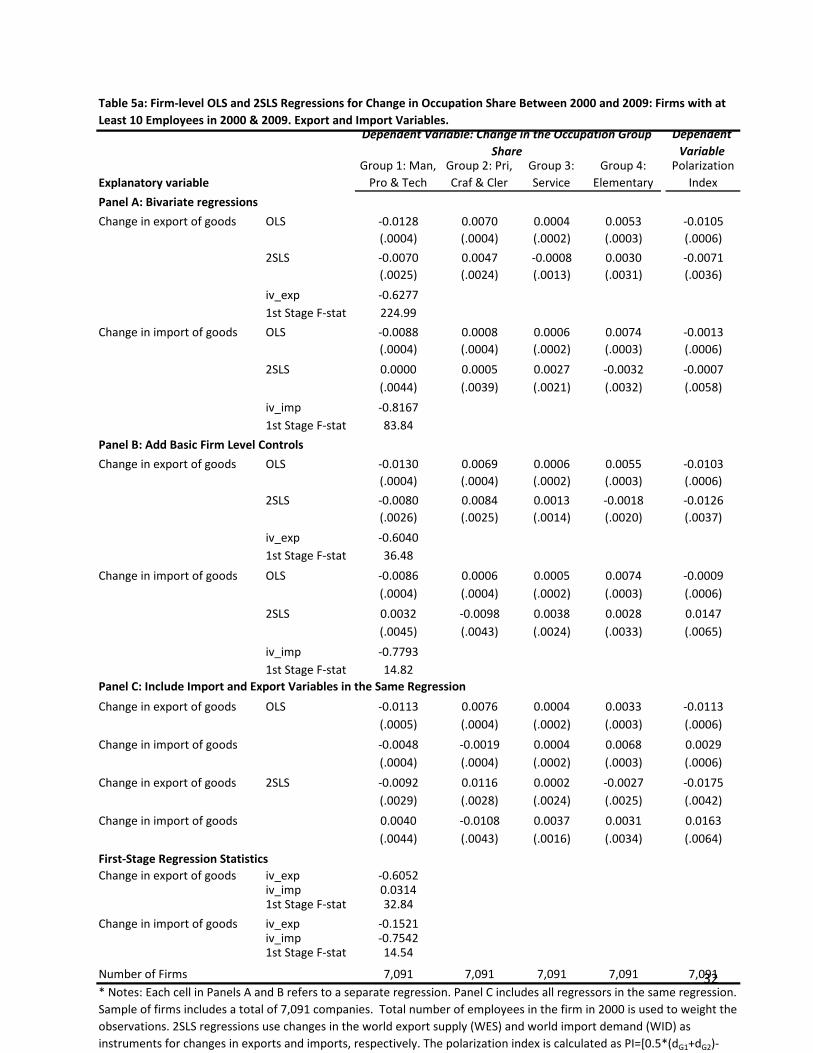
32
Dependent Variable
Explanatory variableGroup 1: Man,
Pro & TechGroup 2: Pri, Craf & Cler
Group 3: Service
Group 4: Elementary
Polarization Index
Panel A: Bivariate regressionsChange in export of goods OLS -0.0128 0.0070 0.0004 0.0053 -0.0105
(.0004) (.0004) (.0002) (.0003) (.0006)2SLS -0.0070 0.0047 -0.0008 0.0030 -0.0071
(.0025) (.0024) (.0013) (.0031) (.0036)iv_exp -0.62771st Stage F-stat 224.99
Change in import of goods OLS -0.0088 0.0008 0.0006 0.0074 -0.0013(.0004) (.0004) (.0002) (.0003) (.0006)
2SLS 0.0000 0.0005 0.0027 -0.0032 -0.0007(.0044) (.0039) (.0021) (.0032) (.0058)
iv_imp -0.81671st Stage F-stat 83.84
Panel B: Add Basic Firm Level ControlsChange in export of goods OLS -0.0130 0.0069 0.0006 0.0055 -0.0103
(.0004) (.0004) (.0002) (.0003) (.0006)2SLS -0.0080 0.0084 0.0013 -0.0018 -0.0126
(.0026) (.0025) (.0014) (.0020) (.0037)iv_exp -0.60401st Stage F-stat 36.48
Change in import of goods OLS -0.0086 0.0006 0.0005 0.0074 -0.0009(.0004) (.0004) (.0002) (.0003) (.0006)
2SLS 0.0032 -0.0098 0.0038 0.0028 0.0147(.0045) (.0043) (.0024) (.0033) (.0065)
iv_imp -0.77931st Stage F-stat 14.82
Panel C: Include Import and Export Variables in the Same RegressionChange in export of goods OLS -0.0113 0.0076 0.0004 0.0033 -0.0113
(.0005) (.0004) (.0002) (.0003) (.0006)Change in import of goods -0.0048 -0.0019 0.0004 0.0068 0.0029
(.0004) (.0004) (.0002) (.0003) (.0006)Change in export of goods 2SLS -0.0092 0.0116 0.0002 -0.0027 -0.0175
(.0029) (.0028) (.0024) (.0025) (.0042)Change in import of goods 0.0040 -0.0108 0.0037 0.0031 0.0163
(.0044) (.0043) (.0016) (.0034) (.0064)First-Stage Regression StatisticsChange in export of goods iv_exp -0.6052
iv_imp 0.03141st Stage F-stat 32.84
Change in import of goods iv_exp -0.1521iv_imp -0.75421st Stage F-stat 14.54
Number of Firms 7,091 7,091 7,091 7,091 7,091
Dependent Variable: Change in the Occupation Group Share
Table 5a: Firm-level OLS and 2SLS Regressions for Change in Occupation Share Between 2000 and 2009: Firms with at Least 10 Employees in 2000 & 2009. Export and Import Variables.
* Notes: Each cell in Panels A and B refers to a separate regression. Panel C includes all regressors in the same regression. Sample of firms includes a total of 7,091 companies. Total number of employees in the firm in 2000 is used to weight the observations. 2SLS regressions use changes in the world export supply (WES) and world import demand (WID) as instruments for changes in exports and imports, respectively. The polarization index is calculated as PI=[0.5*(dG1+dG2)-

33
Explanatory variableGroup 1: Man,
Pro & TechGroup 2: Pri, Craf & Cler
Group 3: Service
Group 4: Elementary
Polarization Index
Panel A: Bivariate regressions
Change in export of services 0.0003 0.0030 0.0003 -0.0037 -0.0046(.0010) (.0008) (.0002) (.0006) (.0013)
Change in import of services -0.0019 0.0051 0.0002 -0.0034 -0.0076(.0010) (.0009) (.0002) (.0007) (.0013)
Panel B: Add Basic Firm Level Controls
Change in export of services 0.0013 0.0021 0.0002 -0.0036 -0.0031(.0009) (.0008) (.0002) (.0006) (.0012)
Change in import of services -0.0004 0.0038 0.0001 -0.0036 -0.0058(.0010) (.0009) (.0002) (.0006) (.0013)
Panel C: Include All Import and Export Variables in the Same Regression
Change in export of goods -0.0181 0.0134 0.0008 0.0039 -0.0202(.0014) (.0013) (.0003) (.0008) (.0019)
Change in export of services 0.0013 0.0016 0.0003 -0.0032 -0.0024(.0009) (.0008) (.0002) (.0005) (.0013)
Change in import of goods -0.0038 -0.0070 -0.0007 0.0115 -0.0105(.0014) (.0013) (.0003) (.0009) (.0021)
Change in import of services -0.0014 0.0031 0.0000 -0.0017 -0.0047(.0009) (.0009) (.0002) (.0006) (.0014)
Number of Firms 668 668 668 668 668
Panel C: Include All Firms in the Regression, Change is Zero if Not Surveyed
Change in export of goods -0.0110 0.0076 0.0005 0.0030 -0.0114(.0004) (.0004) (.0002) (.0003) (.0006)
Change in export of services 0.0014 0.0013 0.0003 -0.0030 -0.002(.0004) (.0004) (.0002) (.0003) (.0006)
Change in import of goods -0.0045 -0.0021 0.0004 0.0062 0.0032(.0004) (.0004) (.0002) (.0003) (.0006)
Change in import of services -0.0021 0.0038 0.0001 -0.0017 -0.0056(.0004) (.0004) (.0002) (.0003) (.0006)
Number of Firms 7,091 7,091 7,091 7,091 7,091
Firms with at Least 10 Employees in 2000 & 2009
* Notes: Each cell in Panels A and B refers to a separate regression. Panel C includes all regressors into the same regression. The overall sample of firms with data on the export and import of services (at least 10 employees) includes a total of 668 companies. The total number of employees in the firm in 2000 is used to weight the observations. See also notes for Table 4a.
Table 5b: Firm-level OLS Regressions for Change in Occupation Share Between 2000 and 2009. Service Export and Import Variables.

34
Explanatory variableGroup 1: Man,
Pro & TechGroup 2: Pri, Craf & Cler
Group 3: Service
Group 4: Elementary
Polarization Index
Panel A: Separate Bivariate Regressions
Outsourcing / Offshoring -0.0033 -0.0036 -0.0046 0.0115 0.0054(.0134) (0.0123) (.0045) (.0119) (.0184)
% Workers use Computer 2001 -0.0237 0.0070 -0.0030 0.0198 -0.0105(.0182) (.0153) (.0055) (.0091) (.0230)
Ln(Total R&D expenditure) 0.0013 -0.0045 0.0006 0.0025 0.0067(.0015) (.0012) (.0003) (.0008) (.0019)
Panel B: Add Basic Firm Level Controls
Outsourcing / Offshoring -0.0042 0.0091 -0.0043 -0.0006 -0.0137(.0135) (0.0121) (.0046) (.0114) (.0183)
% Workers use Computer 2001 0.0146 -0.0320 0.0023 0.0151 0.0480(.0211) (.0180) (.0066) (.0109) (.0271)
Ln(Total R&D expenditure) 0.0013 -0.0047 0.0011 0.0022 0.0070(.0017) (.0014) (.0003) (.0009) (.0021)
Panel C: Outsourcing in Finland, Abroad versus Planned (Include Basic Controls)
Outsourcing in Finland -0.0358 0.0349 -0.0067 0.0077 -0.0523(.0130) (0.0116) (.0045) (.0110) (.0174)
Outsourcing Abroad 0.0204 -0.0376 0.0075 0.0097 0.0565(.0153) (.0136) (.0052) (.0129) (.0204)
Plan to Oursource 2007- 0.0276 0.0129 -0.0094 -0.0311 -0.0194(.0199) (.0178) (.0069) (.0168) (.0266)
Panel D: Internal versus External R&D (Include Basic Controls)
LN(Internal R&D Spending) 0.0038 -0.0079 0.0013 0.0027 0.0118(.0017) (.0015) (.0003) (.0010) (.0022)
LN(External R&D Spending) -0.0088 0.0115 -0.0005 -0.0022 -0.0172(.0021) (.0018) (.0004) (.0012) (.0027)
Firms with at Least 10 Employees in 2000 & 2009
* Notes: Each cell in Panels A and B refers to a separate regression. Panels C and D include all listed regressors into the same regression. The size of the sample varies from survey to survey. All regressions are for the sample of firms with at least 10 employees. For the Sourcing survey: N=552. For the ICT survey: N= 978. For the R&D Survey: N=1,060. See also notes for Table 4a.
Table 6a: Firm-level OLS Regressions for Change in Occupation Share Between 2000 and 2009. Variables from ICT, R&D and Sourcing Survey.

35
Explanatory variable
Group 1: Man, Pro &
Tech
Group 2: Pri, Craf &
ClerGroup 3: Service
Group 4: Elementary
Polarization Index
Panel A: Separate Bivariate Regressions
Outsourcing / Offshoring 2SLS -0.1080 0.1200 -0.0015 -0.0107 -0.18(.0696) (.0662) (.0223) (.0591) (.0992)
iv_exp -0.1203iv_imp 0.07271st Stage F-stat 11.67
Panel B: Add Basic Firm Level Controls
Outsourcing / Offshoring 2SLS -0.0512 0.2742 0.0032 -0.2262 -0.4114(.0985) (.1199) (0.0333) (.1078) (.1799)
iv_exp -0.0830iv_imp 0.08651st Stage F-stat 5.23
Panel C: Outsourcing in Finland, Abroad versus Planned (Include Basic Controls)
Outsourcing in Finland 2SLS -0.0456 0.2077 0.0028 -0.1649 -0.3116(.0736) (.0786) (.0252) (.0751) (.1179)
iv_exp -0.1105iv_imp 0.09881st Stage F-stat 8.82
Outsourcing Abroad 2SLS -0.0481 -0.1625 0.0019 0.2087 0.2438(.0709) (.0673) (.0238) (.0705) (.1009)
iv_exp 0.0793iv_imp -0.29441st Stage F-stat 8.60
Plan to Oursource 2007- 2SLS 0.0149 0.1754 -0.0003 -0.1900 -0.2631(.0666) (.0635) (.0227) (.0607) (.0953)
iv_exp -0.1025iv_imp 0.24811st Stage F-stat 16.38
Table 6b: Firm-level 2SLS Regressions for Change in Occupation Share Between 2000 and 2009. Variables from Sourcing Survey.
Firms with at Least 10 Employees in 2000 & 2009
* Notes: The size of the sample (firms with 10 employees) in the Sourcing Survey that also have import and export IV data: N=552.
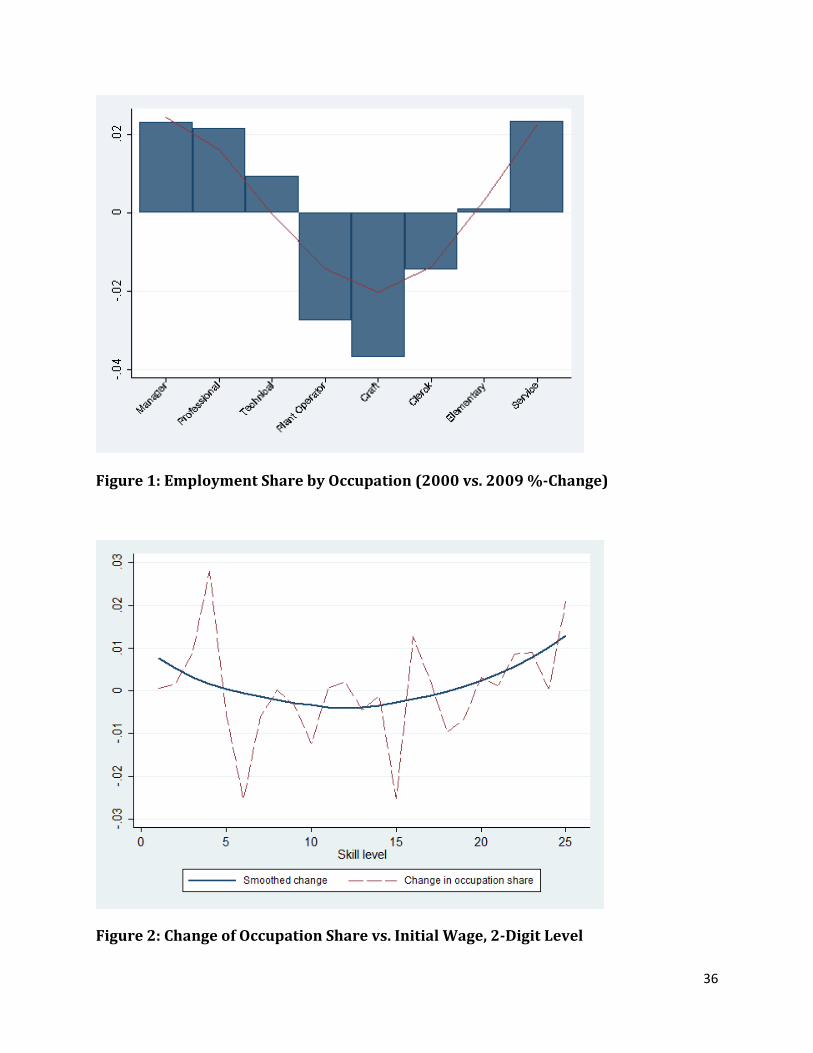
36
Figure 1: Employment Share by Occupation (2000 vs. 2009 %-Change)
Figure 2: Change of Occupation Share vs. Initial Wage, 2-Digit Level
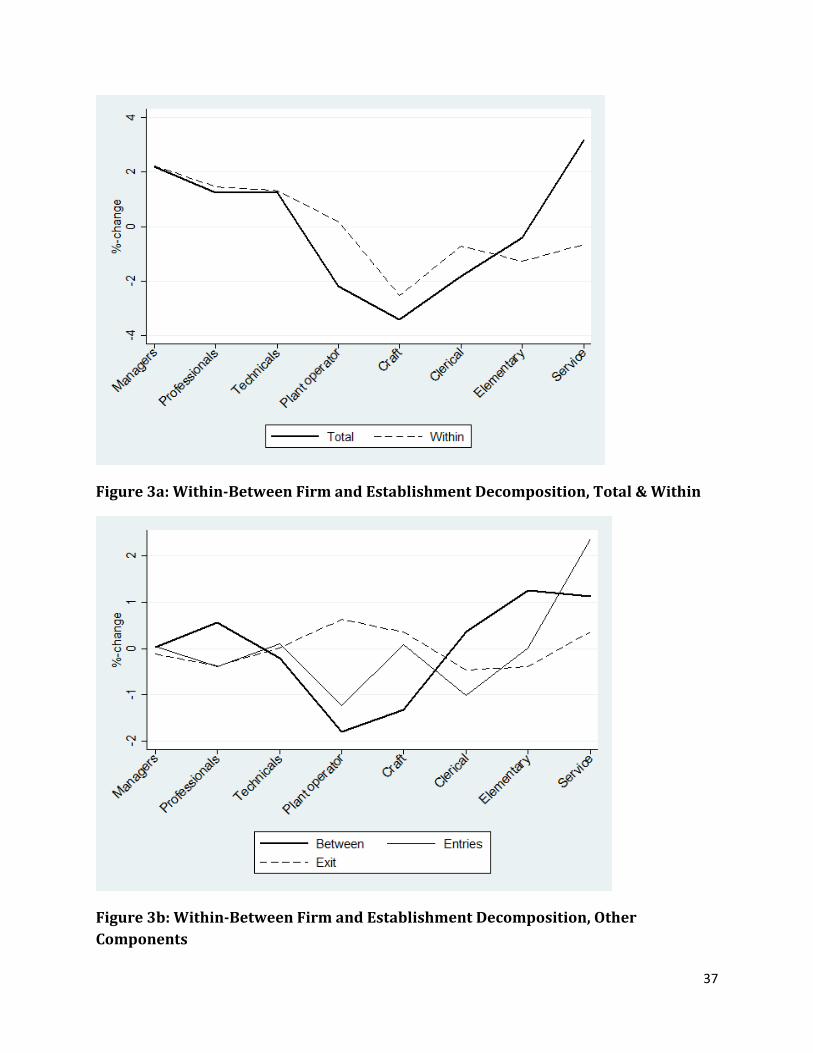
37
Figure 3a: Within-Between Firm and Establishment Decomposition, Total & Within
Figure 3b: Within-Between Firm and Establishment Decomposition, Other Components
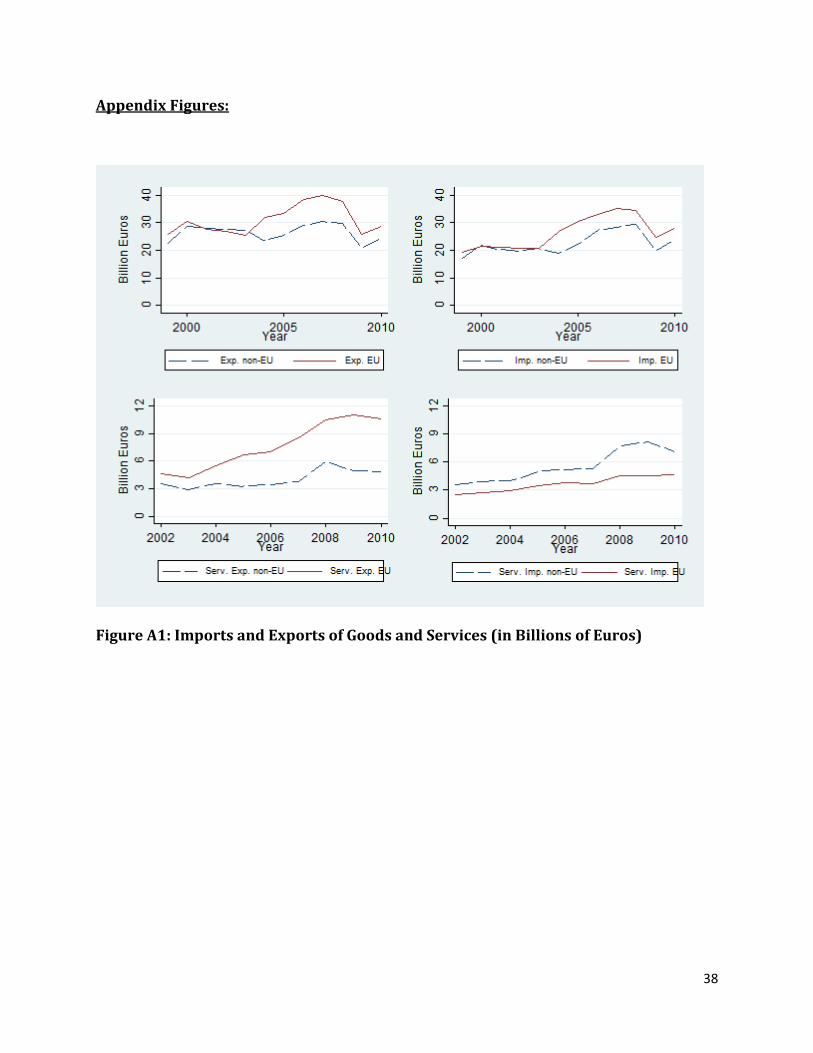
38
Appendix Figures:
Figure A1: Imports and Exports of Goods and Services (in Billions of Euros)
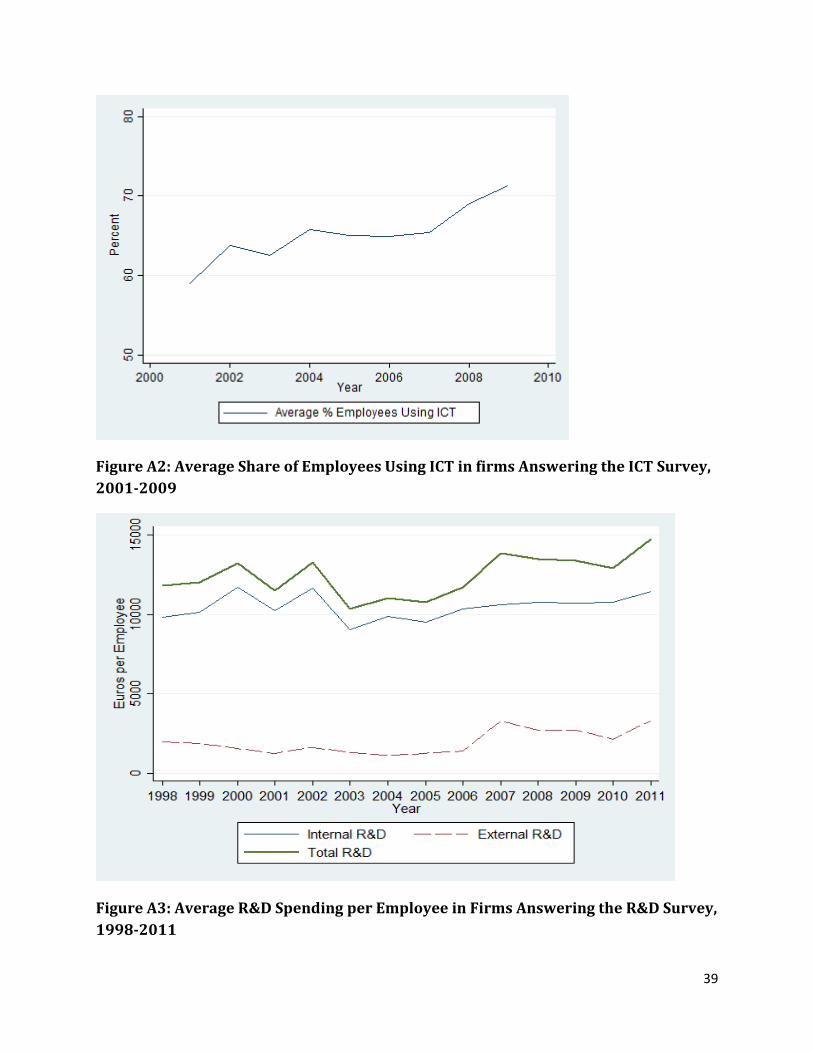
39
Figure A2: Average Share of Employees Using ICT in firms Answering the ICT Survey, 2001-2009
Figure A3: Average R&D Spending per Employee in Firms Answering the R&D Survey, 1998-2011

40
Figure A4: International Sourcing by Location and Firm Size: Actual and Intended
Figure A5: Change of Occupation Share vs. Initial Wage, 1995 to 2000, 2-Digit Level
0%
10%
20%
30%
40%
50%
Firms less that 100 employees Firms more than 100 employees
Sourcing abroad Sourcing domestically Plan to outsource
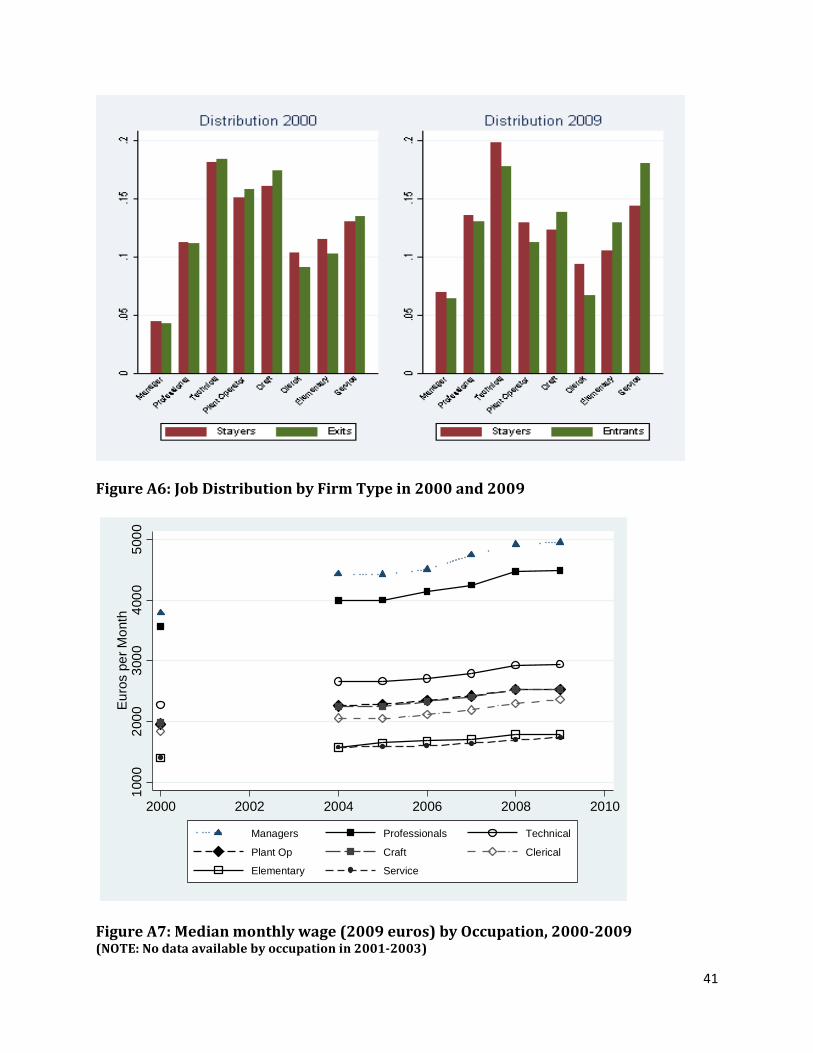
41
Figure A6: Job Distribution by Firm Type in 2000 and 2009
Figure A7: Median monthly wage (2009 euros) by Occupation, 2000-2009 (NOTE: No data available by occupation in 2001-2003)
1000
2000
3000
4000
5000
Eur
os p
er M
onth
2000 2002 2004 2006 2008 2010
Managers Professionals Technical
Plant Op Craft Clerical
Elementary Service
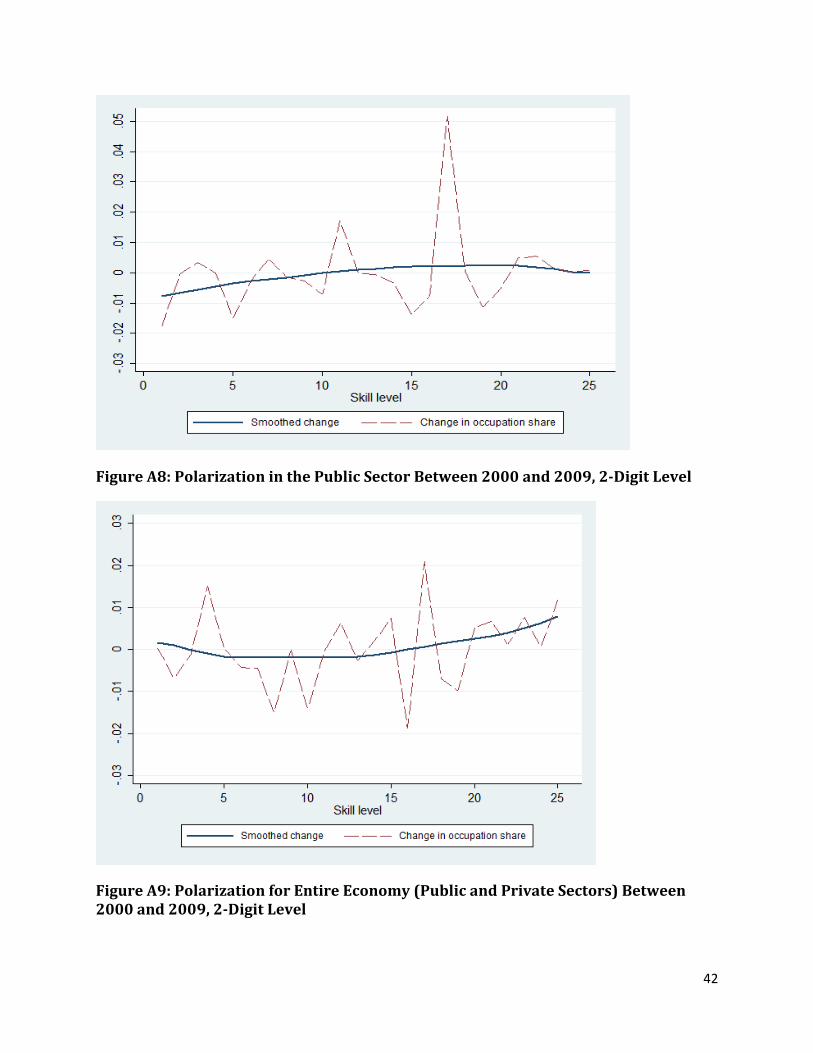
42
Figure A8: Polarization in the Public Sector Between 2000 and 2009, 2-Digit Level
Figure A9: Polarization for Entire Economy (Public and Private Sectors) Between 2000 and 2009, 2-Digit Level
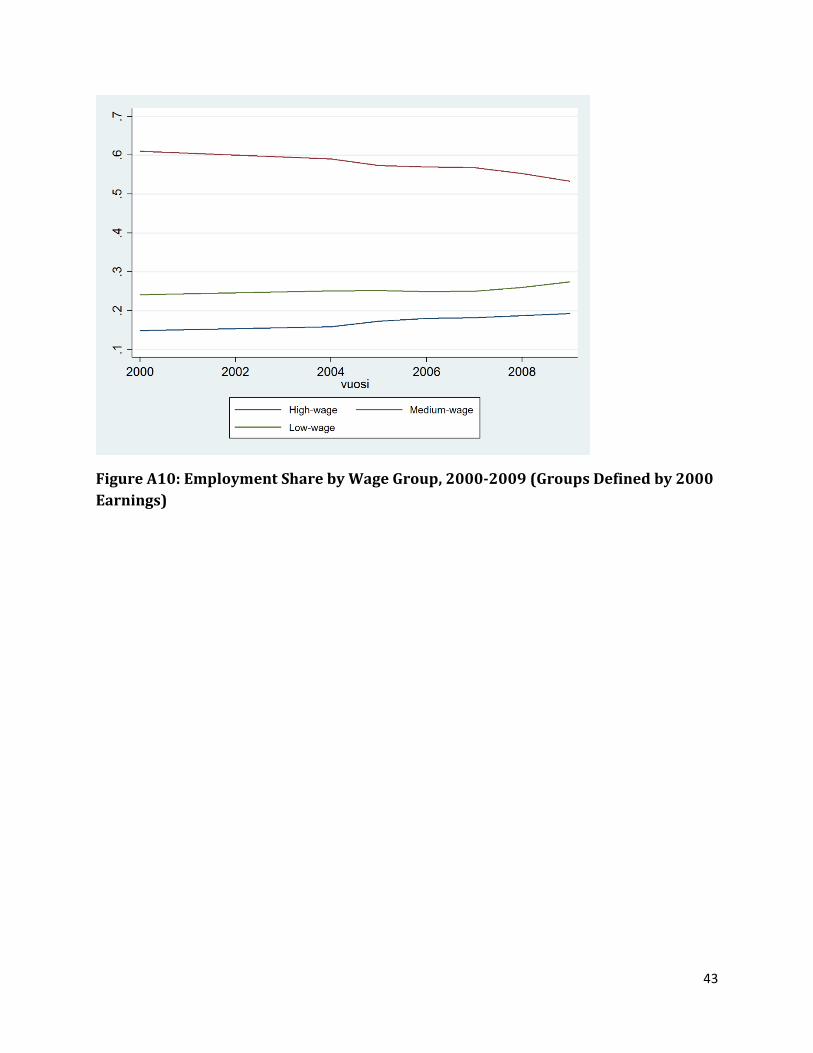
43
Figure A10: Employment Share by Wage Group, 2000-2009 (Groups Defined by 2000 Earnings)