
WITH - Lehigh University
148
• _.., •• Determination of Tolerable Flaw Sizes in Full Size Welded Bridge Details FRACTURE ANALYSES OF FULL SIZE BEAMS WITH WELDED LATERAL ATTACHMENTS by Keith D. Boyer John W. Fisher George R. Irwin Richard Roberts Gopala V. Krishna Ulrich Morf Robert E. Slockbower This work has been carried out as part of an investigation sponsored by the Federal Highway Administration. The contents of this report reflect the views of the authors who are responsible for the facts and the accuracy of the data presented herein. The contents do not necessarily reflect the official views or policies of the Federal Highway Administration. This report does not constitute a standard, specification, or regulation. Fritz Engineering Laboratory Lehigh University Bethlehem, Pennsylvania April 1976 Fritz Engineering Laboratory Report No.
Transcript of WITH - Lehigh University

• _..,
••
Determination of Tolerable Flaw Sizes
in Full Size Welded Bridge Details
FRACTURE ANALYSES OF FULL SIZE BEAMS
WITH WELDED LATERAL ATTACHMENTS
by Keith D. Boyer John W. Fisher George R. Irwin Richard Roberts
Gopala V. Krishna Ulrich Morf
Robert E. Slockbower
This work has been carried out as part of an investigation sponsored by the Federal Highway Administration. The contents of this report reflect the views of the authors who are responsible for the facts and the accuracy of the data presented herein. The contents do not necessarily reflect the official views or policies of the Federal Highway Administration. This report does not constitute a standard, specification, or regulation.
Fritz Engineering Laboratory
Lehigh University
Bethlehem, Pennsylvania
April 1976
Fritz Engineering Laboratory Report No. 399~2(76)
. ..
'·
•
ACKNOWLEDGMENTS
This investigation is part of Fritz Laborptbry research pro-
ject No. 399, a study of the tolerable flaw sizes :in full size welded
bridge details, sponsored by the Federal Highway Administration. The
testing was accomplished at Fritz Engineering Laboratory, Lehigh
University. Dr. Lynn S. Beedle i·s the Director of Fritz Laboratory,
and Dr. David A. Vafu~orn is the Chairman of the Civil Engineering
Department.
Appreciation is expressed to the staff of Fritz Engineering
Laboratory; namely R. R. Dales and K. R. Harpel and the technical staff
who helped plan, set up and run the beam tests; to H. T. Sutherland and
R. Langenbach, who helped with instrumentation, to R. Grimes, who typed
the manuscript; to J. M. Gera, D. Wiltraut, and R. Troxell, draftsmen;
and to R. N. Sopko, photographer •
ii
-TABLE OF CONTENTS
1. INTRODUCTION
2. DESCRIPTION OF TESTS
2.1 Test Specimens
2.2 Test Setup
2.3 Instrumentation
2.4 Cooling Apparatus and Enclosure
2.5 Design Stresses
2.6 Load and Deflection Control
2.7 General Testing Procedure
2.8 Fatigue Testing
2.9 Fracture Testing
3. MATERIAL CP.ARACTERIZATION
3.1 Test Plan
3.2 Charpy V-Notch Impact Tests
3.3 Fracture Toughness Measurements
3.3.1 Drop Weight Test Apparatus
3.3.2 Slow Bend Test Apparatus
3.3.3 K Specimen Preparation c
3.3.4 Fracture Toughness Data Evaluation
3.4 Drop Tear Energy Measurements
3.5 Results of Fracture Tests
3.5.1 Charpy V-Notch Tests
iii
1
3
3
4
4
5
6
7
8
9
11
13
13
. 13
13
14
15
15
16
17
18
18

-- 3.5.2 K Test Results c
3.5.3 Drop Tear Energy Test Results
4. BEAM TEST RESULTS AND ANALYSIS
19
21
22
4.1 Fatigue Cracks 22
4.2 Remaining Fatigue Life 23
4.3 Beam Fracture Tests 24
4.4 Fracture Test Variables Affecting Fracture Toughness 29
4.5 Stress Intensity Estimates 30
4.5.1 Introduction 30
4.5.2 Contribution from the Applied Stress 31
4.5.3 Contribution from the Stress Concentration 33
4.5.4 Contribution from the Nominal Residual Stresses 36
4.5.5 Contribution from the Local Weld Residual 37 Stresses
4.5.6 Contribution from the Web Restraint
4.5.7 Summary and Discussion of the Various Contributions
5. COMPARISON OF BEAM K ESTIHATES AND MATERIAL K TESTS c
5.1 Lateral Attachment Details
6. CONCLUSIONS
APPENDIX
NOMENCLATURE
TABLES
FIG1JKES
REFERENCES
iv
38
39
43
43
45
47
51
53
80
139

LIST OF TABLES
Table Page
l List of Test Specimens 54
2 a,b,c Results of Mill Tests 55
3 a,b Cross-Sectional Properties of Test Specimens 58
4 a,b Cross-Section Temperatures at Fracture 60
5 a,b Load History for Beam B2 (A514) 62
6 a,b Load History for Beam B2A (A514) 64
7 a,b Load History of Beam B4 (A36) 66
8 a,b Load History for Beam B4A (A36) 68
9 a,b Load History of Beam B6 (A588) .. 70
10 a,b Load History of Beam B6A (A588) 72 ...,
11 a,b Transition Temperature Data for Flange Plates 74
12 Remaining Fatigue Life 75
13 a,b Crack Size Measurements 76
14 a,b Stress Intensity Estimates 78
..
v
Figure
1
2
3
4
5
6 a
6 b
6 c
7
8
9
10
11 a,b
12 a,b
13 a,b
14 a
14 b
14 c
15 a
15 b
15 c
LIST OF FIGURES
Beam B4
Schematic o{ Fracture Test Setup.
Photograph of Test Setup
Positions of Temperature and Strain Gages
Photographs of Cooling Network
Maximum Stress on Interior and Exterior Flange Surfaces of Beams B2 and B2A (A514)
Maximum Stress on Interior and Exterior Flange Surfaces of Beams B4 and B4A (A36)
Maximum Stress on Interior and Exterior Flange Surfaces of Beams B6 and B6A (A588)
81
82
83
84
85
86
87
88
Strain Rate Trace at Fracture 89
Photograph of Lehigh Drop Weight Test Machine 90
Three-Point Bend Specimen 91
Typical Load Time Relationship 92
Plotted CVN Data (A36/2 in. Pl) 93
Plotted CVN Data (A588/2 in. Pl) 94
Plotted CVN Data (A514/l-1/2 in. Pl) 95
Fracture Toughness vs. Temperature (A36/2 in. P1) 96
Fracture Toughness vs. Temperature (A588/2 in. Pl) 97
Fracture Toughness vs. Temperature (A514/l-1/2 in. P1) 98
Drop Tear Energy vs. Temperature (A36/2 in. P1) 99
Drop Tear Energy vs. Temperature (A588/2 in. P1) 100
Drop Tear Energy vs~ Temperature (A514/1-l/2 in. Pl) 101
vi
Figure
16
17
18
19
20
21
22 a,b
23 a,b
24
25
26
• 27
28
29 a,b
29 c
30
31
32
33
34
35
Fatigue and Fracture Surface, B2 (A514)
Fatigue and Fracture Surface, B2A {A514)
Fatigue and Fracture Surface, B4 (A36)
Fatigue and Fracture Surface, B4A (A36)
Fatigue and Fracture Surface, B6 (A588)
Fatigue and Fracture Surface, B6A (A588)
Fatigue Cracks at Two Million Cycles
Fatigue Cracks Prior to Last Fracture Test
Category E S-N Plot (Lateral Attachment Details)
Critical Detail Temperature/60 Minutes Prior to Fracture (A514)
Critical Detail Temperature/60 Minutes Prior to Fracture (A36)
Critical Detail Temperature/60 Minutes Prior to Fracture (A588)
Stress Intensity Model for Flange Edge Crack for Applied Stress
Groove Weld Detail Reentrant Corners
Stress Concentration Decay with Crack Size
Stress Intensity vs. Crack Size for Elliptical Corner Cracks (B2A, A514)
Superposition Model for Residual Stresses
K vs. Edge Crack Size (B2, A514)
K vs. Edge Crack Size (B2A, A514)
K vs. Edge Crack Size (B4, A36)
K vs. Edge Crack Size (B4A, A36)
vii
102
103
104
105
106
107
108
110
112
113
114
115
116
117
118
119
120
121
122
123
124
Figure
36
37
38
39
40
41
42 a
42 b
43
44
45
46
47
48
1-
K vs. Edge Crack Size (B6, A588)
K vs. Edge Crack Size (B6A, A588)
Fracture Surface Sketches and Data Summary
Estimated Residual Stress Distribution for A36 Flange
Estimated Residual Stress Distribution for A588 Flange
Estimated Residual Stress Distribution for A514 Flange
Assumed Residual Stress Distribution Along Flange Tip for Groove Weld Lateral Attachment
Assumed Local Residual Stress Distribution for Fillet Weld Lateral Attachment
Correlation of Beam K and Material est . Toughness Characterization Elf, B4A (A36)
Correlation of Beam K t and Material es Toughness Characterization B6, B6A (A588)
Correlation of Beam K t and Material es Toughness Characterization B2, B2A (A514)
Flange and Web Crack Interaction
Assumed Interaction Area for Web Restraint Analysis
Models Used for Web Restraint Analysis
viii
125
126
127
128
129
130
131
132
133
134
135
136
137
138
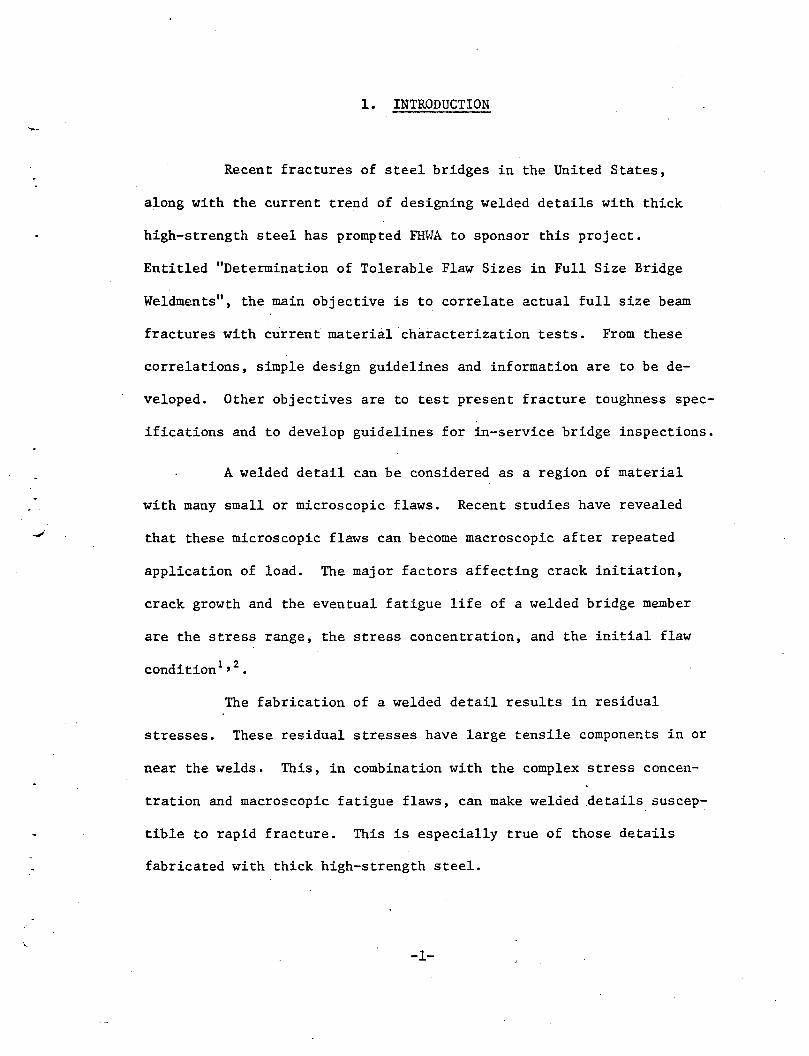
1. INTRODUCTION
Recent fractures of steel bridges in the United States,
along with the current trend of designing welded details with thick
high-strength steel has prompted FHWA to sponsor this project.
Entitled "Determination of Tolerable Flaw Sizes in Full Size Bridge
Weldments", the main objective is to correlate actual full size beam
fractures with current material characterization tests. From these
correlations, simple design guidelines and information are to be de
veloped. Other objectives are to test present fracture toughness spec
ifications and to develop guidelines for in-service bridge inspections.
A welded detail can be considered as a region of material
with many small or microscopic flaws. Recent studies have revealed
that these microscopic flaws can become macroscopic after repeated
application of load. The major factors affecting crack initiation,
crack growth and the eventual fatigue life of a welded bridge member
are the stress range, the stress concentration, and the initial flaw
condition1 ,2
•
The fabrication of a welded detail results in residual
stresses. These residual stresses have large tensile components in or
near the welds. This, in combination with the complex stress concen
tration and macroscopic fatigue flaws, can make welded .details suscep
tible to rapid fracture. This is especially true of those details
fabricated with thick high-strength steel.
-1-

_)
This project consists of three parts. The first i.s the
fatigue and fracture testing of 24 full size welded beam specimens
with details which are commonly used in bridge design. The details
were chosen from the AASHTO categories for fatigue design 18 • Two
Category E details were chosen: the coverplate and the lateral attach
ment. The intermediate Category C detail was the transverse stiffener.
The flange thickness transition provided the upper bound fatigue
strength detail (Category B). Six beams were fabricated for each of
the four detail categories. Each detail type was fabricated in three
types of steel. A list of the details is shown in Table 1.
The second part of the study was a detailed material charac
terization. Materials from which these beams were fabricated were
evaluated using several fracture toughness tests.
The third-part is an analytical treatment of crack shapes
which may be encountered during the beam tests. This has been co~
pleted in a report by Irwin and Tada 3• The results of this study were
used to estimate the critical stress intensity factor for the frac
tured beams.
This report contains the results and discussion of the six
beam tests with lateral attachment details and a summary of part of
the material characteristics. Also included is a description of the
tests and testing procedures.
-2-
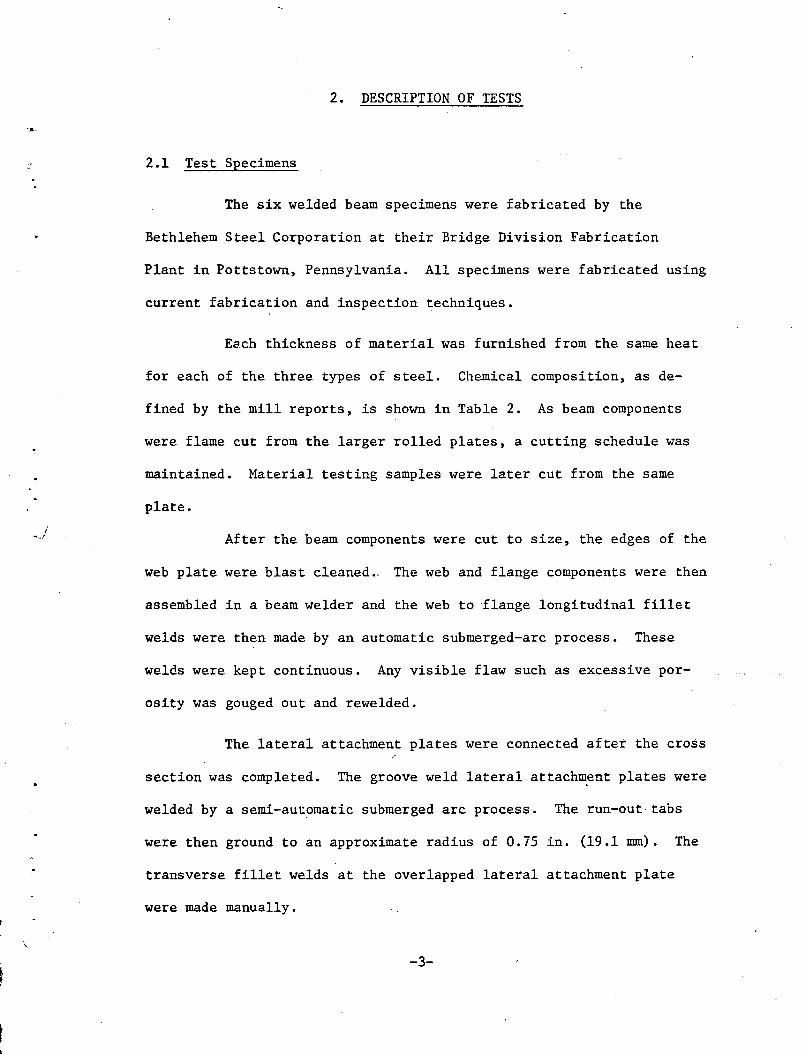
2. DESCRIPTION OF TESTS
.•. 2.1 Test Specimens
The six welded beam specimens were fabricated by the
Bethlehem Steel Corporation at their Bridge Division Fabrication
Plant in Pottstown, Pennsylvania. All specimens were fabricated using
current fabrication and inspection techniques.
Ea.ch thickness of material was furnished from the same heat
for each of the three types of steel. Chemical composition, as de-
fined by the mill reports, is shown in Table 2. As beam components
were flame cut from the larger rolled plates, a cutting schedule was
maintained. Material testing samples were later cut from the same
plate.
I -.r After the beam components were cut to size, the edges of the
web plate were blast cleaned.. The web and flange components were then
assembled in a beam welder and the web to flange longitudinal fillet
welds were then made by an automatic submerged-arc process. These
welds were kept continuous. Any visible flaw such as excessive por-
osity was gouged out and rewelded.
The lateral attachment plates were connected after the cross /
section was completed. The groove weld lateral attachm~nt plates were
welded by a semi-automatic submerged arc process. The run-out·tabs
were then ground to an approximate radius of 0.75 in. (19.1 mm). The
transverse fillet welds at the overlapped lateral attachment plate
were made manually.
-3-

... For each type of steel, ASTM A36, A588 Gr50, and A514, two
beams were fabricated. A detailed drawing of beam specimen B4 is
shown in Fig. 1. The measured beam dimensions are summarized in
Table 3. Note that beams B2 and B2A have smaller flange dimensions
which were necessary to satisfy the jack capacity.
2.2 Test Setup
All beam testing was done· on the dynamic test bed in Fritz
Engineering Laboratory, Lehigh University. The test span length was
21 feet (6.40 m). Two 110 kip (489.5 kN) Amsler jacks drivenby a
sing~e pulsator were used for the 260 cpm (4.3 Hz) cyclic load. When
needed to raise the level of maximum stress, a constant load jack was
also used.
The latter jack was a 200 kip (890 kN) Parker-Hannifin jack
loaded with an Amsler accumulator and maintained by a column of nitro
gen. A schematic of the loading setup and geometry is shown in Fig. 2.
Photographs of the setup are shown in Figs. 3 and 5.
2.3 Instrumentation
SR-4 strain gages were used extensively to control the
strain during the fatigue and fracture tests. Also, el.ectrical resis
tance temperature gages were used to monitor the beam's temperature.
Four electrical resistance strain gages were mounted on the
tension flange and used as strain control when determining the beam
-4-
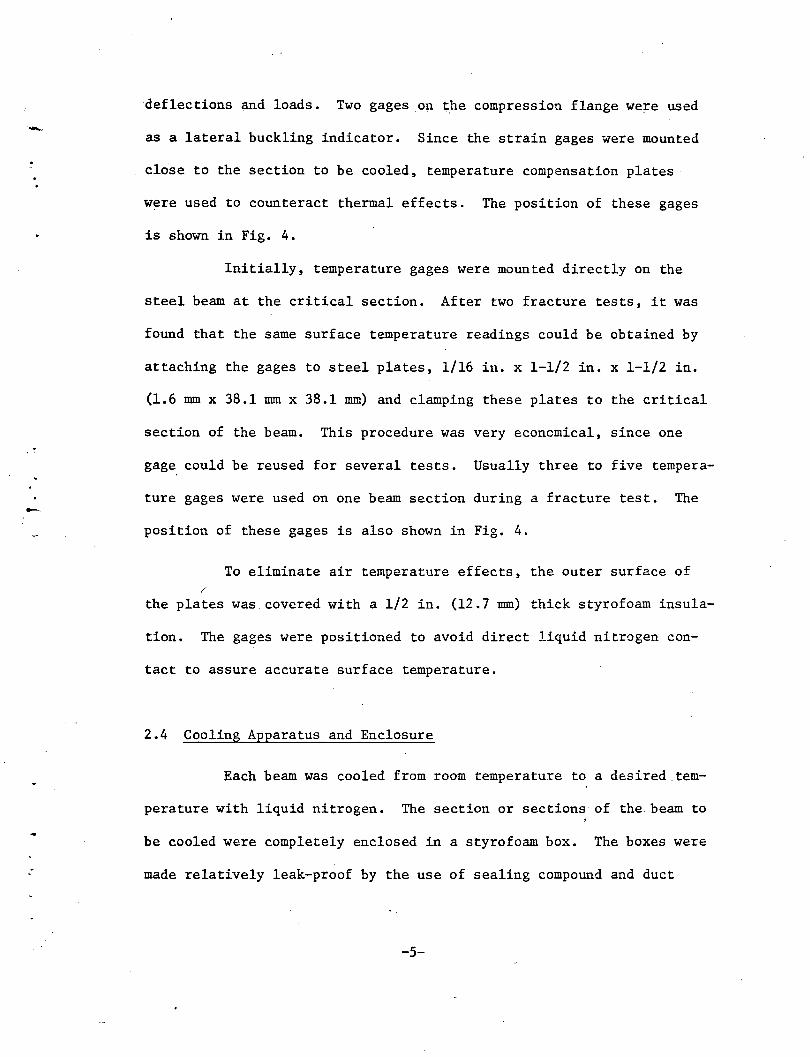
deflections and loads. Two gages on the compression flange were used
-· as a lateral buckling indicator. Since the strain gages were mounted
close to the section to be cooled, temperature compensation plates
were used to counteract thermal effects. The position of these gages
is shown in Fig. 4.
Initially, temperature gages were mounted directly on the
steel beam at the critical section. After two fracture tests, it was
found that the same surface temperature readings could be obtained by
attaching the gages to steel plates, 1/16 in. x 1-1/2 in. x 1-1/2 in.
(1.6 mm x 38.1 mm x 38.1 mm) and clamping these plates to the critical
section of the beam. This procedure was very economical, since one
gage could be reused for several tests. Usually three to five tempera-
ture gages were used on one beam section during a fracture test. The
position of these gages is also shown in Fig. 4.
To eliminate air temperature effects, the outer surface of
the plates was covered with a 1/2 in. (12.7 mm) thick styrofoam insula-
tion. The gages were positioned to avoid direct liquid nitrogen con-
tact to assure accurate surface temperature.
2.4 Cooling Apparatus and Enclosure
Each beam was cooled from room temperature to a desired.tem-
perature with liquid nitrogen. The section or sections of the. beam to
be cooled were completely enclosed in a styrofoam box. The boxes were
made relatively leak-proof by the use of sealing compound and duct
-5-
•
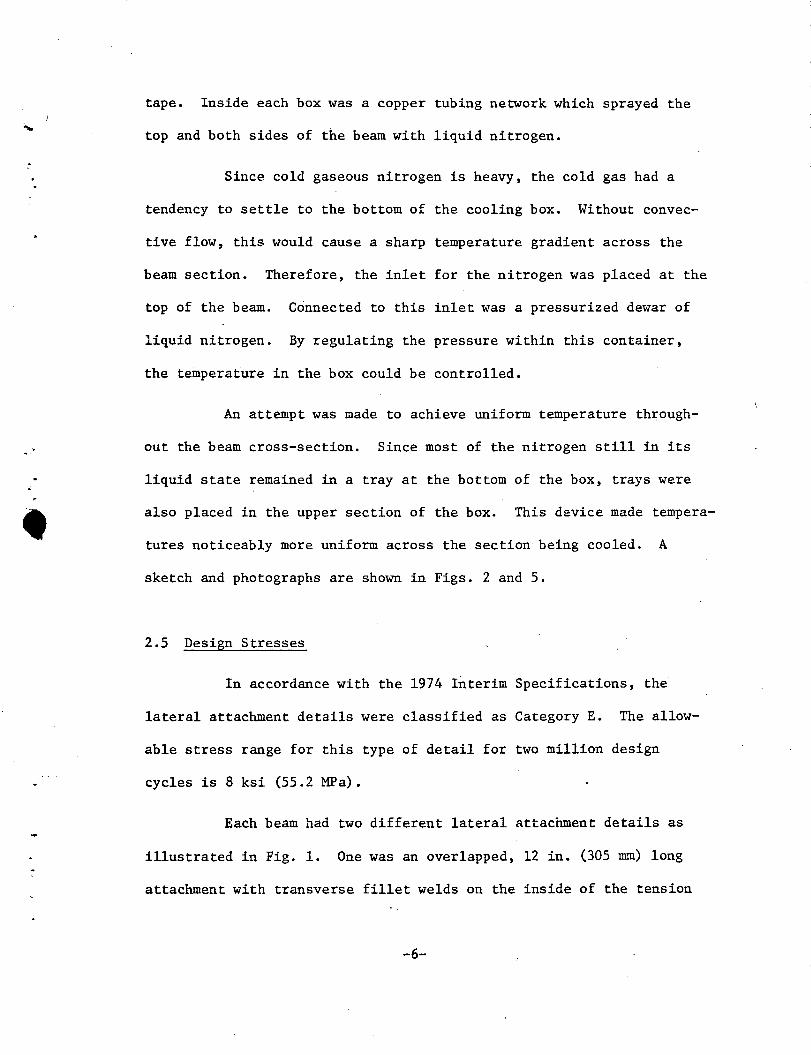
tape. Inside each box was a copper tubing network which sprayed the
top and both sides of the beam with liquid nitrogen.
Since cold gaseous nitrogen is heavy, the cold gas had a
tendency to settle to the bottom of the cooling box. Without convec
tive flow, this would cause a sharp temperature gradient across the
beam section. Therefore, the inlet for the nitrogen was placed at the
top of the beam. Connected to this inlet was a pressurized dewar of
liquid nitrogen. By regulating the pressure within this container,
the temperature in the box could be controlled.
An attempt was made to achieve uniform temperature through
out the beam cross-section. Since most of the nitrogen still in its
liquid state remained in a tray at the bottom of the box, trays were
also placed in the upper section of the box. This device made tempera
tures noticeably more uniform across the section being cooled. A
sketch and photographs are shown in Figs. 2 and 5.
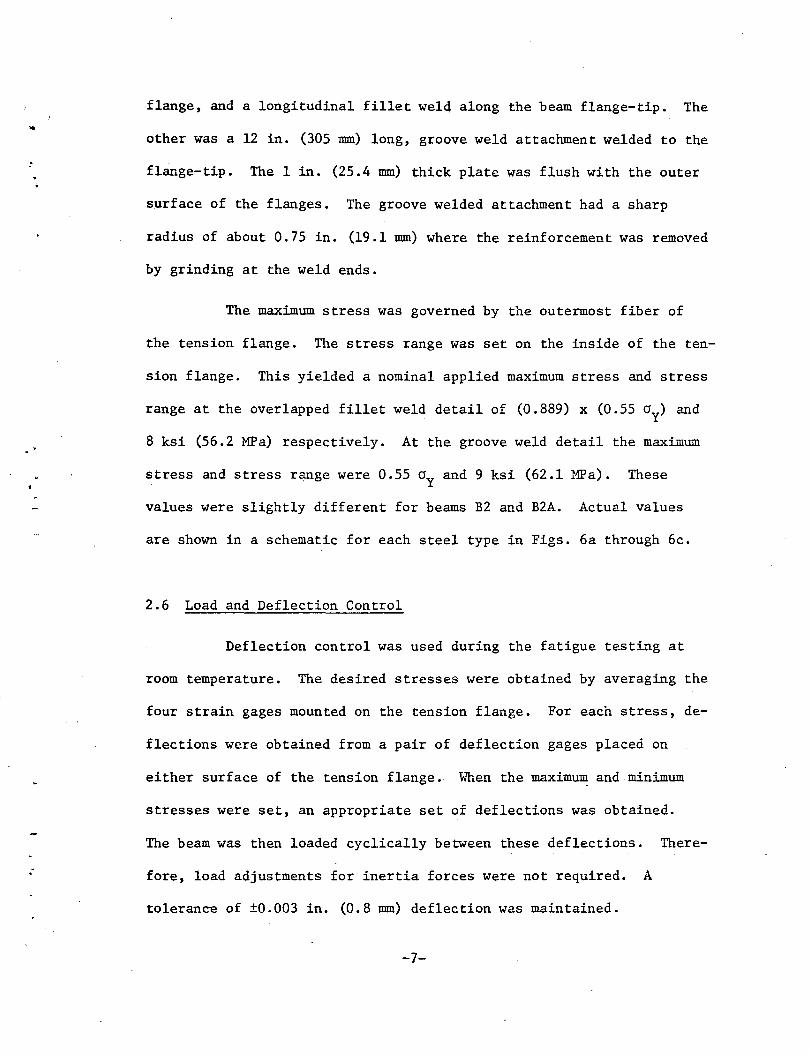
2.5 Design Stresses
In accordance with the 1974 Interim Specifications, the
lateral attachment details were classified as Category E. The allow
able stress range for this type of detail for two million design
cycles is 8 ksi (55.2 MPa).
Each beam had two different lateral attachment details as
illustrated in Fig. 1. One was an overlapped, 12 in. (305 mm) long
attachment with transverse fillet welds on the inside of the tension
-6-
:
flange, and a longitudinal fillet welq along the beam flange-tip. The
other was a 12 in. (305 mm) long, groove weld attachment welded to the
flange-tip. The 1 in. (25.4 mm) thick plate was flush with the outer
s~rface of the flanges. The groove welded attachment had a sharp
radius of about 0.75 in. (19.1 mm) where the reinforcement was removed
by grinding at the weld ends.
The maximum stress was governed by the outermost fiber of
the tension flange. The stress range was set on the inside of the ten
sion flange. This yielded a nominal applied maximum stress and stress
range at the overlapped fillet weld detail of (0.889) x (0.55 cry) and
8 ksi (56.2 MPa) respectively. At the groove weld detail the maximum
stress and stress range were 0.55 cry and 9 ksi (62.1 MPa). These
values were slightly different for beams B2 and BZA. Actual values
are shown in a schematic for each steel type in Figs. 6a through 6c.
2.6 Load and Deflection Control
Deflection control was used during the fatigue testing at
room temperature. The desired stresses were obtained by averaging the
four strain gages mounted on the tension flange. For each stress, de
flections were obtained from a pair of deflection gages placed on
either surface of the tension flange. When the maximum and minimum
stresses were set, an appropriate set of deflections was obtained.
The beam was then loaded cyclically between these deflections. There
fore, load adjustments for inertia forces were not required. A
tolerance of ±0.003 in. (0.8 mm) deflection was maintained.
-7-
..
:
The fracture test loading could not be deflection controlled
since any small temperature gradient across the beam section may have
caused misleading deflections. Therefore, the dynamic loads were
noted during the fatigue testing and these loads were then used to con
trol loading during the fracture tests. Dynamic stress measurements
confirmed the adequacy of the procedure.
2.7 General Testing Procedure
The first beam tested, B4A, served as a pilot study. Ini
tially 1.5 million cycles of load were applied at a stress range of
8 ksi (55.2 MPa) at the fillet weld detail and 9 ksi (62.1 MPa) at the
groove weld detail. At this point the beam section containing the
largest fatigue cracks was tested at -40° F (-40° C) for one-half hour.
No fracture occurred and the beam was fatigue cycled for an additional
250,000 cycles, at which time another -40° F (-40° C) test was run.
This fatigue and fracture test sequence was repeated until a fracture
occurred.
Failure did not occur when the fatigue cracks were small and
still in the stress concentration area. The fatigue cracks destroyed
about 70i. of the tension flange area before fracture occurred. This
extended fatigue and fracture sequence took considerable time to com
plete as altogether eight test sequences were carried out. For these
reasons the test procedure was modified on subsequent tests as follows.
Each subsequent beam was cyclically loaded for two million
cycles or until the fatigue cracks became a possible critical size,
-8-

..
:
whichever occurred first. At this point each section of the beam
containing the details was cooled to -40° F (-40° C). The beam was
then cycled for at least one-half hour between a maximum stress of
0 .• 55 cry and a minimum stress of 0.55 cry - crr. If no visible fatigue
cracks existed after two million cycles the fracture test was discon
tinued and further fatigue cycles applied at room temperature.
If there was a possible critical fatigue crack at the begin
ning of the first fracture test and no fracture occurred in the first
one-half hour, either an extended test at -40° F (-40° C) was run or
the temperature was dropped below -40° F (-40° C). This temperature
drop was done slowly to obtain accurate surface temperature readings.
This extended test was continued until fracture or until the liquid
nitrogen supply was depleted. If there was no fracture, the beam was
again fatigue cycled at room temperature to increase the crack size.
The next low temperature test was run on the detail with the
largest fatigue crack after the crack had grown a predetermined amount.
This fatigue and fracture test sequence was continued until a fracture
occurred.
2.8 Fatigue Testing
The stress range used in the fatigue test was· in accordance
with the 1974 AASHTO allowable range of stress for two million cycles
at the fillet welded attachment for a Category E detail. An allowable
stress range of 8 ksi (55.2 MPa) is permitted for a Category E detail.
-9-
..
,•
It was initially intended to fatigue cycle between the same
minimum and maximum stress limits as in the fracture tests. However,
this was discontinued after three tests for several reasons. First,
operating the constant load jack under cyclic deflection for such
extended periods caused excessive wear and heating which caused damage
to the hydraulic ram. In addition, it appeared that fatigue cracking
at room temperature at the limit of allowable stress could cause
effects know"'Il as "warm prestressing"~t,s. Such effects, if present,
could result in a greater apparent fracture resistant condition. The
earlier studies by Fisher, et al. 1 ' 2 have demonstrated that the level
of maximum stress has no appreciable affect on fatigue. Hence, in
subsequent tests, the cyclic stress range was applied at a lower level
of maximum stress.
During the fatigue test period, frequent checks were made
for visible fatigue cracks. Mainly, visual inspections were made with
a lOX magnifying glass and a cleaner fluid. At times a magnetic
particle probe was also used. Since the cycling was continued
twenty-four hours a day, some of the cracks were 1 in. (25.4 mm) cor
ner cracks before they were discovered.
An automatic shut-off switch was used to prevent extremely
large edge cracks from occurring before the scheduled fracture tests.
The switch was usually set for a 0.005 in. (.13 mm) deflection
increase.
-10-
..
,, '
.·
2.9 Fracture Testing
During the pilot study, the beam was tested at low tempera-
tures after an initial 1.5 million cycles of loading. In subsequent
tests, the initial fracture test was run after accumulating two
million cycles of cyclic load, as it was apparent that no brittle
fracture would occur at this stage of testing as the fatigue cracks
were small.
In preparation for the fracture test, the moveable tempera-
ture gage plates were clamped to the beam at various points around
both beam sections to be cooled as shown in Fig. 4. The gages used
for test control were placed at the crack planes on the exterior sur-
face of the tension flange. Actual temperature gage placement is
noted in Table 4.
The cooling apparatus was then put in place and the styro-
foam boxes were sealed. Most leakage was stopped during the initial
cooling period. The temperature was monitored constantly and recorded
every five minutes. When the temperature at the test control gages
reached -40° F (-40° C), the liquid nitrogen flow was regulated to
maintain the test temperature.
During the first fracture test, both beam sections contain-
ing the welded details were cooled simultaneously. By regulating the
liquid nitrogen flow, the temperature in each bmc was kept relatively
close, ±5° F (±2.8° C).
~ben the temperatures at the critical details became stable,
cyclic loads were applied. Prior to applying the maximum allowable
-11-
:
:
stress of 0.55 cry and the full design stress range level, the crack
tip was marked by applying cyclic stresses between the limits of
0.55 cry - crr and 0.55 cry - crr/2. This cyclically applied stress was
continued for approximately thirty minutes, after which the full
stress range was applied to the maximum nominal stress of 0.55 cry.
In most cases, the initial set of dynamic loads yielded a minimum
stress of 0.55 cry - crr and a maximum stress of 0.55 cry. A load his
tory for each beam is shown in Tables 5 through 10.
During each low temperature test, one of the tension flange
strain gages was monitored on a memory oscilloscope. This trace
showed both the sinusoidal loading rate and the fracture point. Since
the triggering at failure was manual, only one trace was obtained at
fracture and is shown in Fig. 7.
A sinusoidal loading rate of 260_ cpm (4.3 Hz) was provided
by the Amsler pulsator. This resulted in a loading rate of about
0.12 sec. from the minimum stress to maximum stress level. The sinu
soidal nature of the cyclic load yielded a maximum loading rate of
100 ksi/sec. (690 MPa/sec.). As can be seen in Fig. 7 the fracture
occurred at a point approximately 95% of the maximum load. This was
typical of subsequent tests as >vell. However, the nominal maximum
load will be used for the fracture analysis.
-12-
;
.-
3. MATERIALS CHARACTERIZATION
3.1 Test Plan
For the purposes of material characterization Standard
Charpy V-Notch (CVN) and Dynamic and Static Fracture Toughness (K ) c
tests were carried out on each plate thickness. ~till test data for
each plate was also available. Initially it was desirable to deter-
mine the fracture toughness of the flange plates {2 in. (51 mm) -
A36 steel; 2 in. (51 mm) - A588 steel; and 1-1/2 in. (38 mm) - A514
steel}. The chemical composition and mill test data are summarized in
Tables 2a, b and c. These plates were used to fabricate the test
beams described in this report. In this section, a brief description
of the experimental procedure and the test results are presented.
3.2 Charpy V-Notch Impact Tests
In order to determine the macroscopic brittle-ductile transi-
tion behavior of the plate materials, conventional ASTM standard
A370-68 Type A Charpy V-Notch specimens were prepared from each of the
three plates. The specimens were all transverse (LT) with notch direc-
tion perpendicular to the rolling direction. The impact test data was
analyzed using a least squares best fit sigmoidal computer program
developed at Lehigh University.
3.3 Fracture Toughness Measurements
The Charpy V-Notch data was used to select a test temperature
range so that valid fracture toughness data could be acquired fer the
-13-
.. :
plates. Temperatures of 0° F (18° C), -40° F (-40° C) and -80° F
(-62° C) were chosen for dynamic testing. A lower temperature range
based on the transition temperature shift 11 was selected for the slow
bend (intermediate loading rate) tests. Equation 1 was used to esti-
mate where additional tests were conducted at other temperatures
Tshift = 215 - 1.5 cry (1)
Tshift = transition temperature shift (° F)
cry = room temperature static yield stress (ksi)
3.3.1 Drop Weight Test Apparatus
The dynamic K testing was carried out using the Lehigh drop c
weight test machine (see Fig. 8). The details of this apparatus are
described in Ref. 6: The impact loading of the three-point bend speci-
men (Fig. 9) was achieved by means of a falling mass (400 lbs.) guided
vertically along two parallel rails. An instrumented loading tup 6 at·
the bottom of the mass was calibrated to act as a load-dynamometer.
As the specimen was loaded the strain output from the tup was recorded.
A typical load-time relationship is shown in Fig. 10. The drop weight
mass in a given set of tests was chosen to minimize the test specimen
inertia. In order to minimize the influence of the specimen inertia,
3/4 in. x 1/2 in. (19.1 mm x 12.7 mm) half-rounds were positioned on
the test specimen. This cushioned the application of the load and
increased the loading ti.me to about one millisecond. The half round
cushions were machined from unhardened drill rods. The test specimen
-14-
:
temperatures were controlled by a variety of means. All were held at
the required test temperature for at least ten minutes prior to test-
ing. A test was completed within ten seconds of the specimen's
removal from the temperature bath.
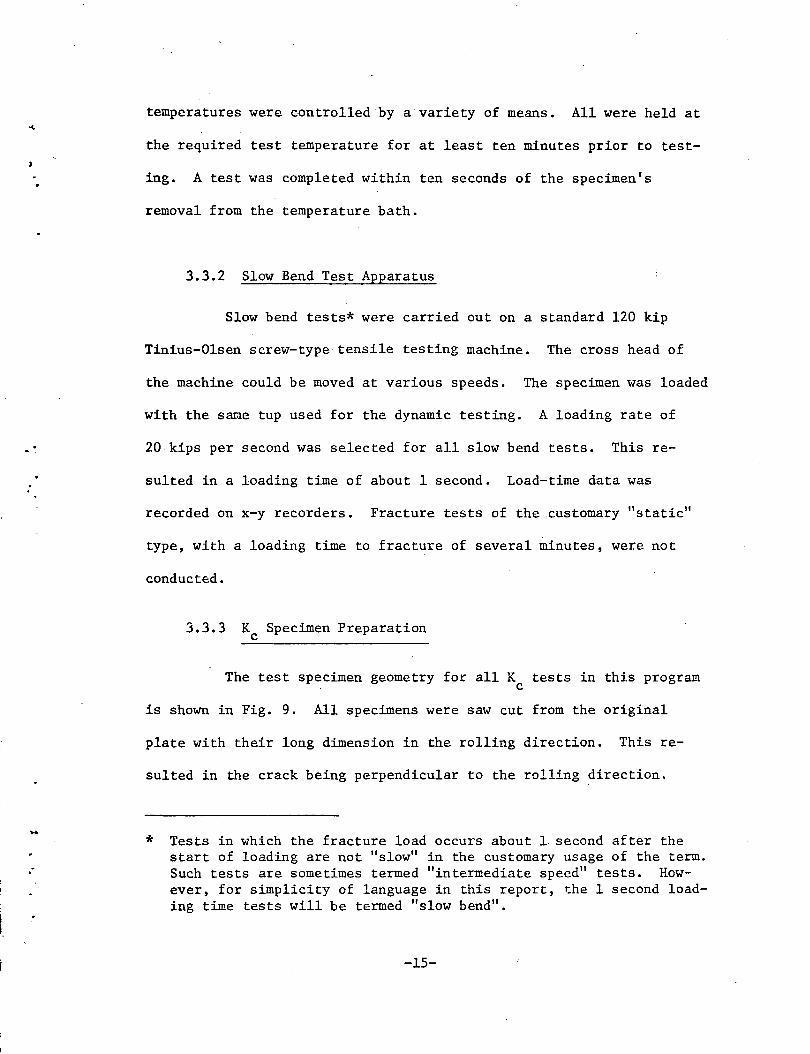
3.3.2 Slow Bend Test Apparatus
Slow bend tests* were carried out on a standard 120 kip
Tinius-Olsen screw-type·tensile testing machine. The cross head of
the machine could be moved at various speeds. The specimen was loaded
with the s~e tup used for the dynamic testing. A loading rate of
20kips per second was selected for all slow bend tests. This re-
sulted in a loading time of about 1 second. Load-time data was
recorded on x-y recorders. Fracture tests of the customary 11 static"
type, with a loading time to fracture of several minutes, were not
conducted.
3.3.3 K Specimen Preparation c
The test specimen geometry for all K tests in this program c
is shown in Fig. 9. All specimens were saw cut from the original
plate with their long dimension in the rolling direction. This re-
sulted in the crack being perpendicular to the rolling direction.
* Tests in which the fracture load occurs about 1 second after the start of loading are not "slow" in the customary usage of the term.
·· Such tests are sometimes termed "inte:rmediate speed" tests. However, for simplicity of language in this report, the 1 second loading time tests will be termed "slow bend".
-15-

:
.·
After the individual specimens were saw cut from the plates the cut
surfaces were shaped so as to be normal to the plate surfaces. The
thickness of the A36 and A588 steel specimens was reduced to 1-1/2 in.
(38 mm). A notch with a 45° chevron front was machined at the center
of the specimens to help initiate crack growth during the precracking
process. The cyclic-loading for precracking was done on a 10 ton
Amsler Vibrafore using three-point bending. The fatigue crack was
formed in two stages. During the first stage, the crack was grown as
quickly as possible. The final 1/8 in. (3 mm) of the crack was grown
slowly so that the average crack growth rate was equal or less than
1 microinch per cycle (25.4 nm per cycle). The maximum K during
fatigue precracking was about 40 ksi /in. (44 MPa /; ).
3.3.4 Fracture Toughness Data Evaluation
The fracture toughness, K , values were determined from the c
maximum load at the fracture of the three-point bend specimens 7 • K
was determined from the relationship
2 3 It
K B W2 y = .....::..;___:::._..:.,__ =
1.5 PL Ta' 1.93-3.12 (~') + 14.68 (~')- 25.3 (~') + 25.9 (~')
(2)
where y = dimensionless ratio
B = specimen width
w = specimen depth (3.0 in.)
p = applied load
L = span length (H). 0 in.)
-16-
;
.·
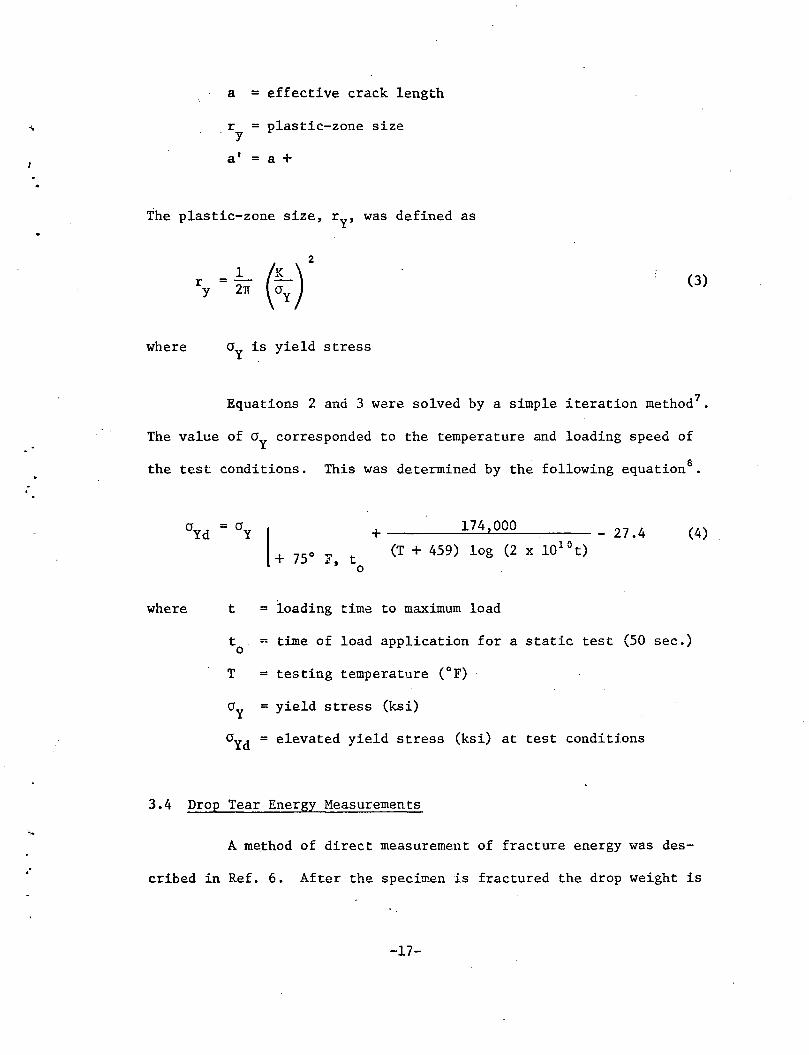
a = effective crack length
r = plastic-zone size - y
a' =a+
The plastic-zone size, ry, was defined as
where
r y
1 =-27f
(3)
cry is yield stress
Equations 2 and 3 were solved by a simple iteration method 7•
The value of cry corresponded to the temperature and loading speed of
the test conditions. This was determined by the following equation8•
where t =
t -· 0
T =
cry =
crYd =
75° F, t 0
+ ----=1=..:7~4:....z...=..OO;=..;O=------- _ 2 7 • 4 (T + 459) log (2 x 10¹⁰ t)
loading time to maximum load
(4)
time of load application for a static test (50 sec.)
testing temperature (oF)
yield stress (ksi)
elevated yield stress (ksi) at test conditions
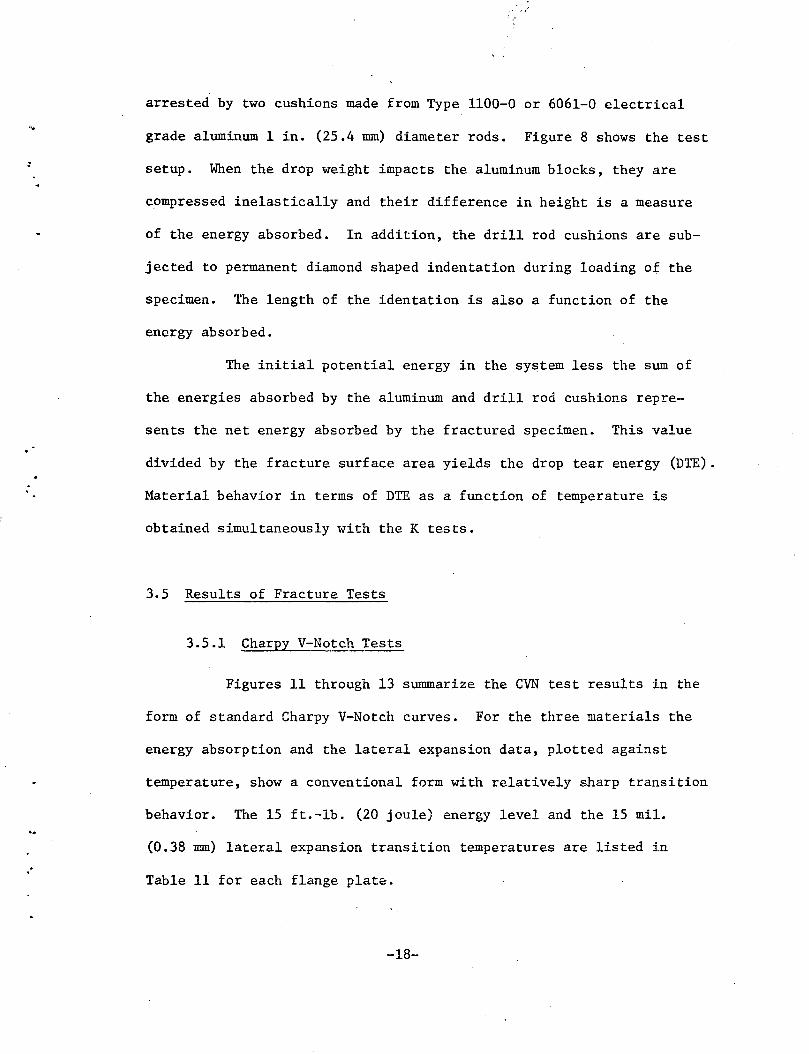
3.4 Drop Tear Energy Measurements
A method of direct measurement of fracture energy was des-
cribed in Ref. 6. After the specimen is fractured the drop weight is
-17-
. .
.. .·
. ,,,· ··,,
arrested by two cushions made from Type 1100-0 or 6061-0 electrical
grade aluminum 1 in. (25.4 mm) diameter rods. Figure 8 shows the test
setup. When the drop weight impacts the aluminum blocks, they are
compressed inelastically and their difference in height is a measure
of the energy absorbed. In addition, the drill rod cushions are sub-
jected to permanent diamond shaped indentation during loading of the
specimen. The length of the identation is also a function of the
energy absorbed.
The initial potential energy in the system less the sum of
the energies absorbed by the aluminum and drill rod cushions repre-
sents the net energy absorbed by the fractured specimen. This value
divided by the fracture surface area yields the drop tear energy (DTE) .
Material behavior in terms of DTE as a function of temperature is
obtained simultaneously with the K tests.
3.5 Results of Fracture Tests
3.5.1 Charpy V-Notch Tests
Figures 11 through 13 summarize the CVN test results in the
form of standard Charpy V-Notch curves. For the three materials the
energy absorption and the lateral expansion data, plotted against
temperature, show a conventional form with relatively sharp transition
behavior. The 15 ft.-lb. (20 joule) energy level and the 15 mil •
(0.38 nnn) lateral expansion transition temperatures are listed in
Table 11 for each flange plate.
-18-
;
. .
...
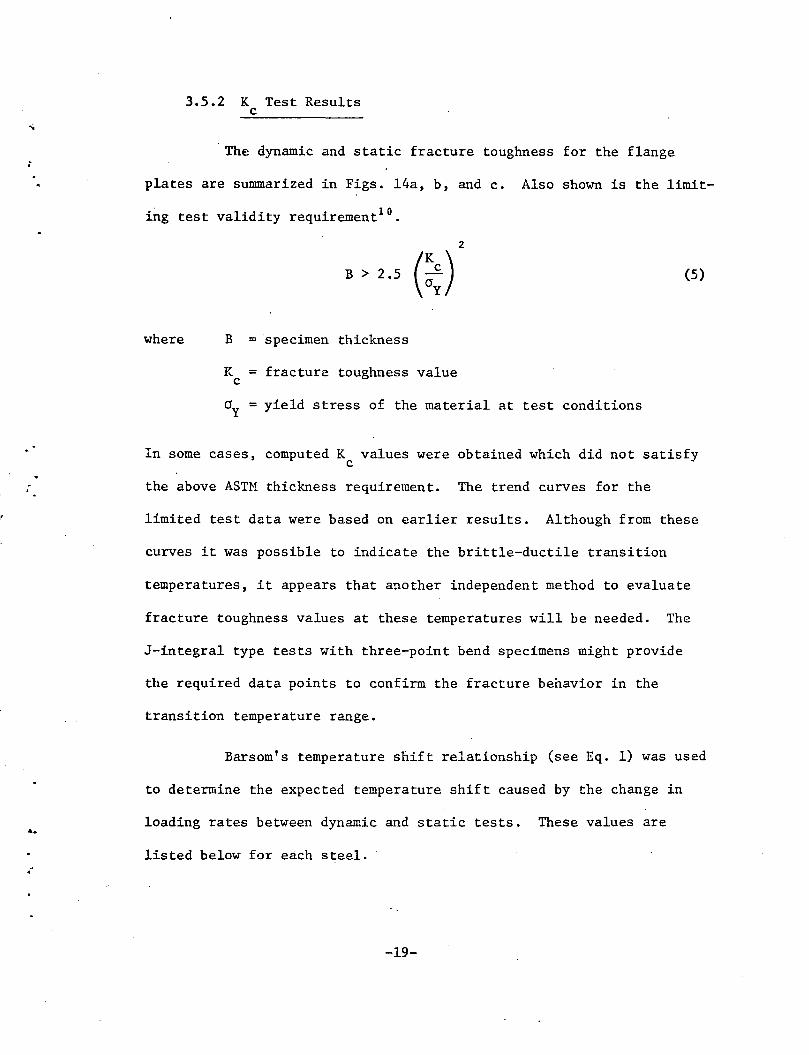
3.5.2 K Test Results c
The dynamic and static fracture toughness for the flange
plates are summarized in Figs. 14a, b, and c. Also shown is the limit-
ing test validity requirement10 •
where
B > 2.5 (~;)
B = specimen thickness
K = fracture toughness value c
2
cry = yield stress of the material at test conditions
(5)
In some cases, computed K values were obtained which did not satisfy c
the above ASTM thickness requirement. The trend curves for the
limited test data were based on earlier results. Although from these
curves it was possible to indicate the brittle-ductile transition
temperatures, it appears that another independent method to evaluate
fracture toughness values at these temperatures will be needed. The
J-integral type tests with three-point bend specimens might provide
the required data points to confirm the fracture behavior in the
transition temperature range.
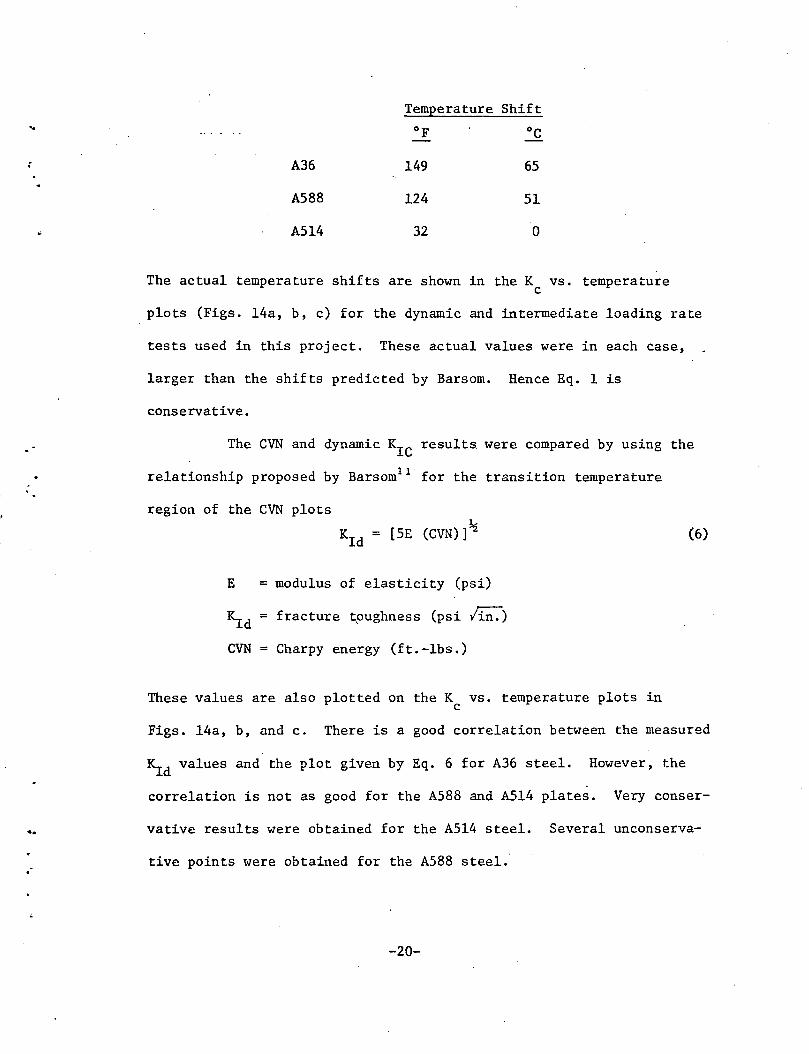
Barsom's temperature shift relationship (see Eq. 1) was used
to deter~mine the expected temperature shift caused by the change in
loading rates between dynamic and static tests. These values are
listed below for each steel.
-19-
-.
Temperature Shift
A36 149 65
A588 124 51
A514 32 0
The actual temperature shifts are shown in the K vs. temperature c
plots (Figs. 14a, b, c) for the dynamic and intermediate loading rate
tests used in this project. These actual values were in each case,
larger than the shifts predicted by Barsom. Hence Eq. 1 is
conservative.
The CVN and dynamic KIC results were compared by using the
relationship proposed by Barsom11 for the transition temperature
region of the CVN plots 1
Kid= [SE (CVN)]~
E = modulus of elasticity (psi)
Kid = fracture tpughness (psi /in.)
CVN = Charpy energy (ft.-lbs.)
These values are also plotted on the K vs. temperature plots in c
(6)
Figs. 14a, b, and c. There is a good correlation between the measured
Kid values and the plot given by Eq. 6 for A36 steel. However, the
correlation is not as good for the A588 and A514 plates. Very censer-
vative results were obtained for the A514 steel. Several unconserva-
tive points were obtained for the A588 steel.
-20-
3.5.3 Drop Tear Energy Test Results
The DTE data points were obtained simultaneously with the
Kid test data. A full DTE vs. temperature plot was not obtained.
Most of the points were on the lower shelf or in the transition region.
The DTE vs. temperature plots are presented in Figs. lSa, b, and c.
Generally, the transition temperatures from these diagrams are higher
and more conservative than the respective CVN transition temperature
for the same plate.
-21-
•.
..
.·
4. BEAM TEST RESULTS AND ANALYSIS
4.1 Fatigue Cracks
The fatigue cracks at the groove weld lateral attachments
were initially detected on the flange edge, at the sharp 0.75 in.
(19.1 mm) or less radius, as 1/4 in. (6 mm) elliptical surface cracks.
These surface cracks soon became elliptical corner cracks and then
edge cracks. All final fractures at this detail were precipitated
from an edge crack.
On the overlapped fillet weld detail, fatigue cracks were
initiated at the toe of the transverse fillet weld. Most of these
cracks were initially detected as several 0.5 in. (13 mm) elliptical
surface cracks which eventually connected to form one large elliptical
surface crack. ·As with the groove weld detail, these cracks then
became corner cracks and finally edge cracks. Beam B6 was the only
specimen to fracture from this detail.
The size of the fatigue cracks at each critical detail can
be found by referencing the small letters on the fracture surface draw
ings in Figs. 16- 21 with the load history tables given in Tables 5- 10.
Many additional fatigue cracks existed at other details on
the beams. Figures 22 and 23 show these fatigue cracks at all details
at two million cycles and prior to the last fracture test. The surface
measurements of these cracks is shown adjacent to the crack. The
crack shapes are merely estimates from these surface measurements.
-22-
..
4. 2 Remaining Fatigue Life
The number of cyclic loads needed to propagate an edge crack
from its fracture initiation point to an edge crack size of 75% of the
flange width, b, was defined as the remaining useful fatigue life had
brittle fracture not occurred. The following crack growth relation~
ship determined from earlier studies on welded details was used 12•
da = 2 x 10⁻¹⁰ ~3 dN
As defined in Section 4.5.2 the stress intensity range can be found
from the following relationship
!::.K= na' ~
tan~ ncr v7Ta'
Secondary stress intensity effects from residual stresses were ne-
(7)
(8)
glected for this analysis. Also by this stage of growth the crack had
grown out of the stress concentration zone. Through numerical inte-
gration of Eq. 8 the remaining fatigue life was estimated. The
results for each beam are listed in Table 12.
Figure 24 shows the mean S-N curve and its confidence limits
for Category E details. The data base used to develop this curve
utilized tests on 12 to 14 inch (35 to 36 mm) deep beams with a maxi-
mum flange thickness of 1/2 in. (12. 7 mm). The fatigue· results for
the lateral attachment beams, which had a maximum flange thickness of
2 in. (51 mm) are plotted on the same curve. The open figures repre-
sent the point at which the fatigue cracks were first observed and the
-23-
closed figures represent the point of fracture. There is a good corre-
lation between the fracture points and the Category E fatigue-life
relationship.
As can also be seen from Fig. 24 and the additional life
estimated and tabulated in Table 12, an incremental addition to the
fatigue life was small and would not have signific~~tly altered the
strength as all the points were well within the 95% confidence limits.
Hence even if rapid fracture had not occurred very little residual
life would have remained. Fatigue resistance design is therefore a
major objective of any fracture control plan in the design of bridge
girders.
4.3 Beam Fracture Tests
Beam B4A
Eight fracture tests were carried out on Beam B4A as the
test procedure was developed. Three of these tests were on the over-·
lapped fillet weld detail while five were on the groove weld detail.
The first five fracture tests were run with fatigue cracks
still in the stress concentration zone. After 1.5 million cycles the
largest fatigue crack found was a 1 in. x 1/16 in. (25.4 mm x 1.6 mm)
elliptical corner crack (see Fig. 22) at a transverse fillet weld.
The first two fracture tests were on this detail. At two million
cycles, a 3/8 in. x 1 in. (9.5 mm x 25.4 mm) elliptical corner crack
was observed at a groove weld detail. The fracture tests were carried
out at test temperatures between -40° F (-40° C) and -60° F (-51° C)
-24-
.-
as can be seen in Table 8. No crack instability developed during any
of these three tests.
A test was run on the fillet weld detail where a
1-7/8 in. x 9/16 in. (48 mm x 14 mm) elliptical corner crack existed.
No fracture occurred there as well. With a 1-1/2 in. x 1-3/4 in.
(38 mm x 44 mm) corner crack at the groove weld detail (test h) the
next test reached a temperature of ~170° F (112° C), however, no frac
ture occurred.
The cracks were extended by applying 250,000 cycles of
fatigue loading at room temperature. The critical fatigue crack at
the groove weld detail was grown to a rv 2-3/4 in. (70 mm) edge crack
during this cyclic loading. At this point a -70° F (-56.5° C) frac
ture test was run. The test lasted 2.67 hours. During this test, the
fatigue crack grew very rapidly through the high tensile residual
stress region of the web to flange fillet welds. Finally, the beam
fractured with an average edge crack size of 4.8 in. (122 mm) and
temperature of -96° F (-71° C). Fatigue crack extension of approxi
mately 2 in. (51 mm) was experienced during this test prior to crack
instability.
Be.:un B4
It was apparent from experience with Beam B4A. that rapid
fracture was not likely to occur at -40° F (-40° C) with small·cracks
in the stress concentration zone. Therefore, the beam was cycled at
room temperature for two million cycles. At this point several large
elliptical corner cracks existed as shown i.n Figs. 18 and 22. The
-25-
..
first fracture test lasted for one-half hour and both details were
tested simultaneously. No fracture occurred.
The beam was then cycled at room temperature to extend the
fatigue cracks. When the crack at the critical detail became a
~ 2-3/8 in. (60 mm) edge crack, a second fracture test was run. A
temperature of -70° F (-56.5° C) was obtained before the cyclic load
was applied. A stress range of 9 ksi (62.1 MPa) was applied for forty
minutes. To speed the incipent fracture, the load range was increased
to 9.8 ksi (67.6 MPa) while maintaining the same maximum stress. After
one hour at this stress range and a nominal temperature of -70° F
(-56.5° C) fracture occurred. At fracture, the temperature was -80° F
(-62.0° C). A~ 3/4 in. (19 mm) fatigue crack extension was experi
enced during this test. The fracture occurred when the crack tip was
in the high tensile residual stress zone of the web to flange weld.
Beam B6
The first fracture test was run on both details simultane
ously after two million fatigue cycles. Since very small fatigue
cracks existed (see Fig. 22) no fracture occurred. After 800,000
cycles of additional fatigue load the elliptical surface crack at the
critical fillet weld detail grew to a large 2-3/8 in. x 1-1/2 in.
(60 mm x 38 mm) elliptical corner crack. At this point· two consecu
tive five hour fracture tests were run (test d and e, see Fig. 20) on
this detail. Fracture occurred after the elliptical fatigue crack be
came an edge crack. The fracture temperature was .-53° F (-47.0° C).
This was the only fracture to occur at a fillet weld detail.
-26-

During the fatigue cycling of this beam, the ram in the con
stant load jack overheated. This caused the maximum load to decrease
during the fatigue cycling overnight. Although the maximum load
decreased, the stress range remained the same. The actual drop in
maximum stress was 4.5 ksi (31.03 MPa) for 400,000 cycles.
Beam B2A
Five fracture tests were run on this beam (see Fig. 17).
The first test at two million cycles was on both details. Both
details contained large corner cracks at this point (see Fig. 22),
however no fracture occurred at 40° F (-40° C). Since the elliptical
corner crack at the groove weld detail grew quickly to a critical edge
crack, the remainder of the fracture tests were conducted on this
detail alone. During the last test, the temperature was maintained
at --40° (-40° C) for 1~ hours. Wnile the beam was still being cycli
cally loaded, the temperature was slowly dropped to -140° F (-95.5° C)
in over 1~ hours. The -140° F (-95.5° C) temperature was maintained
for another 1~ hours before fracture occurreci at -144° F (-98° C).
About 1/4 in. (6.4 mm) fatigue crack extension was experienced during
the test prior to crack instability.
Note that the beam was fatigue cycled at a lower maximum
stress than that during the fracture test. The same stress range was
maintained during both fatigue and fracture testing. See Table 6 for
the actual stresses and stress ranges used.
-27-

•.
•
..
Beam B6A
The first fracture test was run on both details (see Fig. 22)
at -40° F (-40° C). No fracture occurred. After an additional
730,000 cycles of fatigue load at room temperature, a corner crack at
the groove weld detail became a ~ 1-1/4 in. (32 mm) edge crack. The
subsequent fracture test lasted 1_-67 hours during which the temperature
was slowly dropped from -40° F (-40° C) to -92° F (-69° C) at which
point rapid fracture occurred. An average fatigue crack extension of
1/4 in. (6.4 mm) (see test d, Fig. 21) was experienced prior to
fracture.
Beam B2
At two million cycles, a 1 in. (25 mm) edge crack existed at
the groove weld detail while smaller elliptical corner cracks existed
at the fillet weld detail (see Fig. 22). Both details were tested for
forty minutes at -40° F (-40° C). At this time the cyclic load was
stopped and the groove weld detail was cooled to -140°· F (-95.5° C).
After this temperature was obtained, the cyclic load was reapplied.
After twenty minutes of cycling, fracture occurred at a temperature of
-155° F (-104° C). A 1/4 in. (6.4 mm) fatigue crack extension was
experienced during the last test (see test b, Fig. 16).
The beam was fatigue cycled at a lower maximum stress than
that during the fracture test. The same stress range was maintained
during both fatigue and fracture testing. See Table 5 for the actual
stresses and stress ranges used.
-28-
•
4.4 Fracture Test Variables Affecting Fracture Toughness
Each fracture test had two major variables affecting the
fracture resistance of the steel beam. These were the fatigue crack
size and test temperature •
Since no beam fractured on the first cycle of load an effort
was made to induce rapid fracture at -40° F (-40° C) by growing the
fatigue crack to a critic&l size. As noted in Section 4.3, Beams B4,
B4A, and B6 experienced average fatigue crack extensions of 0.65 in.
(17 mm), 2.0 in. (51 mm), and 1.3 in. (33 mm), respectively, prior to
brittle fracture. These large crack extensions took several hours to
achieve.
Since time was a limiting factor, the test temperature was
used as another variable. The slow cooling rate of approximately 1° F
(.6° C) per minute was used. Temperature at the critical details are
shown graphically in Figs. 25 to 27 for the final 60 minutes of the
last fracture test. In every case the temperature was slowly decreas
ing when fracture occurred.
Although large temperature gradients existed around the
critical beam section, as shown in Table 4, an effort was made to keep
accurate account of the surface temperature at the critical welded
detail. The temperature gages were positioned at the critical detail
on the exterior of the tension flange, thus being out of direct con
tact with the liquid nitrogen.
-29-

4.5 Stress Intensity Estimates
' ~
4.5.1 Introduction
All the flange cracks in the lateral attachment details were
large edge cracks at fracture. This tended to simplify the calcula-
tions of the stress intensity factor. However, since the plates were
flame cut and the beams and details were welded a rather complex resid-
ual stress pattern was present at the detail cross-section. Therefore
several steps were used to estimate the value of the stress intensity
factor, K.
By the method of superposition the following contributions
were used to determine the magnitude of K. rhe primary contribution
was from the applied stresses at failure. A secondary contribution
was from the residual stresses at the detail cross-section. The resid-
ual stresses at the cracked section resulted from two contributions:
One contribution to K was from the residual stresses at a typical
cross-section of the welded beam. These stresses were caused by the
web-to-flange welds and the flame cut plate edges. The other contri-
bution was due to the residual stresses caused by the local detail
welds. In this draft these residual stresses were estimated from
available information.
In one case, the flange edge crack grew thro~gh the web-to
flange welds. The fatigue crack growth continued in twq directions,
upward into the web and across the flange. Therefore, when estimating
the stress intensity, the web interaction had to be considered as well.
The web restrained the large flange crack from opening. Thus the
-30-
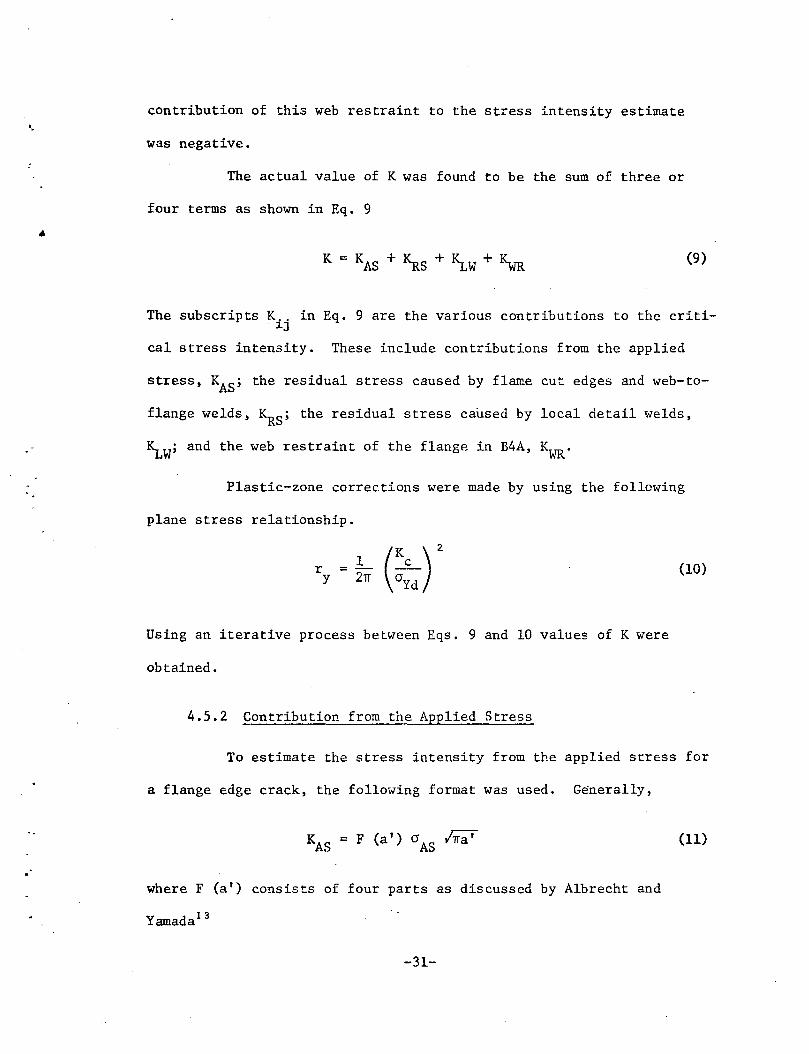
•. contribution of this web restraint to the stress intensity estimate
was negative.
The actual value of K was found to be the sum of three or
four terms as shown in Eq. 9
K = KAS + ~S + ~W + ~ (9)
The subscripts K .. in Eq. 9 are the various contributions to the criti-1J
cal stress intensity. These include contributions from the applied
stress, KAS; the residual stress caused by flame cut edges and web-to
flange welds, ~5 ; the residual stress caused by local detail welds,
~W; and the web restraint of the flange in B4A, KWR.
Plastic-zone correc.tions were made by using the following
plane stress relationship.
(10)
Using an iterative process between Eqs. 9 and 10 values of K were
obtained.
4.5.2 Contribution from the Applied Stress
To estimate the stress intensity from the applied s~ress for
a flange edge crack, the following format was used. Generally,
KAS = F (a') crAS Ina' (11)
where F (a') consists of four parts as discussed by Albrecht and
Yamada13
-31-
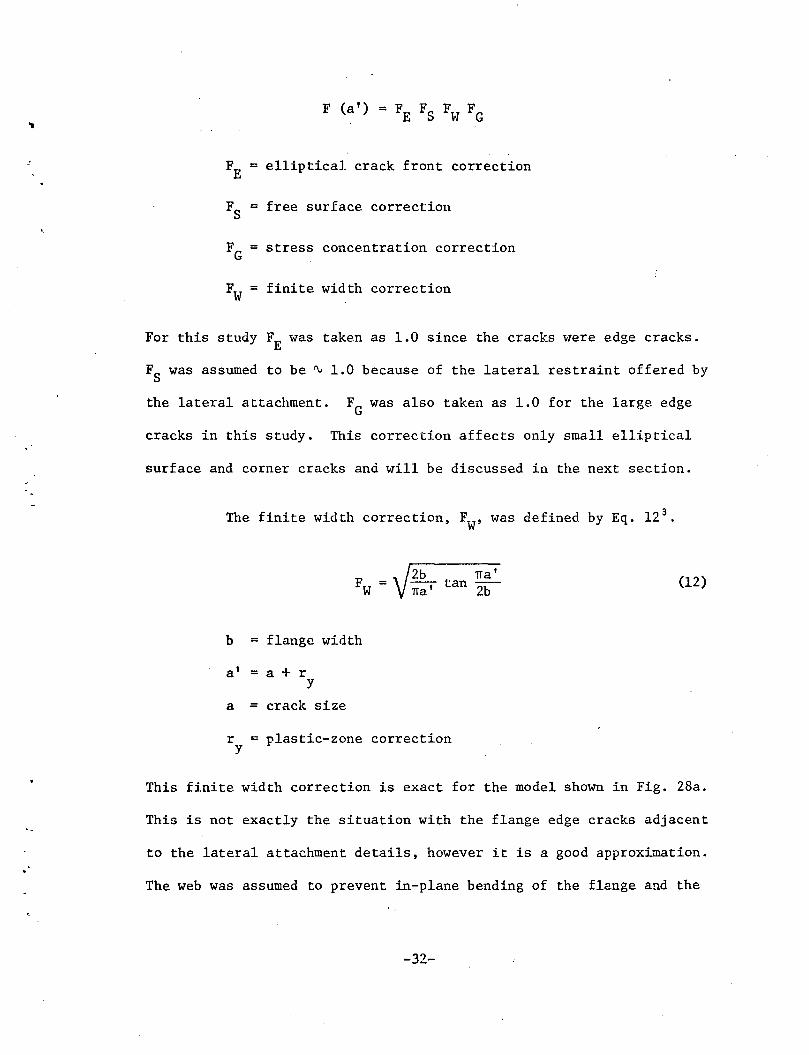
FE = elliptical crack front correction
Fs = free surface correction
FG = stress concentration correction
Fw = finite width correction
For this study FE was taken as 1.0 since the cracks were edge cracks.
F8 was assumed to be ~ 1.0 because of the lateral restraint offered by
the lateral attachment. FG was also taken as 1.0 for the large edge
cracks in this study. This correction affects only small elliptical
surface and corner cracks and will be discussed in the next section.
The finite width correction, FW, was defined by Eq. 12 3•
2b na' tan
Tia' 2b (12)
b = flange width
a' = a + r y
a = crack size
r = plastic-zone correction y
This finite width correction is exact for the model shown in Fig. 28a.
This is not exactly the situation with the flange edge cracks adjacent
to the lateral attachment details, however it is a good approximation.
The web was assumed to prevent in-plane bending of the flange and the
-32-
..
lateral attachment plates were assumed to partially prevent Poisson
contractions on the flange tip as shown in Fig. 28b. For these rea
sons the dimensions used are those shown in Fig. 28b.
In the actual beam fractures, the stresses were not uniform
through the plate thicknesses nor were the edge crack fronts. For
these reasons the critical stress intensity was estimated for 1/3
levels through the flange thickness. The average crack size and
stress were used for the respective one-third thickness of the flange.
The measured values of the critical crack size, a, for each beam are
listed in Table 13. The estimated values of KAS are listed in
Table 14.
4.5.3 Contributions from Stress Concentration
The stress concentrations for the groove weld details were
determined from a current study at Fritz Engineering Laboratory. In
this study, similar details were modeled using a three-dimensionsal
finite element analysis 19• By comparing certain dimensional para
meters, the stress concentration for the uncracked detail was deter
mined to be 2.22 for the groove weld detail with a .75 in. (19 mm)
radius transition at the 1.5 in. x 6 in. (38 mm x 152 mm) flange.
Similarly, the stress concentration for the groove weld detail
attached to the 2 in. X 7 in. (51 mm X 178 mm) flange was estimated
as 2.19. 1bese stress concentration factors are lower bound esti
mates. Examination of the fabricated details showed that for the
critical details that cracked, the transition was irregular and not a
-33-
smooth radius (see Fig. 29a). These irregularities were modeled for
the most severe case, a 45° angle reentrant corner with 3/4 in. (19 mm)
legs (see Fig. 29b). A stress concentration factor of about 7.9 was
estimated for this case.
The overlapped fillet weld detail had a comparable stress
concentration at approximately 7.1 for the 1-1/2 in. x 6 in.
(38 mm x 156 rom) flange and 7.3 for the 2 in. x 7 in. (51 mm x 178 mm)
flange. However, only one beam failed from this detail. There are at
least two reasons for this. First, surface fabrication discontinuities
at the radius elevated the apparent stress concentration. Second, the
stress range at the groove weld detail was 12.5% higher than that at
the fillet weld detail. The combination of these two differences made
the groove weld detail more critical in all but one case.
The stress concentration, KT, decays as a crack initiates
and grows at the detail. This decay is also being studied at Fritz
Engineering Laboratory by Zettlemoyer 19• The study matches the decay
described by Albrecht and Yamada13 , to an uncracked elliptical model.
By varying the size of the ellipse in an infinite plate the effect of
stress concentration decay can be matched. The purpose of this study
is to develop a quick and inexpensive method to determine this decay
for any detail and stress concentration situation. Th~s analysis was
used to model a groove weld detail for stress intensity variation with
crack size.
The A514 steel groove weld detail on Beam B2A was examined
for stress concentration effects on the stress intensity factor, K.
-34-
·. I
•
..
..
..... - --
Results were obtained for two attachment-to-flange reentrant corner
models: Case A was the smooth 3/4 in. (19 mm) radius transition (see
Fig. 29a), Case B was the 3/4 in. (19 mm), 45° straight line transition
shown in Fig. 29b. The stress concentration decay with crack size, FG'
is shown in Fig. 29c for both cases. Since the stress concentration
value, K, in Case B was much higher than that used in Case A, the decay
of ~ with crack growth for Case B was more rapid than Case A. Be
cause of this the maximum stress intensity obtained for Case B was
lower than the value obtained for Case A (see Fig. 30). Hence, this
elevated stress concentration (Case B) at these details did not
appreciably magnify the stress concentration, when compared to Case A
results, but did cause a more rapid crack initiation.
The variation of stress intensity and crack size is sum
marized in Fig. 30 for both cases. It was conservatively assumed that
the small cracks began as small elliptical corner cracks. The vari
ation of the semi-major and semi-minor axes was defined by Eq. 13
where
c
C -- semi-major axis
a = semi-minor axis
1.465 a0.202 (13)
This relationship was determined from crack size measurement data. As
can be seen in Fig. 30, the maximum stress intensity obtained for
elliptical corner cracks was 126 ksi lin. (139 :t-1Pa rm ) for a crack
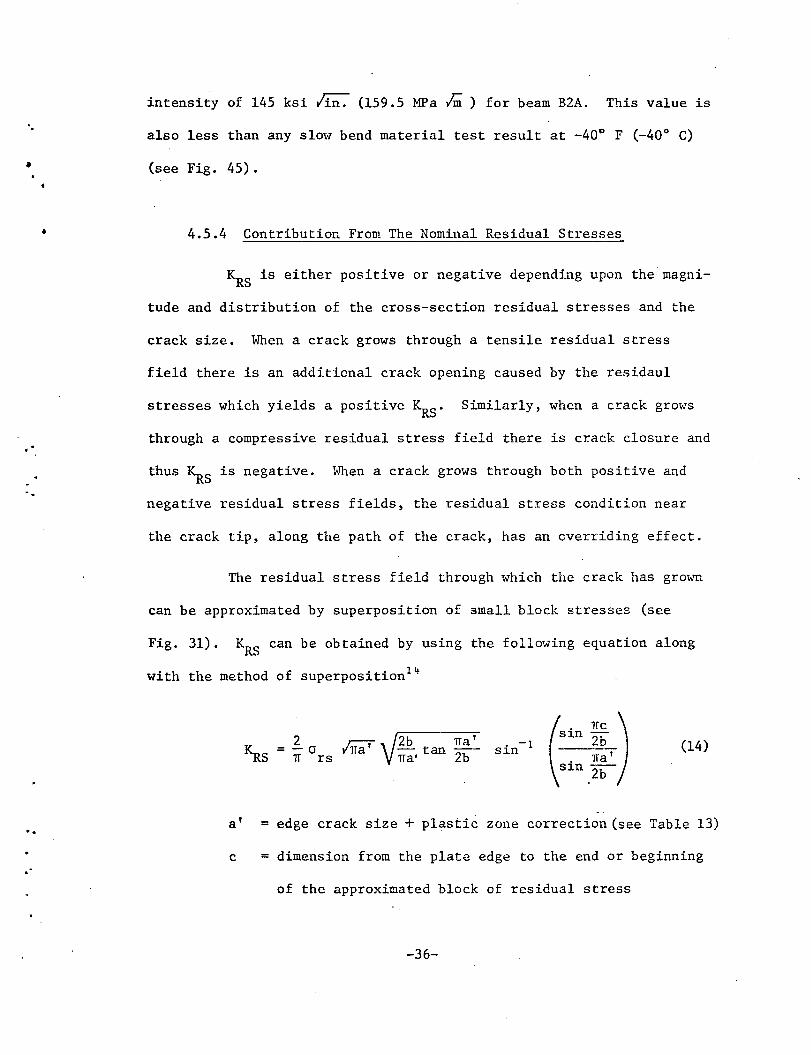
size of .35 in. (9 mm). This value was less than the critical stress
-35-
--·:"'·- -·. . -~~- . --' ~
·.
•
.. ..
intensity of 145 ksi /in. (159 .5 MPa v'm ) for beam B2A. This value is
also less than any slow bend material test result at -40° F (-40° C)
(see Fig. 45).
4.5.4 Contribution From The Nominal Residual Stresses
KRS is either positive or negative depending upon the magni-
tude and distribution of the cross-section residual stresses and the
crack size. When a crack grows through a tensile residual stress
field there is an additional crack opening caused by the residaul
stresses which yields a positive KRs· Similarly, when a crack grows
through a compressive residual stress field there is crack closure and
thus ~S is negative. When a crack grows through both positive and
negative residual stress fields, the residual stress condition near
the crack tip, along the path of the crack, has an overriding effect.
The residual stress field through which the crack has grown
can be approximated by superposition of small block stresses (see
Fig. 31). ~Scan be obtained by using the following equation along
with the method of superposition 1 ~
(
• Tic ) s1n 2b na'
sin~
(14)
a' =edge crack size+ plastic zone correction(see Table 13)
c dimension from the plate edge to the end or beginning
of the approximated block of residual stress
-36-
·.
..
b = plate width
0 · = magnitude of the residual stress block rs
To obtain a good approximation of ~S' stress block widths
of 0.02 in. (.5 mm) were used over the entire crack length. Results
of ~S for each beam fracture are listed in Table 14 and plotted as a
function of crack size in Figs. 32 to 37.
Actual measured residual stresses of the nominal beam sec-
tions were used when available. If not available, the flange residual
stresses were estimated from previous studies with similar plate
thickness 15,
16• Two assumptions were made in this estimation. First,
the distribution of residual stresses through the plate thickness was
assumed to be linear. Second, the residual stresses in the flange
alone were assumed to be in equilibrium. The estimated residual stress
distributions are shown in Figs. 39 through 41 for each steel.
4.5.5 Contribution from the Local Weld Residual Stresses
The local detail welds change the nominal section residual
stress pattern over the entire cross-section at the detail. Ideally,
there should be only one residual stress contribution from the actual
residual stresses at this critical section. Since there was no avail-
able data on residual stress state at this section, a two step proce-
dure was used to estimate the effect along with the principle of
superposition.
After the nominal beam section residual stresses \olere esti-
mated, an additional local residual stress was assumed to account for
-37-
·.
•
..
the detail welds. Both the nominal residual stresses and the local
residual stresses are being measured. Pending completion of these
measurements, the local welding effect was simulated in the following
manner •
The residual stress distribution along the flange tip at the
groove weld detail was assumed as is shoW11 in Fig. 42a. The decay of
the stress along the flange tip was assumed to be very rapid beyond
the attachment edge. The stress at the location where most of the
cracks initiated was assumed to be about cry/4. This stress was as
sumed to be distributed over 1/2 in. (12. 7 mm) of the flange tip as
shown in Fig. 42a. Equation 14 was again used to determine the contri
bution from local welding. These values are also listed in Table 14.
The fillet weld detail, top one-third analysis included a
different local residual stress distribution because the detail had a
fillet weld along the inside surface of the flange. It was assumed
that the magnitude of the local residual stress, cry/4, at the flange
tip decayed to cry/8 at the end of the transverse weld (see Fig. 42b).
The middle and bottom third levels were treated similar to the groove
weld details because there was also a longitudinal fillet weld made
along the flange tip.
4.5.6 Contribution From The Web Restraint
Only beam B4A was observed to develop web restraint since
the fatigue crack at fracture had grown as an edge crack through the
web-to-flange.welds and then became a two ended crack. Tnis is shown
-38-
·.
. '
..
in Fig. 19. The analysis of the web restraint and the apparent reduc-
tion of the stress intensity is an iterative solution which is very
involved. The actual analysis is discussed in detail in Appendix 1.
The web restraint was predicted to decrease K by -12 ksi lin.
( -13 • 2 MP a iiU ) .
4.5.7 Summary and Discussion of the Various Contributions
The values of KAS' ~S' ~W and ~ are listed in Table 14
for each one-third level of the flange thickness for each critical
fatigue crack. The critical value for each beam was taken as the maxi-
mum value. Some modification of these values will be made 't-lhen actual
residual stress measurements are available. Plots showing the vari-
ation of each K .. parameter with crack size are presented in Figs. 32 ~J
to 37 for the critical one-third level of flange thickness.
The estimated residual stress diagrams sho"t-m in Figs. 39 to
41 were used to determine the average residual stress distribution for
each one-third level of flange thickness. A linear distribution was
assumed through the thickness. The upper one-third level had the
greatest residual stress influence while the bottom one-third level
had the least.
For crack growth less than approximately 1.1 .in. (28 mm),
the crack shape was an elliptical corner crack as described in
Section 4.5.3 for the groove weld details. The local weld tensile
residual stresses and the nominal section tensile residual stresses on
-39-

·.
..
the flange tip both influenced the total stress intensity value in
addition to the applied stress magnification by the stress ~oncentra
tion parameter, FG. These variations with crack size, a, are shown in
Fig. 30 for beam B2A. When the crack size for the elliptical corner
cracks was approximately 1.1 in. (28 mm) the semi-major axis became
equal to the flange thickness. At this point the crack rapidly became
a 1.1 in. (28 mm) edge crack and the stress intensity suddenly
increased. This discontinuity is shown in Fig. 30.
The residual stress effects on stress intensity for edge
cracks can readily be seen in the ~S vs. Edge Crack Size plots (see
Figs. 32 to 37). As the edge crack grew a size of 1.1 in. (28 mm)
into the negative residual stress zone there was a decrease in ~S
which extended over the'next 2 in. of crack growth. In most cases
this decrease in ~S held the total stress intensity value, K, con
stant over this region.
Continued crack growth resulted in a rapid increase in ~S
as the fatigue crack grew into the high tensile residual stress region
caused by the web-to-flange fillet welds. This also caused K to in
crease rapidly. This residual stress influence on K greatly affected
the fracture of beam B4 (top one-third analysis, Fig. 34) and B6 (top
one-third analysis, Fig. 36). Each beam fractured with a crack size
at or near the peak K value caused by KRS' The fracture of beam B6A,
was caused by a rising ~ and K, (see Fig. 37). The point of frac
ture is marked on each "K vs. a" plot.
-40-
..
..
..
KAS increased at a near constant rate for edge crack growth.
Since the applied stresses were very high in the A514 beams this para
meter had an overriding effect on ~S and ~w· This is shown in the
bottom one-third analysis for beams B2 and B2A, Figs. 32 and 33
respectively •
~W had its greatest influence on small elliptical corner
cracks (see Fig. 30). For edge cracks at the groove weld details this
contribution became constant and comparatively small. This contribu
tion was slightly higher for the overlapped fillet weld detail.
The fracture of B4 was precipitated by the presence of the
high tensile residual stress area at the web-to-flange welds. Beam B4A
had a fatigue crack which grew through the same area during a fracture
test and at a 6% higher applied stress but did not fail. This can
only be explained by a difference in test temperatures when the
fatigue cracks grew into this critical area. As can be seen from the
material tests K vs. temperature plot for A36 steel (Fi.g. 43), a
slight difference in the test temperatures would cause a large change
in the critical stress intensity factor, KC. This was the case as the
beam B4A test temperature {-70° F (~57° C)} was warmer than the tem
perature of beam B4 {-80° F (-62° C)} when the fatigue crack grew into
this region.
As the fatigue crack in beam B4A grew through the web-to
flange welds ~ was continually increasing. However, this was
counter balanced by the flange crack opening restraint of the web.
Only when the crack grew ~ 1-1/4 in. (~ 32 rom) past the web did
-41-

fracture occur. ~ had only a small effect on the estimated stress
intensity since, at the time of fracture, the critical K was deter
mined at the bottom one-third level of flange thickness.
-42-

-.
5. COMPARISON OF BEAM K ESTIMATES AND MATERIAL K TESTS c
5.1 Lateral Attachment Details
The beam fracture stress intensity estimates were correlated
with the static and dynamic material toughness characterizations. Both
the A36 and A588 beam fractures occurred at temperatures in the transi-
tion temperature region of the slow bend KIC material tests. As can
be seen in Figs. 43 to 45, there is a very good correlation between
the beam K estimates and the slow bend material tests. The A514 beam
fractures occurred at temperatures below the slmv bend curve transi-
tion temperature region. The beam stress intensity estimates, however,
were conservative since these points were above the KIC value.
The good correlation between the beam stress intensity esti-
mates and the slow bend KIC material tests can be attributed to their
similar loading rates. As discussed in Section 2.9, the beam fracture
test loading rate was between 70 and 100 ksi/sec. and occurred as the
crack front was being advanced under cyclic loading. The slow bend,
three-point bend specimens were loaded at a rate of 20 kips/sec. which
is 50 ksi/sec. at the crack tip. The dynamic KID specimens were frac
tured in approximately 4 x 10⁻⁴ se~. The beam tests demonstrated that
the fracture· resistance of these welded bridge details.corresponded to
the fracture toughness measurements which used a loading time of about
one second.
-43-
Also plotted in Figs. 43 to 45 are the beam stress intensity
estimates from the applied stress alone (KAS). There is good correla
tion between KAS for beams B2, BZA, B4A, and B6A and their respective
slow bend material test results. This demonstrates that in these
tests, the residual stresses from welding and flame cutting did not
significantly alter the fracture resistance. However the contribution
to the stress intensity estimate from the residual stress field, ~
should be considered when the crack tip is in the high tensile resid~
ual stress region of the web-to-flange welds. This can readily be
seen in Figs. 18 and 20 for beams B4 and B6, respectively. In both of
these cases KRS was nearly 50% of the total stress intensity estimate.
-44-
•.
..
6. CONCLUSIONS
This report summarizes the fatigue and fracture resistance
of full scale welded beams with lateral attachments. The fatigue test
results were correlated with available test data obtained from smaller
beams. TI1e beam fracture resistance was correlated with fracture con
trol tests made on the same material.
1. The stress intensity estimates from the beam fractures were
best modeled by the slow bend KIC fracture toughness. The
beam fracture tests and the slow bend KIC tests had similar
loading rates. These tests have demonstrated the applicabil
ity of the one second loading time to measurements of frac
ture resistance of bridge beams.
2. For relatively large cracks, a good approximation of the
critical stress intensity factor, K, for beam fractures can
be estimated by only considering the applied stress. However
if the edge crack tip has moved into the high tensile resid
ual stress field near the web-to-flange welds, the residual
stress contribution, ~' should be included. Fracture
usually occurred when the crack tip was in this region. In
one instance there was rapid fatigue crack growth through
this region due to a rise in K, however, fracture did not
occur until the fatigue crack \..ras larger .
. -45-
•
'.
..
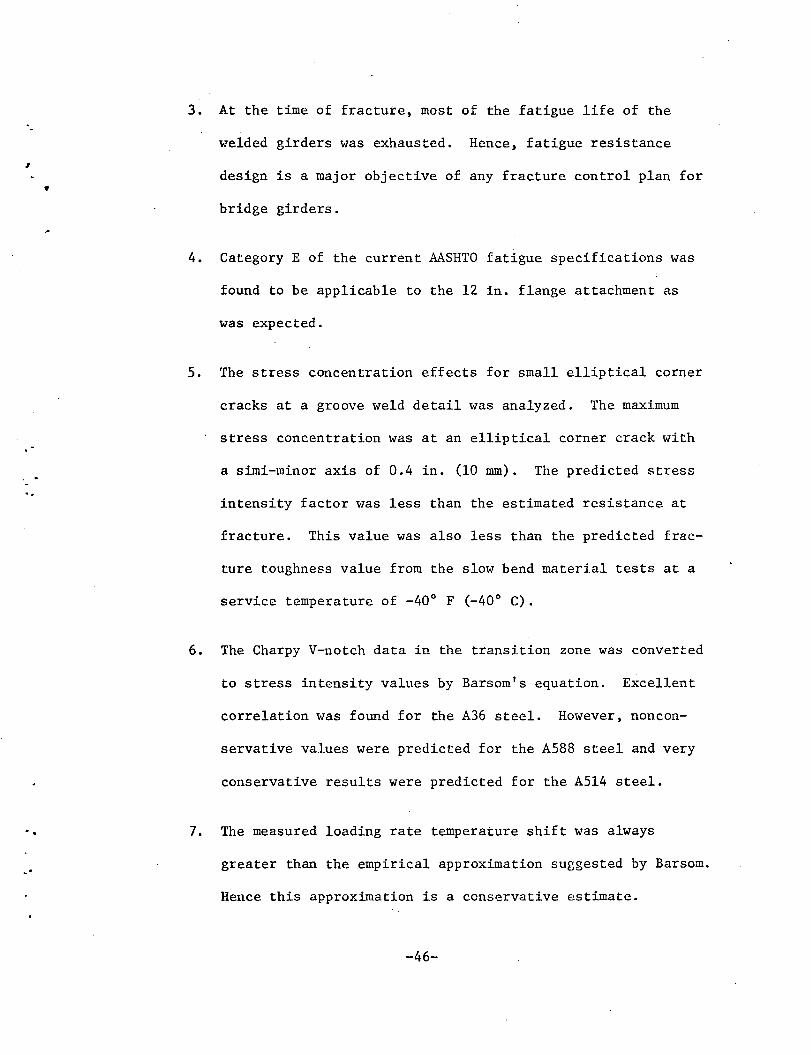
3. At the time of fracture, most of the fatigue life of the
welded girders was exhausted. Hence, fatigue resistance
design is a major objective of any fracture control plan for
bridge girders.
4. Category E of the current AASHTO fatigue specifications was
found to be applicable to the 12 in. flange attachment as
was expected.
5. The stress concentration effects for small elliptical corner
cracks at a groove weld detail was analyzed. The maximum
stress concentration was at an elliptical corner crack with
a simi-minor axis of 0.4 in. (10 mm). The predicted stress
intensity factor was less than the estimated resistance at
fracture. This value was also less than the predicted frac
ture toughness value from the slow bend material tests at a
service temperature of -40° F (-40° C).
6. The Charpy V-notch data in the transition zone was converted
to stress intensity values by Barsom's equation. Excellent
correlation was found for the A36 steel. However, noncon
servative values were predicted for the A588 steel and very
conservative results were predicted for the A514 steel.
7. The measured loading rate temperature shift was always
greater than the empirical approximation suggested by Barsom.
Hence this approximation is a conservative estimate.
-46-
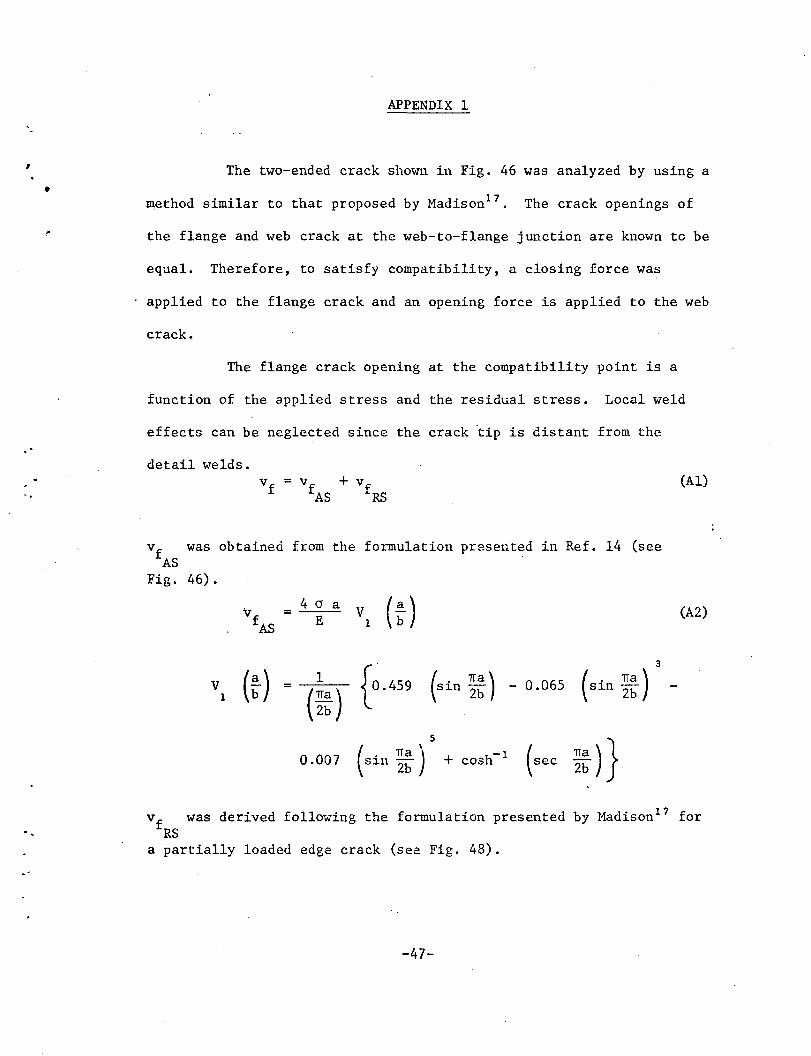
APPENDIX 1
The two-ended crack shown in Fig. 46 was analyzed by using a
• method similar to that proposed by Madison17
• The crack openings of
the flange and web crack at the web-to-flange junction are known to be
equal. Therefore, to satisfy compatibility, a closing force was
applied to the flange crack and an opening force is applied to the web
crack.
The flange crack opening at the compatibility point is a
function of the applied stress and the residual stress. Local weld
effects can be neglected since the crack ~ip is distant from the
detail welds. (Al)
v fAS
was obtained from the formulation presented in Ref. 14 (see
Fig. 46).
v 4 cr a v (;) (A2) = fAS E 1
{o.4S9 3
v (:) 1 ( . Tia) - 0.065 ( . 1ra ) 1 (~~)
s1n Zb s1n Zb
5
~:)} 0.007 ( . Tia ) + cosh- 1 (sec Slll Zb
v was derived following the formulation presented by Madison 17 for fRS
a partially loaded edge crack (see Fig. 48).
-47-

I
..
X < c: 4cr =-ETI
X > c: 40 =-
ETI
(A3)
X = 0
4cr =-
ETI
(A4)
The web crack opening at the compatibility point is also a
function of the applied stress and the residual stress 1 ~.
v w
v + v WAS WRS
v was estimated following the formulation presented in Ref. 14 for wAS
the in-plane bending case (see Fig. 48 for the diagram)
4 CJ a v (:) v = WAS E 2
2 v (:) 0.8- 1.7 ( ~) + 2.4 (~) + 0.66 (A5)
2 (1-:)2
-48-
I
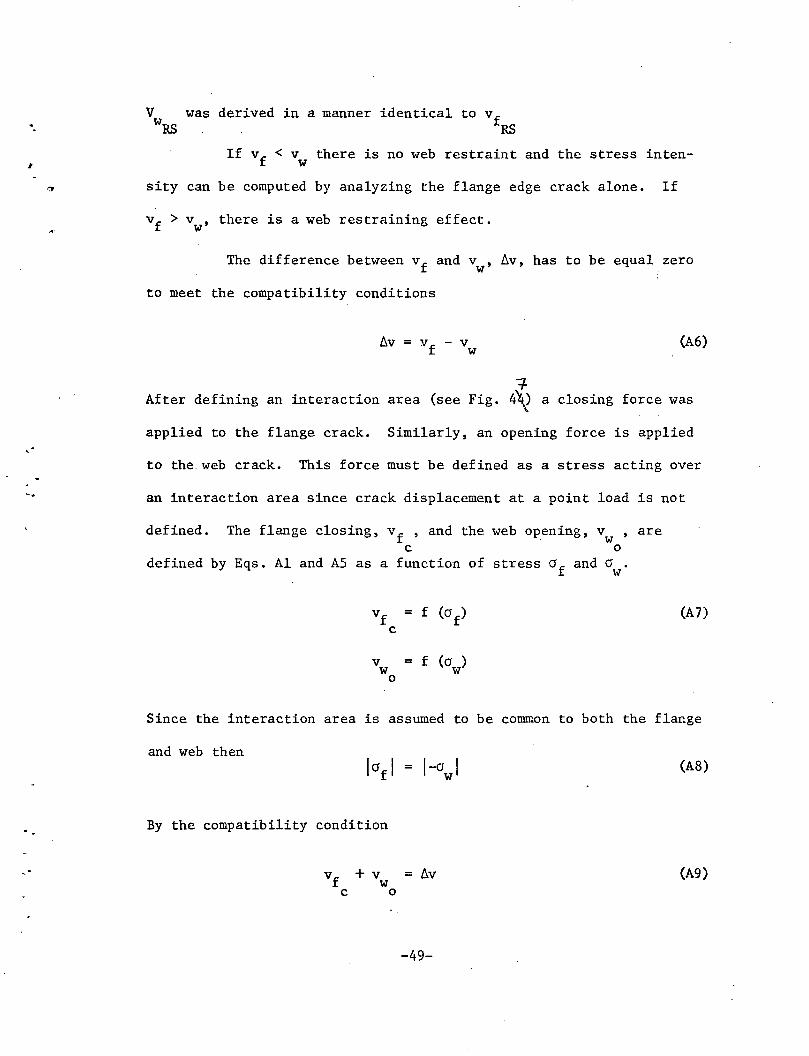
V was derived in a manner identical to vf w~ ~
If vf < vw there is no web restraint and the stress inten-
sity can be computed by analyzing the flange edge crack alone. If
vf > vw' there is a web restraining effect.
The difference between vf and vw' ~v, has to be equal zero
to meet the compatibility conditions
~v = (A6)
-=/-After defining an interaction area (see Fig. 4~ a closing force was
applied to the flange crack. Similarly, an opening force is applied
to the web crack. This force must be defined as a stress acting over
an interaction area since crack displacement at a point load is not
defined. The flange closing, vf , and the web opening, c
v , are w
0
defined by Eqs. Al and AS as a function of stress of and 0 . \~
v = f (o ) w w 0
(A7)
Since the interaction area is assumed to be common to both the flange
and web then
By the compatibility condition
+v w
0
1-cr I w (AS)
= ~v (A9)
-49-

., -
Of or ow can be solved directly from Eqs. A7 and A9. From the c 0
stress in the flange of, and the assumed interaction area a restrain-
ing value of K can be determined through Eq. 14 in Section 4.5.4.
Idealiy this procedure should be an iterative one using the
plane stress plastic zone correction
Since the fracture toughness, 'K , of the material from the material c
characterization is known, a first approximation of r can be obtained y
and thus a good estimate of ~· This was the case for analysis of
beam B4A. Only one iteration was needed since the interaction area
was in the top one-third of the flange thickness as shown in Fig. 47.
The restraint was decreased linearly to the bottom one-third. Thus
~was -12, -6, 0 for top, middle and bottom levels of the flange
thickness.
-50-

..
NOMENCLATURE
a = edge crack size
a' = a+ r y
B = 3 point bend specimen width
b = flange width
c = dimension from the plate edge to the end or beginning of the
approximated block of residual stress (see Fig. 4.17)
E =Young's Modulus, 29000 ksi
FE elliptical crack front correction
FG = stress concentration correction
F8 = free surface correction
FW = finite width correction
K = linear elastic fracture mechanics stress intensity factor
KAS = stress intensity contribution from the applied stress
~ = stress intensity contribution from the nominal section residual
stresses
~W = stress intensity contribution from the local weld residual
stresses
-51-

~ stress intensity contribution from the web restraint
K = fracture toughness value c
= fracture toughness value from the dynamic material test
• = stress concentration factor
P = applied load
r = plastic zone size y
t = loading time to n~ximum load
t = time of load application for a static tensile test 0
T = testing temperature
tf = flange thickness
= flange crack opening, = v + vf fAS RS
vf = flange crack opening from the applied stress AS
vf flange crack opening from the residual stress ~
v web crack opening w
v = web crack opening from the applied stress wAS
v = web crack opening from the residual stress WRS
crAS = applied stress
cry = yield stress
crYd = yield stress as a function of loading rate and temperature
cr = stress range r
cr = residual stress block stress rs
-52-

. .
..
-·
•
TABLES
-53-

. '
.·
..
TABLE 1 LIST OF TEST SPECIMENS
/ Beam Numbers Detail Typysteel Type A36 A588
Lateral Att~chment B4 B6
Category E B4A B6A
Cover Plate B3* BS*
Category E B3A* BSA*
Transverse Stiffener B9 Bll
Category C B9A BJ.lA
Flange Transition BlO Bl2
Category B BlOA Bl2A
* Rolled Beams
All Others Welded
~4 Beams - Total
-54-
A514
B2
B2A
Bl
BlA
B7
B7A
-
B8
B8A
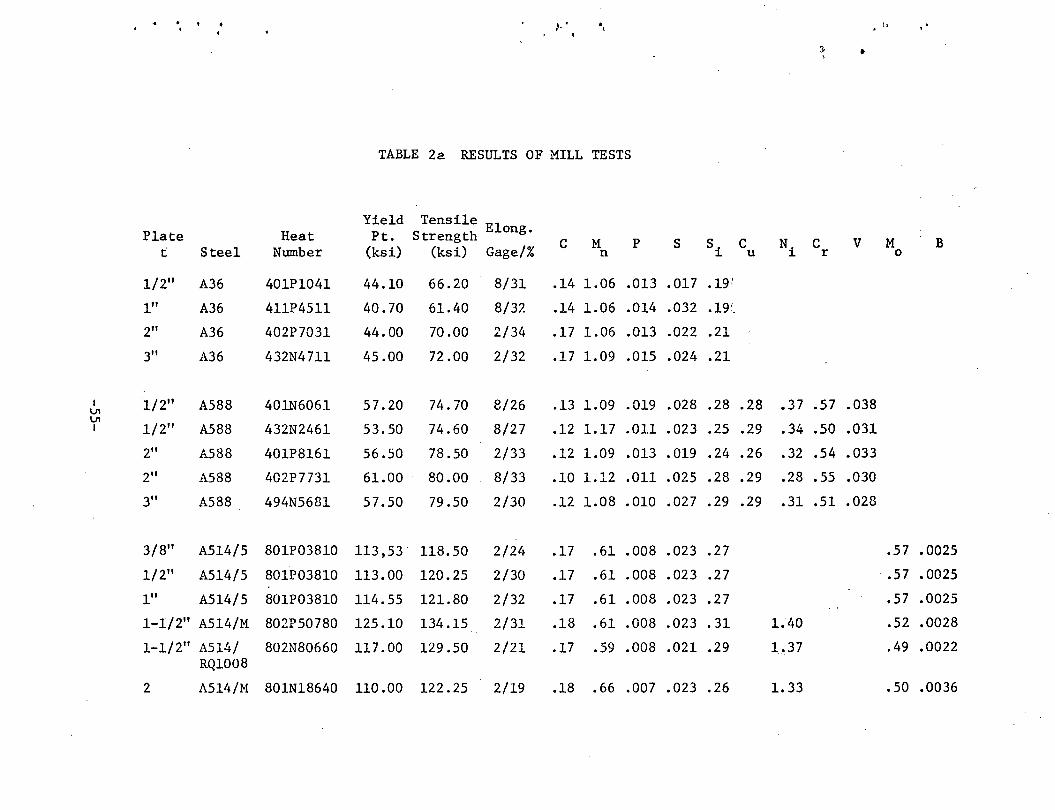
·. '
Plate Heat t Steel Number
1/2" A36 401P1041
1" A36 411P4511
2" A36 402P7031
3" A36 432N4711
I 1/2" A588 401N6061 V1 V1 I 1/2" A588 432N2461
2" A588 401P8161
2" A588 402P7731
3" A588 494N5681
3/8" A514/5 801P03810
1/2" A514/5 801P03810
1" A514/5 801P03810
1-1/2" A514/M 802P50780
1-1/2" A514/ 802N80660 RQ1008
2 A514/M 801N18640
I • .- " '
TABLE 2a RESULTS OF MILL TESTS
Yield Tensile El Pt. Strength ong. c M p
(ksi) (ksi) Gage/% n
44.10 66.20 8/31 .14 1.06 .013
40.70 61.40 8/32 .14 1.06 .014
44.00 70.00 2/34 .17 1.06 .013
45.00 72.00 2/32 .17 1.09 .015
57.20 74.70 8/26 .13 1.09 .019
53.50 74.60 8/27 .12 1.17 .011
56.50 78.50 2/33 .12 1.09 .013
61.00 80.00 8/33 .10 1..12 .011
57.50 79.50 2/30 .12 1.08 .010
113,53 118.50 2/2l• .17 .61 .008
113.00 120.25 2/30 .17 .61 .008
114.55 121.80 2/32 .17 .61 .008
125.10 134.15 2/31 .18 .61 .008
117.00 129.50 2/21 .17 .59 .008
110.00 122.25 2/19 .18 .66 .007
,,
:;, . I
s si c Ni c v M B u r 0
.017 .191
.032 .191_
.022 .21
.024 .21
.028 .28 .28 .37 .57 .038
.023 .25 .29 .34 .50 .031
.019 .24 .26 .32 .54 .033
.025 .28 .29 .28 .55 .030
.027 .29 .29 .31 .51 .028
.023 .27 .57 .0025
.023 .27 .• 57 .0025
.023 .27 .57 .0025
.023 .31 1.40 .52 .0028
.021 .29 1.37 .49 .0022
.023 .26 1. 33 .50 .0036
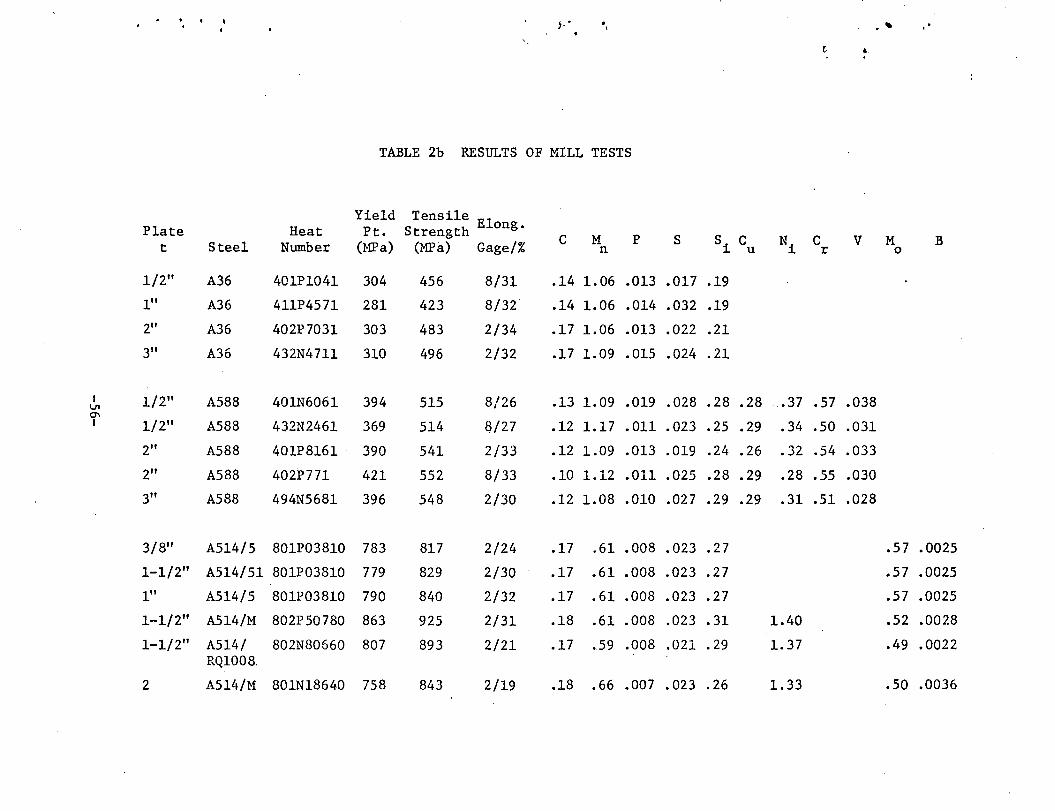
I \Jl 0\ I
. . •
Plate t
1/2"
1"
2"
3"
1/2"
1/2"
2"
2"
3"
3/8"
1-1/2"
1"
1-1/2"
1-1/2"
2
Heat Steel Number
A36 401Pl041
A36 411P4571
A36 402P7031
A36 432N4711
A588 401N6061
A588 432N2461
A588 401P8161 ·
A588 402P771
A588 494N5681
A514/5 801P03810
A514/51 801P03810
A514/5 801P03810
A514/M 802P 50780
A514/ 802N80660 RQ1008.
A514/M 801Nl8640
• I
TABLE 2b RESULTS OF MILL TESTS
Yield Tensile El Pt. Strength ong.
c M p (MPa) (MPa) Gage/% n
304 456 8/31 .14 1. 06 .013
281 423 8/32 .14 1.06 .014
303 483 2/34 .17 1.06 .013
310 496 2/32 .17 1.09 .015
394 515 8/26 .13 1.09 .019
369 514 8/27 .12 1.17 .011
390 541 2/33 .12 1.09 .013
421 552 8/33 .10 1.12 .011
396 548 2/30 .12 1.08 .010
783 817 2/24 .17 .61 .008
779 829 2/30 .17 .61 .008
790 840 2/32 .17 .61 .008
863 925 2/31 .18 . 61 .008
807 893 2/21 .17 .59 .008
758 843 2/19 .13 .66 .007
s si cu Ni c v M B r 0
.017 .19
.032 .19
.022 .21
.024 .21
.028 .28 .28 .• 37 .57 .038
.023 .25 .29 .34 .50 .031
.019 .24 .26 .32 .54 .033
.025 .28 • 29 .28 .55 .030
.027 .29 .29 .31 .51 .028
.023 .27 .57 .0025
.023 .27 .57 .0025
.023 .27 .57 .0025
.023 .31 1.40 .52 .0028
.021 .29 1.37 .49 .0022
• 023 .26 1.33 .so .0036
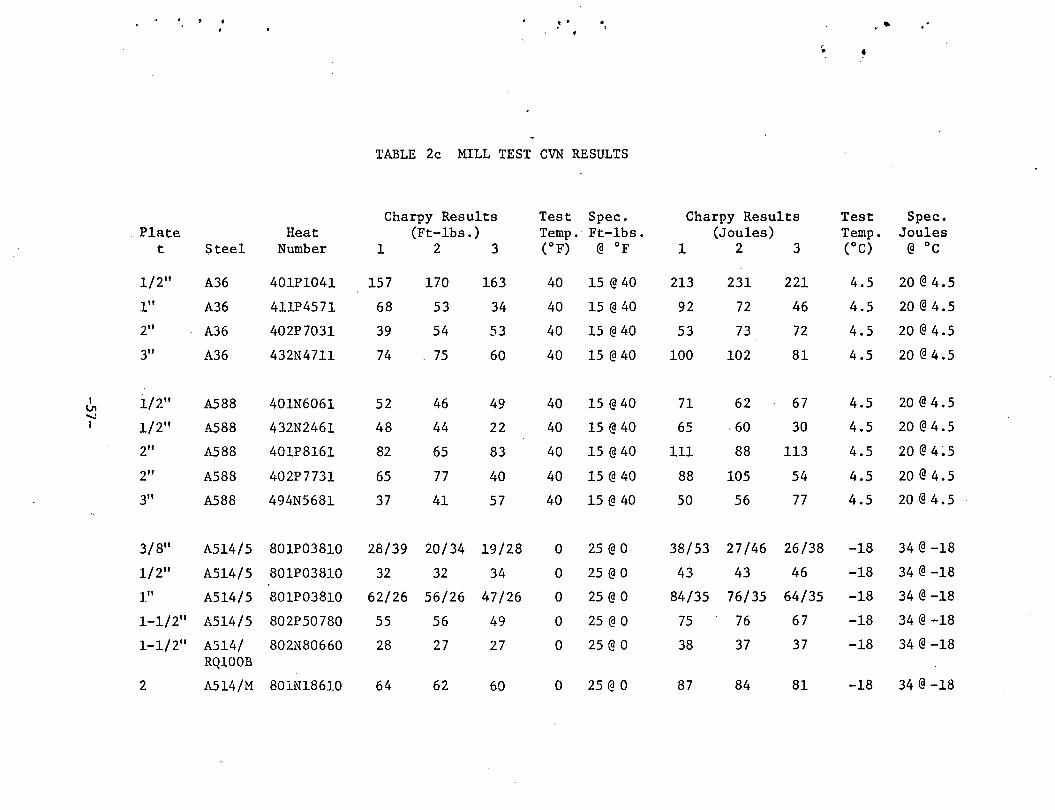
. '
. Plate Heat t Steel Number
1/2" A36 401Pl041
1" A36 411P4571
2" A36 402P7031
3" A36 432N4711
I 1/2" A588 401N6061 V1 -....! I 1/2" A588 432N2461
2" A588 401P8161
2" A588 402P7731
3" A588 494N5681
3/8" A514/5 801P03810
1/2" A514/5 801P03810
1" A514/5 801P03810
1-1/2" A514/5 802P50780
1-1/2" A514/ 802N80660 RQ100B
2 A514/M 801N18610
. '
TABLE 2c MILL TEST CVN RESULTS
Charpy Results Test Spec. (Ft-lbs.) Temp.· Ft-lbs.
1 2 3 (oF) @ OF
157 170 163 40 15@ 40
68 53 34 40 15@ 40
39 54 53 40 15@ 40
74 75 60 40 15@ 40
52 46 49 40 15@ 40
48 44 22 40 15@ 40
82 65 83 40 15@ 40
65 77 40 40 15@ 40
37 41 57 40 15@ 40
28/39 20/34 19/28 0 25@ 0
32 32 34 0 25@ 0
62/26 56/26 47/26 0 25@ 0
55 56 49 ·0 25@ 0
28 27 27 0 25@ 0
64 62 60 0 25@ 0
Charpy Results Test Spec. (Joules) Temp. Joules
1 2 3 (oC) @ oc
213 231 221 4.5 20@ 4.5
92 72 46 4.5 20@ 4.5
53 73 72 4.5 20@ 4.5
100 102 81 4.5 20@ 4.5
71 62 67 4.5 20@ 4.5
65 60 30 4.5 20@ 4.5
111 88 113 4.5 20 @ 4 ~ 5
88 105 54 4.5 20@ 4.5
50 56 77 4.5 20@ 4.5
38/53 27/46 26/38 -18 34@ -18
43 43 46 -18 34@ -18
84/35 76/35 64/35 -18 34@ -18
75 76 67 -18 34@ -18
38 37 37 -18 34@ -18
87 84 81 -18 34@ -18
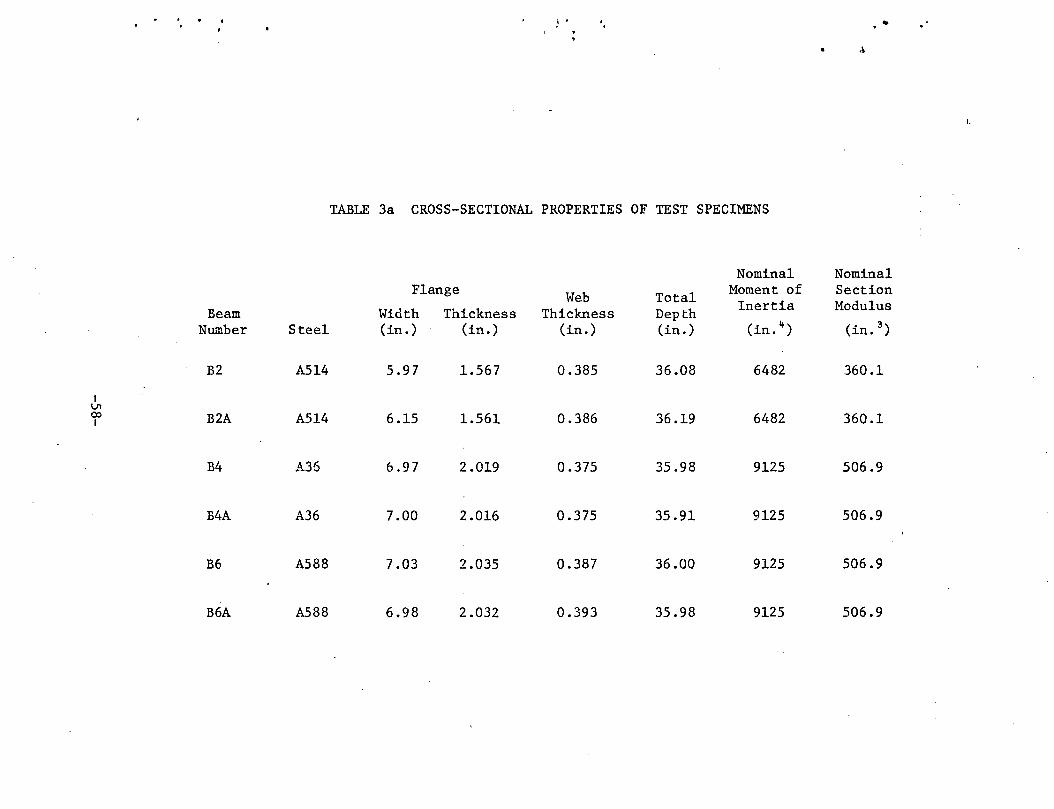
I Vl (X)
I
. .
Beam Number Steel
B2 A514
B2A A514
B4 A36
B4A A36
B6 A588
B6A A588
) . ..
'-
TABLE 3a CROSS-SECTIONAL PROPERTIES OF TEST SPECIMENS
Nominal Nominal Flange Web Total Moment of Section
Width Thickness Thickness Depth Inertia Modulus
(in.) (in.) (in.) (in.) (in. 4 ) (in. 3 )
5.97 1.567 0.385 36.08 6482 360.1
6.15 1.561 0.386 36.19 6482 360.1
6.97 2.019 0.375 35.98 9125 506.9
7.00 2.016 0.375 35.91 9125 506.9
7.03 2.035 0.387 36.00 9125 506.9
6.98 2.032 0.393 35.98 9125 506.9
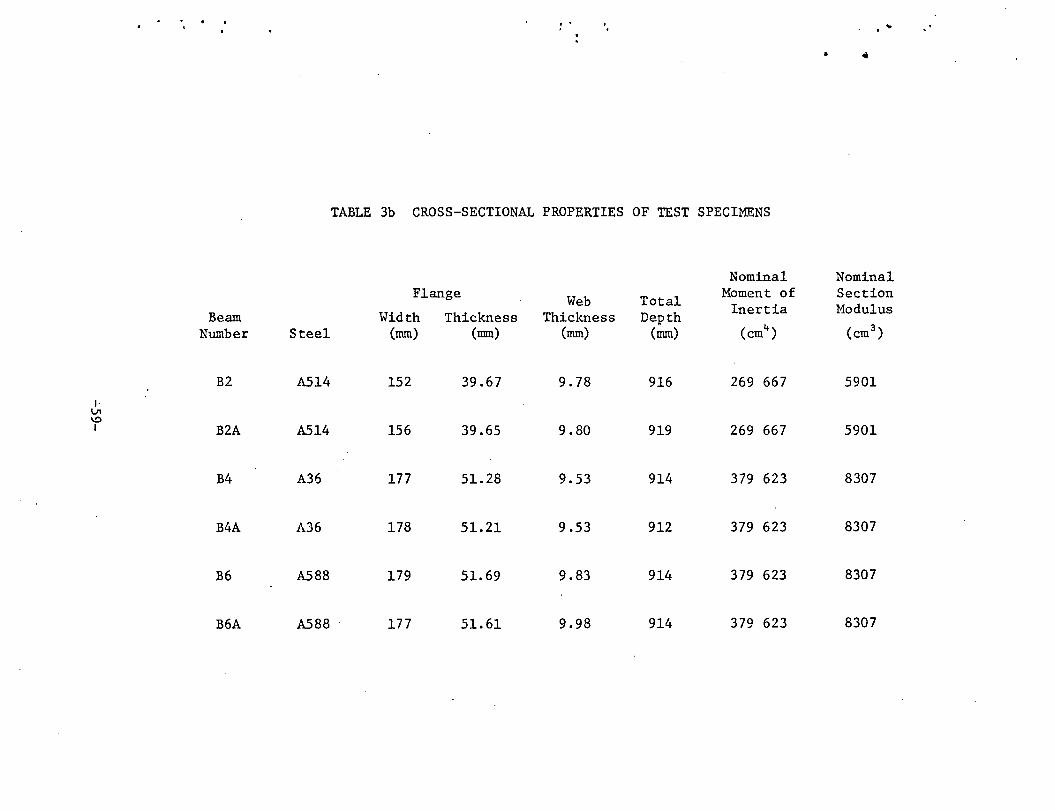
I· VI \!)
I
. . I
Beam Nuniber
B2
B2A
B4
B4A
B6
B6A
Steel
A514
A514
A36
A36
A588
A588
I'
. ..
TABLE 3b CROSS-SECTIONAL PROPERTIES OF TEST SPECIMENS
Nominal Nominal Flange Web Total Moment of Section
Width Thickness Thickness Depth Inertia Modulus
(mm) (mm) (mm) (mm) (cm4) (cm 3
)
152 39.67 9.78 916 269 667 5901
156 39.65 9. 80 919 269 667 5901
177 51.28 9.53 914 379 623 8307
178 51.21 9.53 912 379 623 8307
179 51.69 9.83 914 379 623 8307
177 51.61 9.98 914 379 623 8307
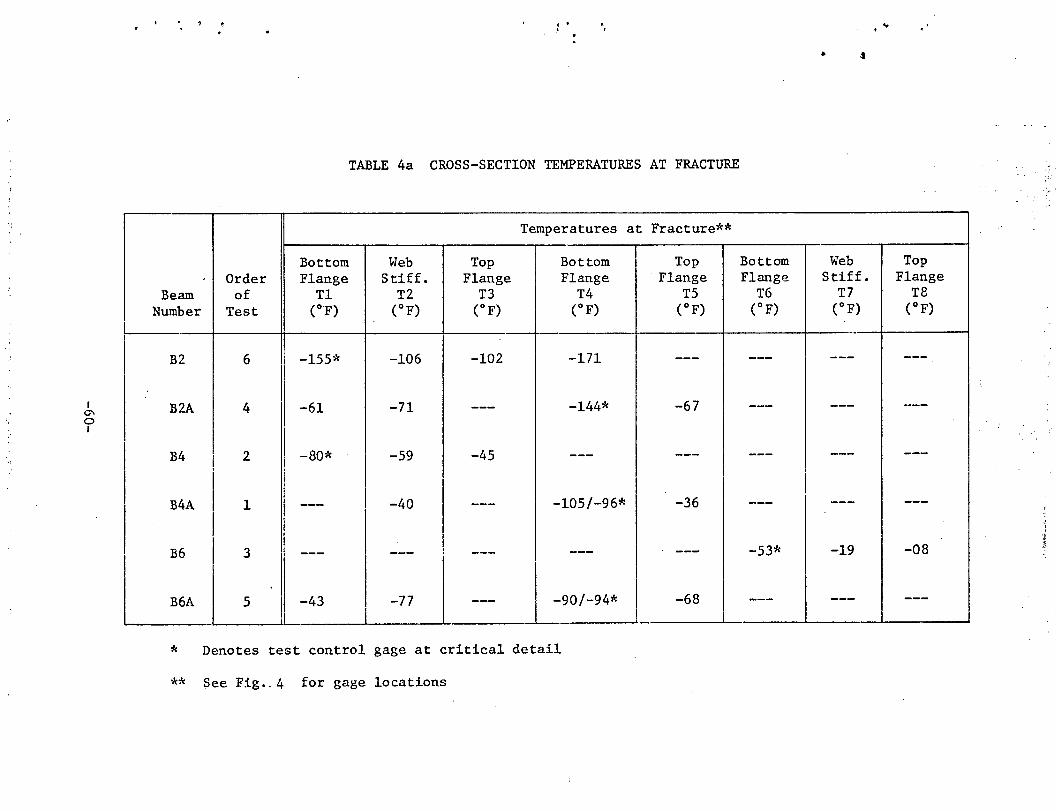
I 0'\ 0 I
Order Beam of
Number Test
:.
TABLE 4a CROSS-SECTION TEMPERATURES AT FRACTURE
Bottom Flange
Tl CF)
Web Stiff.
T2 (oF)
Top Flange
T3 (oF)
Temperatures at Fracture**
Bottom Flange
T4 (oF)
Top Flange
T5 (oF)
Bottom Flange
T6 (oF)
•
Web Stiff.
T7 (oF)
..
Top Flange
T8 (oF)
~~ ----B2---+---6--~~_-1_5_5_* __ ~--_-l_o_6 __ +-____ l_o_z __ ~---_-1_7_1-----~---_-_-_--+---_-_-_---+------~--4---_-__ ----~
II B2A 4 -61 -71 -144* -67
B4 2 -80* -59 -45
1 -40 -105/-96* I B4A I I B6 I 3 I --- --- ! ---
l;L_j..__-4_3 --L-----77. j_-_--_.-!--.I -90/-94·
-36
-68
-53*
I
-19 -08
* Denotes test control gage at critical detail
** See Fig •. 4 for gage locations
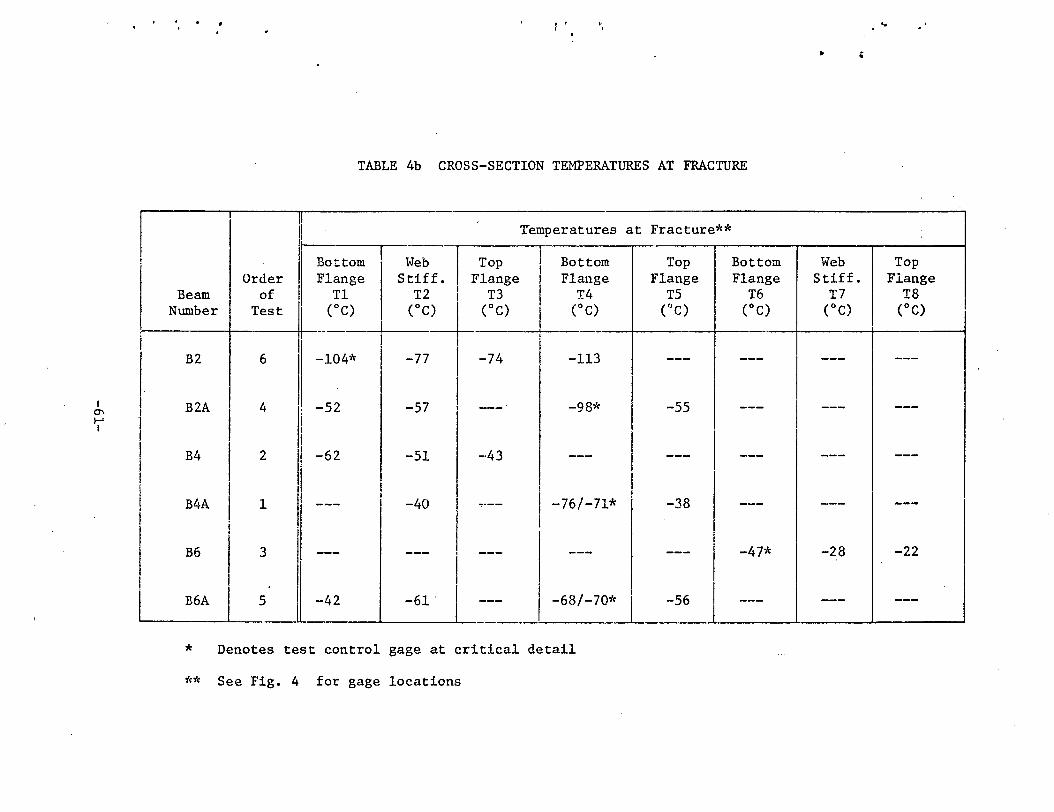
I 0\ I-' I
. ' . . .
TABLE 4b CROSS-SECTION TEMPERATURES AT FRACTURE
I Temperatures at Fracture** I I I -
I Bottom Web Top Bottom Top Bottom Order Flange Stiff. Flange Flange Flange Flange
Beam of I Tl T2 T3 T4 T5 T6 Number ~--(oC) I (°C) CCC) (°C) CJC) (oC)
l -i I' I I B2 6 1 -104* -77 -74 -113 --- ---
i I I B2A 4 -52 -57 --- -98* -55 ---I I
I I I B4 2
II -62 -51 -·43 --- I --- ---
I
l I I
I II I I -76/-71* B4A 1 --- I -40 I -38 ---I
I I i .
B6 3 I --- --- --- --- --- -47*
l ~6A I sJ -42 -61 I ---I
-68/-70* I -56 ---__ L_ 1 * Denotes test control gage at critical detail
** See Fig. 4 for gage locations
.. .. '
Web Top Stiff. Flange
T7 T8 (°C)
~~:~ ---
--- ---
--- ---
--- ---
-28 -22
--- ---
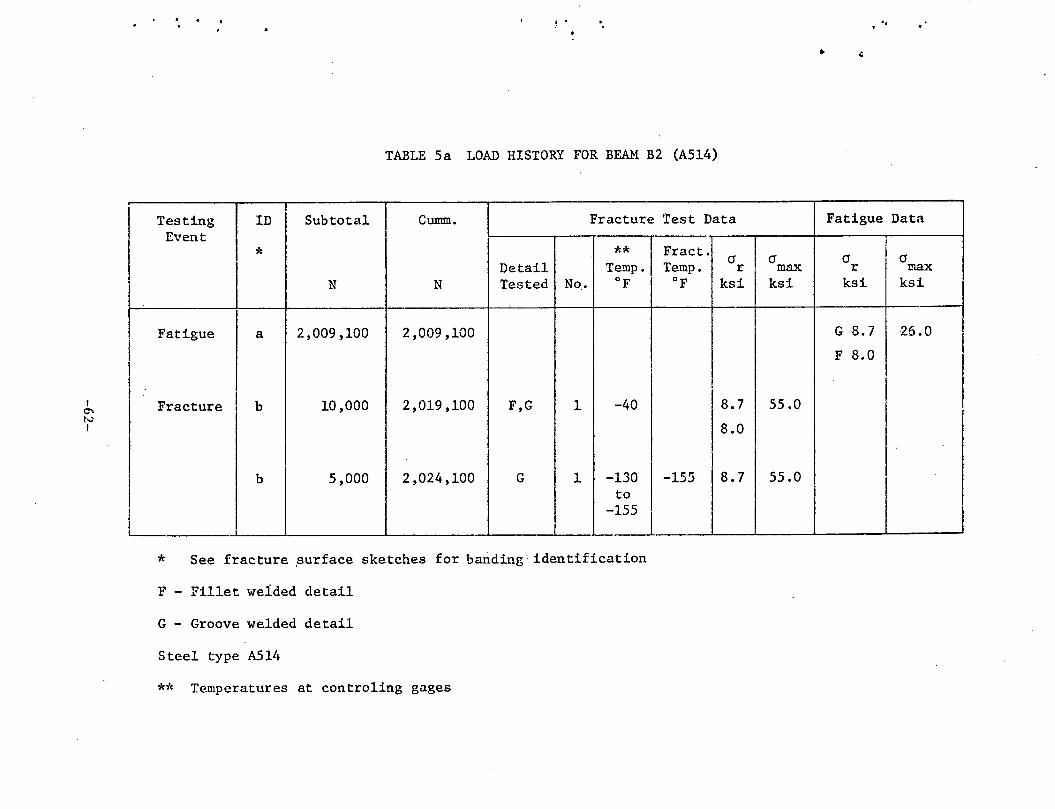
I C\ N I
I
I i
I I I
I
I l
I
' . . .
TABLE 5a LOAD HISTORY FOR BEAM B2 (A514)
Testing ID Subtotal Cunnn. Fracture 'test Data Event
* ** Fract. Detail Temp. Temp. a
r N N Tested No. OF OF ksi
Fatigue a 2,009 '100 2,009,100
!
Fracture I b 10,000 2,019,100 F,G 1 -40 8.7
8.0
I b 5,000 2,024,100 G 1 -130 -155 18.7
to -155
* See fracture surface sketches for bandingidentification
F - Fillet welded detail
G - Groove welded detail
Steel type A514
*,'f Temperatures at controling gages
.. . '
Fatigue Data
a a a max r max
ksi ksi ksi
G 8.7 26.0
F 8.0
55.0
55.0

I 0\ w I
I
i I
I I i I
I L
' . ' . I . ..
TABLE 5b LOAD HISTORY FOR BEAM B2 (A514)
Testing ID Subtotal Cunnn. Fracture Test Data Event
* ** Fract. Detail Temp. Temp.
(J r
I ... T ... ~ Tested No . oc oc MPa u I 1~
Fatigue a 2,009,100 2,009,100
Fracture I b 10,000 2,019,100 F,G 1 -40 60
I 55
b 5,000 2,024,100 G 1 I
-90 -104
I 60
to -104 I
* See fracture surface sketches for banding identification
F - Fillet welded detail
G - Groove welded detail
Steel type A514
** Temperatures at controling gages
. . •
Fatigue Data
(J (J (J max r max
MPa MPa MPa
G 60 179
F 55
379
I I I 379
I I
I . I I
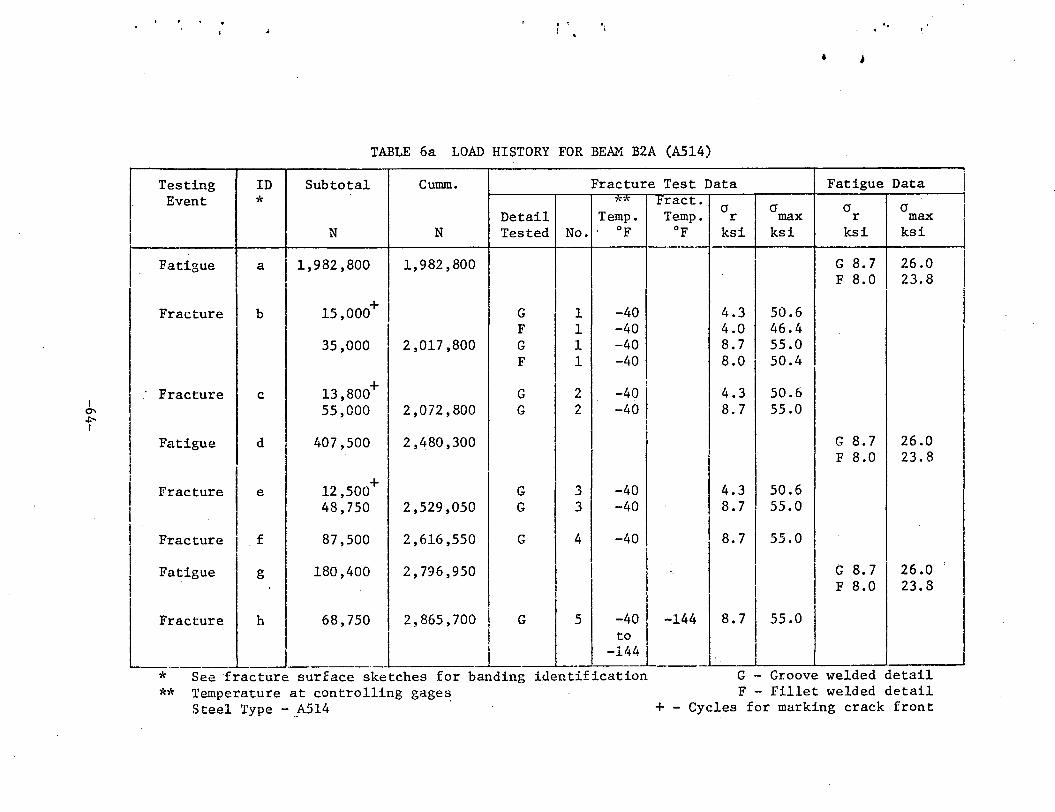
I 0'1 J:--1
•• .,
• J
TABLE 6a LOAD HISTORY FOR BEAM B2A (A514)
Testing ID Subtotal Cumm. Fracture Test Data Fatigue Data Event * *"/( Fract.
(J (J (J (J Detail Temp. Temp. r max r max
I N N Tested No. OF OF ksi ksi ksi ksi
I Fatigue a I 1,982,800 1, 982 '800 G 8.7 26.0 I F 8.0 I 23.8
I I I Fracture b 15,000+ I G 1 -40 4.3 50.6
I F 1 -40 4.0 46.4 35,000 2,017,800 G 1 -40 8.7 55.0
F 1 -40 8.0 50.4
13,800+ I
: Fracture c G 2 -40 I 4.3 50.6
I 55,000 2,072,800 G 2 -40 8.7 55.0
I I
Fatigue d ' 407,500 2,480,300 I G 8.7 26.0 F 8.0 23.8
I
12,500+ I Fracture e G 3 -40 4.3 50.6
' 48,750 2,529,050 G 3 -40 8.7 55.0 I
I Fracture I f 87,500 2,616,550 G 4 -40 8.7 55.0
I Fatigue g 180,400 2,796,950 I I G 8.7 26.0
F 8.0 23.8 I lracture -40 I h 68,750 2,865,700 G 5 -144 8.7 55.0
I tod -144 -
* **
See fracture surface sketches for banding identification Temperature at controlling gages Steel Type - A514 ·
G - Groove welded detail F - Fillet welded detail
+ - Cycles for marking crack front
I 1 I
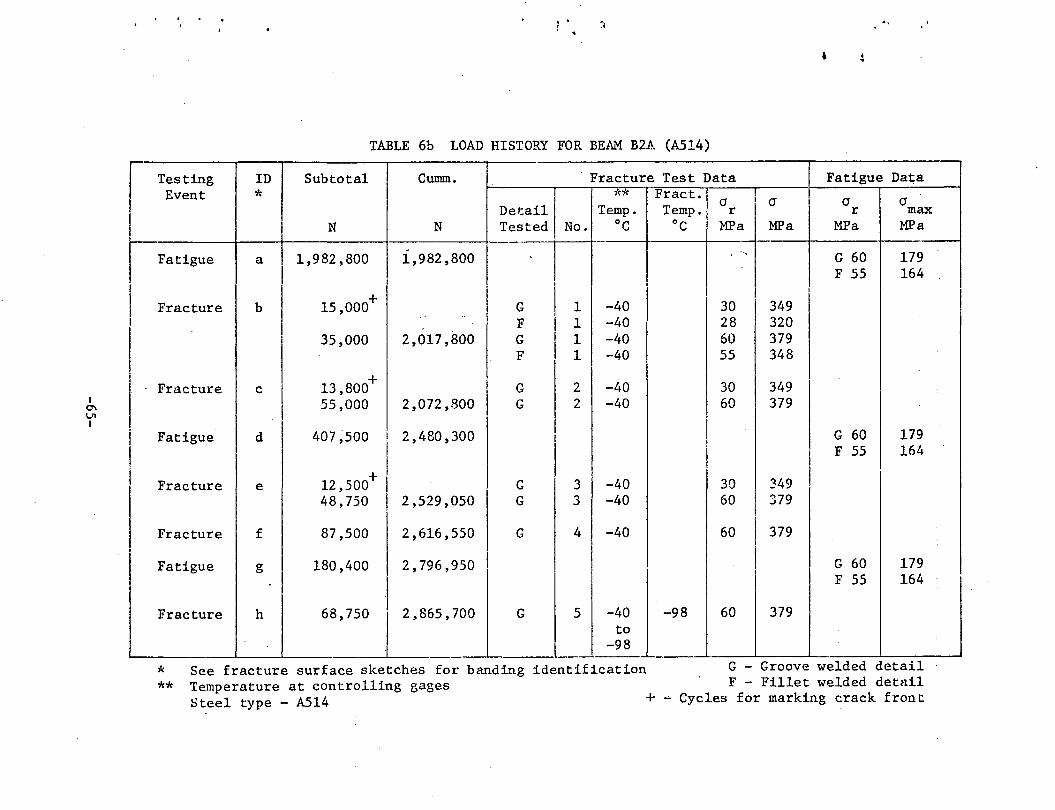
I 0\ VI I
~. .,
TABLE 6b LOAD HISTORY FOR BEAM B2A (A514)
r Testing ID Subtotal Cumm. Fracture Test Data .I Fatigue Data Event * ** Fract. [ (J (J (J (J
Detail Temp. Temp. r r max
~gue N N Tested No. oc oc MPa MPa MPa MPa
1,982,800 1,982,800 n ..
' G 60 179 a I
F 55 164 I I
I 15,000+ I I I
Fracture b G 1 -40 30 I 349 I F 1 -40 28 320
35,000 2,017,800 G 1 -40 60 379 F 1 -40 55 348
· Fracture c 13 ,800+ G 2 -40 30 349 55,000 2,072,800 G 2 -40 60 379
I Fatigue d 407~500 I 2,480,300 I G 60 179
I I
I F 55 '164 I I I I I
I Fracture e 12,500+ I G 3 -40 30 349 48,750 2,529,050 G 3 -40 60 379
I
Fracture f 87,500 2,616,550 G 4 -40 60 I 379
Fatigue 180,400 2,796,950 I I G 60 179 g I
I F 55 164
Fracture h 68,750 2,865,700 5 -40
j G -98 60 I 379
to -98
* See fracture surface sketches for banding identification G - Groove welded detail ** Temperature at controlling gages F - Fillet welded detail
Steel type - A514 + - Cycles for marking crack front
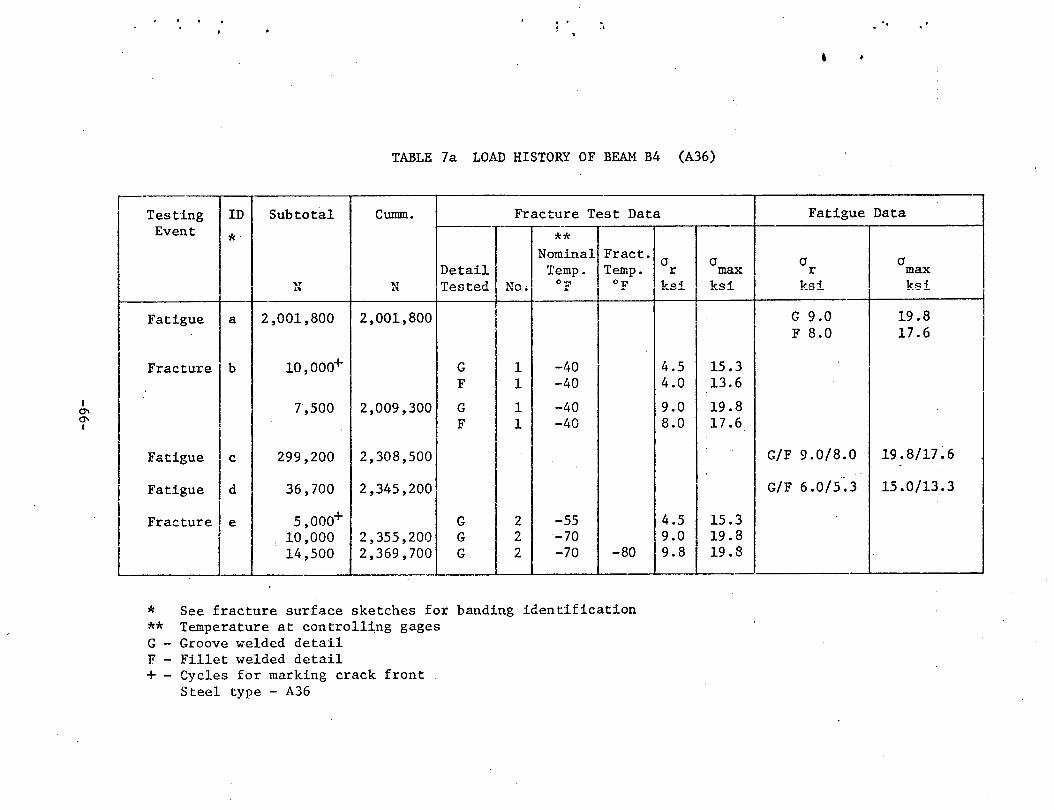
I
"' "' I
,-
1 •
TABLE 7a LOAD HISTORY OF BEAM B4 (A36)
Testing Event
ID
*
Fatigue a
I Fracture b
Subtotal
2,001,800
1o,ooo+
7,500
Cumm.
N
2,001,800
G -40 F -40
2,009,300 G -40 F -40
* See fracture surface sketches for banding identification ** Temperature at controlling gages G - Groove welded detail F - Fillet welded detail + - Cycles for marking crack front
Steel type - A36
4.5 4.0
9.0 8.0
~ I:~
15.3 13.6
19.8 17.6
..
Fatigue Data
(J r
ksi
(J max ksi
---~----------~ G 9.0 F 8.0
G/F 9.0/8.0
G/F 6.0/5.3
19.8 17.6
19.8/17~6
15.0/13.3
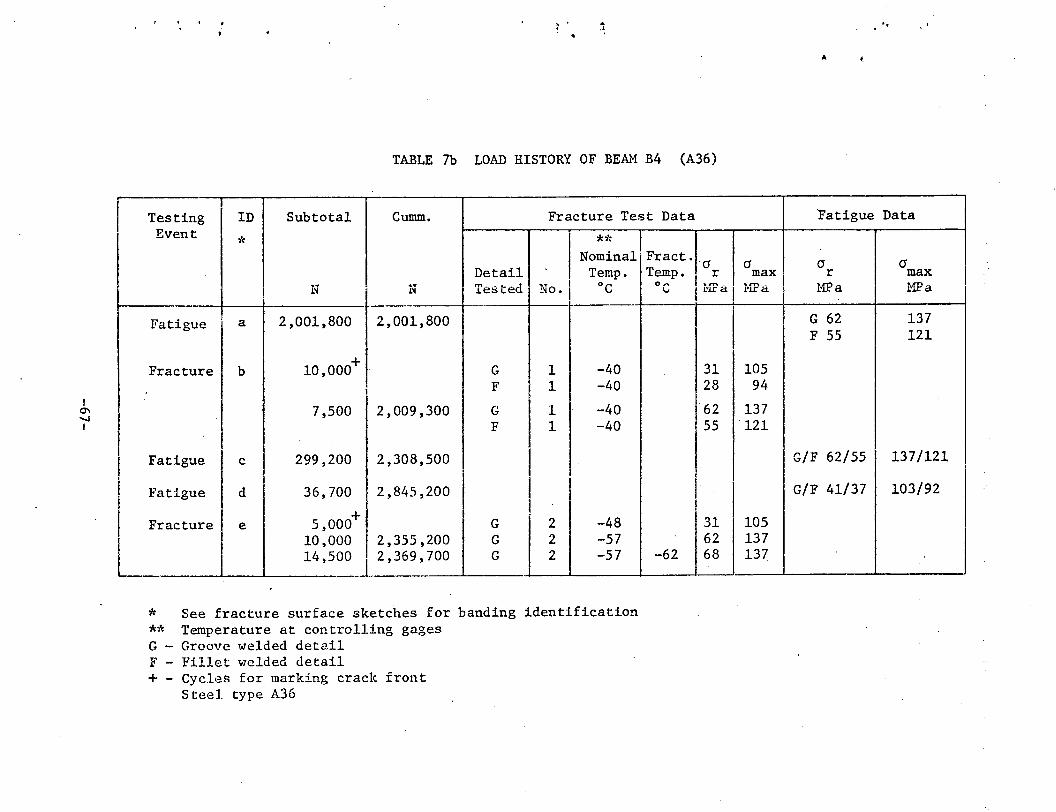
I 0\ -...I I
Testing ID Subtotal Event
*
. I I~
Fatigue a 2,001,800
Fracture b 10,000+
7,500
I Fatigue 299,200 I c .
I Fatigue d 36,700
Fracture e 5,000+
. ·'
TABLE 7b LOAD HISTORY OF BEAM B4 (A36)
Cumm. Fracture Test Data
** I Detail
Nominal,Fract. a Temp. Temp. I r
1-i Tested """- I ~'lo. I
"c ~~>~a~ 2,001,800
G 1 -40 31 F 1 -40 28
2,009,300 G 1 -40 62 F 1 -40 55
2,308,500 I I
2,845,200 I ! I G 2 -48 31
L 10,000 2,355,200 G 2 -57 62 14,500 2,369,700 G 2 -57 -62 68
-
* See fracture surface sketches for banding identification ** Temperature at controlling gages G - Groove welded detail F - Fillet welded detail + - Cycles for marking crack front
Steel type A36
..
Fatigue Data
a a a I max r max
PIP a ,,.. - HPa l'LI:' i:1
G 62 137 F 55 121
105 94
137 121
G/F 62/55 137/121 I
G/F 41/37 103/92
105 137 137

I 0\ co I
' . ~
TABLE 8a LOAD HISTORY OF BEAM B4A (A36)
Testing I h
Event
Fatigue
I ID I*
a Fracture a
Fatigue I a Fracture a
I Fatigue a Fracture b
.Fatigue c ·Fracture d
Fatigue e Fracture f
Fatigue g Fractute I g
Fatigue I g Fracture 1 h
Fatigue i
I
I
I
I
Subtotal Cumm.
I Detail N N Tested
1,500,000 1,500,000 7,5oo+ F 7,500 1,507,500 F
~~n nnn 1 ~~~ ~nn LJV,VVV IJ.,JJJ,JVV I
7,5oo+l 1 F 7,500 1,765,000 F
250,000 2,015,000 7,5oo+ G 7,500 2,022,500 G
250,000 2,272,500 7,5oo+ G 7,500 2,280,000 G
250,000 2,530,000 7,5oo+ G
18,750 2,548,750 I G 352,000 2,900,750
7,5oo+ F 7,500 2,908,250 1 F
67,900 2,976,150 7,soo+ G 7,500 2,983,650 G 5,000 2,988,650 G
27 ,sao+ G 243,100 3,231,750
8,7oo+
Frac-tur±J---~~~~~~ _ 3,236,750 G --~,276.!.?50 G L_ __
No.
I 1
I 1
I 2 2
I 3 ~
4 4
5 5
6 6
7 7 7 7
8 8
* See fracture surface sketches for band in g ** Temperature at controlling gages
Steel type - A36
Fracture Test Data Fatigue Data
** Fract. s a s a Temp. Temp.
OF OF
-40 -40
I I I
-~0 -40
I I -40
-40 I
-40 -40
-60 -60
/
-40 -40
I -'•O -40 1 -120 to -170
-170 to -100
-70 -70 to -96 -96
iden ti-ficatiou
r max r max
ksi ksi ksi ksi __ G/F 9.0/8.0 1.98/17.6
4.0 113.6 8.0 17.6
~I~ n n/n n 1 n n /~-, , I b/ ~ ":JoV/OoU J.":JoO/J./oO
4.0 13.6 8.0 17.6
G/F 9.0/8.0 19.8/17.6 4.5 15.3 9.0 19.8
G/F 9.0/8.0 19.8/17.6 4.5 15.3 9.0 19.8
G/F 9.0/8.0 19.8/17.6 4.5 15.3 9.0 19.8
4.0 13.6 G/F 9.0/8.0 119.8/17.6
8.0 17.6 I G/F 9.0/8.0 19.8/17.6
4.5 I 15.3 9.0 19.8 4.5 15.3 9.0 19.8
G/F 9.0/8.0 19.8/1~ G/F 4.5/4.0 15.3/13.6 4.5 15.3 9.0 19.8
G - Groove welded deta F - Fillet welded detail
+ - Cycles for marking crack front
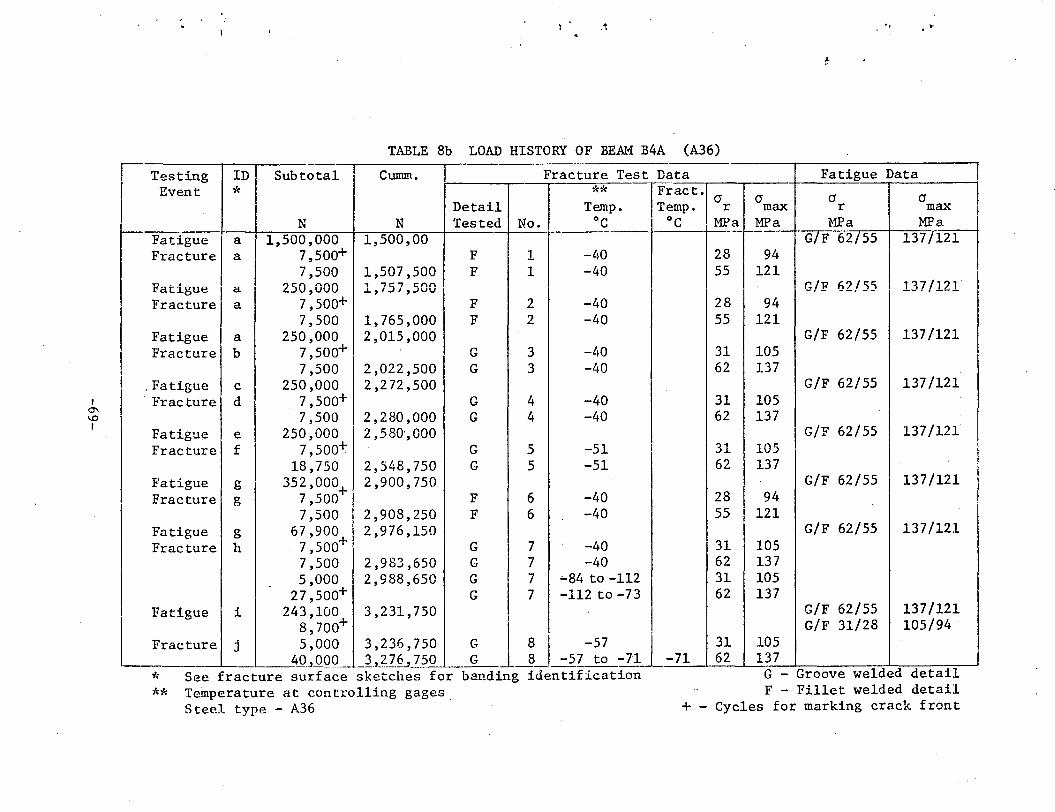
.,
TABLE 8b LOAD HISTORY OF BEAM B4A (A36)
~Testing ID Subtotal Cumm. Fracture Test Data Fatigue Data Event * I ** ~act.
I Detail Temp (J (J (J (J . emp. r max r max
N N Tested No. I oc
r-MPa MPa HPa
~j r Fatigue 1,500,000 1,500,00 -.--- 1--- ·GTF-62755 137/121 a Fracture a 7,5oo+ F 1 -40 28 94
7,500 1,507,500 F 1 -40 55 121 I Fatigue 250,000 1 '75 7,500 G/F 62/55 137/121 a
Fracture a 7,5oo+ F 2 -40 28 94 7,500 1,765,000 F 2 -40 55 121
Fatigue a 250,000 2,015,000 G/F 62/55 137/121 Fracture b 7,5oo+
2 ,o22 ,5oo 1
G 3 -40 31 105 7,500 G 3 -40 62 137
. Fatigue c 250,000 2,2 72,500 G/F 62/55 137/121 I · Fracture I d 7,5oo+ G 4 -40 31 105
0"1 1.0 7,500 2,280,000 G 4 -40 62 137 I
250,000 2 ,580·,000 G/F 62/55 137/121 Fatigue e Fracture f 7,soo+ G 5 -51 ' 31 105
18,750 2,548,750 G 5 -51 62 137 Fatigue g 352,000+ 2,900,750
I G/F 62/55 137/121
Fracture g 7,500 F 6 -40 28 94 7,500 2,908,250 F 6 -40 55 121
Fatigue g 67,900 2,976,150 G/F 62/55 137/121 Fracture h 7,500+ G 7 -40 31 105
7,500 2,983,650 G 7 -40 62 137 5,000 2,988,650 G 7 --84 to-112 31 105
27,5oo+ G 7 -112 to -73 62 137 Fatigue 1 243,100 3,231,750 G/F 62/55 137/121
~racture 8,7oo+ G/F 31/28 105/94 j 5,000 3,236,750 clJ -57 31 105
_ 40_,.QOO_ _l,_?_Z§_, 750 G 8 -57 to -71 -71 62 137 j
* See fracture surface sketches for banding identification G - Groove welded detail
** Temperature at controlling gages. F - Fillet welded detail Steel type - A36 +- Cycles for marking crack front

I ""-.~
0 I
I Testing I ID. Event
*
,--Fatigue a
Fracture b
I
Fatigue c I I Fracture d
I I I I
Fracture I e
' '
TABLE 9a LOAD HISTORY OF BEAM B6 (A588)
Subtotal Cumm.
Detail N N Tested
1,999,800 I 1,999,800 I I
5,000+ G F
7,500 2,007,300 G F
797,400 2,804,700
18,750+ F I 75,000 2,879,700 I F I
I I
F
Fracture Test Data
No.
I 1 1 1 1
I
2 I
2
3
** Temp.
OF
----
--
30 30 40 40
40 40
-4
Fract. Temp.
OF
I
a r ksi
4.5 4.0 9.0 8.0
4.0 8.0
I
a max ksi
23.0 20.4. 27.5 24.4
20.4 24.lf
..
Fatigue
a r ksi
G 9.0 F 8 0
G 9.0 F 8.0
Data
a max ksi
27.5 24 4
27 .5x 24.4
I
7,500 I I 75,000 2,954,700 F 3 -4 1 -~' o 4.0 20.4
~----------~---~----~-------~~----~ _ _j__ __ o~·----5_3 __ L_s __ ._o_L_2 __ 4_._7Y~------~------~ * See fracture surface sketches for banding identification ** Temperature at controlling gages G - Groove welded detail F - Fillet welded detail + - Cycles ·for marking crack front x- Static jack dropped load maximum stress changed from 27.5 to :::23 for 400,000 cycles of load y - Static jack increased load
Steel type - A588
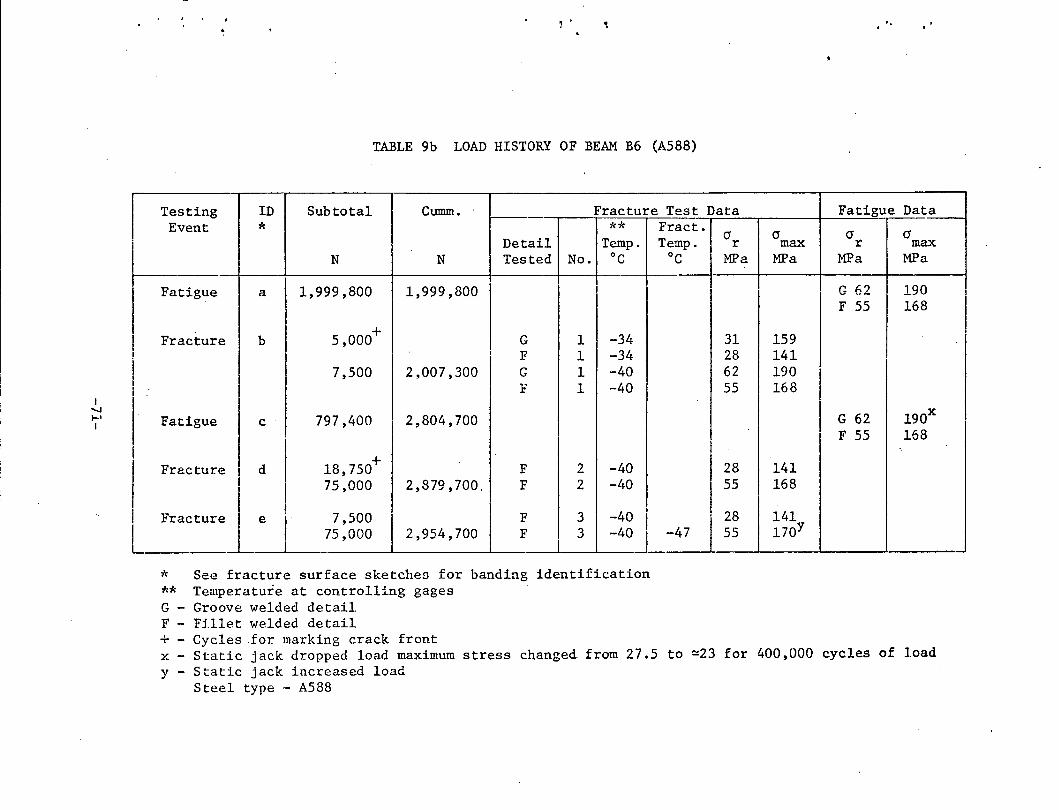
I "'-1 1-' I
I I
I
I ' I i
I
I
L
' .
TABLE 9b LOAD HISTORY OF BEAM B6 (A588)
Testing ID Subtotal Cumm. 1-·
Fracture Test Data Event * ** Fract.
Detail Temp. Temp. N N Tested No. oc oc
-
Fatigue a 1,999,800 1,999,800
Fracture b I 5,000+ G 1 -34 I F 1 -34
7,500 2,007,300 G 1 -40 F 1 -40
Fatigue c 797,400 2,804,700
Fracture l d 18,750+ F 2 -40
I 75,000 2,879,700. F 2 -40
Fracture 7,500 F 3 -40 e
I I I I 75,000 2,954,700 F 3 -40j_-47
I * See fracture surface sketches for banding identification ** Temperature at controlling gages G - Groove welded detail F - Fillet welded detail + - Cycles for marking crack front
cr r MPa
31 28 62 55
I
I 28
I 55
• 28
I 55
'•
Fatigue Data
cr cr cr max r max MPa MPa MPa
G 62 190 F 55 168
159 I 141
190 168
I G 62 190x F 55 168
141 168
141 170y
x- Static jack dropped load maximum stress changed. from 27.5 to ~23 for 400,000 cycles of load y - Static jack increased load
Steel type - A588
I
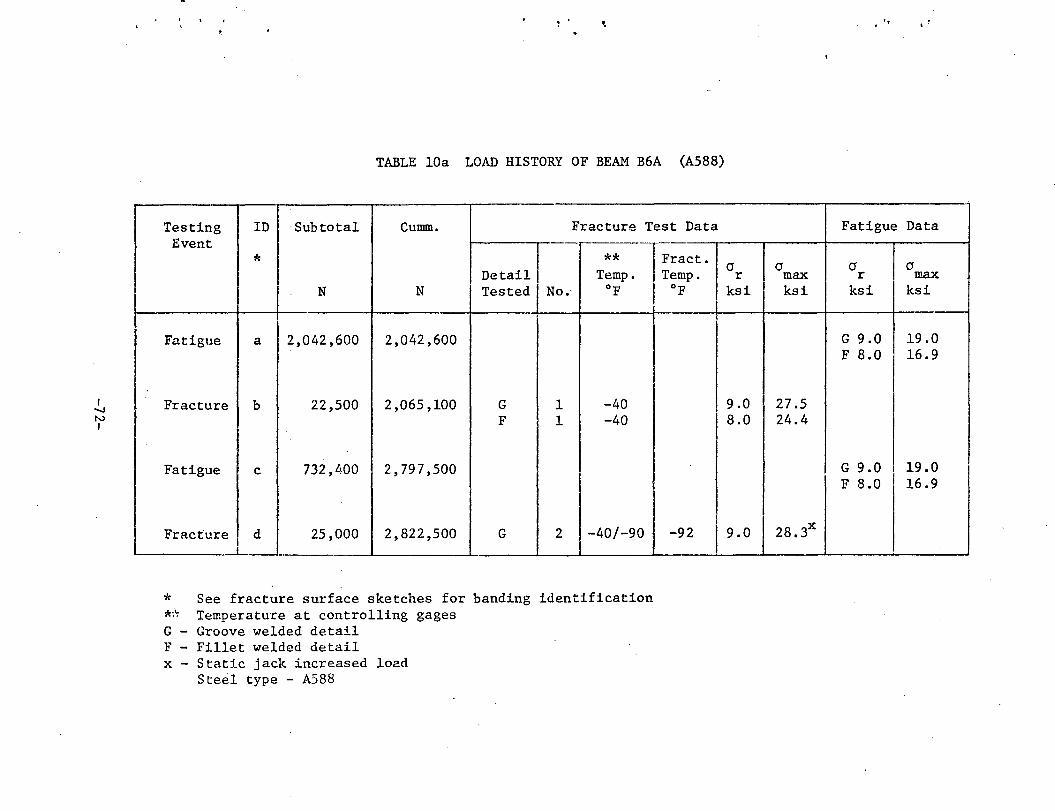
I -...J N I
: '
TABLE lOa LOAD HISTORY OF BEAM B6A (A588)
Testing ID Subtotal Cunnn. Fracture Test Data Event
* ~ ** l Fract. Detail Temp. Temp.
N N Tested No. OF I OF
Fatigue a 2,042,600 2,042,600
Fracture b 22,500 2,065,100 G 1 -40 F 1 -40
Fatigue c 732,400 2,797,500
FracturlJ I
25,000 2,822,500 G 2 -40/-90 -92
* See fracture surface sketches for banding identification *·'- Temperature at controlling gages G - Groove welded detail F - Fillet welded detail x - Static jack increased load
Steel type - A588
I
., . '
F::igui :: I cr cr r max ksi ksi ksi ksi
G 9.0 19.0 F 8.0 16.9
9.0 27.5 8.0 24.4
I G 9.0 I 19.0 F 8.0 16.9
9.0 28.3x
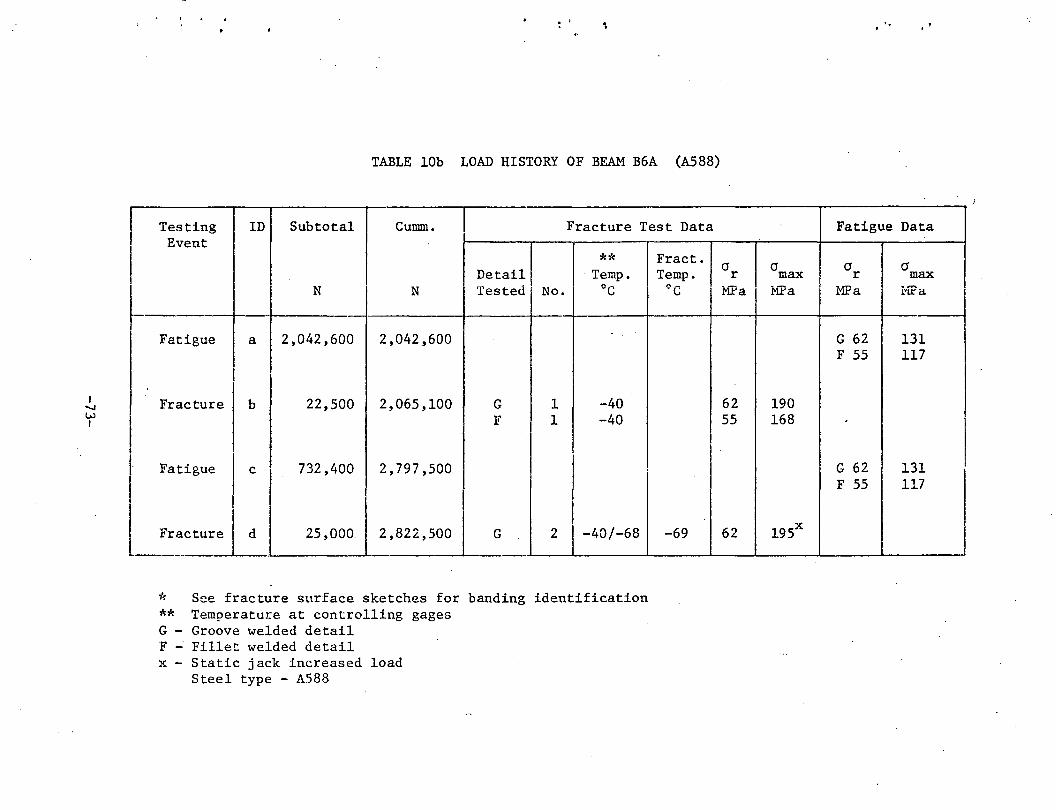
I -...J w I
I I
I I I I I I
TABLE lOb LOAD HISTORY OF BEAM B6A (A588)
Testing ID Subtotal Cumm.
I Fracture Test Data
Event
Detail I I I ** · Temp. N N Tested· No. cc
Fatigue a 2,042,600 2,042,600
Fracture b 22,500 2,065,100 G 1 -40 F 1 -40
Fatigue c 732,400 2,797,500
' I
Fractur~ 25,000 2,822,500 G 2 -40/-68
.,~ See fracture surface sketches for banding identification ** Temperature at controlling gages G - Groove welded detail F - Fillet welded detail x - Static jack increased load
Steel type - A588
Fract. Temp.
cc
-69
'• . '
Fatigue Data
cr cr cr cr r max r max MPa MPa MPa lviJ?a
G 62 131 F 55 117
62 190 55 168 '
G 62 131 F 55 117
62 195x

:
TABLE 11 TRANSITION TEMPERATURE DATA FOR FLANGE PLATES
Material
A36 (2" Pl)
A588 (2" Pl)
A514 (1-1/2" Pl)
Material
A36 (51 mm Pl)
A588 (51 mm Pl)
A514 (38 mm Pl)
Transition Temperature (°F)
(15 ft.-lb.) (15 mil)
-16 -26
-24 -15
-133 -102
(a)
Transition Temperature (°C)
(20 Joule)
-26.5
-31
-91.5
(b)
-74-
(0 .38 mm)
-32
-26
-74.5

.. TABLE 12 RE~\INING FATIGUE LIFE
Beam Remaining Fatigue Life*
Steel Number (Cycles)
B2 1,168,100
A514
B2A 576,500
B4 175,200
A36
B4A 9,800
B6 408,000
A588
B6A 669,600
* Fatigue failure defined at an edge
crack size = f flange width
-,75-
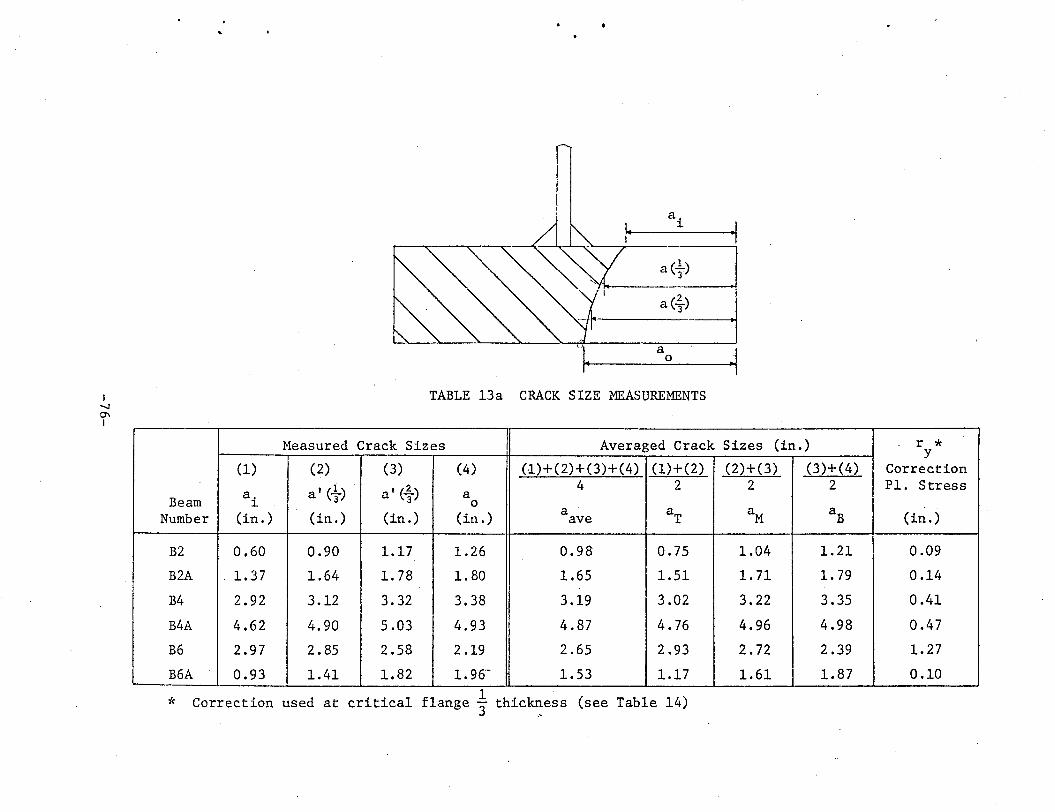
I -...J
"' I
·I a(t)
TABLE 13a CRACK SIZE MEASUREMENTS
Measured Crack Sizes Averaged Crack Sizes (in.)
(1) (2) (3) (4) (1)+(2)+(3)+(4) (1)+(2) (2)+(3) (3)+(4)
a'(;) a'(~) 4 2 2 2 Beam a. a
~ 0
Number (in.) (in.) (in.) (in.) a aT aM aB ave
B2 0.60 0.90 1.17 1.26 0.98 o. 75 1.04 1.21
B2A 1.37 1.64 1. 78 1. 80 1.65 1.51 1.71 1. 79
B4 2.92 3.12 3.32 3.38 3.19 3.02 3.22 3.35
B4A 4.62 4.90 5.03 4.93 4.87 4. 76 4.96 4.98
B6 2.97 2. 85 2.58 2.19 2.65 2.93 2. 72 2.39
B6A 0.93 1.41 1.82 1.96- 1.53 1.17 1.61 1.87 1 * Correction used at critical flange 3 thickness (see Table 14)
r * y Correction Pl. Stress
(in.)
0.09
0.14
0.41
0.47
1.27
0.10

I -..J -..J I
..
Measured
(1) (2)
Beam ai a' (t)
Number (rom) (mm)
B2 15 23
B2A 35 42
B4 74 79
B4A 117 124
B6 75 72
B6A 24 36
a. ~
a' (t)
,,14-•' Cfl ~ a r---------·-·0· ------~
TABLE 13b CRACK SIZE MEASUREMENTS
Crack Sizes Averaged Crack Sizes (mm)
(3) (4) {12+{22+(32+~42 ~12+~22 (22+(3~
a'(~) 4 2 2 a
0
(rom) (mm) a I aT ~
30 32 25 19 26
45 46 42 38 43
84 86 81 77 82
128 125 124 120 126
66 56 67 74 69
46 50~ 39 30 41
* Correction used at critical flange ~ thickness (see Table 14)
r * y p)+~4) Correction
2 Pl. Stress
aB (mm)
31 2
45 4
85 10
126 12
61 32
48 3
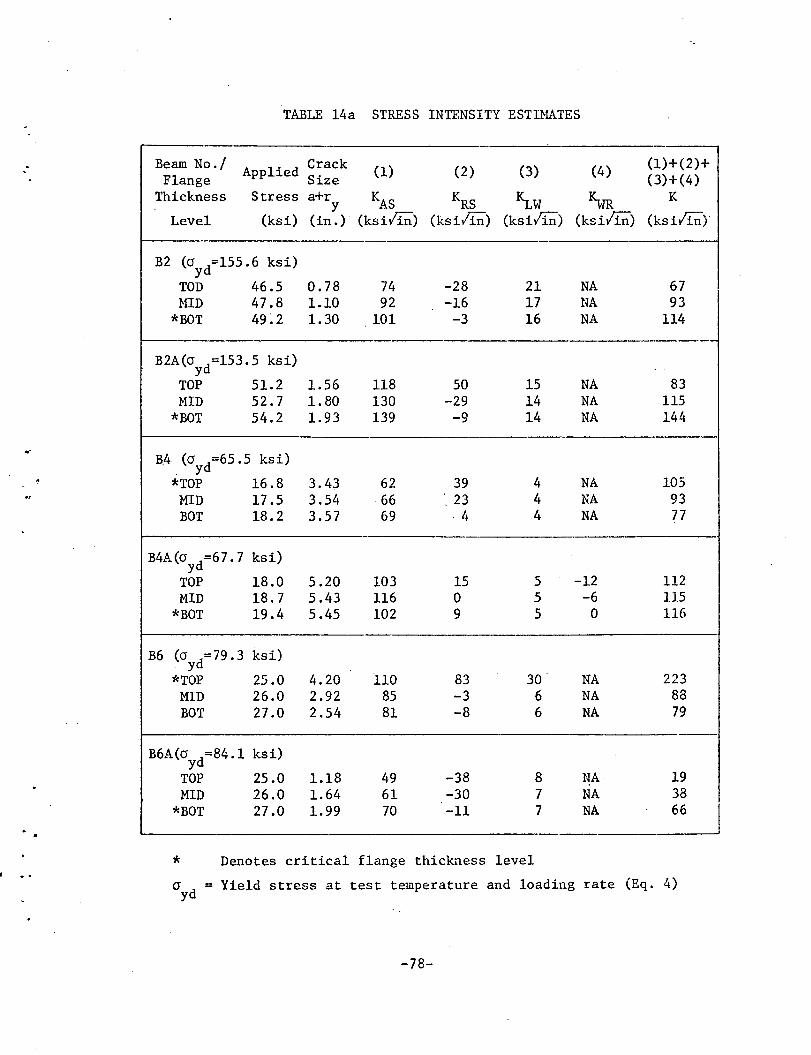
TABLE 14a STRESS INTENSITY ESTI}~TES
--Beam No./ A 1 . d Crack (1) (2) (3) (4) (1)+(2)+ Flange pp 1e s· (3)+(4) 1ze
Thickness Stress a+r KAS KRS ~w ~ K y Level (ksi) (in.)· (ksiv'fu) (ksiliri) (ksiv'i~") (ksiv'in) (ksifu}
B2 (cryd=155.6 ksi)
TOD 46.5 0. 78 74 -28 21 NA 67 MID 47.8 1.10 92 -16 17 NA 93
*BOT 49~2 1.30 101 -3 16 NA 114 --
B2A(cr d=153.5 ksi) . y TOP 51.2 1.56 118 50 15 NA 83 MID 52.7 1.80 130 -29 14 NA 115
*BOT 54.2 1.93 139 -9 14 NA 144
BA (cr d=65.5 ksi) . y
*TOP 16.8 3.43 62 39 4 NA 105 MID 17.5 3.54 . 66 ·. 23 4 NA 93 BOT 18.2 3.57 69 .. '• 4 NA 77
-
B4A(cryd=67.7 ksi)
TOP 18.0 5.20 103 15 5 -12 112 MID 18.7 5.43 116 0 5 -6 115
*BOT 19.4 5.45 102 9 5 0 116
B6 (cr yd= 79. 3 ksi)
*TOP 25.0 4.20 110 83 30 NA 223 MID 26.0 2.92 85 -3 6 NA 88 BOT 27.0 2.54 81 -8 6 NA 79
B6A(cryd=84.1 ksi)
TOP 25.0 1.18 49 -38 8 NA 19 MID 26.0 1.64 61 -30 7 NA 38
*BOT 27.0 1.99 70 -11 7 NA 66
* Denotes critical flange thic~1ess level
cryd = Yield stress at test temperature and loading rate (Eq. 4)
-78-
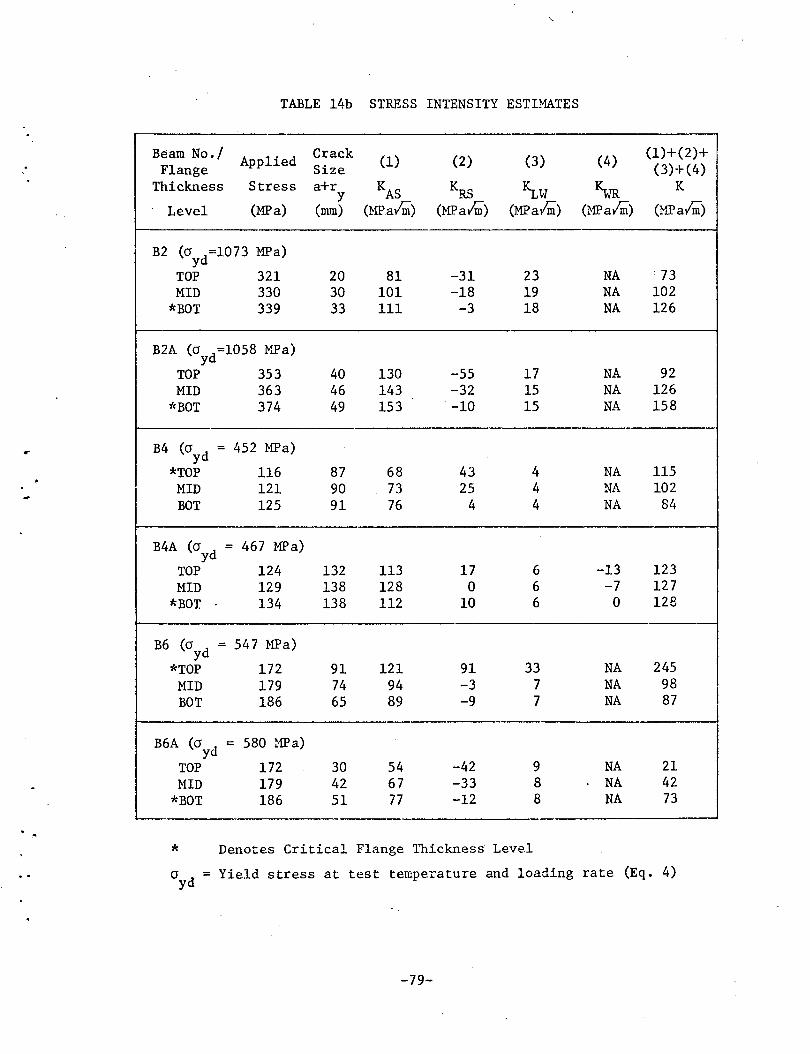
TABLE 14b STRESS INTENSITY ESTIMATES
Beam No./ Applied Crack (1) (2) (3) (4) (1)+(2)+ 1 Flange Size (3)+(4)
Thickness Stress a+r KAS KRS ~w ~ K y Level (MPa) (mm) (MPal;) (MParrn) (MPa/~) (MPa/;) (HPak)
B2 (ayd=l073 MPa)
TOP 321 20 81 -31 23 NA 73 MID 330 30 101 -18 19 NA 102
*BOT 339 33 111 -3 18 NA 126
B2A (ayd=l058 ¥~a)
TOP 353 40 130 -55 17 NA 92 MID 363 46 143 -32 15 NA 126
*BOT 374 49 153 -10 15 NA 158
--B4 (ayd = 452 MPa)
*TOP 116 87 68 43 4 NA 115 MID 121 90 73 25 4 NA 102 BOT 125 91 76 4 4 NA 84
B4A (ayd = 467 MPa)
TOP 124 132 113 17 6 -13 123 MID 129 138 128 0 6 -7 127
*BOT 134 138 112 10 6 0 128
B6 (ayd = 547 MPa)
*TOP 172 91 121 91 33 NA 245 MID 179 74 94 -3 7 NA 98 BOT 186 65 89 -9 7 NA 87
B6A (ayd = 580 ~fPa)
TOP 172 30 54 -42 9 NA 21 MID 179 42 67 -33 8 NA 42
*BOT 186 51 77 -12 8 NA 73 -
* Denotes Critical Flange Thickness Level
cryd = Yield stress at test temperature and loading rate (Eq. 4)
-79-

FIGURES
-80-
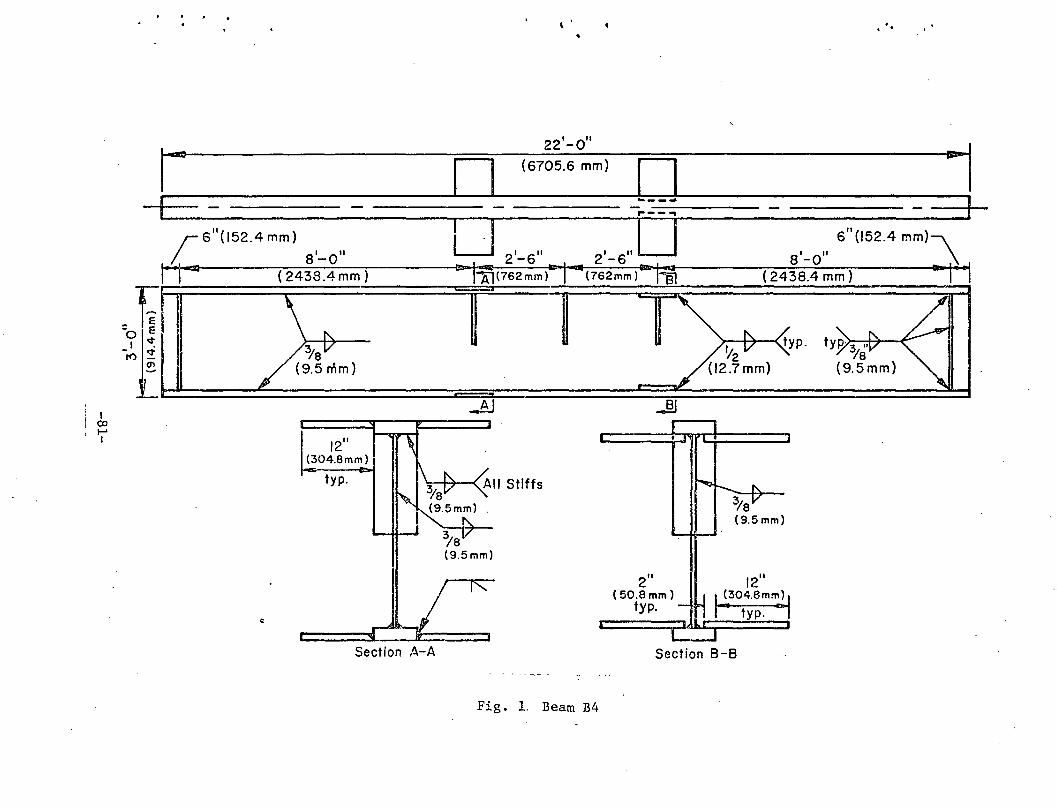
I OJ ,...... I
r r 6"(152.4 mm)
I a'-o" I" "j 4
( 2438.4 mm)
12" (304.8mm)
typ.
22'-o"
(6705.6 mm)
" 11: Section ,1)..-A
Fig. 1. Beam B4
l •
2" (50.8 mm)
typ. -
I
. . .
6" {152.4 mm)\
s'-o" . \ ( 2438.4 mm) •1· i
~ r-. " o/av (9.5 mm)
12" H jl304.8mm~
typ.
I
Section 8-8
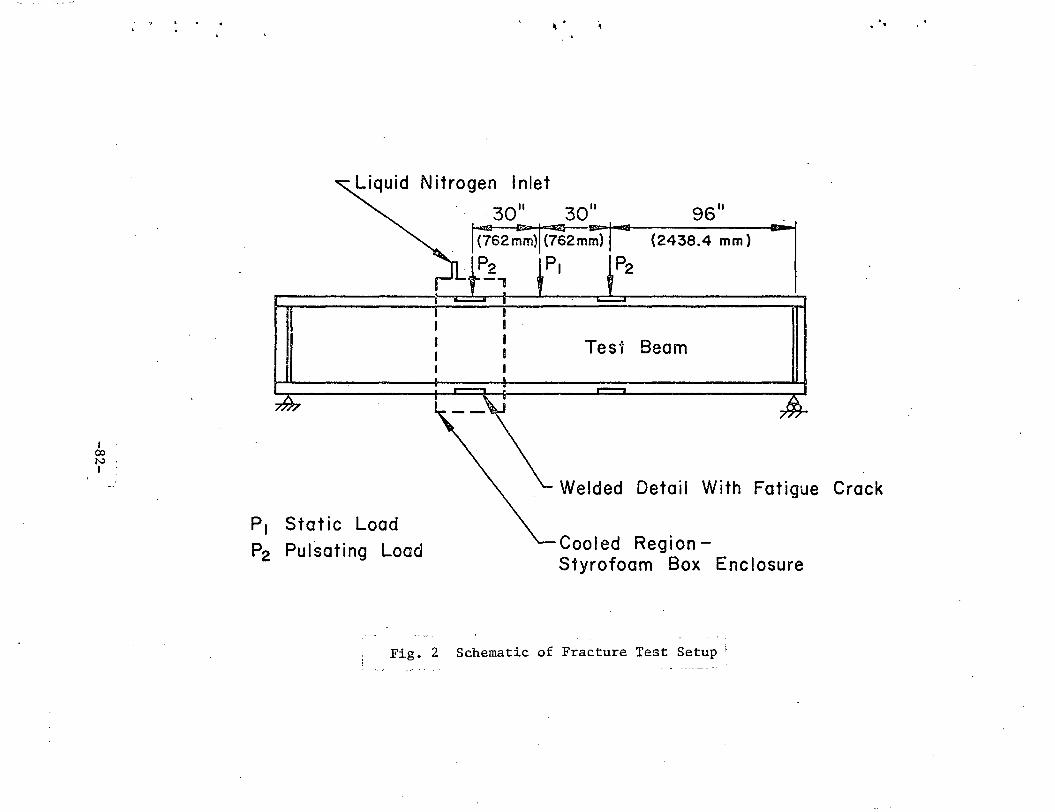
I . co N. I
. . .
Nitrogen Inlet
P1 Static Load P2 Pulsating Load
Fig. 2
3011
3011
9611
~62~)~~2mmP~)~--(-2_4_3_8_.4 __ m_m_)~~
P2 P1 -,
Test Beam
Welded Detail With Fatigue Crack
Cooled RegionStyrofoam Box Enclosure
Schematic of Fracture Test Setup ;

Fig. 3 Photograph of Test Set•Up
~ -83-
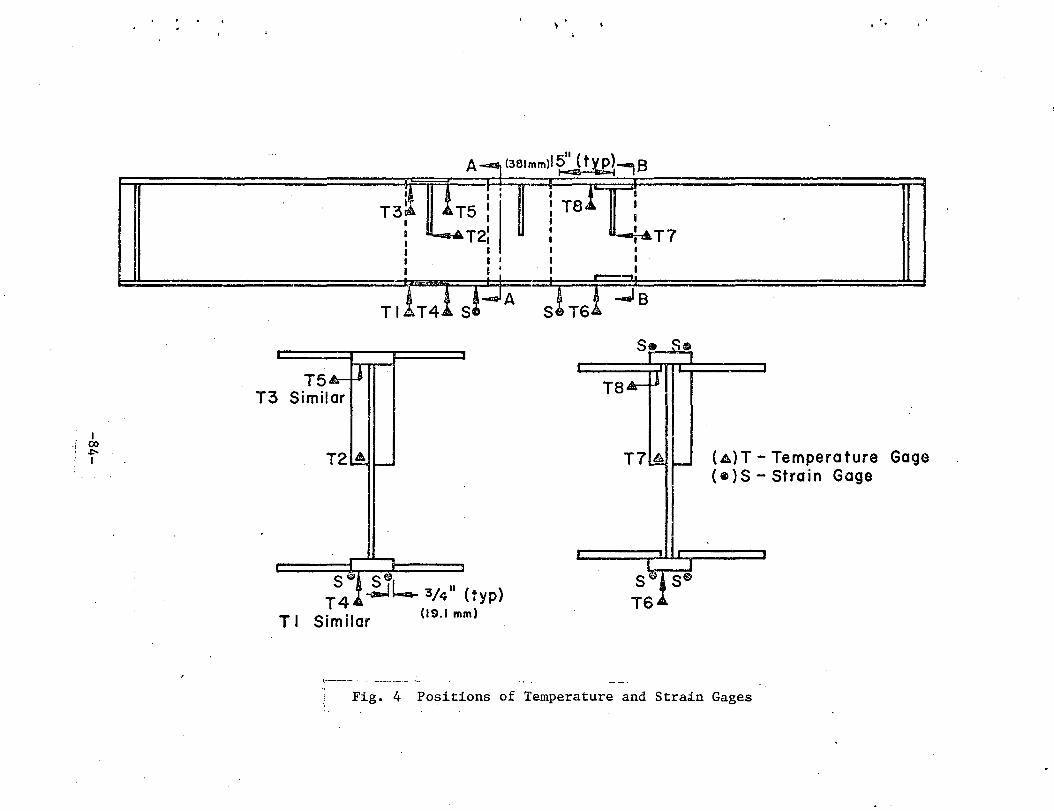
T5 T3 Similar·
T2 A
s~ S 0
T4 ~l-.. 3/4n (typ)
T I S. .
1 (19.1 mm)
1m1 ar
t.---- ... ·- -------- ·-
(381mm)I~-,B
T8 i
~T7
T8
..
(A)T- Temperature Gage (e)S- Strain Gage
., j Fig. 4 Positions of Temperature and Strain Gages
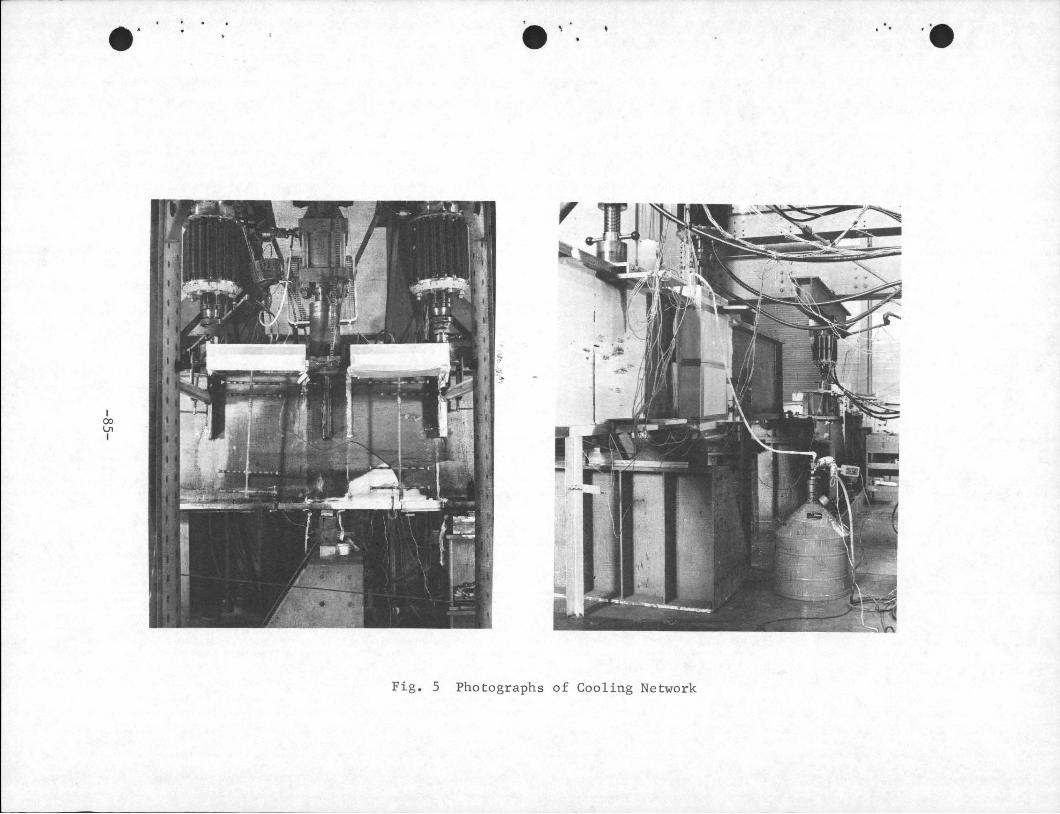
I co 1..11 I
Fig. 5 Photographs of Cooling Network
. .
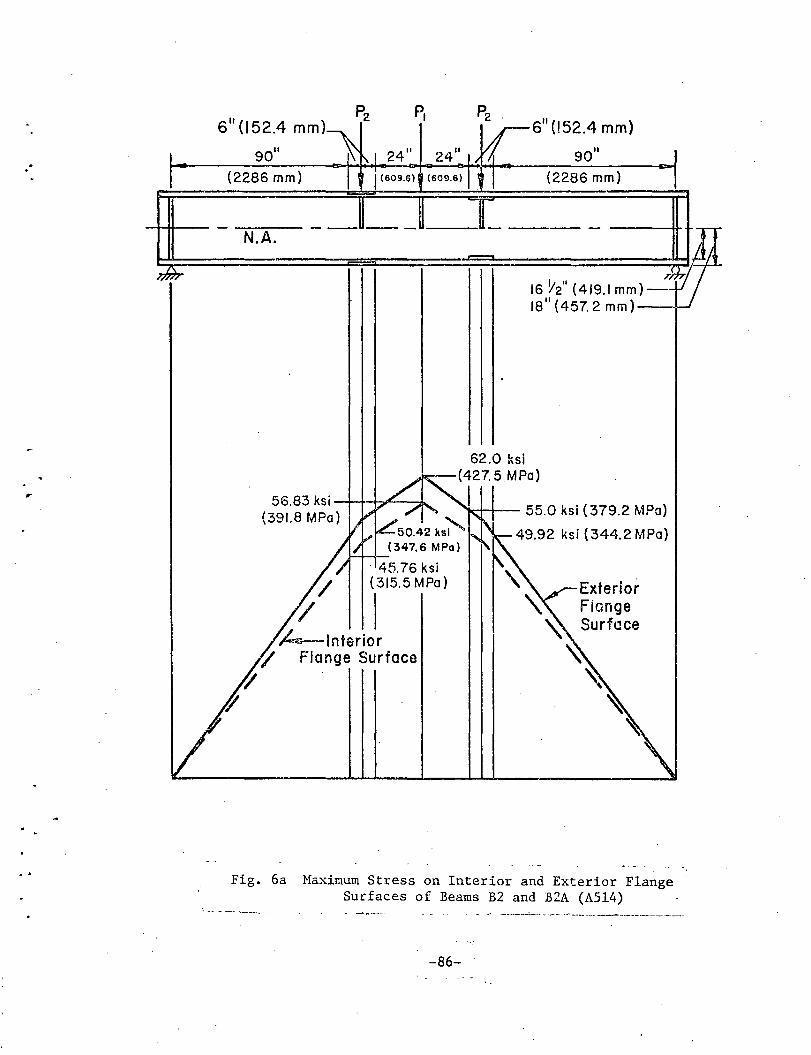
.·
6 11 (152.4 mm)
(2286 mm)
N.A.
56.83 ksi~-+-+..><~~ {391.8 MPa)
6" (!52.4 mm)
(2286 mm)
16 Y2" (419.1 mm) 18"(457.2 mm)--+-J
62.0 ksi (427. 5 MPa)
I - 55.0 ksi ( 379.2 MPa)
49.92 ksi (344.2 MPa)
Exterior Flange Surface
Fig. 6a Maximum Stress on Interior and Exterior Flange Surfaces of Beams B2 and B2A (A514) ·
--~ -------- --~~--.:..----·~~ -~'----·---·-·-----~-
-86-
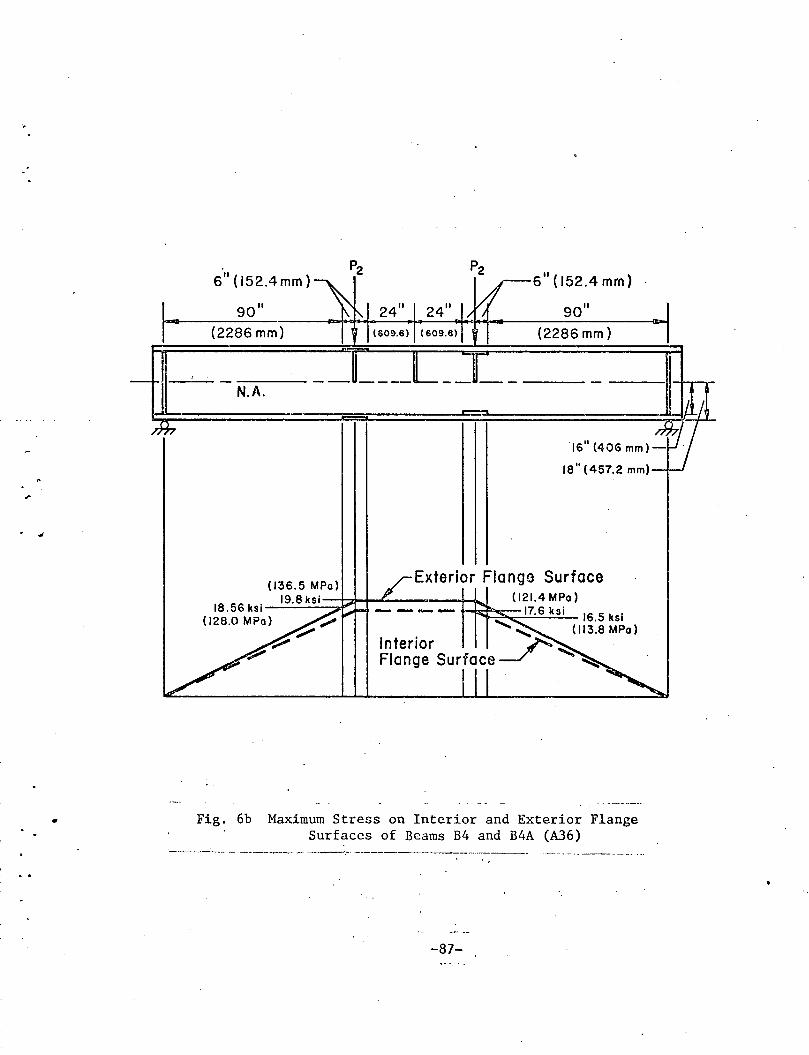
. ~
•
6" ( 152.4 mm)
N.A.
6"(152.4mm)
16" (40G mm)-
18" (457.2 mm)
Exterior Flanga Surface
Fig. 6b Maximum Stress on Interior and Exterior Flange Surfaces of Beams B4 and B4A (A36)
·------· -· ·- -----~----- --·-· .... --------------------
-87-
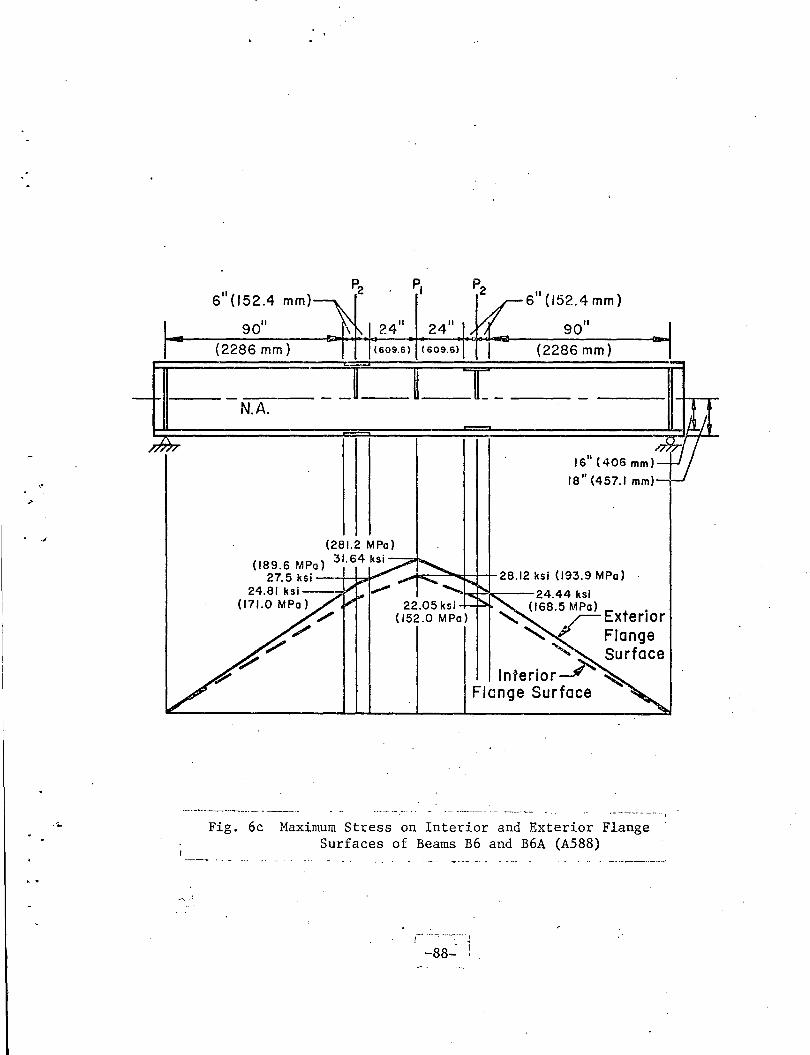
• -.1
611
(152.4 mm)
(2286 mm)
N.A.
(281.2 MPo)
(189.6 MPo) 31.64 ksi-2 7. 5 ks i ~::--~d-1-+-
24.81 ksi-(171.0 MPo)
611
(152.4mm)
(2286 mm)
16" (406 mm)
18"(457.1 mm)
·--'---- --··-1
Fig. 6c Maximum Stress on Interior and Exterior Flange Surfaces of Beams B6 and B6A (A588)
,-· ----~ ··--:----~
- I -88- '
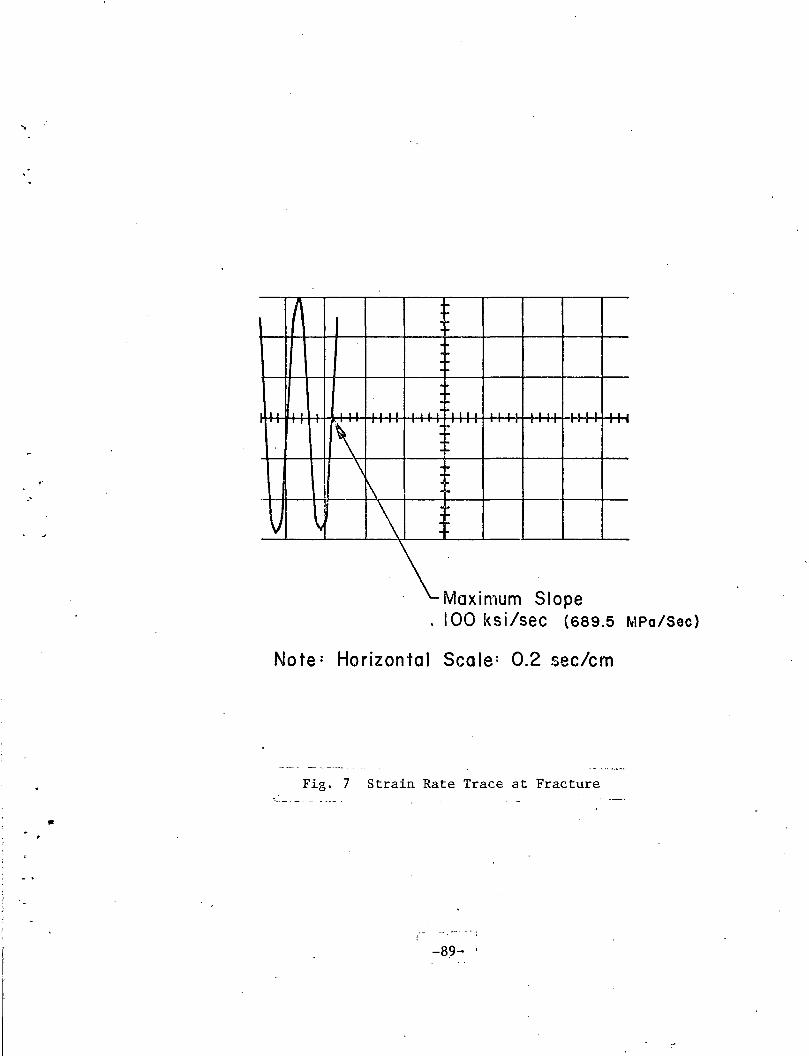
11
1-1-
~ I I I I I I I I l- I I .
~, ·I-. . .
~ \
.· 1\ 1-
v \ \ ·I-
\ Max1mum Slope 100 l<si/sec (689.5 MPa/Sac}
Note: Horizontal Scale= 0.2 sec/em
Fig. 7 Strain Rate Trace at Fracture
•
-89-

.e
Fig. 8 Photograph of Lehigh Drop Weight Test Machine
...
-90-
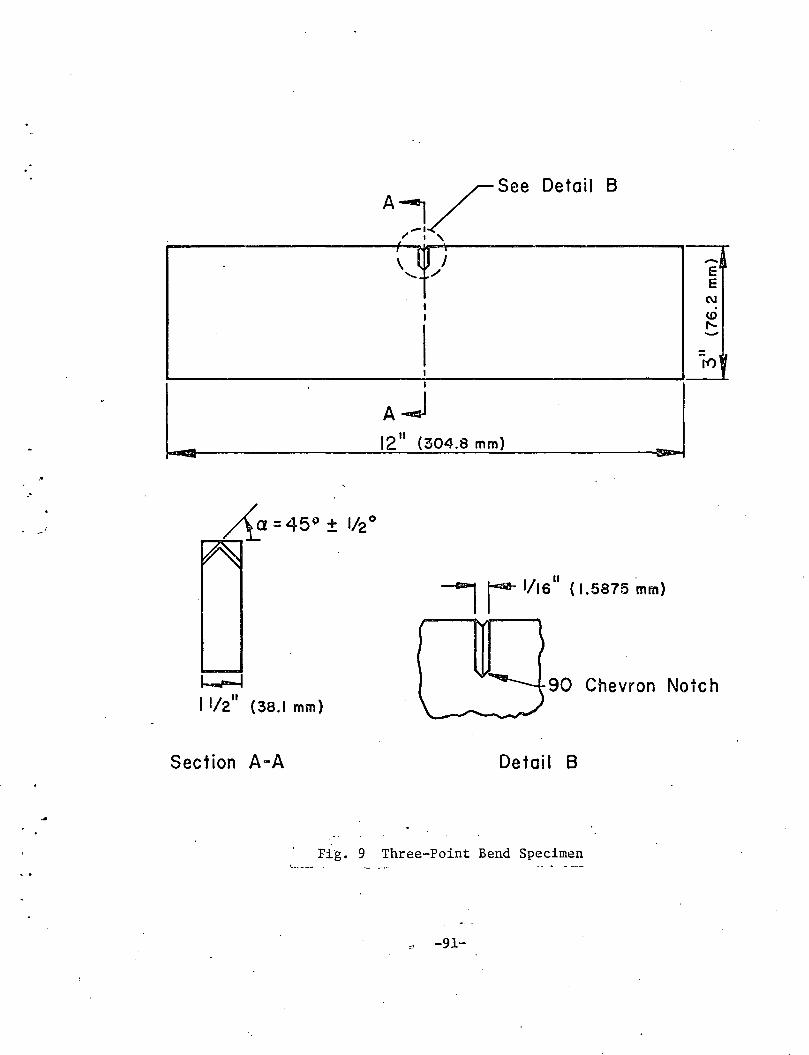
/
See Detail 8 AI -· I' I '
' ( 0 I -~~ ...... / E E
I (\J
I (J) ,.._ -= ~ tf)
I
~~4~----------~~~~~~<~~0~4.~8~mm~)---------~ .·
__, r 1/1611
( I 1.5875 mm)
1--1 90 Chevron Note h 11/211
(38.1 mm)
Section A-A Detail 8
Fig. 9 Three-Point Bend Specimen
~ -91-
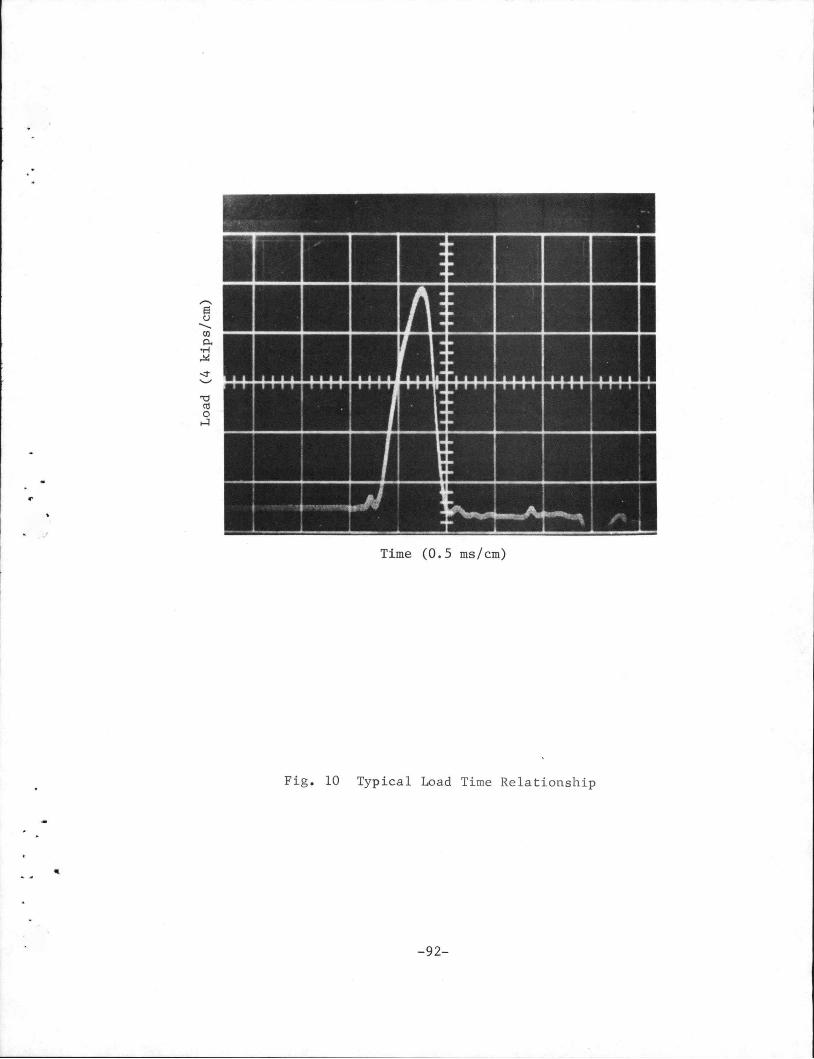
I: ::::II I I: ::::II I::::J
:I
,~~ ~ ::II ~ ~
'J I::::J I: ::::II I: ::::II
1'1 1"1 ., 1"11'11'1 ., ., .,..., Ill: ;,.,.,., .,.,...., 1'11"11"1 ., .,., 1'1
•
1.11.11.11.1 1 i ... ... ... 1:: !ILIU ....... I
' 1111 ... I::::J I C:::l
! Ill II' :I
~~ :I i
I :II
•' :II
I :I II' II, I
! ' ... ~ • .A~" ~ ~ · ' II ""' _,, I t .::! It It I .__
Time (0.5 ms/cm)
Fig . 10 Typ i cal Load Time Relationship
-92-
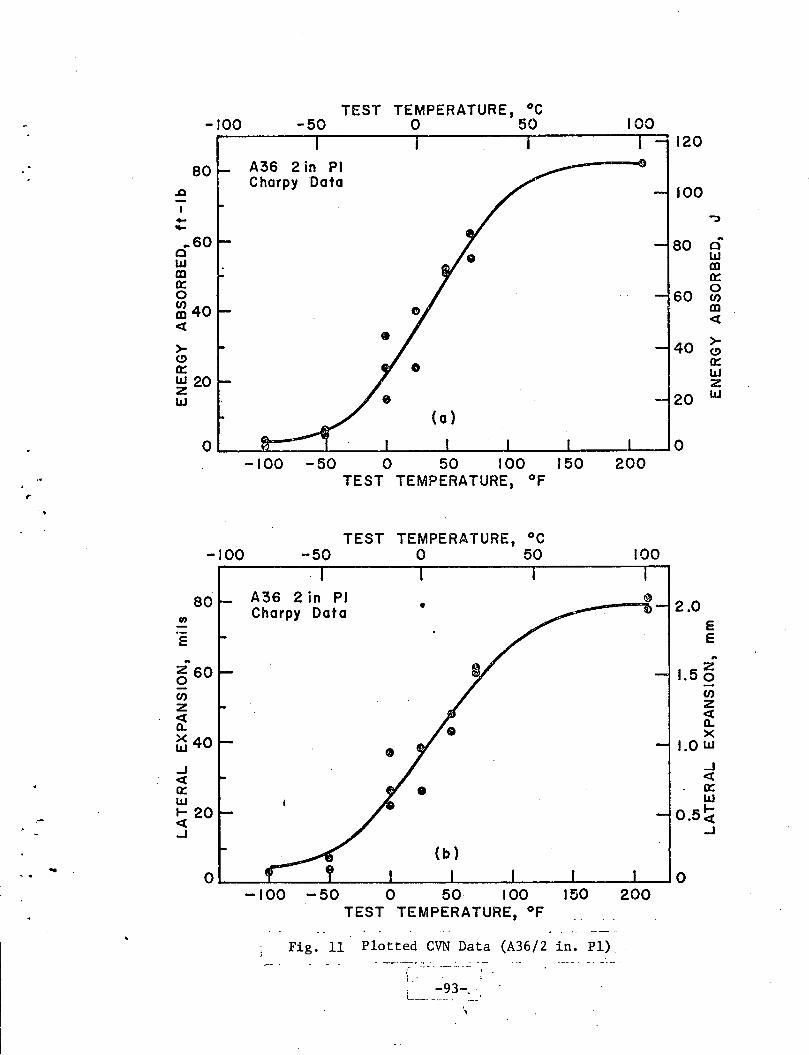
TEST TEMPERATURE, oc -100 -50 0 50 100
120
80 A36 2in PI Charpy Data
.Q 100 -I - "":) .... .. 60 80
.. 0
0 w w m m a= a= 0 0 60 (/)
~40 m <( <(
• >->- 40 (.!) (.!) 0:: 0:: 0 w w 20 z z IJJ w 20
(o)
0 0 -100 -50 0 50 100 150 200
TEST TEMPERATURE, OF ,
TEST TEMPERATURE, oc -100 -50 0 50 100
80 A36 2in PI 2.0 Charpy Data •
en E
E E .. .. z 60 z 0 1.5 0
(/) (/)
z z <( <( a.. a.. x40
X w • 1.0 w _J _J <( <(
a= • a= w w ..... 20 1-,... <( 0.5<( _J _J
.. 0 0
-100 -50 0 50 100 150 200 TEST TEMPERATURE, °F
Fig. 11 Plotted CVN Data (A36/2 in. Pl) . -.. ·.-···---- ..
(" --- • ------- I
'• ... '· . -93-_ L__ __ -··-- --
' '·
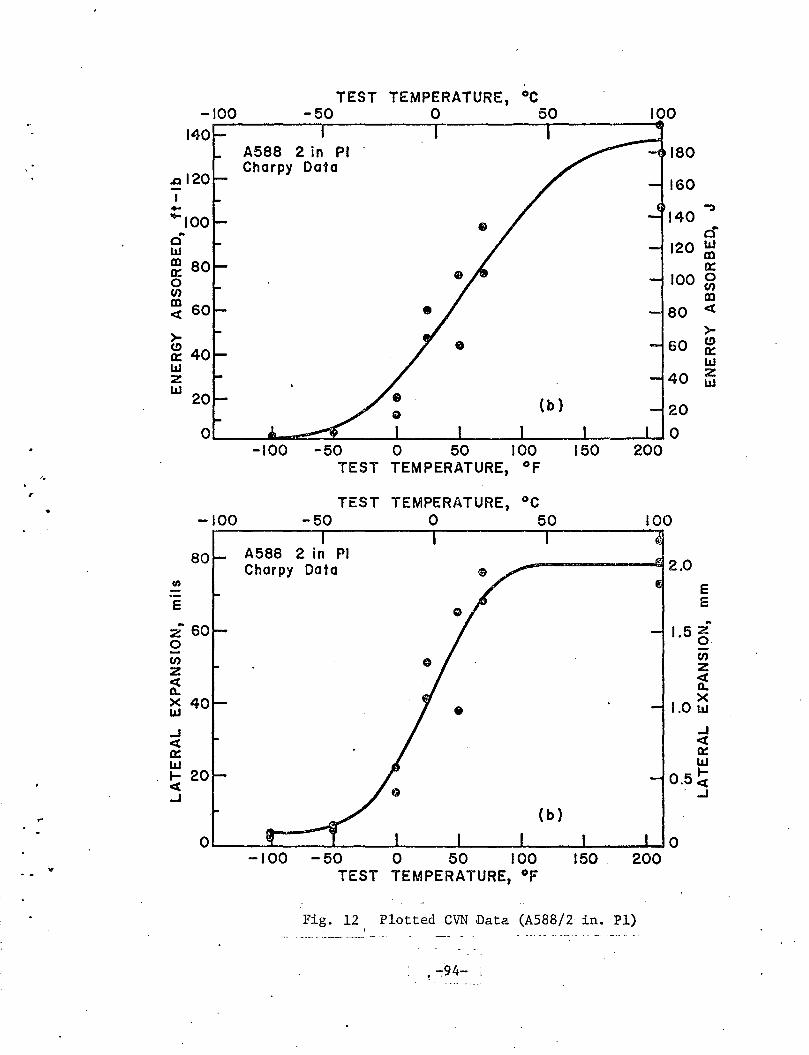
TEST TEMPERATURE, oc -100 -50 0 50 100
A588 2 in PI 180 Charpy Data
- 160 I - .,
oo-100 140 d'
120 w m 0::
100 0 (/) m
80 <(
>- >-e 60 (!)
~ 40 0:: w LLI z z 40 LLJ
LLI (b) 20
0 0 -100 -50 0 50 100 150 200
TEST TEMPERATURE, OF '•
,. TEST TEMPERATURE, oc
-100 -50 0 50 100
80 A588 2 in PI Charpy Data 2.0
Cl) E -
E E
z 60 ..
1.5 5 0 (/) (/)
z z <( a: a.. >< >< 40 1.0 !JJ w .J .J <( <(
0: 0:: w w 1- 20 1-<( 0.5 <(
.J . .J
.... (b)
0 0 -100 -50 0 50 100 150. 200
"' TEST TEMPERATURE, °F
Fig. 12 Plotted CVN Data (A588/2 in • Pl) -·-··- ---- ___ .,. -- - ----- -·- . -- ------ -·-
~ -:94- ;
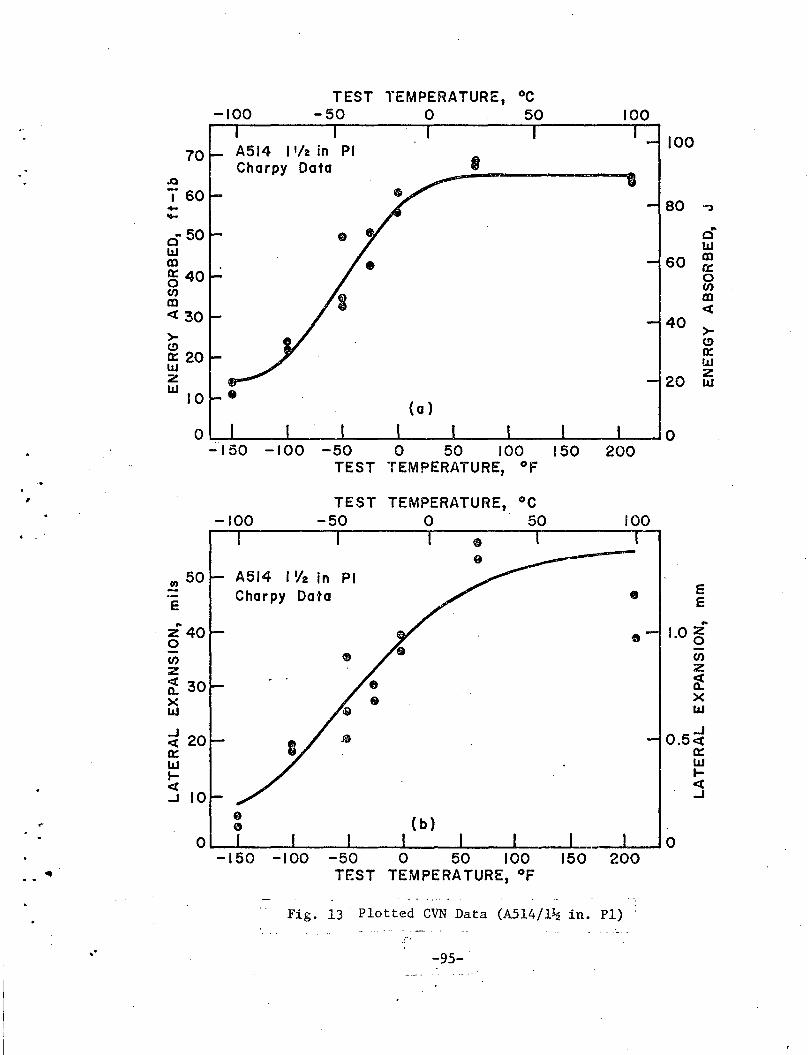
TEST TEMPERATURE, oc -100 -50 0 50 100
A514 11/z in PI 100 70
Charpy Data ..Q
I 60 80 - '"') ....
.. so .. • Cl c ll.l ll.l m
Ql 60 rt: 0:: 40 0 0 en en m m <t <t 30 40 >- >-
(!) (!) 0:: 0:: 20 ll.l ll.l z z 20 ll.l wiO • {a}
0 0 _;,150 -100 -50 0 50 100 150 200
TEST TEMPERATURE, OF
, TEST TEMPERATURE, oc -100 -50 0 50 100
f)
e ~50 A514 l'h in PI
Charpy Data e E E e .. ..
z 40 • 1.0 ~ 0 en & en z z ~ 30 ~ X X ll.l ll.l
;;l 20 ..J
JD 0.5<:{ 0:: 0:: ll.l ll.l .... .... <( <t ..J 10 ..J
f) {b) ..- 0
0 0 -150 -100 -50 0 50 100 150 200
~ TEST TEMPERATURE, °F . - . . ..
Fig. 13 Plotted CVN Data (A514/l~ in. Pl) ·····--- -·.
r· .. -95-
. ~ --·
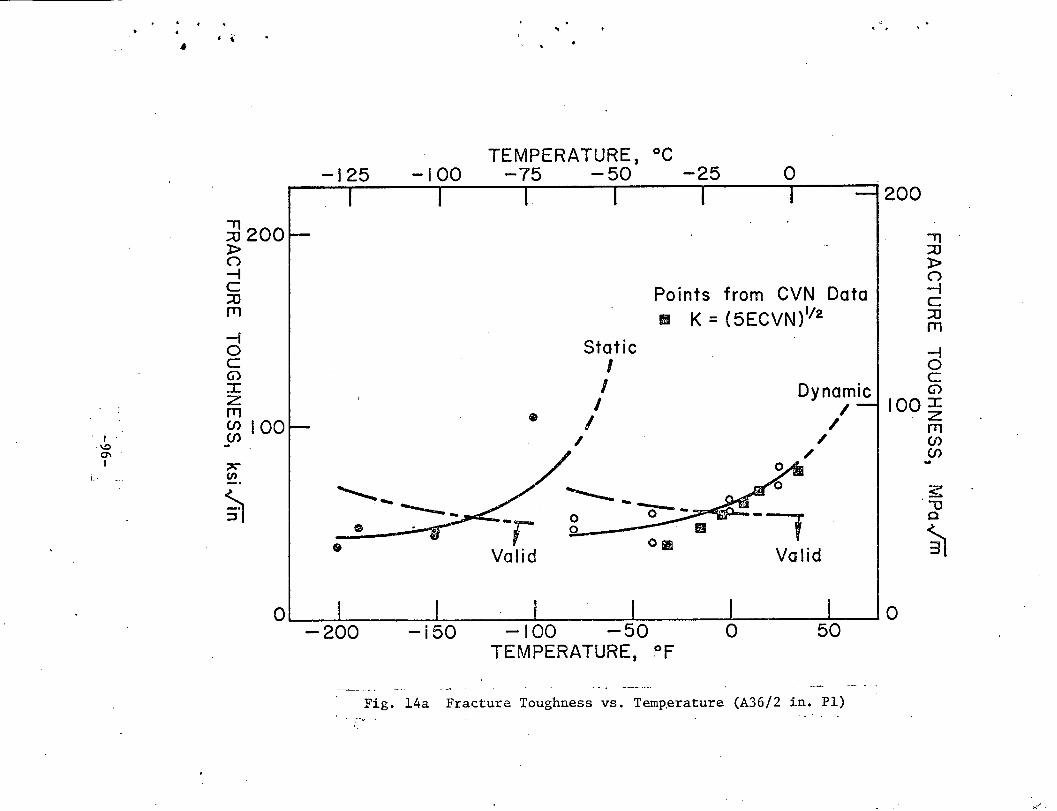
. I . ·\0 0\ . I
I_·
. . • i'
;} 200 l> (")
~ c ::0 fT1
-f 0 c G) ::c z fT1 ~ 100 ..
-125 TEMPERATURE, °C
-100 -75 -50 -25 0
I
-, Valid
Static I
I I
I
Points from CVN Data m K = (5ECVN)'~2
Dynamic I
I /
/
. .
200
11 ::0 l> (")
--1 c ::0 fT1
~ 0 c G)
100~ rn (J) (J) ..
0~--~----~~----~------~------~--~--~--~o - 200 - i 50 - I 00 -50 0 50
TEMPERATURE, .°F
Fig. 14a Fracture Toughness vs. Temp,erature (A36/2 in. Pl)
, ...
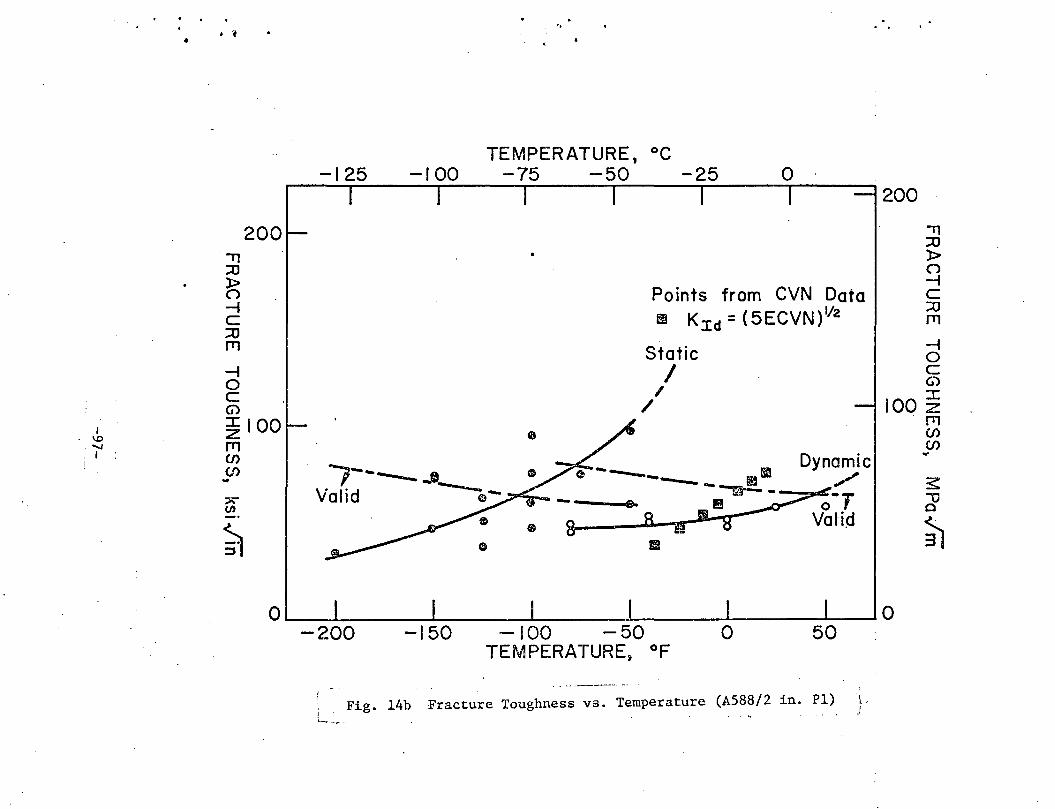
I . \0 ......,
, I I
'il :::0 f) -I c ::0 rrl
-I 0 c G)
200
~100 rrl en (/) ..
..
TEMPERATURE, °C -125 -I 00 -75 -50 -25 0
-,-----_.. Valid ~-.7"'0--
Points from CVN Data Li K:cd = ( 5ECVN )112
Static
/ /
I
~ ____ 11
Dynamic
----- - riB -"'~ ----~·~ m~~-r
8 8 1m II 8 Va li~ a
. . .
200
'il :::0 )> () -I c :::0 rrl
-I 0 c G)
100 ~ fl1 CJ) (J)
0~~~--~~----~~----~-------L------L--~0 -200 -150 -100 -50 0 50
, Fig. 14h ! \-.. -,
TEMPERATURE» °F
Fracture Toughness vs. Temperature (A588/2 in. Pl)
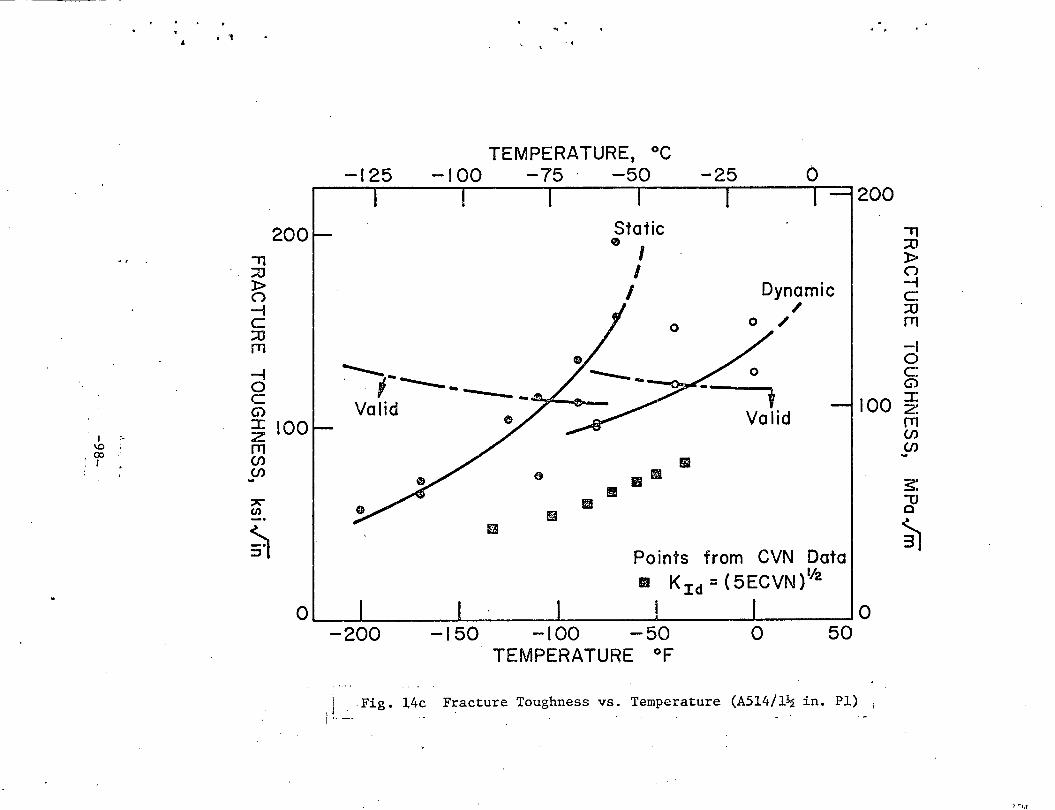
' • 1
200 , :::0 l> (')
-i c :::0 rn
-I 0 c G) I 100
I ·- z \0 rr1 ,ex>
. I (/) (/) .. :;:It" en
~
0
..
TEMPERATURE, oc -125 -100 -75 -50 -25 0
Static • I I
I Dynamic /
0 0 /
---- 0 . ,------- t Valid Valid
m
1!1 a•
Ill! 19
(!
Points from CVN Data m K J:d = ( 5ECVN ) 112
I -200 -150 -100 -50 0 50
TEMPERATURE OF
!. . Fig. 14c Fracture Toughness vs. Temperature (A514/l~ in. Pl) I~.-·
. . .
200
100
0
, ::0 )> () -i c ::0 rr1
-I 0 c G)
:r: z rn (/) (/) .. !:. -u c
~
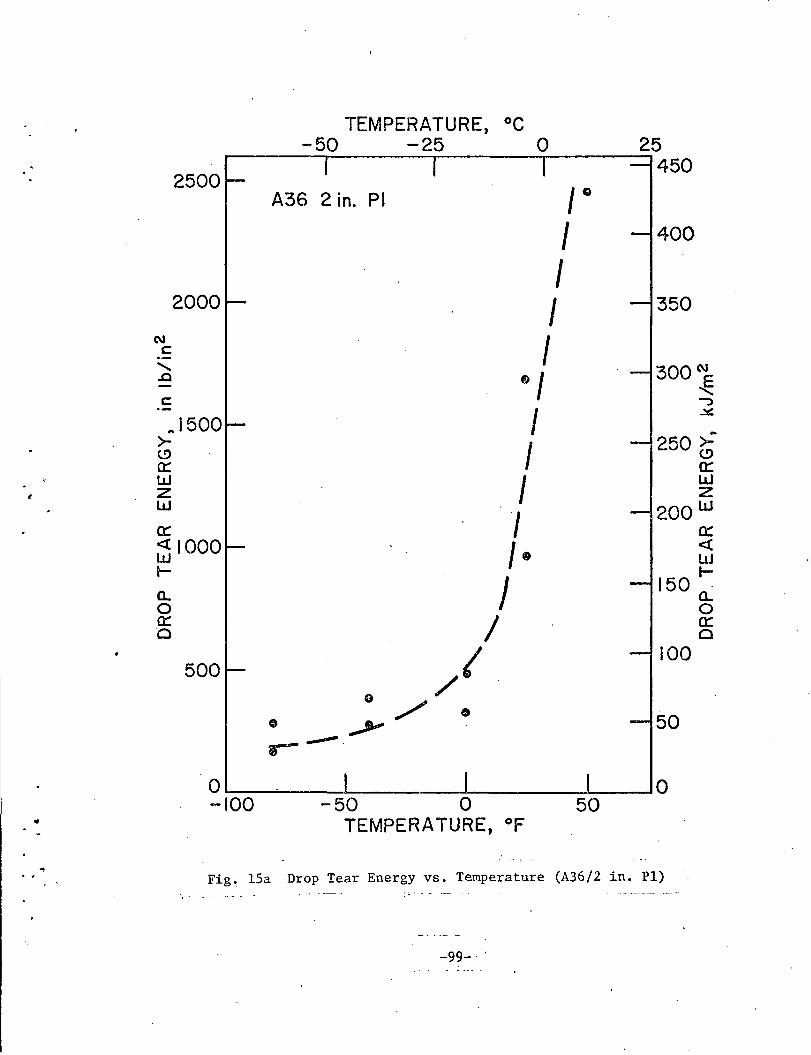
TEMPERATURE, oc -50 -25 0 25
450 2500
A36 2 in. PI I. I 400
I 2000 I 350
N I c ·-.......... 300(\J .Q f)/ ~ c: -:> ·-
I ~
.. 1500 >- I 250 ~ (!) (!')
0:: 0:: w I w
# z z w 200w I a:: 0:: ~1000 If>
<t: w ..... t-
(l. I 150 . (l.
0 0 0:: I 0:: 0 0
/I 100
500 e .
.>'/ 0 0 ----·
Q.._ _____ --A.--~---1------L-----10 -100 -50 0 50
• TEMPERATURE, °F
Fig~ 15a Drop Tear Energy vs. Temperature (A36/2 in. Pl) .-- . -. -· ·- - -· ..
-99-.'

,
2500
2000
N c ·-.......... .a c ·-.. 1500
>-(.!)
0::: w z w
0:: <tiOOO w J--
0... 0 0:: Q
500
TEMPERATURE, oc -50 -25 0
A588 2 in PI
25 450
400
350
250 ~ 0:: w z
200w · 0:: <( w J--
150 Ct..
100
50
0 0:: Q
0 L-----L'---· --'-------'---~0 -.100 -50 0 50
TEMPERATURE, °F
Fig. 15b Drop Tear Energy vs. Temperature (A588/2 in. Pl) .
-100-':
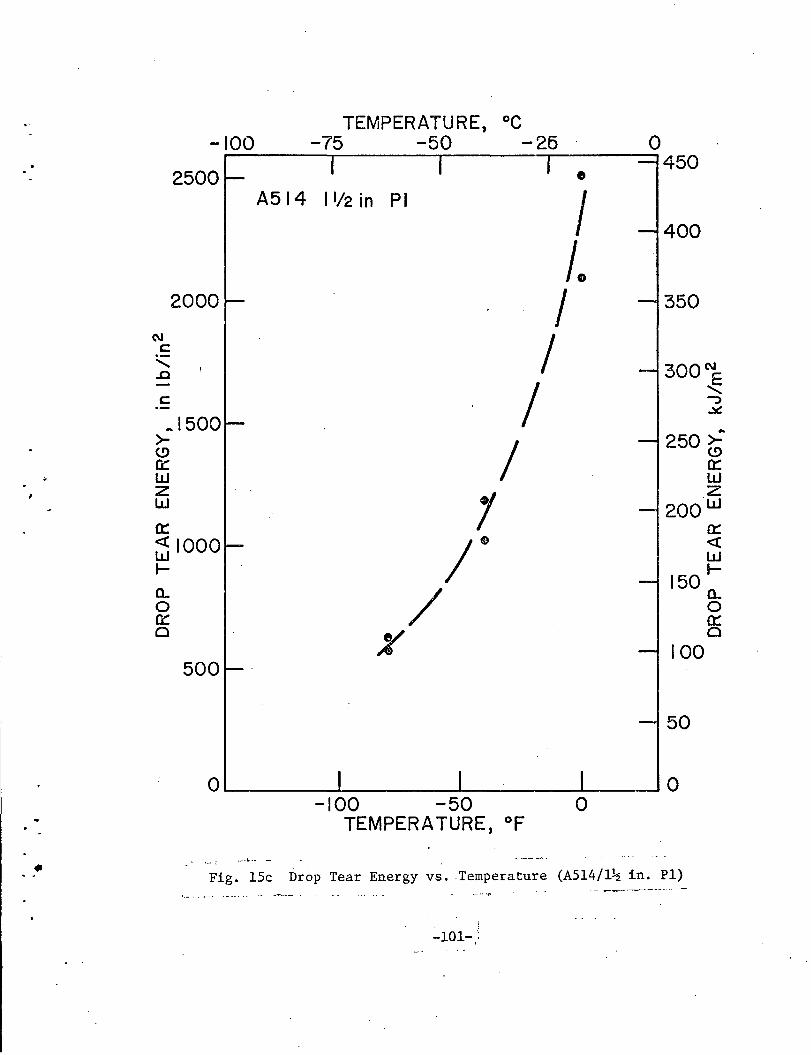
.. . '
N c ·-........
..c
c ·-
-100
2500
2000
.. 1500 >-(!) a:: w z w a:: ~1000 1:--
a.. 0 a:: 0
500
TEMPERATURE, °C -75 -50 -25
A5 14 l'/2 in PI
}( /
1 ;·
I I
e
I I. I I
0 450
400
350
250 ~ (!) a:: w z
2oo·w 0::: <( w
150~
100
50
0 a:: 0
0~------~--------~--------~----~o -100 -50 0
TEMPERATURE, °F
·- -_ ··~ ~ ---"·· ·-Fig. 15c Drop Tear Energy vs. Temperature (A514/1~ in. P1) .
... --=--------------
:...101-.~
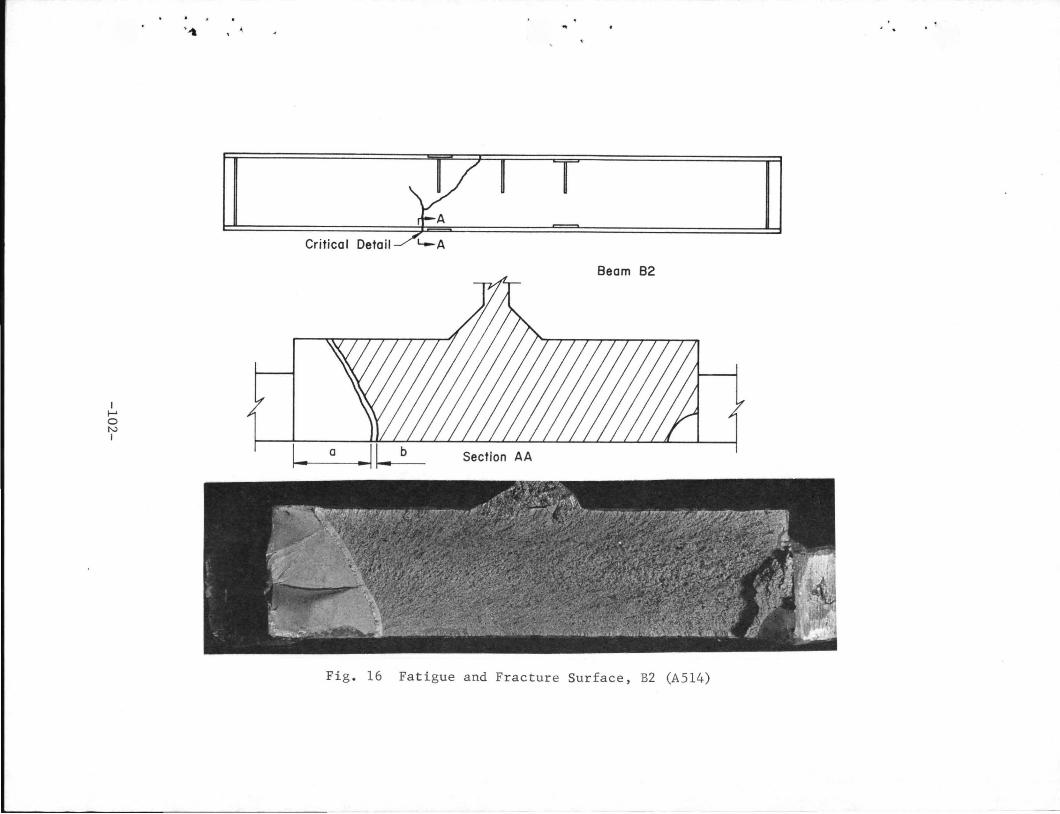
I 1-' 0 N I
Critical Detail
Beam 82
1- a
Fig . 16 Fatigue and Fracture Surface, B2 (A514)
. .
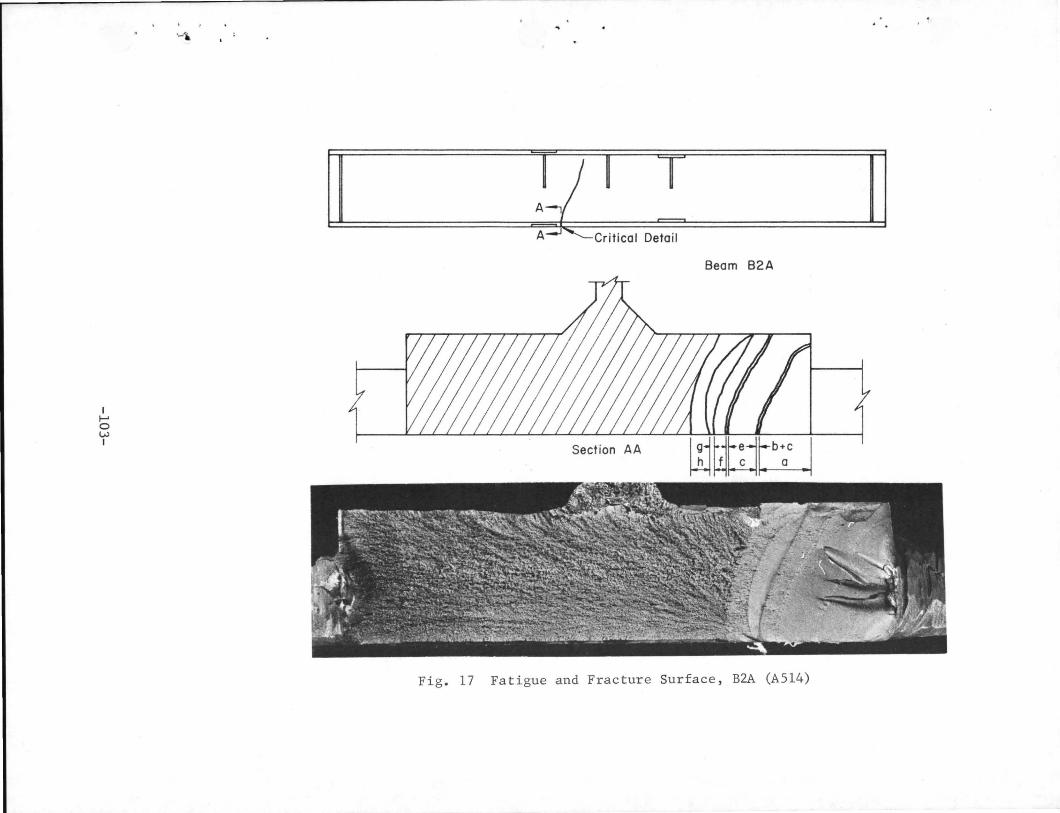
I ...... 0 w I
Beam B2A
Sect ion AA
Fig . 17 Fatigue and Fractur e Sur f a ce, B2A (A514)
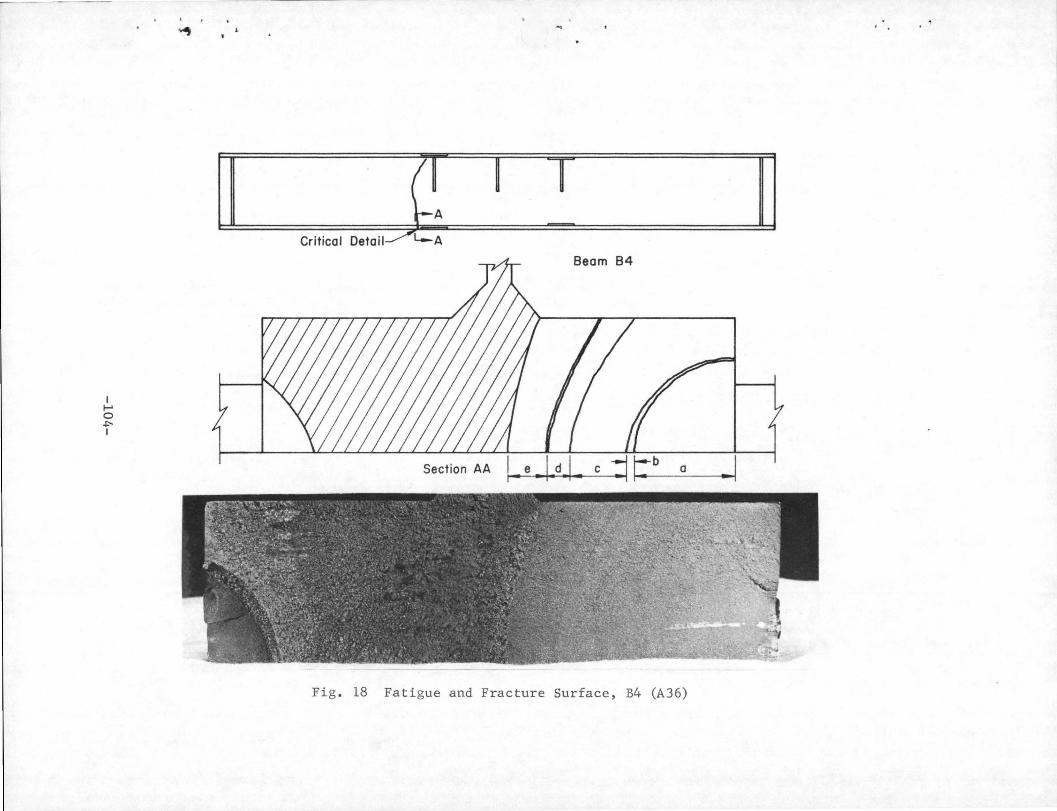
I 1-' 0 -!:'-
'
Critical Deta il
Beam 84
a .. 1
Fig . 18 Fatigue and Fracture Surface, B4 (A36)

I I-' 0 Vl I
II II A.-1 Critical Detail
Beam 84A
Fig. 19 Fatigue and Fracture Surface, B4A (A36)

I I-' 0 cr.. I
••
A
Critical Detail
Fig . 20 Fatigue and Fracture Surface, B6 (A588)
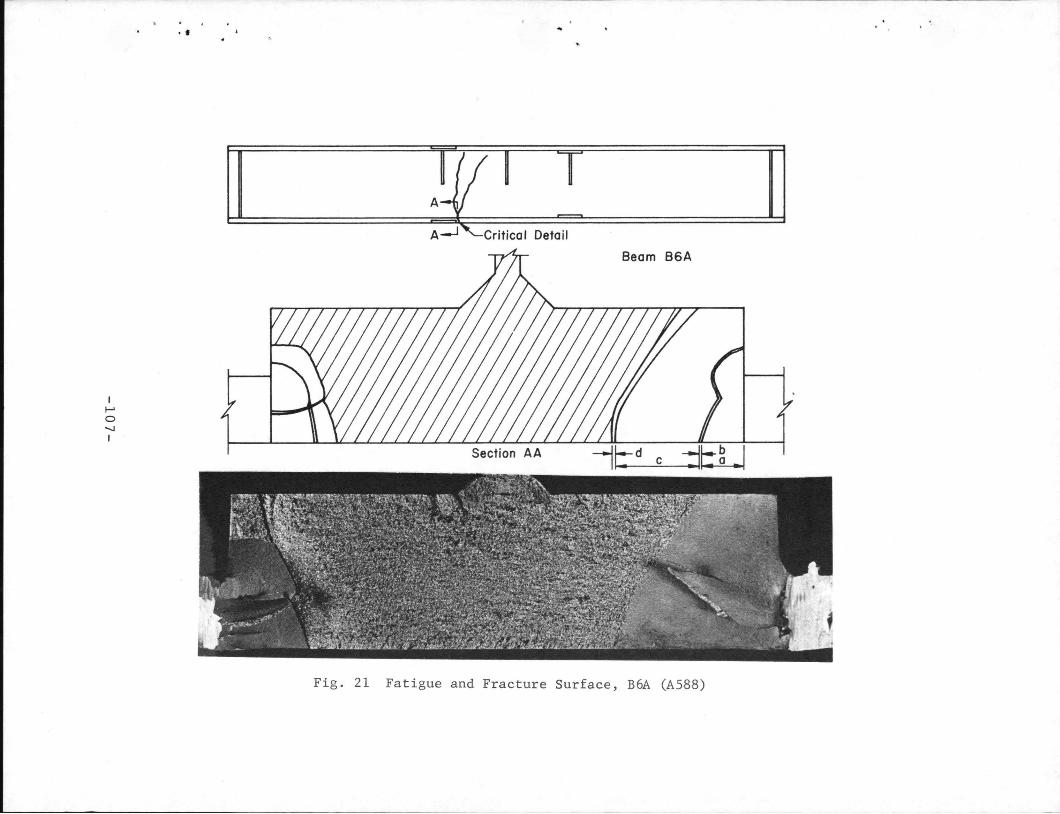
I f-' 0 -....J
I
• • ..
A
Critical Detail
Beam 86A
Fig. 21 Fatigue and Fracture Surface, B6A (A588)
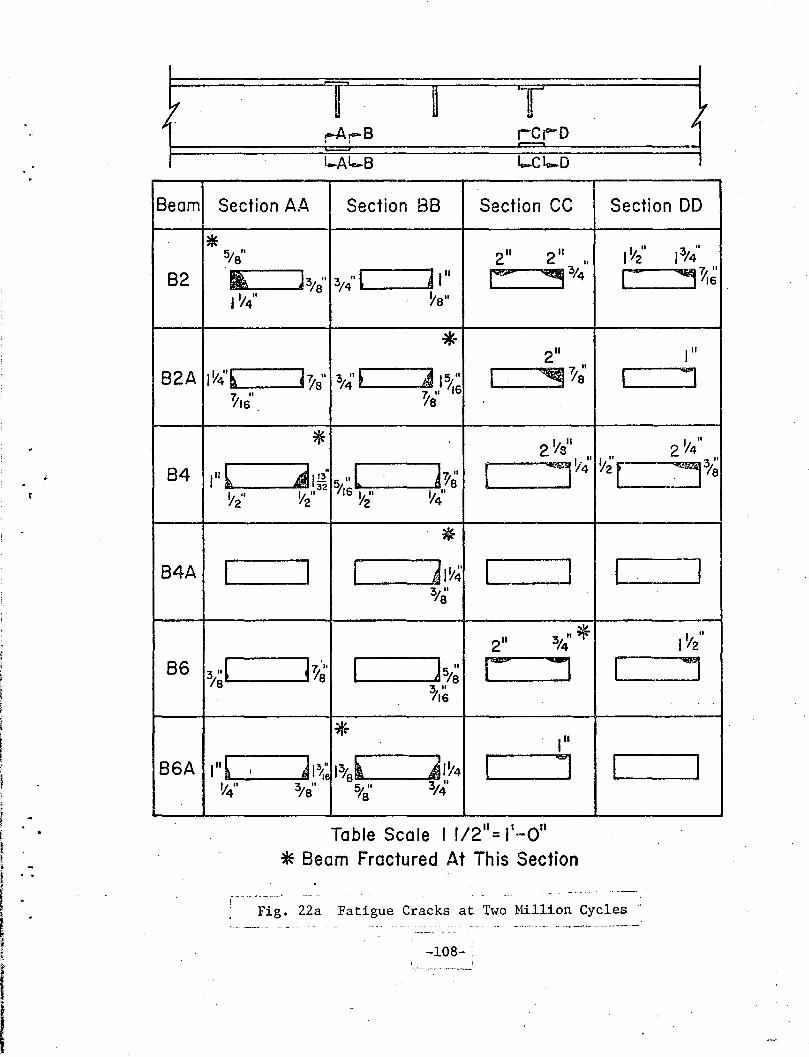
. . .
Beam
82
82A
84
84A
86
86A
.-Ar-B ' I
Section AA Section BB Section CC Section DO
* I Y2" 13/411 5;a" 211 211 II
ti h" 3;4"l d 111 r: ~3/4 c ...,-~~ Ya
11/4" Ya"
*• 211 lu
Ad I~" I -711 1 IY4'~ ~7 II 3;~' i ::!§ /'a I I' a 7 II 16 "Y~ti' I' a
* 2 1/s11
2 Y4 II
I II
y~·c::~% 1 .,~ ~~~- 5"L · J-ra· I ..,,.4
y2" '12" rrs Vi' I II V4
* I I [ lw4 ( J I = J
%1'
3 "* I ~2 II
211 Y4
3 II( ]'l~' I Js;~ r I I ~j Ia 3 II
l'rs .
* lu
Ill~ A3" 1%. ---, ( ., I I I _l~e JJIY4
V4" 3 II 5;8' 3 II
:ta Y4
211 I II Table Scale I 1/ =I -0
* Beam Fractured At This Section
·--- ·- -'--~--·· -!
Fig. 22a Fatigue Cracks at Two Million Cycles ·
' -108-:

Beam
B2
B2A
B4
B4A
B6
-
B6A
-~ T
Sec·tion AA Section BB Section CC
* . 15.9
ri 31.8
31.8 ~
25.4~ 12.7
[
9.51 I
25.4[
6.4
50.8 50.8
]9.5 6.4 I 125.4 c: ~19.1
* 50.8
122.2 19.1 ~ ~33.3 I ·~22.2 22.2
* 54.0
.. 351 7.9 [ J22.2 I :Js.4 38.1 12.7 6.4
* . I I ~3i.8 c I
9.5
50.8 44.5
l22.2 I ll5.9 r- ~ 4.8
*" 25.4
~30.2 34.9~ ~31.8 I J 9.5 15.9 19.1
:« Beam Fractured At This Section Crack Measurements In mm
Section DO
38.1. 44.5
c .._,,1,1
25.4.
I I
57.2
12.7r . .,9.5
I I
38.1
I J
[ I
Fig. 22b Fatigue Cracks at Two Million Cycles ·. ~ - - I -----------
-109-
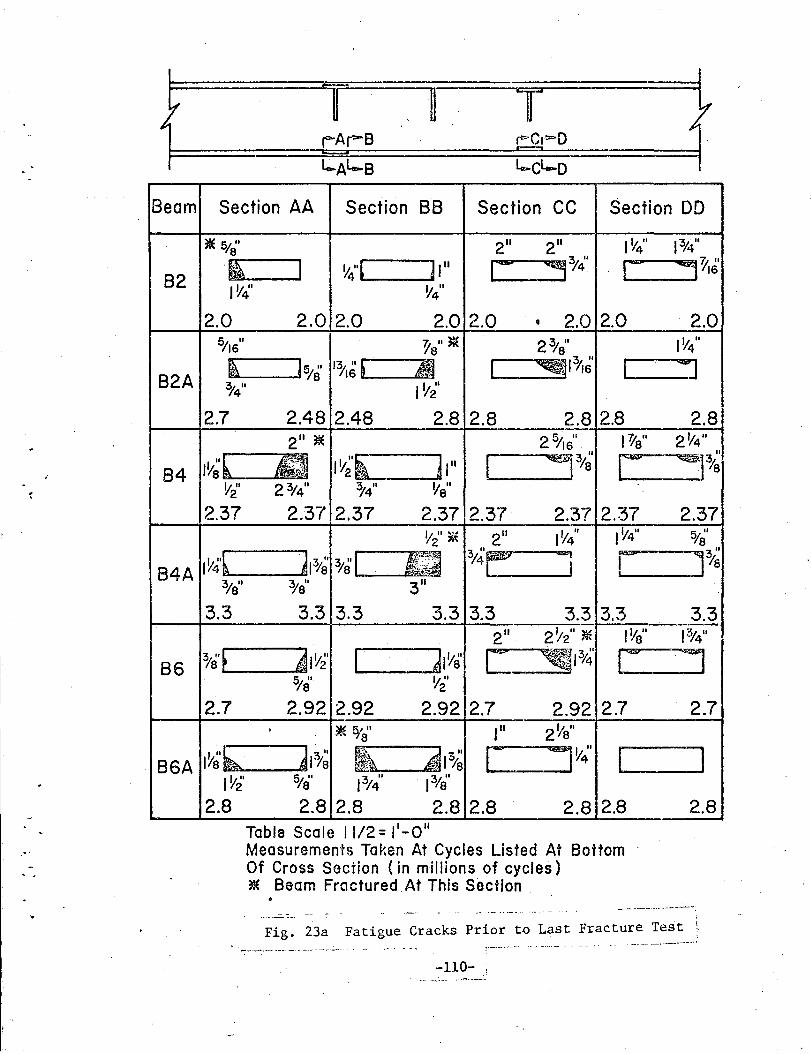
Beam
82
82A
84
B4A
86
86A
Section AA Section BB Section cc Section DO
* 5;8' 211 211 IV4" 13/411
-~ I 1;4"( ]lu C: ~3;4' c .,~16' IV4" v4"
2.0 2.0 2.0 2.0 2.0 ' 2.0 2.0 2.0 5; " 16 ~a"* 2 3/a" IY/
fh )5 " 13 "~ All I 3 " L J ~IY1s :ta 7'16 o/4" I Y2'
2.7 2.48 2.48 2.8 2.8 2.8 2.8 2.8 211 * 2 5/ls" l~e" 2Y4"
l'l IY~'L ~, .. I ~,3;~' c ~]o/~ We Yi' 2 3/4
11 3 " 7'4 Ya" 2.37 2.37 2.37 2.37 2.37 2.37 2.37 2.37
Y2" * 211 1Y4" f!l4" 5 " Ya 3;;~ 3"
IY4'~ ~I%' 3 ··I J I jra Ya I
3/e" 3 " Ya 311
3.3 3.3 3.3 3.3 3.3 3.3 3.3 3.3 211 2
112
11 * !Ya" lo/4"
%'~ -: 11'2 ~I" I ]1118' c ~13;~' c= =:1 5 II ra Y2'
2.7 2.92 2.92 2.92 2.7 2.92 2.7 2.7 I * s;a" , .. 211 II
'8
I"~ J,% 1\ .. ~II [ jY~' [ ] 1:% 1/s~ IY2' 5;8' 13/4 13;ij'
2.8 2.8 2.8 2.8 2.8 2.8 2.8 2.8 Table Scale 11/2 = 1'-0 11
Measurements Taken At Cycles Listed At Bottom Of Cross Section {in millions of cycles) ~ Beam Fractured. At This Section
--- -~---- .---"'
Fig. 23a Fatigue Cracks Prior tQ Last Fracture Tes~--J
-110- '
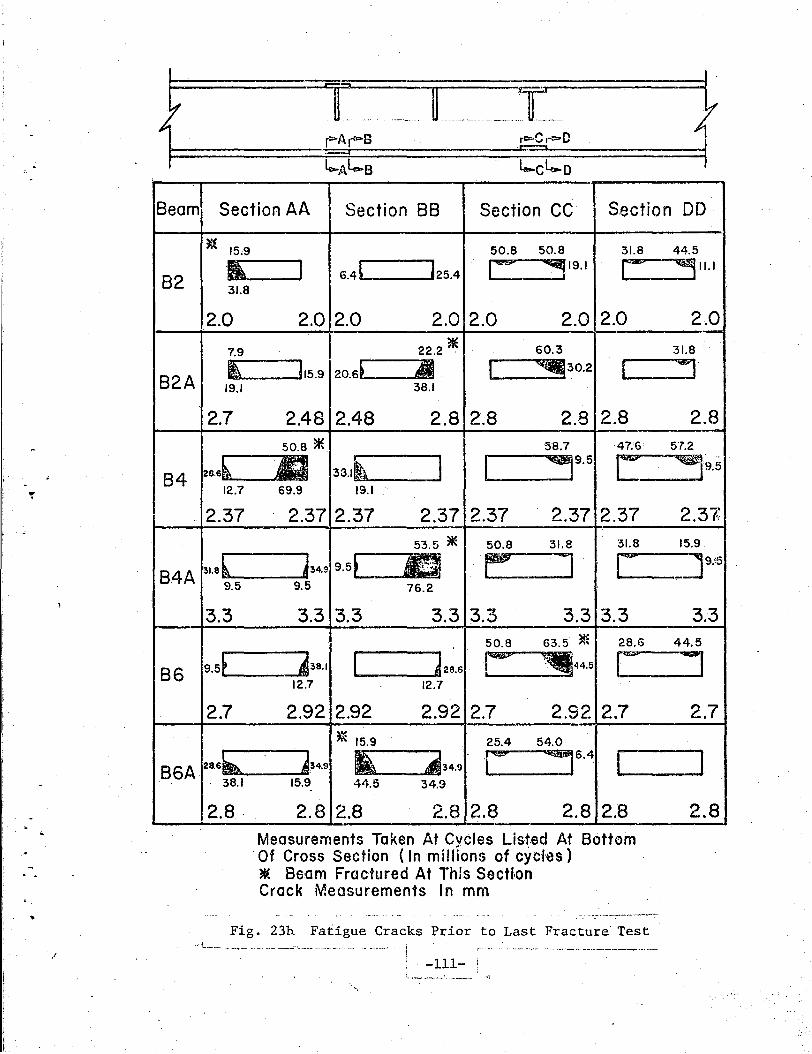
. -
l-c'--o
Beam Section AA Section 88 Section CC Section DD
82
82A
84
84A
86
86A
* 15.9 •• 31.8
2.0
7.9
i 19.1
2.7
28.6~ 12.7
2.37
31.8~ 9.5
3.3
9.5~
2.7
28.6~ . 38.1
2.8.
50.8 50.8 31.8
I G.4t 125.4 c ~19.1 co 2.0 2.0 2.0 2.0 2.0 2.0
22.2 * 60.3
115.9 20.6[ &ll [ ~30.2 [ 38.1
2.48 2.48 2.8 2.8 2.8 2.8 50.8 * 58.7 47:6
33.1~ J [ ~9.5 c 69.9 19.1
2.37 2.37 2.37 2.37 2.37 2.37 53.5 * 50.8 31.8 31.8
~34.9 9.5[ • . ·'. ~ I C 9.5 76.2
3.3 3.3 3.3 3.3 3.3 3.3 50.8 63.5 * 28.6
~38.1 I J2S.6 ,~ .44;5 c
12.7 12.7
2.92 2.92 2.92 2.7 2.9'2 2.7 * 15.9 25.4 54.0
~34.9 li :.I34.9. '[~ ,6.4_ I
15.9 44.5 34.9
2.8 2.8 2.8 2.8 2.8 2.8 Measurements Taken At Cycles Listed At Bott0m
·Of Cross Section (In millions of cycles) * Be·am Fractured At This Secnon Crack Measurements In mm
Fig. 23h Fatigue Cracks Prior to Last Frac.ture Test _, ~--- ···--- ·- -- --_ _, .. _ ~- -------- i : -111- I
. ' !.~------·--~--~--- -.?
44.5
~11.1
2.0 31.8
=:1
2.8 57.2
~9.5
2.37 15.9
]9::5
3.3 44.5
I 2.7
J 2.8
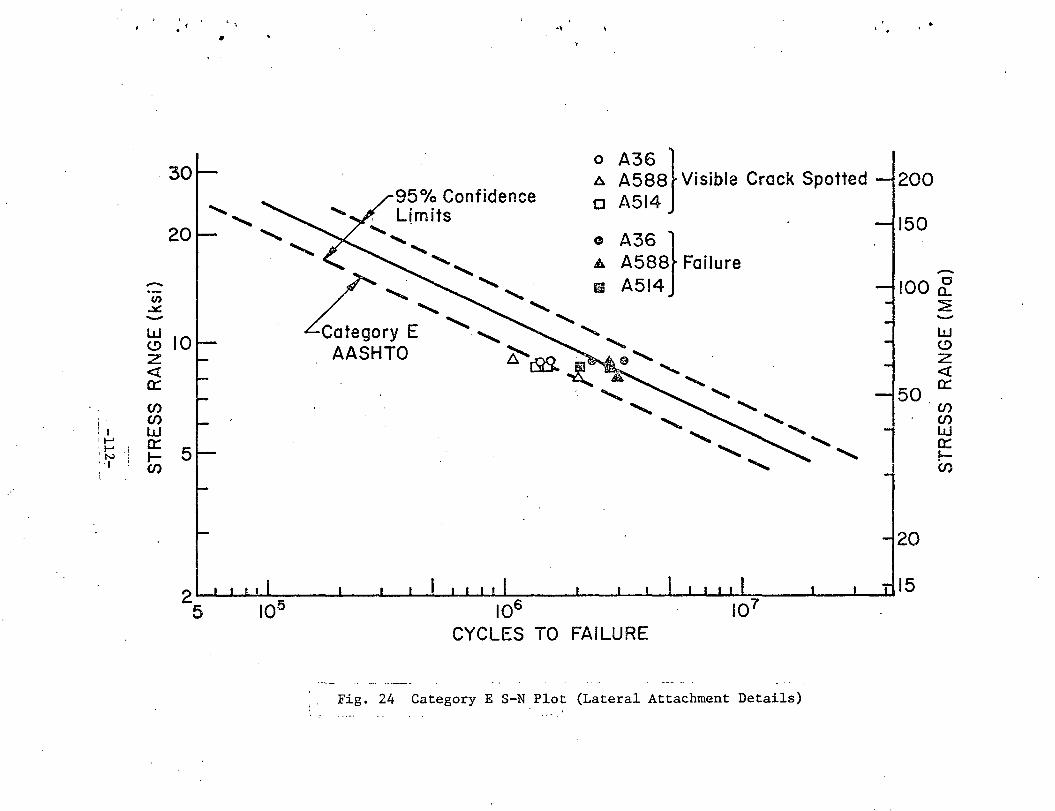
. ; ..
0 A36} 30 6 A588 Visible Crack Spotted 200 95°/o Confidence 0 A514
' Limits 150 20 ' ....... 0 A36} .......
' A A588 Failure L . ,, -- II A514 100 ~ (/) ' ' .X ' ' ~ - Category E ' ........._ ' ' ,
-w 10
w (.!) (.!)
z AASHTO ~ rS8. 9 '- z <( ~.A ....... , <{ a:: 0:: ......... ' 50 (/) .......... ....... '(/)
' . (/)
' ....... (/)
j I w
' ...... w
I 1-' 0:: ....... 0:: ....... 5 ' 'N 1- ' 1-. ·I (/) ......... Cl)
i --
2~~~~--~--~~~~~~--~--~~~~~~~--~~--UI5 5 106
CYCLES TO FAILURE
I . Fig. 24 Category E S-N Plot (Lateral Attachment Details) ,-
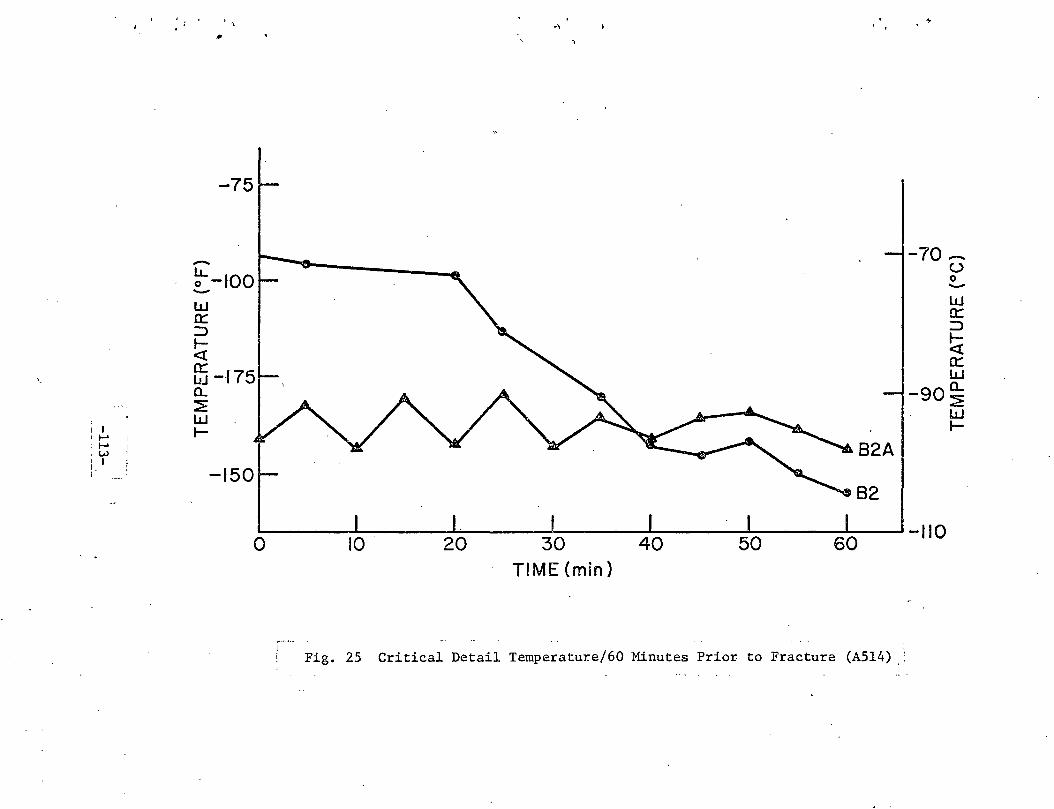
-75
- -70-LL. (.)
0 -100 0 --w w 0:: a:: ::::> ::::> ~ ~ <{ 0:: 0:
' I.JJ -~75 w 0... a.. ~
-90~ w w
I I- I-..... ..... 82A w I
-150 82
0 10. 20 30 40 50 60 -110
TIME (min)
Fig. 25 Critical Detail Temperature/60 Minutes Prior to Fracture (A514)

, r . '
~-50 -(.) 0 0 -w
-5o-w 0:: 0::: ::> ::::::> 1- ~ . ~-75 0:: w 84 w a.. a..
I ~ ~ ...... w ...... w I ,P... t-1 I 84A -701-
-100
0 10 20 30 40. 50 60 TIME (min)
Fig. 26 Cri"tica~ Detail Temperature/60 Minutes Prior to Fracture (A36)
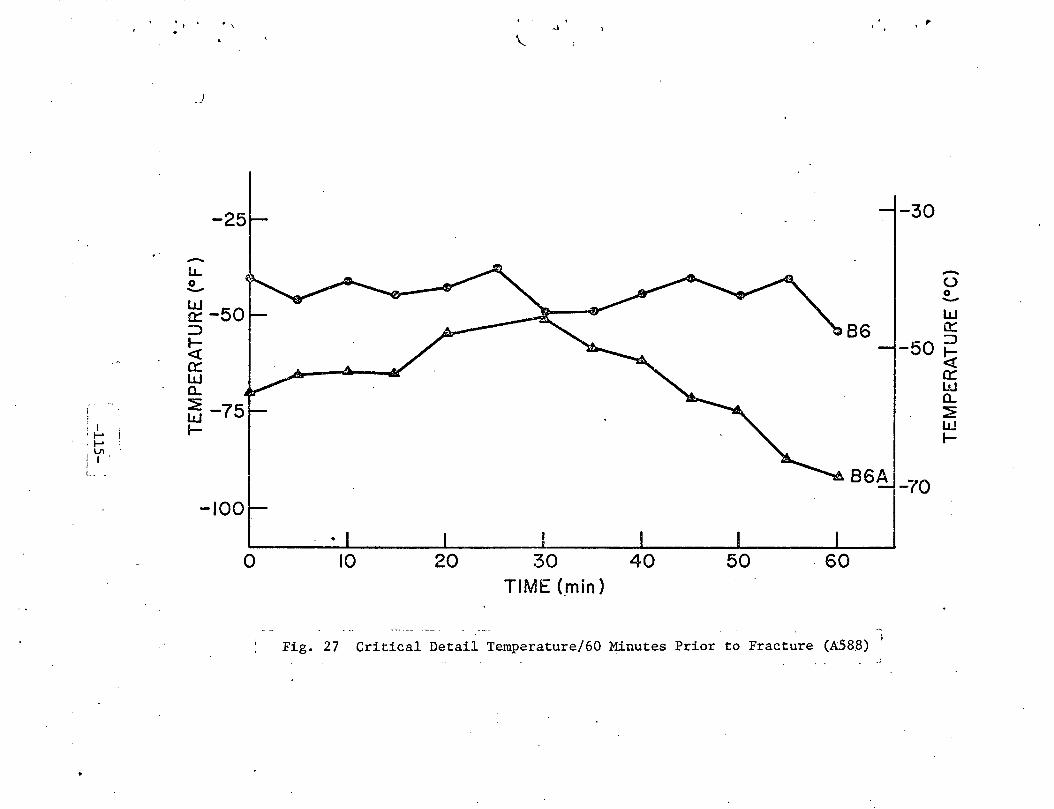
I . 1-' !
' 1-' ' V1 ' I I .
i
_)
-L1.. 0 -
. \
w 0:: -50 ::::>
~ 0:: w a.. ~ -75 w .._
-100
0
86
-30
-(.) 0 -w 0:::
-50~ <( 0:: w a.. ~ w .....
86A _70
10 20 30 TIME (min)
40 50 60
------ ---. -.
Fig. 27 Critical D.etail Temperature/60 Minutes Prior to Fracture (A58.8) ;
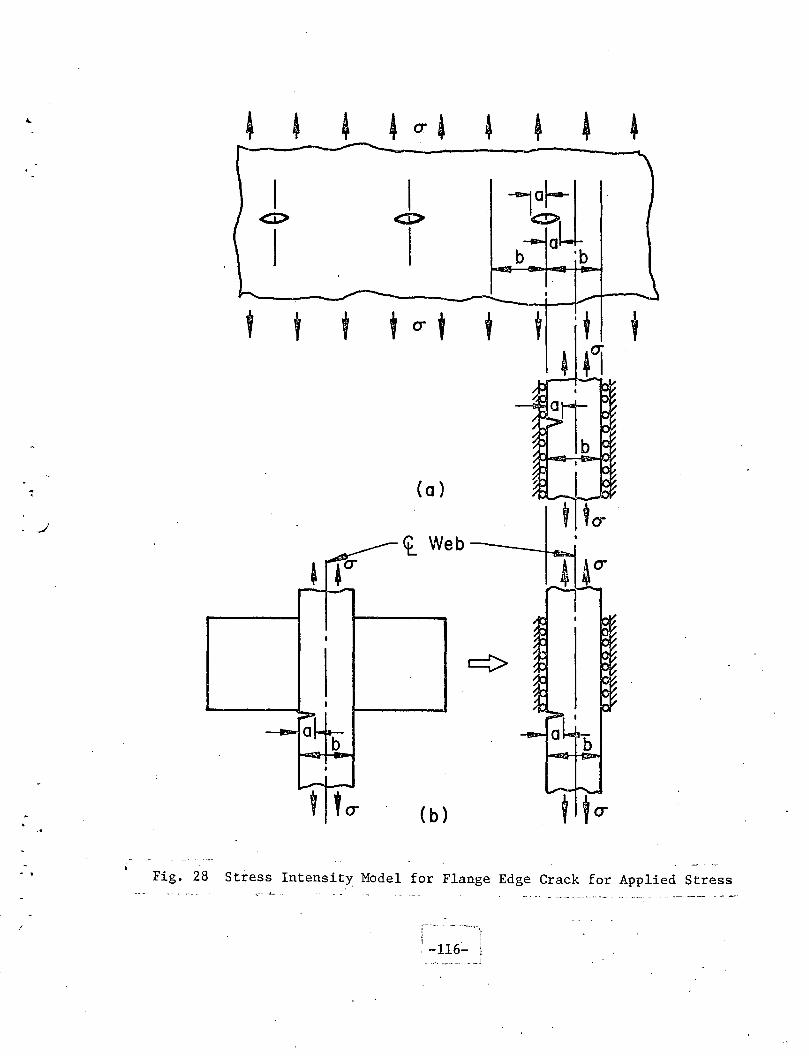
4 . -...I
-- . I -
I G:>
j
I <l>
I ~J b 'b
t t cr t V Y
(a)
(b)
Fig. 28 Stress Intensit~ Model for Flange Edge Crack for Applied Stress --·-- --. --- - .. -- ·"-- .. ··- ·-
r·--· -- --···., l . J
. -116- I - .... ---- -· __ j
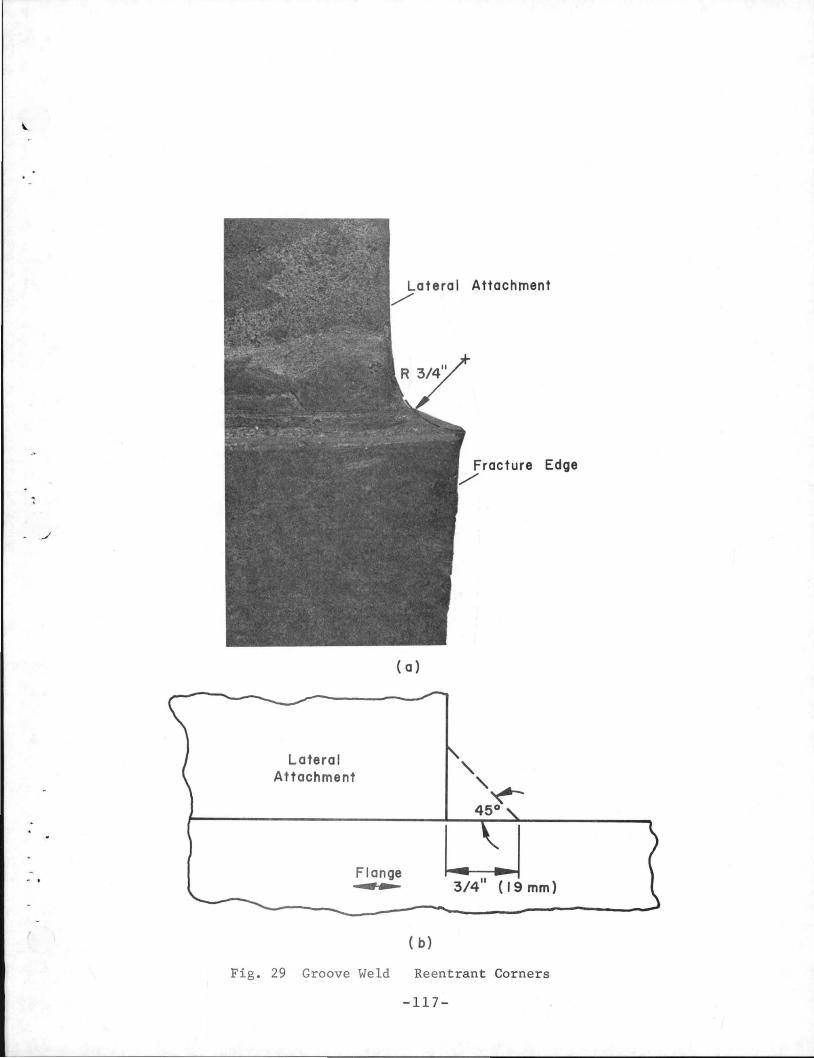
-J
Lateral Attachment
(a)
Flange
-~
( b)
Fracture Edge
u 3/4" ( 19 mm)
Fig. 29 Groove Weld Reentrant Corners
-117-
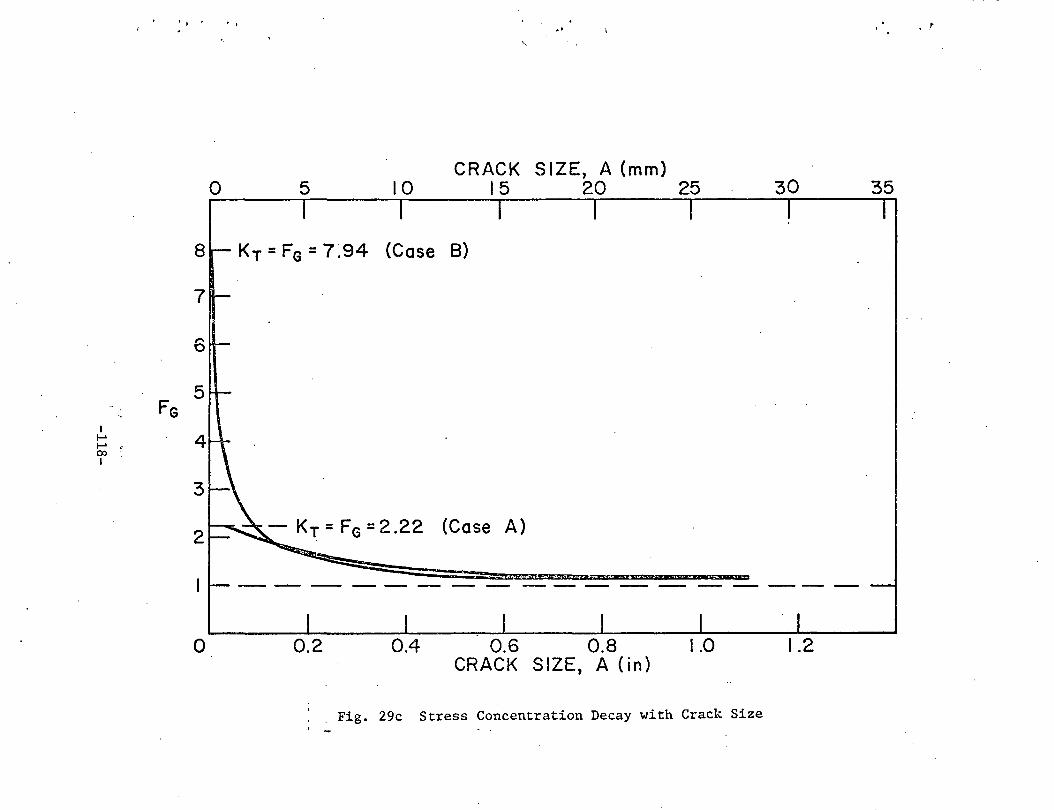
• i 't .. ' '
CRACK SIZE, A (mm) 0 5 10 15 20 25 30 35
8 KT=FG=7.94 (Case 8)
7
6
5 FG
I 1-' 1-' 00 I
3
2 - KT = FG =2.22 (Case A)
0 0.2 0.4 0.6 0.8 1.0 1.2 CRACK SIZE, A (in)
. Fig. 29c Stress Concentration Decay with Crack Size

., : I
f-' . f-' i \0 I I
'. ' .. ..
CRACK SIZE, A (mm) 0 5 I 0 I 5 20 25 30
lsor-----.------T~--~r-----~----~~--~~------
KTOT {A)= KAS {A) + KRS {A) + KLW (A)
Elliptical_ I_ · Corner ~Edge Crack
160
Crack
~120 K 120
tJ) ..X: ->-I-(J)
z w I-z
40 en (J) w 0:: I-(J)
0
-20 0 0.2 0.4 0.6 0.8 1.0
CRACK SIZE, A (in)
Fig. 30 Stress Intensity vs. Crack Size for Elliptical Corner Cracks (B2A, A514)
1.2
80
40
20
0
-20 1.4
. t
........
~ c
a_ :::E ->-I-(J)
z w .,_ z (/) (J) w 0:: t-(/)
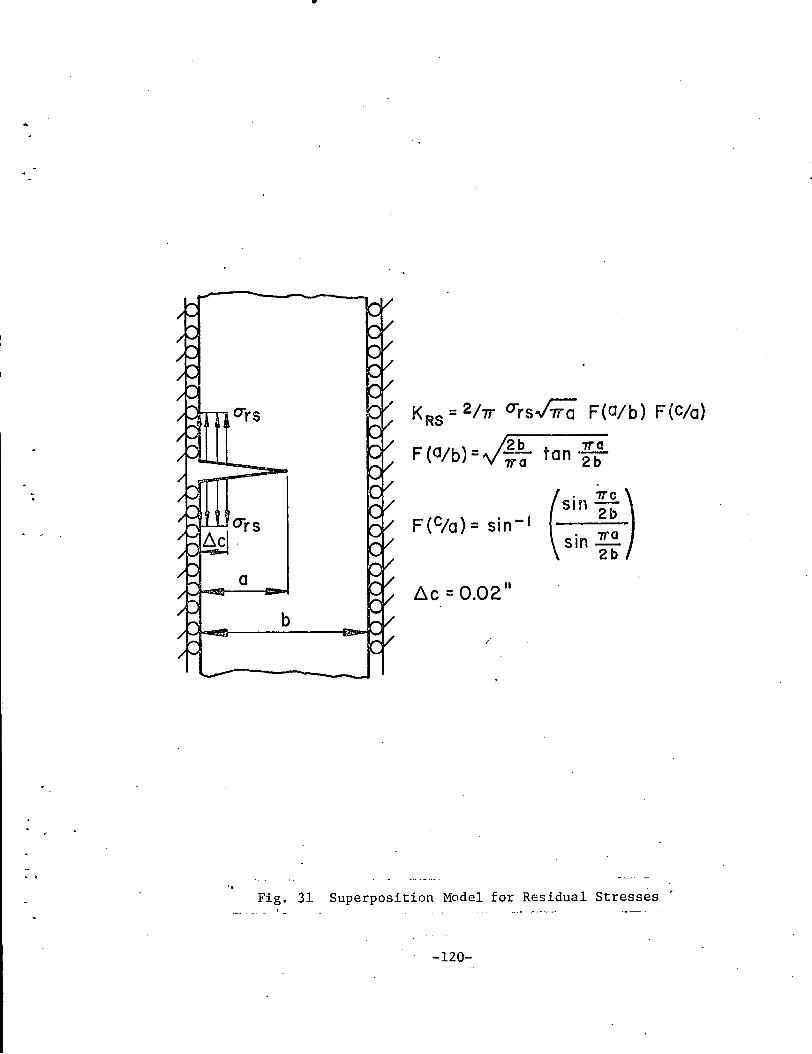
•
errs KRS = 2f7r Cirs~ F{O/b) F(C/a)
F {0/b) =.J2b 71"0 tan 21) 7ra
": c ~·) F(C/a)= sin-1 s1n 2b
sin~ 2b
a ~c = 0.02
11
b I
--.' ..
Fig. 31 Superposition Model for Residual Stresses
-120-

I 1-'
. N 1-' I
. '
360
280
200 K
(ksi ./In) 120
40
0
-40
EDGE 0 25
/ Failure
-
0 EDGE
Fig. 32 '
..
CRACK LENGTH (mm) 50 75 100
82 Bottom
K
{KLw
2 3 4 CRACI< LENGTH (in)
K vs. Edge Crack Size (B2, A514)
125
5
. ,.
360
280
200 K
120
40
0
-40
( MPa ..Jm')
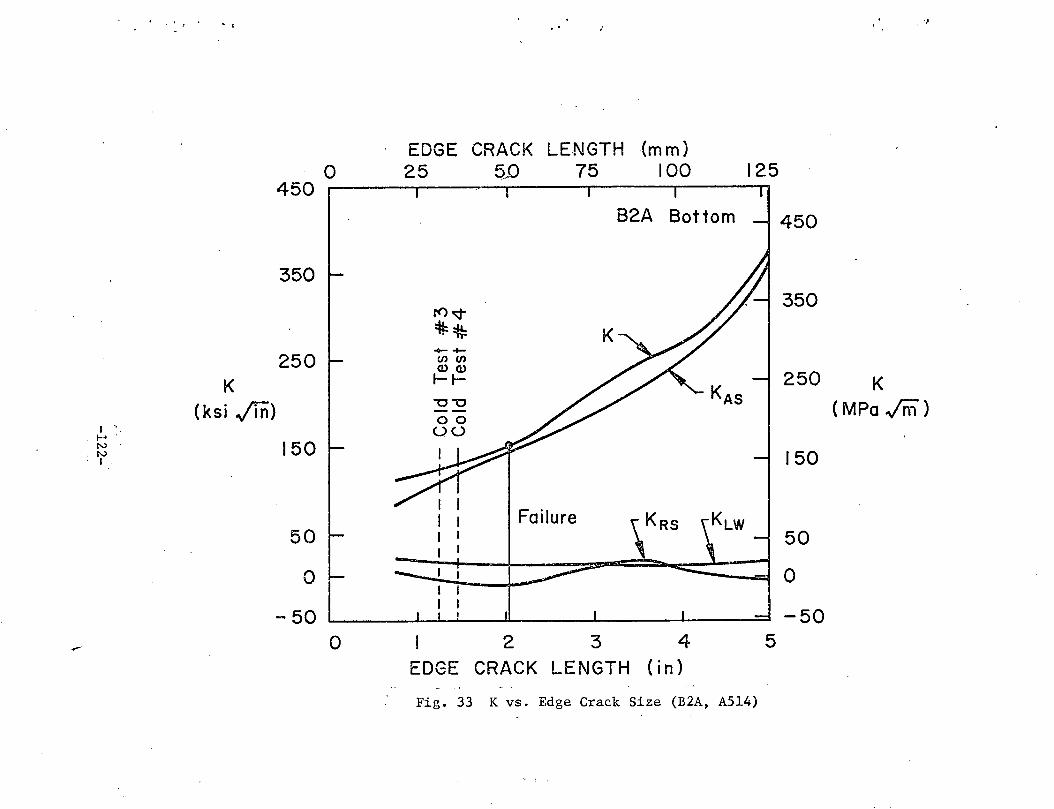
• I
K (ksi .jln)
I '. . t-• ..
N N I
450
350
250
150
50
0
-50
0
0
'.
EDGE CRACK LENGTH (mm) 25 oJJ 75 100 125
B2A Bottom
J"()o;;t
:tt:~ --CJ)CJ) Q)Q)
J---1-
'U "'0 --00 (.)(.)
I
Failure
I 1
2 3 4 5 EDGE CRACK LENGTH (in)
Fig. 33 K vs. Edge Crack Size (B2A, A514)
450
350
250
150
50
0
-50
.l
K (MPa.JrTi)

' I ....... N
·w
• ··r
. I !
K (ksi ./In)
0 240
180
120
60
0
\ ... ./
EDGE CRACK LENGTH (m m) 25 50 75 I 00 I 25 150
180
120 K ( MPa .jffi)
60
0
-60 ~~--~------L-----~------~----~ -60 0 1.2 2.4 3.6 4.8 6.0
EDGE CRACK LENGTH (in)
Fig. 34 K vs. Edge Crack Size (B4, A36)
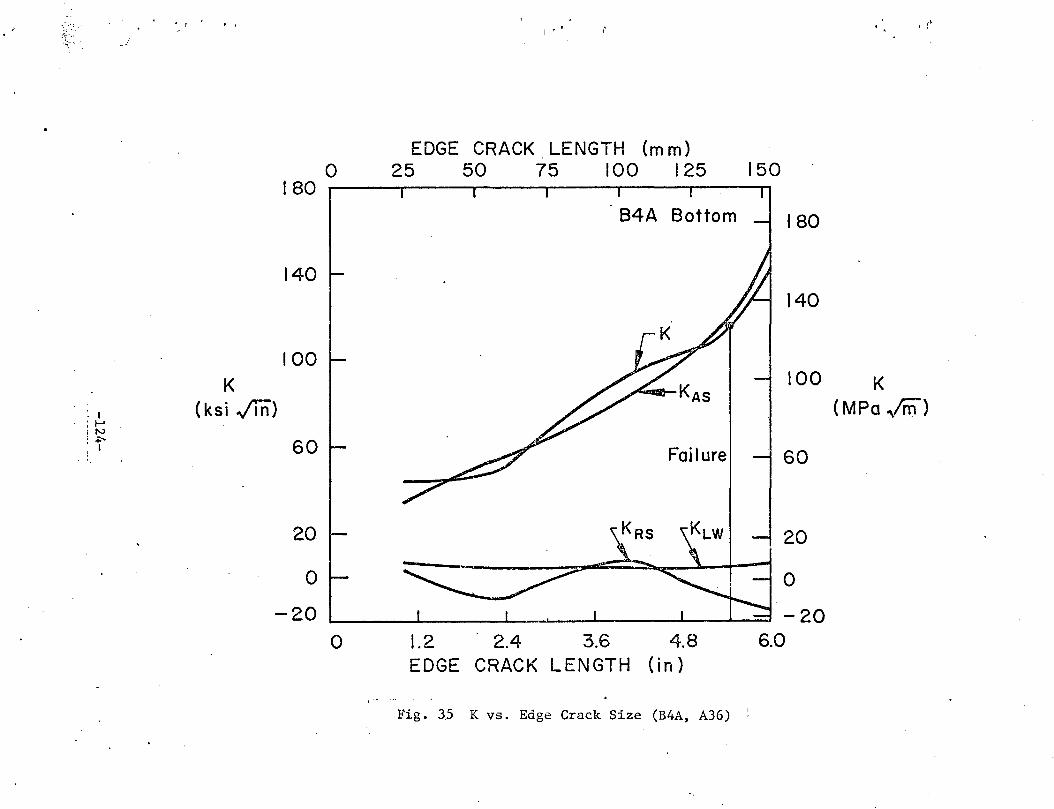
--~- --:~--- ----~-.
' '
I 1-' N _.::... I
. '
K ( ksi ./In)
0 180
140
100
60
20
I'
EDGE CRACK . LENGTH (m m) 25 50 75 I 00 I 25
84A Bottom
KAs
Fai I ure
150
180
140
100
60
20
0 0
-20 ~----~----~~~--~----~--~~ -20 0 1.2 2.4 3.6 4.8 6.0
EDGE CRACK LENGTH (in)
Fig. 35 K vs. Edge Crack Size (B4A, A36)
,, '.
K ( MPa .Jffi)
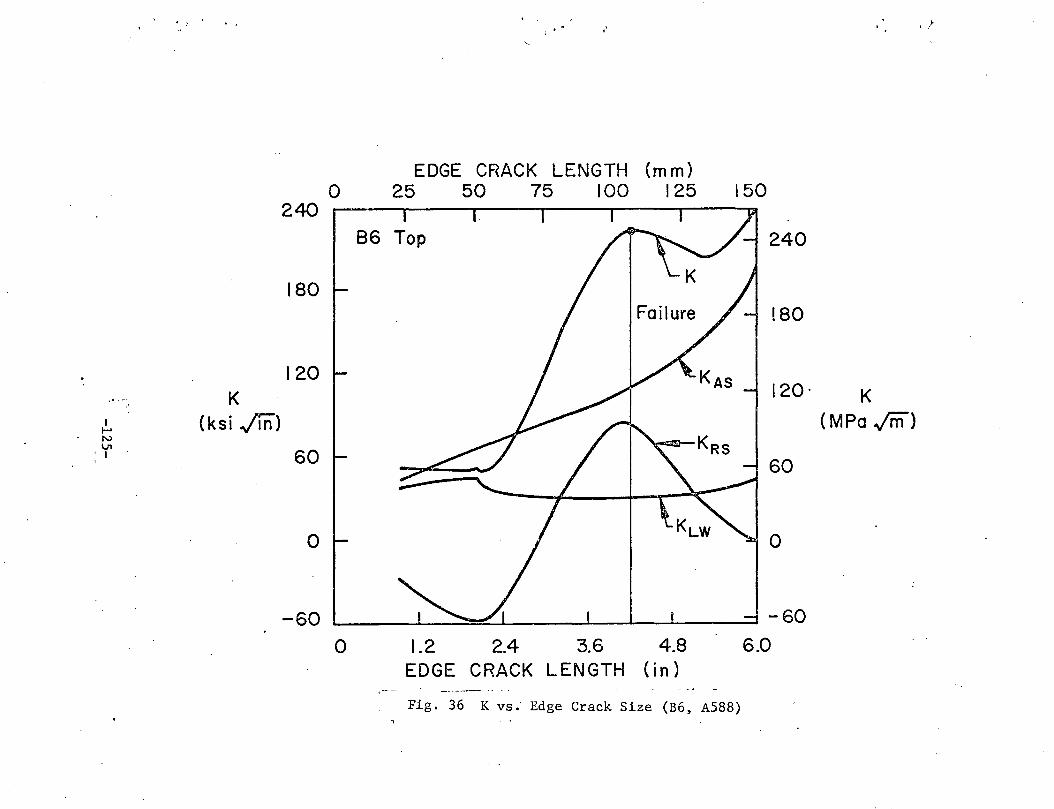
. '
K I (ksi ./In) 1-'
N
l'f '
0 240
180
120
60
0
,·
EDGE CRACK LENGTH (mm) 25 50 75 I 00 I 25
86
150
240
180
120·
60
0
-60 ~----~--~~~----~--~~------~ -60 0 1.2 2.4 3.6 4.8 6.0
EDGE CRACK LENGTH (in)
Fig. 36 K vs; Edge Crack Size (B6, A588)
.t
K (MPa ..,/m)
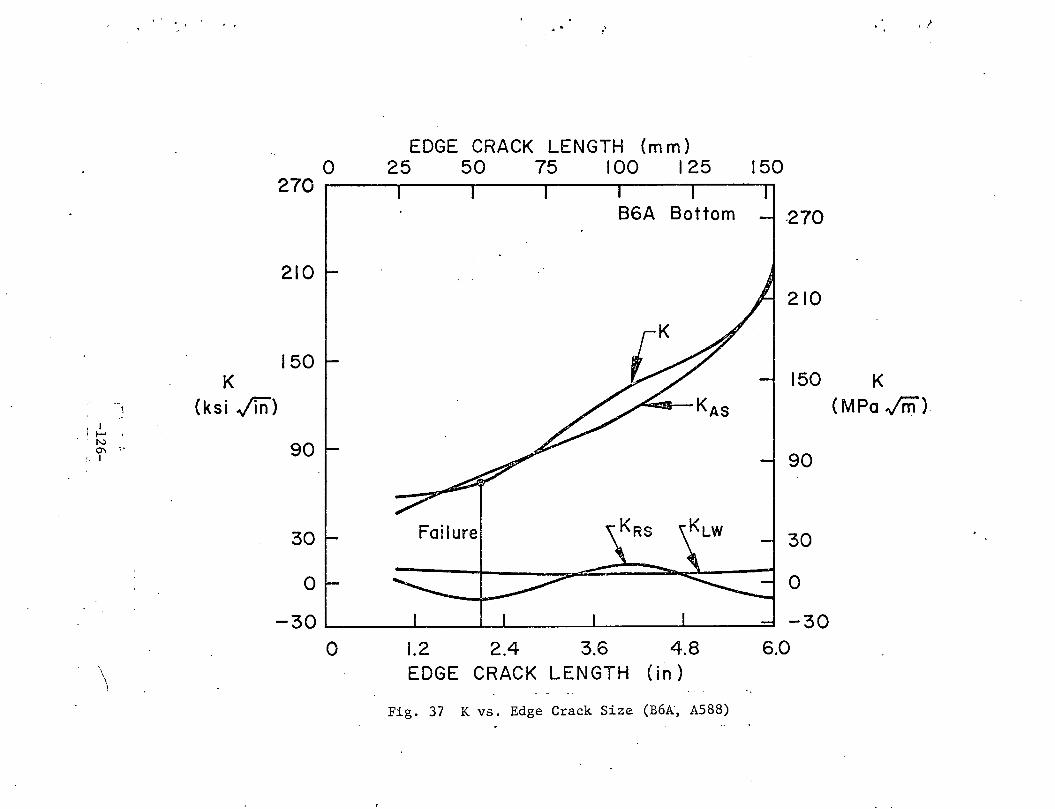
' I I 1-'
. 'N 0"1 •.•
'· I
\ \
. ' ..
0
. . ' •
EDGE CRACK LENGTH (m m) 25 50 75 I 00 I 25
,t
150 270 ~---~------~------~------~----~-----~
·270
210 210
150 K 150 K
(ksi ./in) (MPa ./ii1).
90 90
30 Failure 30
0 0
-30 -30 0 1.2 2.4 3.6 4.8 6.0
EDGE CRACK LENGTH (in )
Fig. 37 K vs. Edge.Crack Size (B6A, A588)
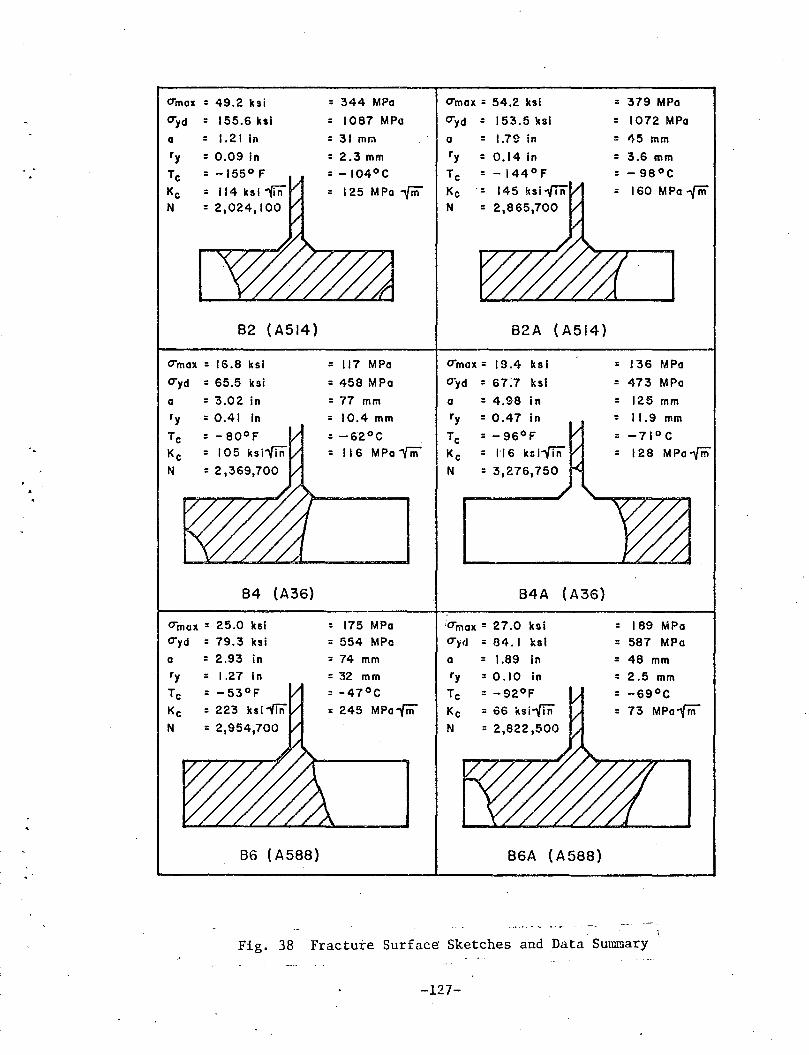
CTmax = 49.2 ksi : 344 MPa CTmax = 54.2 ksi = 379 MPa
CTyd = 155.6 ksl = 1087 MPa CTyd = 153.5 ksl = 1072 MPa
a = 1.21 in = 31 mm a = 1.79 in = 45 mm
ry = 0.09 in = 2.3 mm ry = 0.14 In = 3.6 mm
Te = -155° F = -104°C Tc = -144°F = - 98°C
Kc = 125 MPa iin Ke - = 160 MPa -(rii N N =
82 ( A514) 82A (A514)
CTmax = IG.8 ksi = 117 MPa CTmax = 19.4 ksl = 136 MPa
CTyd = 65.5 ksi = 458 MPa CTyd = 67:7 ksl : 473 MPa
a = 3.02 in = 77 mm a = 4.98 in = 125 mm
ry = 0.41 in = 10.4 mm ry = 0.47 In = 11.9 mm
Te = -62°C Tc =-96°F = -71°C -- Ke = 116 MPa "{'m Kc = 1'16 ksi""{in = 128 MPa -{ifi
N N = 3,276,750
84 (A36) 84A (A36) 1
CTmax = 25.0 ksi : 175 MPa 'CTmax = 27.0 kal : 189 MPa CTyd = 79.3 ksi = 554 MPa CTyd = 84.1 ksl = 587 MPa
a = 2.93 in = 74 mm a = 1.89 in = 48 mm ry = 1.27 in = 32 mm ry : 0.10 in = 2.5 mm
Te = - 53°F = -47°C Tc = -92°F = -69°C
Kc = 245 MPa-{iil Kc = 66 ksifn' = 73 MPa"{m
N N = 2,822,500
86 ( A588) 86A (A588)
Fig. 38 Fracture Surfac~ Sketches and Data Summary
-127-
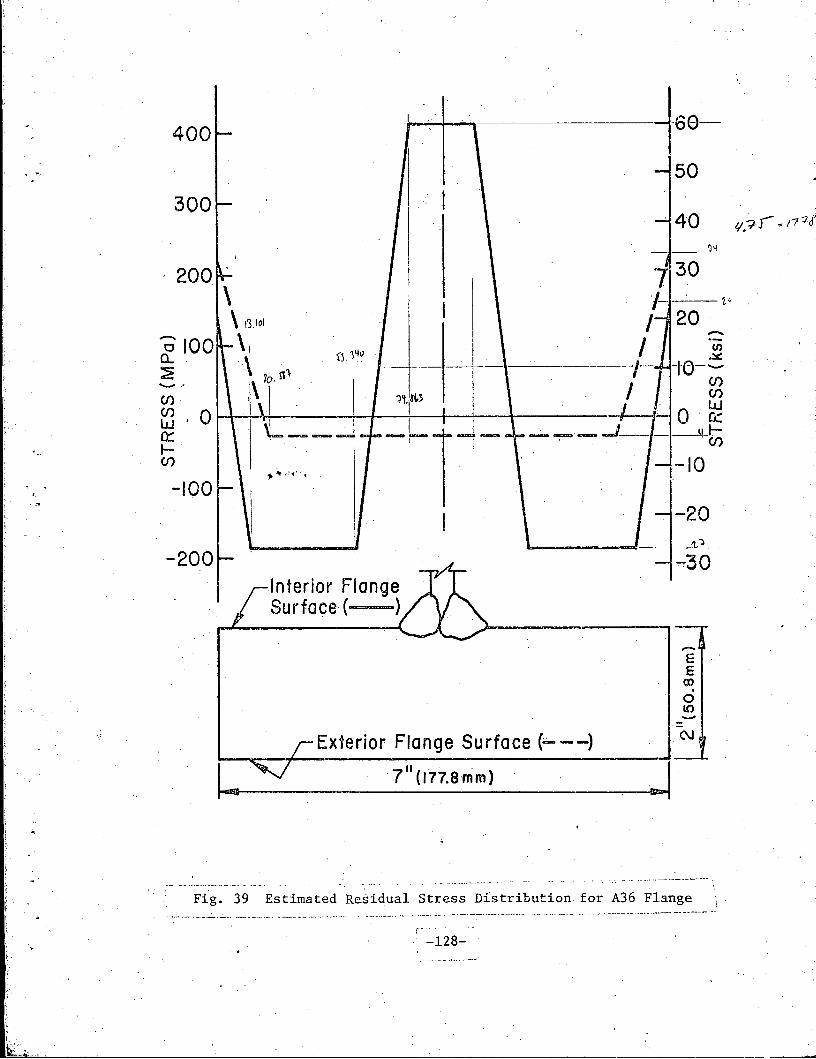
"'
.. , .
. . ~
L t.:;-.,,,,.
400
300
-100
-200
I
1ti~L3
-~~-i-
Interior Flange Surface ( )
1
Exterior Flange Surface (a---)
~60-50
. 40 ~'!
rn ~ -l·e-CJ) (/)
-20
-E E ro . 0 LO -
~~· _____________ 7 __ 11
(_1_77_._a_m_m_) __________ ~--~
Fig. 39 -Estimated Residual Stress Distribution for A36 Flange . . . --· ------ ----·--· ··---··-·-·· . -·----------- --- -· -···------·-··~--------· --- ---· ------------ ---- ____ ..,.. _____ -·- ---· ,_. ______ ···-·------ ------------
-128-
•:
ll.?r ~ ;7 '1i
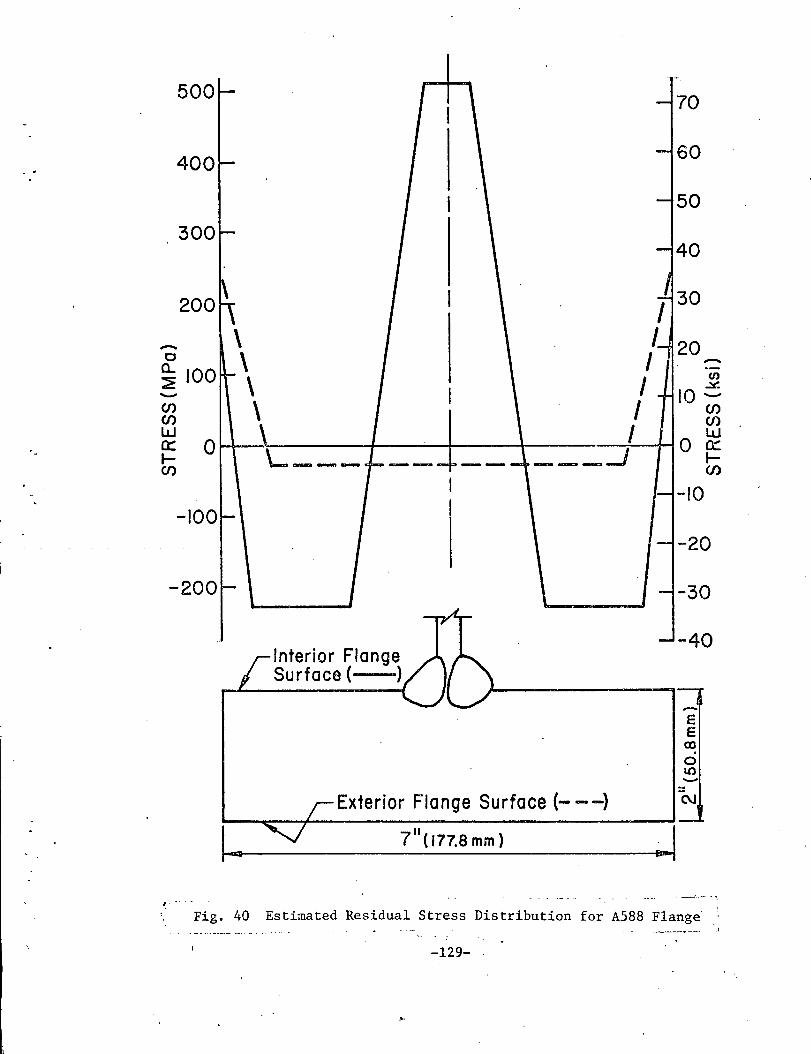
. .
. -
500
400
300
200
-0
~ 100 -U) Cf) w 0:: 0 ...... Cf)
-100
-200
..
- I ' I
-I
~
~ I
\ _\
\ I \ \ L--- ----F>--
r-
-' l
Interior Flange Surface ( )
I
~
-
-
-
-
1 I
/_ I I I I ______ _/
,_
-
\ -
-
70
60
50
40
30
20 -(/) ~
10-Cf) U) w
0 oc ...... en
-10
-20
-30
-40
-E E (J)
0
0 LO -
Exterior Flange Surface(---) (\j
7 11 ( 177.8 mm)
-129-
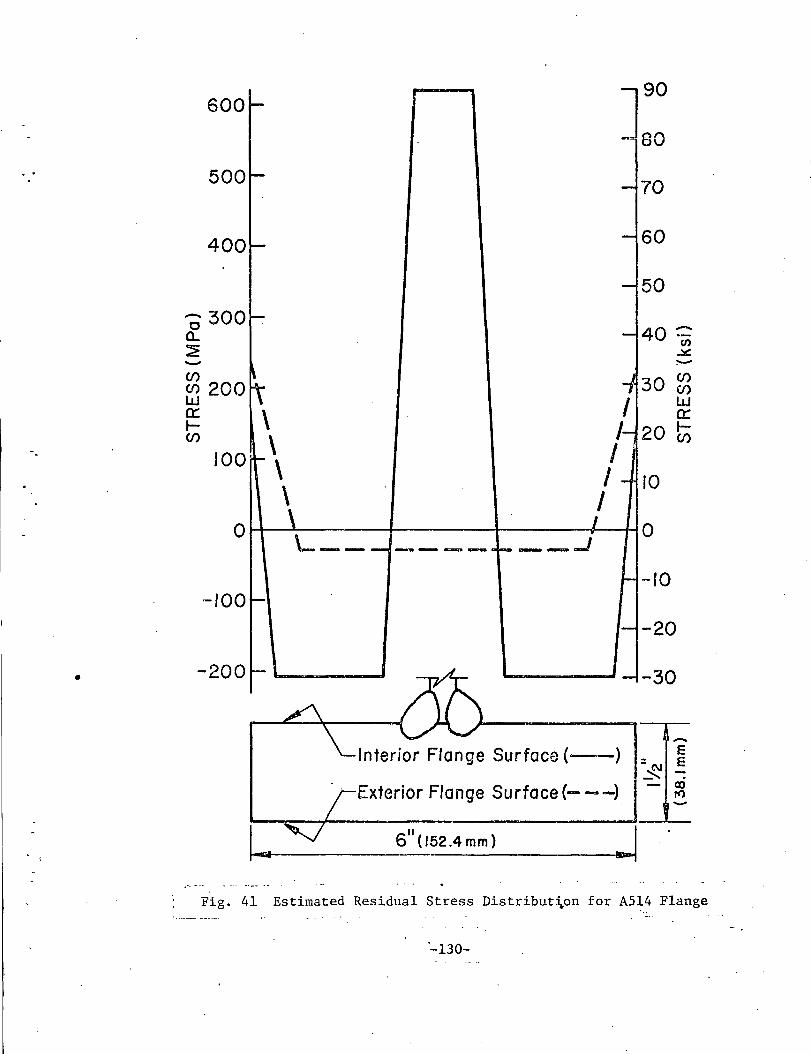
Interior Flange Surface(--)
Exterior Flange Surface(---)
II 6 (152.4mm)
-~
-E E -.
c:o f() -
Fig. 41 Estimated Residual Stress Distribut~on for A514 Flange
·-130-
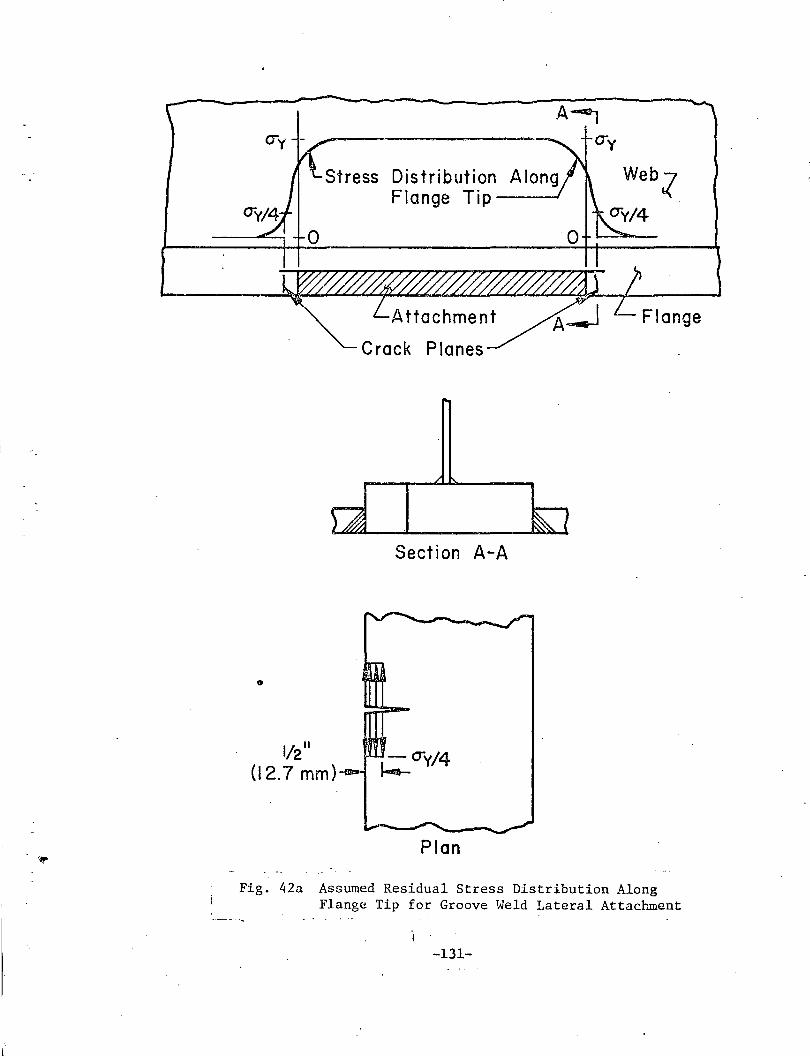
0
1/211
(12.7 mm)
Distribution Flange Tip ---J
Section A-A
-O"y/4 ~
Plan
Flange
Fig. 42a Assumed Residual Stress Distribution Along Flange Tip for Groove Weld Lateral Attachment
-131-

Crack PI anes
///// Fillet Welds
~
1 ~~~----t- ~Top 113 VJ ,- --------- Middle l/3 ~ -: - - - - - - -- Bottom 1/3 ~
0 I -5 CTyf4L:± } Local Residual Stress
_:; a-v/8 Distribution for Top Level g :e Qi o o Along Fillet Weld -o'-> ·--CD (1)1/)_J cu·-a::O ,.., _CI):::-. c Cl)
0~0. o-o ...JCI)r-
Section A-A
Fig. 42b Assumed Local Residual Stress Distribution for Fillet Weld Lateral Attachment
-132-
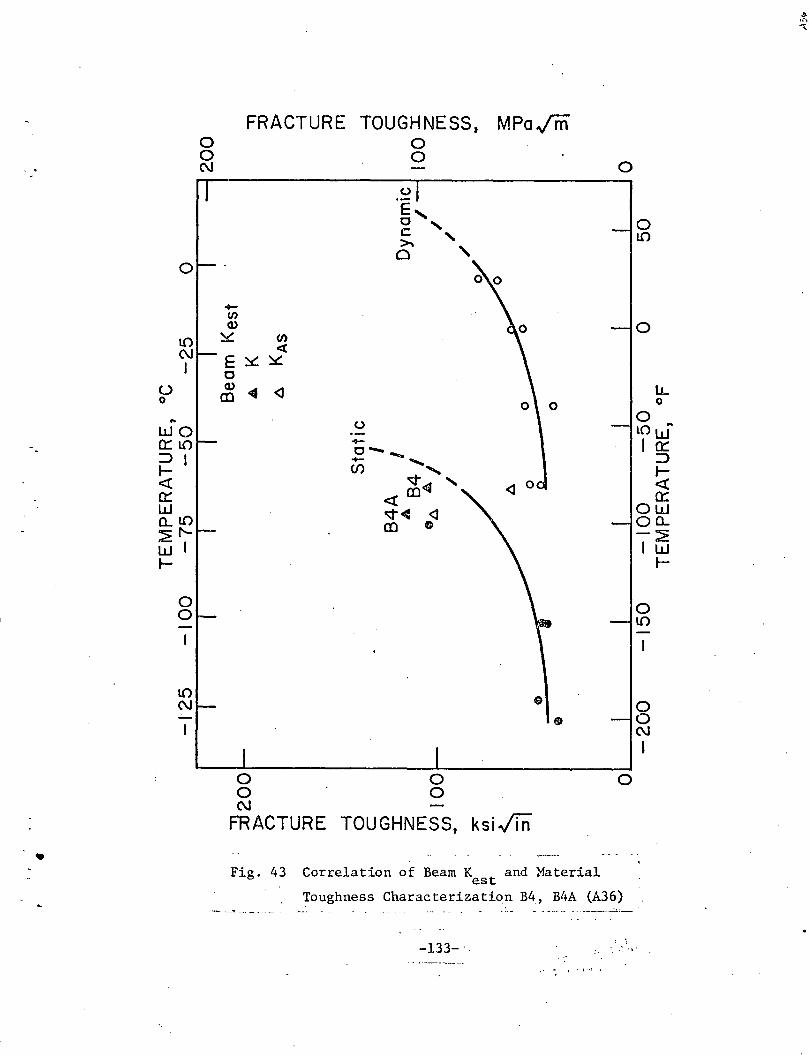
- . .
•
FRACTURE TOUGHNESS, MPa../ffi 0 0 0 0 C\1 -r-r--
0
E, 0 ' c ' c; ' 0
I +-1/)
QJ O.o
~ ~ ~ ~ ~,~ ~
(.) QJ -4 <J 0 (l) _\ 0
.. wo ~I.{)
=>I 1-<( a:: w Q..l.{) ::2:('--wl 1-
8t-
1.{) C\1
0 j +-o-....,. - ....... (/) ......
~~4 '\o '¢~ <J (l) c
\_
e
•
0 0 0 0 C\1
FRACTURE TOUGHNESS, ksi./ln
Fig. 43 Correlation of Beam K and Material est
0
-4g
--10
lL 0
0 l() ..
I~ ::::> 1-<( ~
ow oa.. -~ lw
1-
jO 1.{)
0
0 0 C\1 I
Toughness Characterizati~n B4, B4A (A36) •.. - - - - -- - - _____ .__:!.;_
-133-. i ·' ., .
. ',.;: ,.
~ .. ~, -..
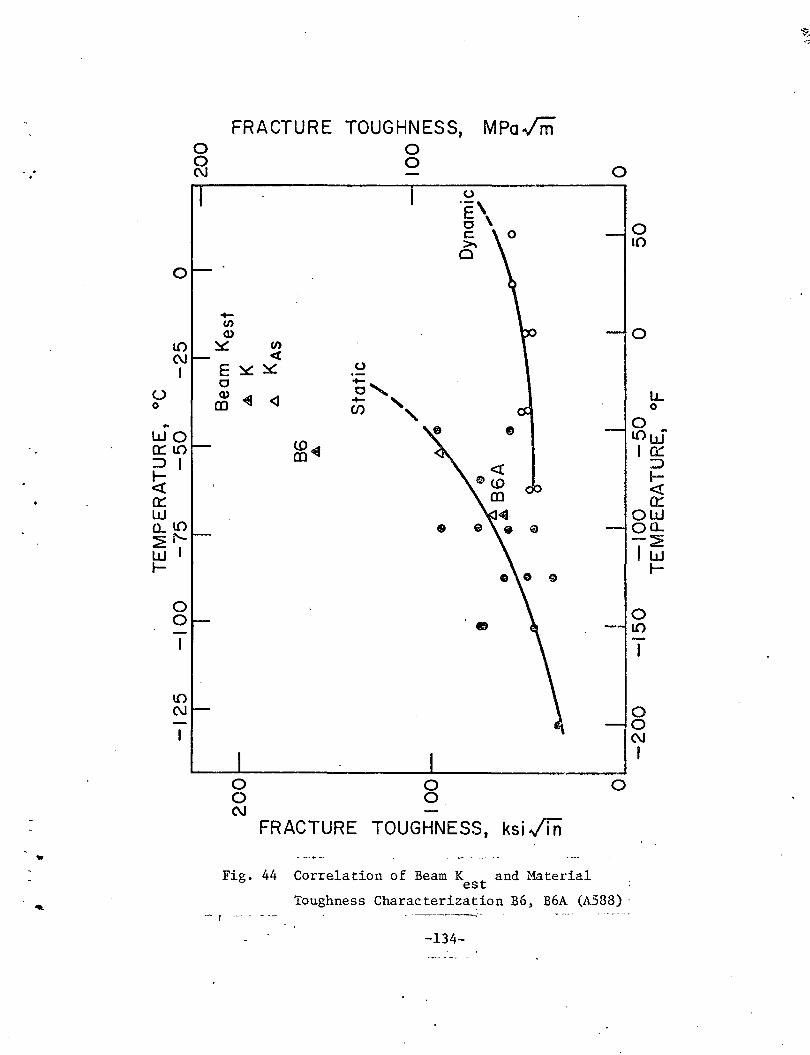
.. ...
(.) 0
..
0
1.() C\1 I
wo 0::1.()
=>I ~ 0:: w o._l()
~1'wl t-
0 0
I
l()
C\1
FRACTURE TOUGHNESS, MPa../m 0 0 2 0
-(/)
Q)
~ C/) <(
E~~ 0
~ ~ <3
0 0 C\1
<.0~ CD
0
;,..._ U> ,,
0 0
0 .E, 0 \ c (S
FRACTURE TOUGHNESS, ksi ./Ti1
Fig. 44 Correlation of Beam K and Materiai est
0
0
Toughness Characterization B6, B6A (A588) · - r --- -----------·-
-134-
0 lO
0
0
lJ_ 0
l{) ..
I~ :::::> t<( 0:: ow
oa.. -~ lw
1-
0 l()
0 0 C\1 I
~-.-,;

FRACTURE TOUGHNESS, MPaJrn 0 0 0 0 0 C\J -
0 0 I llO -·or E o, ~ ' 0 0\ -(I) ---10 Cl)
~~ ~
E (/) 0
0) <(
CD~~ (.) - au.. 0 0 l()o
0 -0 - ...... lw .. I.() - ...... WI U)_, 0::: 0::: ::> :::::> .,__ t-<J: o<t 0::: lO oo::: wr-- -W 0..1
fi!) 10.. ~ ::?! w w .,__ .,__
0 <J:
\ l~ 0 C\J~<l
- OJ C\J~ <l I CD
I
~r- e\ --1~ I
0 0 0 0 0 C\J -
FRACTURE TOUGHNESS, ksi .Jin
~ Fig. 45 ·correlation of Beam K and Material est
Toughness Characterization B2, B2A (A514) <.'
-135-
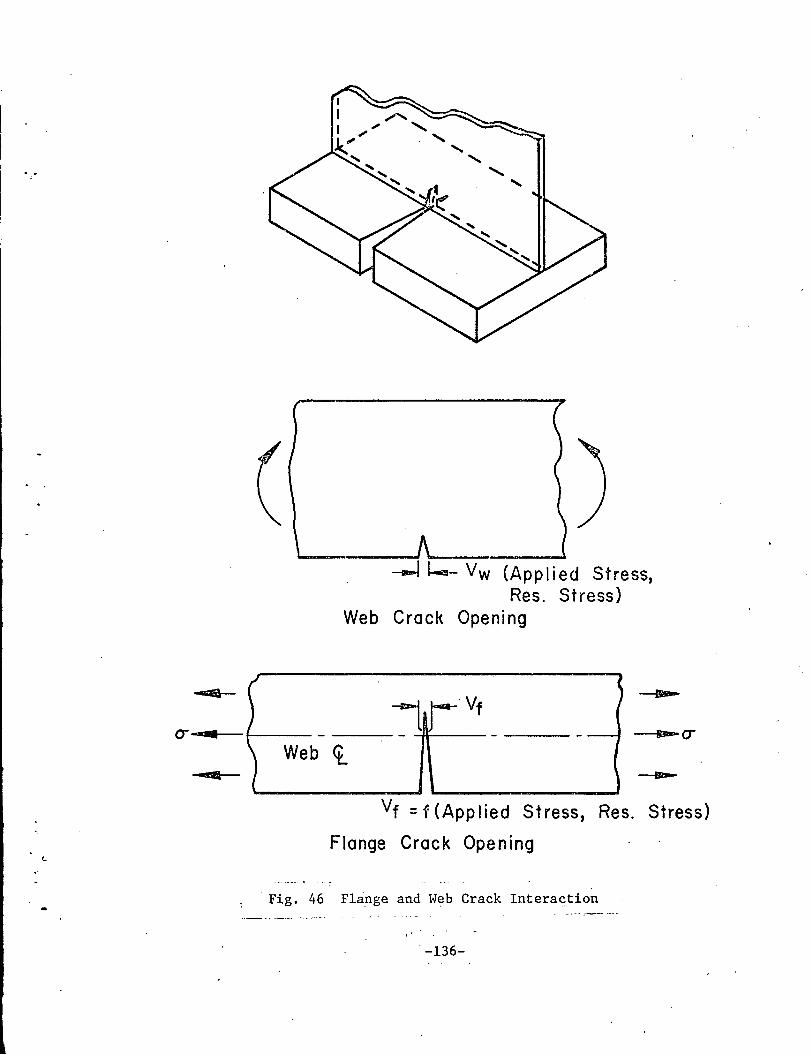
- ( )
(j .. I
\ .. ) I
----1 ~- Vw (Applied Stress, Res. Stress)
Web Crack Opening
lrVf --- ----- --BJa-(j
Web ct_ I , ----
~--------------~ Vf = f (Applied Stress, Res. Stress)
Flange Crack Opening
Fig. 46 Flange and Web Crack Intera~tion
. -136-
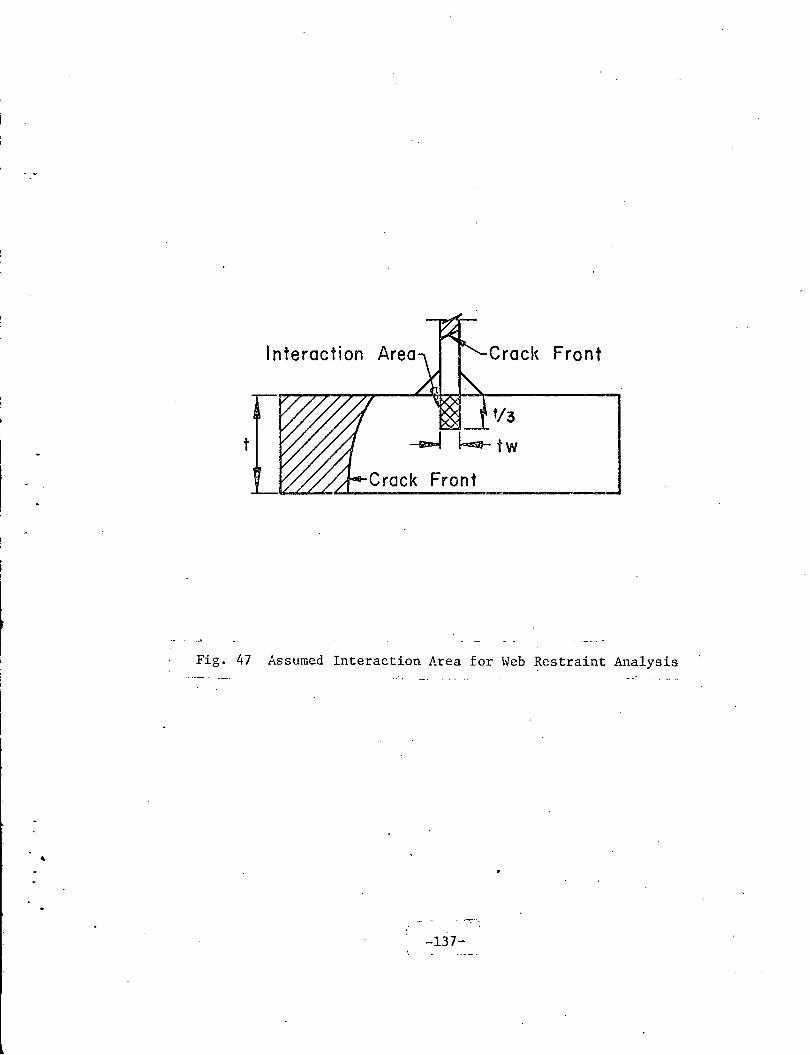
Interaction Crack Front
t
Fig. 47 Assumed Interaction Area for Web Restraint Analysis
-137-
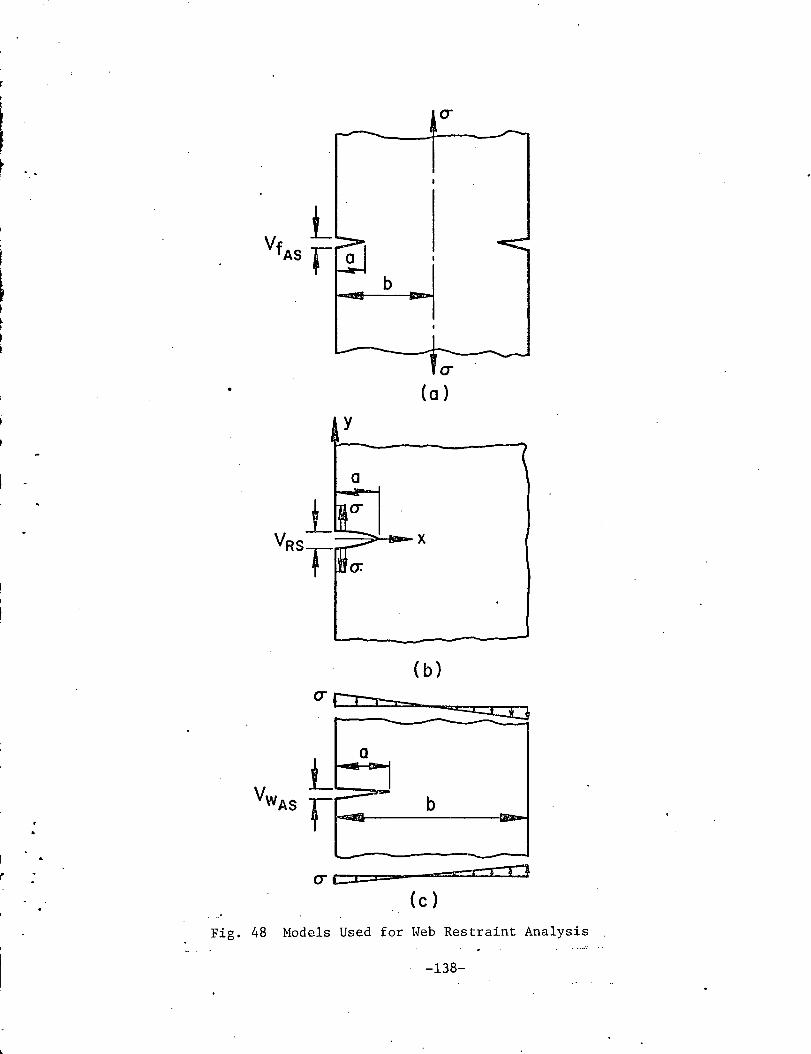
. '.
'
l b f
t (j
(a)
y
(b)
b
,, (c)
Fig. 48 Models Used for Web Restraint Analysis
-138-
. •
REFERENCES
1.. Fisher, J. vl., Frank, K. H., Hirt, M. A. and McNamee, B. H . EFFECT OF ~~LDMENTS ON THE FATIGUE STRENGTH OF STEEL BEAMS, NCHRP Report No. 102, Highway Research Board, National Academy of Science - National Research Council, Washington, D.C., 1970.
2. Fisher, J. W., Albrecht, P. A., Yen, B. T., Klingerman, D. J. and McNamee, B. M.
FATIGUE STRENGTH OF STEEL BEAHS WITH TR&~SVERSE STIFFENERS AND ATTACHMENTS, NCHRP Report No. 147, Highway Research Board, National Academy of Science - National Research Council, Washington, D.C., 1974.
3. Tada, H. and Irwin, G. R. ·K-VALUE ANALYSIS FOR CRACKS IN BRIDGE STRUCTURES, Fritz Engineering Laboratory Report No. 399.1, Lehigh University, June .1975.
4. Brothers, A. J. and Yukawa, S. THE EFFECT OF WARM PRESTRESSING ON NOTCH FRACTURE STRENGTH, Paper No. 62-Met-1, ASME Headquarters, January 1962.
5. Succop, L. N., Pense, A. W. and Stout, R. D. THE EFFECTS OF WARM OVERSTRESSING ON PRESSURE VESSEL STEEL PROPERTIES, Welding Journal Research Supplement, August 1970.
6. Roberts, R., Irwin, G. R., Krishna, G. V. and Yen, B. T. FRACTURE TOUGHNESS OF BRIDGE STEELS, Federal Highway Administration Report No. FHWA RD-74-57, September 1974.
7. Luft, D. E., Madison, R. B. and Irwin, G. R. MEASURE}ffiNT OF DYNAHIC K FROH DROP-\lliiGHT TEAR TEST, Fritz
c Engineering Laboratory Report 335.1, Lehigh University, 1969.
8. Irwin,·G. R. LINEAR FRACTURE MECHANICS, FRACTURE TRANSITION fu.'l'D FRACTURE CONTROL, Engineering Fracture Mechanics, Vol. 1, pp. 241-257, 1968.
9. Madison, R. B. APPLICATION OF F~~CTURE MECF~ICS TO BRIDGES, Ph.D. Disseration, Fritz Engineering Laboratory Report No. 335.2, Lehigh University, 1969.
-139-

..,
•
10. ASTM Tentative Standard TENTATIVE METHOD OF TEST FOR PLAIN STRAIN FRACTURE TOUGHNESS OF METALLIC MATERIALS, E399-70T.
11. Barsom, J. M. INVESTIGATION OF TOUGHNESS CRITERIA FOR BRIDGE STEELS, U.S.S. Research Laboratory Report No. 97.018-001(5), February 1973.
12. Paris, P. D., Gomez, M. P. and Anderson, W. E. A RATIONAL ANALYTICAL THEORY OF FATIGUE, The Trend in Engineering, University of Hashington, Vol. 13, No. 1, January 1961.
13. Albrecht, P. and Yamada, K. RAPID CALCULATION OF STRESS INTENSITY FACTORS, Paper submitted for publication in the Journal of the Structural Division, ASCE.
14. Tada, H., Paris, P. and Irwin, G . THE STRESS ANALYSIS OF CRACKS HANDBOOK, Del Research Corporation, Hellertown, Pennsylvania, 1973 .
15. Alpsten, G. A. and Tall, L. RESIDUAL STRESSES IN HEAVY WELDED SHAPES, Welding Journal, Vol. 49, March 1970.
16. McFalls, R. K. and Tall, L. A STUDY OF WELDED COLill1NS MANUFACTURED FROM FLAME-CUT PLATES, Welding Journal, Vol. 43, April 1969.
17. Madison, R. B. APPLICATIONS OF FRACTURE MECHANICS TO BRIDGES, Fritz Engineering Laboratory Report No. 335.2, Lehigh University, June 1969.
18. American Association of State Highway Officials STANDARD SPECIFICATIONS FOR HIGHWAY BRIDGES, .AASHTO, Washington, D.C., 1973.
19. Zettlemoyer, N. STRESS CONCENTRATION AND FATIGUE OF WELDED DETAILS, Ph.D. Dissertation in preparation, 1976.
-140-


