WISE M NEY its generic anti-bacterial moxifloxacin hydrochloride tablets in the American market. •...
20
WISE M NEY A Weekly Update from SMC (For private circulation only) th 14 SEPTEMBER, 2016 A FESTIVAL OF HAPPINESS & PROSPERITY 2016: Issue 544, Week: 12th-15th September Brand smc 368
Transcript of WISE M NEY its generic anti-bacterial moxifloxacin hydrochloride tablets in the American market. •...

WISE M NEYA Weekly Update from SMC
(For private circulation only)
th14 SEPTEMBER, 2016
A FESTIVAL OF HAPPINESS & PROSPERITY
2016: Issue 544, Week: 12th-15th September
Bra
nd s
mc
368


Contents
Equity 4-7
Derivatives 8-9
Commodity 10-13
Currency 14
IPO 15
FD Monitor 16
Insurance 17
Mutual Fund 18
SMC RESEARCH TEAMREGISTERED OFFICES:
11 / 6B, Shanti Chamber, Pusa Road, New Delhi 110005.
Tel: 91-11-30111000, Fax: 91-11-25754365
MUMBAI OFFICE:
Dheeraj Sagar, 1st Floor, Opp. Goregaon sports Club, Link Road
Malad (West), Mumbai 400064
Tel: 91-22-67341600, Fax: 91-22-28805606
KOLKATA OFFICE:
18,Rabindra Sarani, Poddar Court, Gate No-4,5th Floor, Kolkata-700001
Tel : 91-33-39847000 Fax No : 91-33-39847004
AHMEDABAD OFFICE :
10/A, 4th Floor, Kalapurnam Building, Near Municipal Market,
C G Road, Ahmedabad-380009, Gujarat
Tel : 91-79-26424801 - 05, 40049801 - 03
CHENNAI OFFICE:
Salzburg Square, Flat No.1, III rd Floor, Door No.107, Harrington Road,
Chetpet, Chennai - 600031.
Tel: 044-39109100, Fax -044- 39109111
SECUNDERABAD OFFICE:
206, 3rd Floor, above CMR Exclusive, Bhuvana Towers, S.D.Road,
Secunderabad - 500003
Tel: 91-40-30780298/99, 39109536
DUBAI OFFICE:
312, Belshalat Building, Al Karama, Dubai, P.O. Box 117210, U.A.E.
Tel: 97143963120, Mobile : 971502612483
Fax : 9714 3963122
Email ID : [email protected]
NEW YORK OFFICE:
Alliance Bernstein Building
1345 Avenue of the Americas
Second Floor
New York, NY 10105
Phone: (212) 878-3684
Toll-Free: (855) 589-1915
Fax: (866) 852-4236
Printed and Published on behalf of
Mr. Saurabh Jain @ Publication Address
11/6B, Shanti Chamber, Pusa Road, New Delhi-110005
Website: www.smcindiaonline.com
Investor Grievance : [email protected]
Printed at: S&S MARKETING
102, Mahavirji Complex LSC-3, Rishabh Vihar, New Delhi - 110092 (India)
Ph.: +91-11- 43035012, 43035014, Email: [email protected]
From The Desk Of Editor
(Saurabh Jain)
SMC Global Securities Ltd. (hereinafter referred to as “SMC”) is a registered Member of National Stock Exchange of India Limited, Bombay Stock Exchange Limited and its associate is member of MCX stock Exchange Limited. It is also registered as a Depository Participant with CDSL and NSDL. Its associates merchant banker and Portfolio Manager are registered with SEBI and NBFC registered with RBI. It also has registration with AMFI as a Mutual Fund Distributor.
SMC has applied with SEBI for registering as a Research Entity in terms of SEBI (Research Analyst) Regulations, 2014. SMC or its associates has not been debarred/ suspended by SEBI or any other regulatory authority for accessing /dealing in securities Market.
SMC or its associates including its relatives/analyst do not hold any financial interest/beneficial ownership of more than 1% in the company covered by Analyst. SMC or its associates and relatives does not have any material conflict of interest. SMC or its associates/analyst has not received any compensation from the company covered by Analyst during the past twelve months. The subject company has not been a client of SMC during the past twelve months. SMC or its associates has not received any compensation or other benefits from the company covered by analyst or third party in connection with the research report. The Analyst has not served as an officer, director or employee of company covered by Analyst and SMC has not been engaged in market making activity of the company covered by Analyst.
The views expressed are based solely on information available publicly available/internal data/ other reliable sources believed to be true.
SMC does not represent/ provide any warranty express or implied to the accuracy, contents or views expressed herein and investors are advised to independently evaluate the market conditions/risks involved before making any investment decision.
lobal stock markets during the end of the week came off from the highs as central
banks like European Central Bank (ECB) & Bank of Japan (BoJ) were seen taking Gmeasures approach towards more monetary easing. Also the weak data out of
U.S. pertaining to service sector growth also dampened the outlook for interest rate hike.
Data released showed the US Institute for Supply Management (ISM) non-manufacturing
purchasers manager index (PMI) index fell to 51.4 in August from 55.5 in July. In the
monetary policy review meeting ECB kept interest rates unchanged and did not resort to
increase the asset purchase program but said that the monthly asset purchases of €80
billion are intended to run until the end of March 2017, or beyond as it sees the downside
risks to the economy. Japanese economic expansion data for the second quarter was
upwardly revised to 0.7%, just before the closely watched BoJ monetary policy review
meeting this month, weakening the case for expanding the stimulus.
Back at home, on the macro front, the outcome of a monthly survey showed that August saw
a solid rebound in the rate of expansion in Indian service sector business activity. Data
released showed that the seasonally adjusted Nikkei India Services Business Activity Index
rose to 54.7 in August, up from 51.9 in July, posting its highest level for over three-and-a-
half years. Foreign institutional investors largely remained on the buy side in the Indian
equities. From here, it is expected that market will continue to move upwards. Upcoming
major macro-economic data, crude oil prices, rupee movement coupled with trends in
global indices and the pace of foreign funds inflow, will dictate the trend of the global
markets in coming weeks.
On the commodity market front, commodity prices augmented last week on some improved
economic condition of China amid some fall in dollar index. CRB closed above 186 levels.
Even Baltic Dry Index has rebounded and the international shipping market improved. In
coming days, crude oil prices may trade up as speculation about production cut in this
month OPEC meeting and weaker greenback can support the prices. OPEC and non-OPEC
producers such as Russia are expected to discuss the issue at informal talks in Algeria on
Sept. 26-28. Gold can trade in range of 30800-31800 while silver can move in range of
45400-47800 in near term. Euro-Zone ZEW Survey, CPI of UK, GDP of Newzealand,
Unemployment Rate of Australia, Bank of England Rate Decision, BOE Asset Purchase
Target, Advance Retail Sales, CPI and U. of Michigan Confidence of US etc are few important
data and events, which should be taken care of.

NEWS
DOMESTIC NEWSEconomy• India's private sector activity expanded at the fastest pace in three-and-a-
half years in August, survey figures from Markit Economics. The Nikkei Composite Purchasing Managers' Index, climbed to 54.6 in August from 52.4 in July. Any reading above 50 indicates expansion in the sector. The Services Business Activity Index also rose to 54.7 in August from 51.9 a month ago.
Information Technology• Wipro has won an IT contract from NSB Group, one of Norways largest
transportation groups. As part of the three-year agreement, Wipro will implement its Boundaryless Datacentre (BLDC) and LiVE Workspace solutions and utilise its next-generation delivery framework ServiceNXT to deliver services, which will help NSB variablise their IT operations.
• Zensar Technologies has secured the digital transformation project from Avis Fleet in South Africa. Spread over a time period of two years, it involves scalability and agility to the Company's strategic technology roadmap. The overall implementation to be dividend into two phases will focus on enhancing the varied legacy technology platforms and integration of digital technologies like Agile and DevOps in building a strategic IT framework.
Packaging• Uflex Limited, the flexible packaging materials and solution company, has
launched ESL aseptic flexi-pouch machine for packaging milk that can extend the shelf life of the product upto 90 days. Uflex claims to be the only company in India to manufacture this kind of sophisticated machines.
Automobiles• Tata Motors has received orders for over 5,000 buses from 25 state and city
transport undertakings across the country. This represents a healthy growth of over 80 percent plus compared to last year in the order book position for Tata Motors.
• Maruti Suzuki, which recently made entry into the commercial vehicle segment, will launch its first LCV 'Super Carry' across the country in phases.
Pharmaceuticals• Lupin has received tentative approval from the US health regulator to
market its generic anti-bacterial moxifloxacin hydrochloride tablets in the American market.
• Aurobindo Pharma expects to launch 19 approved products that have an addressable market of $6.8 billion in the US in the next three quarters.
Realty/ Construction• Ahluwalia Contracts has bagged orders worth ̀ 244.13 crore for construction
of a hospital for Chittaranjan National Cancer Institute at Kolkata.• NBCC has bagged projects worth ̀ 614.83 crore last month. The NBCC had got
a business of ̀ 344.72 crore in July.Mining & Minerals• Coal India will develop solar power plants of 600 MW capacity in four states,
including West Bengal and Maharashtra, under the second phase of its plan to set up a total 1,000 MW green energy plants.
• Vedanta will invest up to ̀ 3,000 crore in copper operations to double the capacity to 8 lakh tonnes by 2019, making the firm India's largest producer of the metal.
Finance• Reliance Capital plans to increase customer base to 50 million from 20
million along with a fivefold expansion of reach to 25,000 cities and towns over the next 3-5 years.
Oil & Gas• Indian Oil Corp (IOC), the nation's largest oil company, plans to nearly double
refining capacity to 150 million tonnes by 2030 to meet fast expanding energy needs of the country.
INTERNATIONAL NEWS• US jobless claims dipped to 259,000, a decrease of 4,000 from the previous
week's unrevised level of 263,000. The modest drop in claims came as a surprise to economists, who had expected initial jobless claims to inch up to 264,000.
• US non-manufacturing index tumbled to 51.4 in August from 55.5 in July, falling to its lowest level since February of 2010. While a reading above 50 indicates continued growth in the service sector, economists had expected the index to show a much more modest drop to 55.0.
• Japan's tertiary activity index climbed for the second straight month in July, though at a slower-than-expected pace. The tertiary activity index rose a seasonally adjusted 0.3 percent from June, when it increased by 0.7 percent. That was just below economists' expectations for a 0.4 percent gain.
• Consumer prices in China were up just 1.3 percent on year in August. That was beneath expectations for 1.7 percent and down from 1.8 percent in July.
• China's exports declined at a slower-than-expected pace in August, while imports rose unexpectedly. Exports fell 2.8 percent year-over-year in August, below economists' forecast for a 4.0 percent decline. Imports grew 1.5 percent in August from a year ago, while it was expected to decrease by 5.4 percent.
• Japan's gross domestic product was revised up to 0.2 percent on a seasonally adjusted quarterly basis in the second quarter of 2016. That beat forecasts for a flat reading, which would have been unchanged from the August 15 preliminary reading.
Ex-Date Company Purpose
12-Sep-16 Cipla Dividend Rs 2/- Per Share12-Sep-16 Petronet LNG Dividend - Rs 2.50 Per Share14-Sep-16 Hindustan Petroleum
Corporation Bonus 2:114-Sep-16 Bharat Heavy Electricals Dividend - Re 0.40/- Per Share14-Sep-16 Repco Home Finance Dividend - Rs 1.80 Per Share14-Sep-16 PTC India Dividend-Rs 2.50 Per Share15-Sep-16 Oil India Dividend - Rs 8/- Per Share15-Sep-16 Rashtriya Chemicals &
Fertilizers Dividend - Rs 1.10 Per Share15-Sep-16 Reliance Capital Dividend - Rs 10/- Per Share15-Sep-16 Reliance Power Annual General Meeting15-Sep-16 Reliance Infrastructure Dividend - Rs 8.50 Per Share15-Sep-16 Hero MotoCorp Dividend - Rs 32/- Per Share15-Sep-16 Mahanagar Gas Dividend - Rs 10/- Per Share + Special
Dividend - Rs 7.5/- Per Share16-Sep-16 Indraprastha Gas Dividend - Rs 6/- Per Share19-Sep-16 Max Financial Services Dividend - Rs 1.80 Per Share
Meeting Date Company Purpose
12-Sep-16 Tata Steel Results12-Sep-16 Reliance Power Results13-Sep-16 Reliance Infrastructure Results14-Sep-16 CESC Results14-Sep-16 Unitech Results14-Sep-16 Reliance Communications Results14-Sep-16 NBCC (INDIA) Results14-Sep-16 IVRCL Results14-Sep-16 Hindustan Dorr-Oliver Results14-Sep-16 BEML Results19-Sep-16 Karur Vysya Bank Stock split
FORTHCOMING EVENTS
NOTES:1) These levels should not be confused with the daily trend sheet, which is sent every morning by e-mail in the name
of "Morning Mantra ".2) Sometimes you will find the stop loss to be too far but if we change the stop loss once, we will find more strength
coming into the stock. At the moment, the stop loss will be far as we are seeing the graphs on weekly basis and taking a long-term view and not a short-term view.
TREND SHEET
Stocks *Closing Trend Date Rate SUPPORT RESISTANCE Closing
Price Trend Trend
Changed Changed
S&P BSE SENSEX 28797 UP 13.04.16 25627 27000 26600
NIFTY50 8867 UP 13.04.16 7850 8400 8200
NIFTY IT 10292 UP 23.03.16 11207 10900 10700
NIFTY BANK 20245 UP 18.03.16 15655 18800 18500
ACC 1653 UP 18.03.16 1337 1630 1600
BHARTIAIRTEL 322 Down 12.08.16 348 350 360
BHEL 154 UP 08.07.16 138 140 135
CIPLA 581 UP 05.08.16 533 530 520
DLF 158 UP 04.03.16 108 150 145
HINDALCO 155 UP 11.03.16 84 140 135
ICICI BANK 274 UP 10.06.16 253 255 245
INFOSYS 1036 DOWN 15.07.16 1073 1100 1120
ITC 258 UP 18.03.16 325 240 230
L&T 1518 UP 22.04.16 1265 1480 1420
MARUTI 5403 UP 20.05.16 3927 5000 4900
NTPC 159 UP 13.04.16 137 155 150
ONGC 255 UP 19.08.16 242 235 230
RELIANCE 1045 UP 15.07.16 1012 1000 980
TATASTEEL 395 UP 04.03.16 289 360 350
S/l
4
®
Closing as on 09-09-2016

BSE SENSEX GAINERS & LOSERS TOP (% Change) NSE NIFTY GAINERS TOP & LOSERS (% Change)
SECTORAL INDICES (% Change)
SMC Trend
FMCGHealthcare
Auto BankRealty
Cap GoodsCons Durable
Oil & GasPower
ITMetal
Down SidewaysUp
GLOBAL INDICES (% Change)
INDIAN INDICES (% Change)
5
®
SMC Trend
Nifty Sensex BSE Midcap BSE Smallcap Nifty Junior S&P CNX 500
SMC Trend
FTSE 100CAC 40
NasdaqDow jonesS&P 500
NikkeiStrait times
Hang SengShanghai
-381.94
110.20
245.69
1393.38
864.21
182.40
-93.70
-308.50
-600.00
-400.00
-200.00
0.00
200.00
400.00
600.00
800.00
1000.00
1200.00
1400.00
1600.00
Friday Monday Tuesday Wednesday Thursday
FII / FPI Activity MF Activity
15.17
7.706.37 6.25 5.76
-7.66
-4.33
-2.71-2.00 -1.84
-10.00
-5.00
0.00
5.00
10.00
15.00
20.00
B H E L Tata Steel Maruti Suzuki Tata Motors ICICI Bank TCS Yes Bank Tech Mahindra
Wipro Tata Power Co.
7.81
6.32 6.285.74 5.35
-7.65
-2.02-1.38
-0.16 -0.11
-10.00
-8.00
-6.00
-4.00
-2.00
0.00
2.00
4.00
6.00
8.00
10.00
Tata Steel Tata Motors Maruti Suzuki
ICICI Bank St Bk of India TCS Wipro GAIL (India) NTPC Coal India
1.621.80 1.88
2.20 2.26
1.84
0.00
0.50
1.00
1.50
2.00
2.50
Nifty Sensex BSE Midcap BSE Smallcap
Nifty Next 50
S&P CNX 500
-2.28
3.94
3.00 2.983.17
1.95
3.003.22
0.85
2.30
5.31
-3.00
-2.00
-1.00
0.00
1.00
2.00
3.00
4.00
5.00
6.00
Auto Index Bankex Cap Goods Index
Cons Durable Index
FMCG Index Healthcare Index
IT Index Metal Index Oil & Gas Index
Power Index Realty Index
0.180.06
0.20
3.23
2.81
0.93
-0.07
-0.52
0.00
-1.00
-0.50
0.00
0.50
1.00
1.50
2.00
2.50
3.00
3.50
Nasdaq Comp. Dow Jones S&P 500 Nikkei Strait Times Hang Seng Shanghai Comp.
FTSE 100 CAC 40
INSTITUTIONAL ACTIVITY (Equity) (` Crore)

Beat the street - Fundamental Analysis
Above calls are recommended with a time horizon of 8 to 10 months. Source: Company Website Reuters Capitaline
6
®
HIMATSINGKA SEIDE LIMITED CMP: 263.05 Upside: 22%Target Price: 321.00
Investment Rationale United States, Canada and Mexico. Meanwhile, ?Himatsingka Group is a vertically integrated North America is a very important revenue stream
home textile major with a global footprint. The for the company and it is expected that it would Group focuses on the manufacture, retail and help the company to grow further. distribution of Home Textile products. ?As per the management, company's revenue grew
?Company has initiated a massive capex plan 2 percent year-on-year (YoY) from `471 crore amounting to `1,281 crore. Through this capex during the quarter ended June 2016 to `480 crore plan, Himatsingka plans to double its sheeting during the quarter ended June 2016. Moreover, capacity, foray into spinning and also venture into margins also improved due to efficiency manufacture of terry towels and will be spread enhancement measures. The company's expansion over three years. plans for the current and next financial year.
?It operates over 12 brands globally in the home Valuationtextiles space. Its brand portfolio includes The company is enhancing its branded revenue marquee brands such as Calvin Klein Home, streams. The intention of the management is to take Barbara Berry, Espirit, Bellora and Atmosphere. In care of its manufacturing growth and to focus on addition, the group also has a strong foothold in enhancing its retail and distribution growth. Thus, it the private label space. is expected that the stock will see a price target of
?Recently, the Company has commenced trial `321 in 8 to 10 months time frame on a current P/E of production of its new sheeting capacity at its 16.14x and FY17 (E) earnings of ̀ 19.86.facility in Hassan. The new sheeting capacity will enhance the installed sheeting capacity from 23 MMPA (Million Meters per Annum) to 46 MMPA. The Company has commenced construction of its Spinning facility at Hassan. The new Spinning facility will have an installed capacity of 1,584 Spindles and is part of the backward integration initiatives of the Company. The Hassan sheeting facility is also a part of ̀ 1,281 crore capex.
?Even for the proposed the terry towel project, company is targeting to enhance its presence in the same two markets - North America and new markets - followed by Asia.
?North America is the largest market following the
Face Value (`) 5.00
52 Week High/Low 297.50/144.95
M.Cap (`Cr.) 2589.99
EPS (`) 16.30
P/E Ratio (times) 16.14
P/B Ratio (times) 2.63
Dividend Yield (%) 0.95
Stock Exchange BSE
% OF SHARE HOLDING
P/E Chart
` in cr
Actual EstimateFY Mar-15 FY Mar-16 FY Mar-17
Revenue 1,904.00 1,808.80 2,152.30EBITDA 140.10 307.00 391.70EBIT 169.90 258.40 328.40Pre-Tax Profit 91.45 169.20 250.50Net Income 95.44 166.60 195.60EPS 9.69 16.92 19.86BVPS 81.75 99.87 116.90ROE (%) 5.00 18.60 18.40
VALUE PARAMETERS
Investment Rationale •For agro-chemicals, there was a decline in the •UPL is the largest Indian multinational price of raw material. However, the company
agrochemical company and is engaged in continues to bet on branded products, which are research, manufacturing, marketing, sales and helping it to continuously report strong margin distribution of agrochemicals and specialty improvement. Branded products contribute 80% chemicals across the globe. to the total revenue.
•Capex for FY17 is around 750-800 crore. The •In FY17, the management is expecting recovery in management of the company expects 11% the rice crop where the company has a very strong revenue growth in Seed business in FY17. Overall product portfolio. Fruits & vegetables could revenue growth is expected to steady 12-15% in continue to perform well. The devaluation of FY17. Moreover, Net debt has come down to Rs currency in Brazil and Argentina also augers well 3927 crore in Q1 FY17 from ̀ 4004 crore in Q4 FY16 for farmers and company as well. and management expects `3000 crore net debts Valuationby year end. The company has strong fundamentals and robust
•Recently advanta has merged with UPL and due to outlook. Its strong focus on brand building and that merger, the company has opportunity to customer reach is helping the company in increasing increase market share in Seed industry with its market share in major addressable markets. Good global footprint, as also it would benefit from recovery in south cone and Latin America would help Advanta's presence in Thailand, Australia etc. the company to maintain robust performance going Strong global presence especially in Latin America forward. Thus, it is expected that the stock will see a and also in India, new products and power brands price target of ̀ 830 in 8 to 10 months time frame on a registered good growth in Kharif, Herbicides current P/E of 22.36x and FY17 EPS of ̀ 37.13.range on Soya and Pulses.
•The consolidated net sales for Q1 FY17 grew by 7.7% to `3452.04 crore. Sales growth excluding other operation income was led by 8% volume growth while price component was -2%. The consolidated net profit inclined by 23.7% to `401.95 crore due to growth in OPM and fall in tax rate due to merger.
•Globally, the company is doing very well i.e. North America revenue grew by 5% to `638 crore contributing 18%, Latin America revenue grew by 13% to `697 crore contributing 20%, India revenue grew by 1% to ̀ 1060 crore contributing 30%, Europe revenue inclined by 12% to ̀ 562 crore contributing 16% and the rest of world revenue grew 13% to ̀ 553 crore contributing 16% of total revenue.
P/E Chart
UPL LIMITED (UPL) CMP: 659.25 Upside: 26%Target Price: 830.00
Face Value (`) 2.00
52 Week High/Low 666.80/342.00
M.Cap (`Cr.) 33418.55
EPS (`) 29.54
P/E Ratio (times) 22.32
P/B Ratio (times) 4.91
Dividend Yield (%) 0.64
Stock Exchange BSE
` in cr
% OF SHARE HOLDING
VALUE PARAMETERS
Actual EstimateFY Mar-15 FY Mar-16 FY Mar-17
REVENUE 11,911.10 13,082.70 15,490.10
EBITDA 2,362.60 2,716.30 3,189.30
EBIT 1,938.10 2,214.60 2,588.90
NET INCOME 1,151.90 1,376.90 1,705.70
EPS 26.87 32.12 37.13
BVPS 136.73 158.44 189.80
ROE 20.70 21.80 21.80
48.46
10.44
03.56
29.73
7.66 Foreign
Institutions
Govt Holding
Non Promoter Corp. Hold.
Promoters
Public & Others
8.996.67
3.62
57.22
23.51
Foreign
Institutions
Non Promoter Corporate Holding
Promoters
Public & Others

Charts by Spider Software India Ltd
7
EQUITY
Above calls are recommended with a time horizon of 1-2 months
Disclaimer : The analyst and its affiliates companies make no representation or warranty in relation to the accuracy, completeness or reliability of the information contained in its research. The analysis contained in the analyst research is based on numerous assumptions. Different assumptions could result in materially different results.The analyst, not any of its affiliated companies, not any of their members, directors, employees or agents accepts any liability for any loss or damage arising out of the use of all or any part of the analysis research.
SOURCE: CAPITAL LINE
®
The stock closed at `62.40 on 09th September 2016. It made a 52-week low at
`41.80 on 12th February 2016 and a 52-week high at `71.10 on 20th October
2015. The 200 days Exponential Moving Average (EMA) of the stock on the daily
chart is currently at ̀ 58.20.
It has formed Inverted head and shoulder formation on daily charts which is
bullish in nature. One can buy in the range of 60-61 levels for the target of 65-66
levels with SL of 58 levels.
Andhra Bank
The stock closed at ̀ 395.00 on 09th September 2016. It made a 52-week low at
`274 on 08th September 2015 and a 52-week high of ̀ 407.70 on 07th September
2016. The 200 days Exponential Moving Average (EMA) of the stock on the daily
chart is currently at ̀ 368.27.
Last week despite the weakness in the market, it managed to sustain on higher
note which is bullish sign. One can buy in the range of 387-390 levels for the
target of 415-420 levels with strict SL of 375 levels.
GAIL (India) Limited

DERIVATIVES
CHANGE IN NIFTY OPTION OI (IN QTY)
WEEKLY VIEW OF THE MARKET
NIFTY OPTION OI CONCENTRATION (IN QTY)
CHANGE IN BANKNIFTY OPTION OI (IN QTY)BANKNIFTY OPTION OI CONCENTRATION (IN QTY)
®
Strong buying momentum paused in later part of week and market witnessed profit booking. Stock specific moves remained market flavor on the back of sector
rotation. Sectors like PSU banking, Pharma & Oil & Gas were most active and posted smart gains, whereas IT and Metals lost ground. FII remained net buyer
throughout the week. Hereafter, the range of 8800-9000 levels will remain crucial in the coming week, and the move is expected to remain volatile but positive,
as indicated by option open interest concentration. If 8900 breaks again than Nifty could rally up to 9000-9050 levels on continuation of momentum. In any
correction, the index will face strong support at 8800-8750 levels. The put-call ratio of open interest closed up at 1.43 levels indicating put writing. The options
open interest concentration continued to be at the 9000-strike call with the highest open interest of above 68 lakh shares; this is followed by 9100-strike call with
open interest of 41 lakhs. Among put options, the 8600-strike taking the total open interest to 60 lakh shares, with the highest open interest among put options
followed by 8700-strike put with total open interest of 55 lakh shares. The Implied Volatility (IV) of call options moved down at 10.93%, while the average IV of
put options closed at 10.99%. The VIX index remained flat to 13.12% but here on IV and VIX is expected to surge further. In the coming week stock specific moves
are expected. Sectors like PSU banks, Pharma and Oil & Gas are likely to outperform index.
In lakhs
In 10000 In 10000
DIVISLAB (SEP FUTURE)
Buy: Above `1354
Target: `1410
Stop loss: `1326
ITC
Buy SEP 260. PUT 5.00
Sell SEP 250. PUT 1.50
Lot size: 2400
BEP: 256.50
Max. Profit: 15600.00 (6.50*2400)
Max. Loss: 8400.00 (3.50*2400)
OPTIONSTRATEGY
FUTURE
IDFC
Buy SEP 65. CALL 1.30
Sell SEP 67.5. CALL 0.70
Lot size: 13200
BEP: 65.60
Max. Profit: 25080.00 (1.90*13200)
Max. Loss: 7920.00 (0.60*13200)
IDEA
Buy SEP 80. PUT 1.80
Sell SEP 75. PUT 0.80
Lot size: 5000
BEP: 79.00
Max. Profit: 20000.00 (4.00*5000)
Max. Loss: 5000.00 (1.00*5000)
DERIVATIVE STRATEGIES
CASTROLIND (SEP FUTURE)
Buy: Above `477
Target: `489
Stop loss: `471
AMARAJABAT (SEP FUTURE)
Buy: Above `1040
Target: `1080
Stop loss: `1020
BULLISH STRATEGY BEARISH STRATEGY
Call Put
16
.60
4.1
5
6.9
3 11
.47
15
.92 21
.76
26
.29
34
.72
55
.84
34
.82
30
.17
27
.63
27
.95
43
.00
56
.39
60
.66
55
.74
48
.08
35
.34
16
.41
5.7
7
4.1
8
0.00
10.00
20.00
30.00
40.00
50.00
60.00
70.00
8000 8300 8400 8500 8600 8700 8800 8900 9000 9100 9200
Call Put
-0.2
0
-0.2
7
-0.4
4
-2.2
6
-2.6
1
-5.7
1
-9.4
8
- 10.
76
-4.4
9
4.7
5
11
.76
-0.2
7
-2.9
1
-0.4
5
-5.6
9
-9.0
8
14
.37
17
.34
25
.99
0.4
7 3.8
6
1.6
4
-15.00
-10.00
-5.00
0.00
5.00
10.00
15.00
20.00
25.00
30.00
8000 8300 8400 8500 8600 8700 8800 8900 9000 9100 9200
Call Put
2.7
6
5.6
4
5.3
9
16
.86
32
.72
62
.80
13
.12 20
.19
12
.50
41
.62
44
.36
21
.40
23
.29
42
.26
81
.41
78
.63
77
.37
4.5
6
16
.48
4.2
4
17
.12
3.8
6
0.00
10.00
20.00
30.00
40.00
50.00
60.00
70.00
80.00
90.00
17500 18000 18500 19000 19500 20000 20100 20200 20300 20500 21000
Call Put
-0.2
2
0.2
0
-0.4
6
-3.8
2
-6.1
2
-26
.56
0.2
1 7.5
0
-1.7
4
12
.29
32
.75
-0.0
3
-0.1
3
-1.7
6
-0.9
9
18
.18
56
.89
4.2
7
16
.42
4.0
3
14
.82
3.4
8
-40.00
-30.00
-20.00
-10.00
0.00
10.00
20.00
30.00
40.00
50.00
60.00
70.00
17500 18000 18500 19000 19500 20000 20100 20200 20300 20500 21000
8
In lakhs

9
DERIVATIVES
®
FII’s ACTIVITY IN DERIVATIVE SEGMENT
SENTIMENT INDICATOR (NIFTY)
08-Sep 07-Sep 06-Sep 02-Sep 01-Sep
Discount/Premium 30.05 34.15 18.20 30.50 33.70
PCR(OI) 1.43 1.38 1.35 1.25 1.22
PCR(VOL) 1.24 1.00 1.29 1.18 1.22
A/D RATIO(Nifty 50) 2.77 0.72 4.56 2.13 0.72
A/D RATIO(All FO Stock)* 1.94 1.35 5.38 3.72 0.42
Implied Volatality 10.93 11.15 11.08 11.06 11.60
VIX 13.12 13.15 12.75 12.94 12.94
HISTORY. VOL 13.29 13.58 13.94 12.62 12.90
*All Future Stock
SENTIMENT INDICATOR (BANKNIFTY)
08-Sep 07-Sep 06-Sep 02-Sep 01-Sep
Discount/Premium 96.85 101.00 70.35 88.55 50.65
PCR(OI) 1.43 1.38 1.31 1.13 1.04
PCR(VOL) 1.86 1.53 1.31 1.45 1.24
A/D RATIO(BANKNIFTY) 1.75 1.40 All Up All Up 0.50
#A/D RATIO 3.50 2.80 All Up All Up 0.27
Implied Volatality 15.05 15.67 15.48 14.53 14.85
HISTORY. VOL 19.37 19.98 20.60 16.80 17.18
FII’S ACTIVITY IN NIFTY FUTURE
**The highest call open interest acts as resistance and highest put open interest acts as support.# Price rise with rise in open interest suggests long buildup | Price fall with rise in open interest suggests short buildup # Price fall with fall in open interest suggests long unwinding | Price rise with fall in open interest suggests short covering
# All BANKING Future Stock
Top 10 short build upTop 10 long build up
LTP % Price Change Open interest %OI Chng
MOTHERSUMI 328.6 1.81% 11677500 32.40%
OIL 388.4 2.55% 2296700 29.78%
CENTURYTEX 813.55 8.72% 8757100 24.57%
ONGC 247.45 3.28% 30847500 21.73%
SOUTHBANK 24.75 9.76% 44910000 17.50%
WOCKPHARMA 881.4 7.15% 3615000 17.42%
SIEMENS 1305.4 2.86% 1049500 16.94%
NMDC 112.8 4.20% 15672000 15.93%
SINTEX 80.85 5.62% 29868000 15.48%
IRB 253.4 9.22% 14177500 14.15%
LTP % Price Change Open interest %OI Chng
CAIRN 199.4 -1.70% 15431500 57.35%
MINDTREE 517.1 -6.40% 2721600 34.95%
TCS 2329.75 -7.59% 5616250 11.43%
BEL 1209 -1.10% 1611000 9.48%
IBULHSGFIN 821.75 -1.50% 7089600 8.76%
HCLTECH 774.55 -1.57% 7160300 7.42%
TECHM 459.6 -2.85% 7591100 6.86%
PAGEIND 14922.6 -2.45% 38950 6.42%
IGL 780.4 -1.17% 1874400 6.17%
JUBLFOOD 1081.65 -8.84% 1981500 6.13%
In Cr. In Cr.
- 25
5
10
51
41
20
66
28
86
36
4
- 39
9
33
1
- 27
- 56
-1000
-500
0
500
1000
1500
2000
2500
3000
3500
25-Aug 26-Aug 29-Aug 30-Aug 31-Aug 01-Sep 02-Sep 06-Sep 07-Sep 08-Sep
- 62
4
19
04
58
0
28
83 3
57
1
78
2
10
7
22
94
- 33
8
- 10
58
-2000
-1000
0
1000
2000
3000
4000
25-Aug 26-Aug 29-Aug 30-Aug 31-Aug 01-Sep 02-Sep 06-Sep 07-Sep 08-Sep

10
®
The downtrend of turmeric futures (Oct) is likely to get extended & in days to come, it might test 6500 levels. A bearish tone is prevailing at the major markets across the country due to dull demand. Turmeric stocks is though low in the country compared to last year, but higher sowing this season has dented market sentiments. Turmeric acreage in Telangana as on Aug 31 rose to 46,000 hectares as compared to 39,000 hectares last year. However it was down in Andhra Pradesh at 10,000 hectares versus 12,000 hectares a year ago. Cardamom futures (Oct) is expected to consolidate in the range of 1125-1250 levels & trade with an upside bias. Daily arrivals from the new harvest are expected to gather pace from Sep 15, after Onam, but the good quality spice will start coming to the market from October. At the spot markets, cardamom prices are currently are hovering around multi-year highs, above 1,000 rupees a kg. According to growers in Idukki the crop is likely to be lower by around 50% because of the drought and the erratic monsoon this year in the high ranges where cardamom is grown. During this time, the sunny spell without the usual intermittent showers would negatively the affect the plants besides bringing down the output further. Jeera futures (Oct) may trade with a downside bias & may fall towards 17500-17300 levels. The sentiments in Unjha and Rajkot markets of Gujarat are bearish as domestic and exports demand is poor as well at present. Fresh crop will come in March while festive demand is expected to gain not before Diwali.
SPICES
The bearish phase is likely to persist in soybean futures (Oct) as the counter may descend further down towards 3150 levels. Soybean prices are declining continuously in most of the spot markets of Madhya Pradesh and Maharashtra, largely pressured by rising expectation of big crop size amid favorable weather condition. In days to come, monsoon weather in September will be crucial as the crops will be in final stage of development. Soybean prices at spot market traded in the range of ̀ 3,000-3,450 per 100kg in various markets of Madhya Pradesh and Maharashtra. On CBOT, U.S Soybean futures (Nov) is likely to take support near $9.60 a bushel. Now that the calendar has turned to September, U.S. will begin rolling to collect the world's largest soybean crops, but meaningful harvest results are unlikely to surface until November. On Monday, the U.S. Department of Agriculture's statistics agency will update its monthly crop production report. This includes potential adjustments to the initial U.S. soybean yield estimates released last month. Mustard futures (Oct) will possibly trade with a downside bias in the range of 4600-4760 levels. At the spot markets, mustard seed prices are getting pressurized by disparity in crushing which has risen due to slow sales of by-products whereas cost of raw material has surged recently. Refined soy oil futures (Oct) might witness consolidation in the range of 645-665 levels & CPO futures (Sept) is likely to trade within 545-570 levels. The upside may remain capped in the edible oil counters as there is good availability at various ports of the country.
OIL AND OILSEEDS
OTHER COMMODITIES
Kapas futures (Apr) can witness some upside momentum & test 920-925 levels, taking support near 885 levels. It is reported by the International Cotton Advisory Committee, that world ending stocks are estimated to have fallen by 13% to 19.5 million tons in 2015/16 as global demand outpaced production. Secondly, India's mill use is expected to remain stable at 5.3 million tons due to strong domestic cotton prices and competition from competing fibers. The supply side fundamentals highlight that acreage under cotton during the ensuing 2016-17 crop year is expected to be lower by about 10% than that of the current year. The projected balance sheet drawn by the Cotton Association of India estimated total cotton supply for the cotton season 2016-17 at 400.00 lakh bales while the domestic consumption is estimated at 308.00 lakh bales. Sugar futures (Oct) is likely to consolidate in the range of 3500-3630 levels. In days to come, a firm trend can be seen amid lower output. Sugar production in the coming marketing year 2016-17 (October-September) is estimated to be around 232 Lakh tonnes, with the opening stocks of sugar for 1st of October 2016 at 71 Lakh tonnes. Total availability of Sugar will be 303 Lakh tonnes. With no exports and estimated domestic consumption of 260 Lakh tonnes of sugar, the ending stock of season on 30th of September 2017 will be just 43 Lakh tonnes. Guar complex might continue to remain in bearish zone due to forecast of better than expected production & forecast of better yield. According to the Rajasthan agriculture department, guarseed yield is expected at 549 kilograms per hectares against 465 a year ago.
Bullion counter is expected to trade on sideways path as movement of dollar index and uncertainty about interest rate increase in this month Fed meeting will keep investors jittery. Movement of local currency rupee can also affect the prices as it can move in the range of 65.70-67.50. Dollar index can move in the range of 93.5-95.5. Gold can trade in the range of 30800-31800 while silver can move in the range of 45400-47800 in near term. Last week European Central Bank confirmed its existing stimulus programme but refrained from extending it as some market players had hoped. Meanwhile bullion still gaining support on the downside from a weaker dollar on views that the U.S. central bank is in no hurry to raise interest rates. While the hawkish comments from Richmond Fed Pres ident Jeffery Lacker that, the case for a September hike was going to be “strong” and the lower unemployment claims have started the September rate hike argument once again, which is likely to put some pressure on gold. Gold is highly sensitive to rising US interest rates, which increase the opportunity cost of holding non-yielding bullion while boosting the dollar, in which the metal is priced. Recently holdings of SPDR Gold Trust, the world's largest gold-backed exchange-traded fund, stood at 950.62 tonnes. Strong ETF demand from China is also supporting the prices. The physical holdings of Chinese gold ETFs have surged five-fold from 7 tonnes at the end of January, to 35 tonnes at end of August.
BULLIONS
Crude oil prices can trade on upside path as speculation about production cut in this month OPEC meeting and weaker greenback can support the prices. The Organization of the Petroleum Exporting Countries and non-OPEC producers such as Russia are expected to discuss the issue at informal talks in Algeria on Sept. 26-28 .Overall it can move in the range of 3000-3350 in MCX. Recently tropical storms and Hurricane Hermine combined to slow the movement of oil tankers and shut in offshore drilling, forcing the U.S. oil industry to dip into its massive oversupply at the highest rate for this time of year. While the storms threatened the Gulf of Mexico, 12 percent of U.S. oil drilling in the Gulf was temporarily shut in. Meanwhile fall in US production can support the prices as U.S. produced 8.46 million barrels in penultimate week down from 8.49 million. Natural gas may remain on volatile path as it can move in the range of 170-200 in MCX. Last week natural gas prices posted their biggest daily increase since late July after government data showed a smaller than expected increase in the amount of natural gas in storage. The U.S. Energy Information Administration stated that natural gas stockpiles grew by 36 billion cubic feet in penultimate week, compared with the 43 billion cubic feet forecasted. According to EIA estimates for marketed gas production remained the same as August's projections for the third and fourth quarters. The natural gas share of electricity generation in 2017 is forecasted to fall to 33.3%, and the coal share of generation is expected to rise to 31%.
ENERGY COMPLEX
In base metals counter, Nickel and Zinc may outperform other metals on supply concerns. Recently China slowdown concerns and declining global demand have kept the upside capped in base metals. Red metal copper may move in the range of 308-325. Copper fall is limited as it is supported by a fall in inventories and a softer US dollar, though lower imports into China in August can keep prices in check. Inventories in London Metal Exchange warehouses fell for the first time in three weeks, signaling returning demand after the slower northern summer months. Besides, the International Copper Study Group (ICSG) stated in its latest monthly report that the copper market saw a deficit of 222,000 tonnes in the first five months of the year. ICSG stated that the deficit in May narrowed to 65,000 tonnes from a shortfall of 144,000 tonnes in April. Lead can hover in the range of 122-130. Zinc can move in the range of 148-158. Aluminum can move in the range of 103-110 in near term. Chinese aluminum production has fallen 3.1% YoY in the first seven months of the year. China exported 410,000 metric tonnes of unwrought aluminum in August. This represents a YoY increase of 20.4% .Lower production combined with a stimulus-fueled demand pickup kept Chinese aluminum exports in check so far this year. Nickel can move in the range of 660-720. Nickel may remain supported on supply concerns. The Philippines is also expected next week to announce new suspensions for mines violating environmental regulations after already halting operations at 10 sites, most of which mine nickel.
BASE METALS

11
TECHNICAL RECOMMENDATIONS
COMMODITY
NATURAL GAS MCX (SEPTEMBER) contract closed at ̀ 186.10 on 08th Sep'16. The contract made its high
of ̀ 204.20 on 29th June'16 and a low of ̀ 172.50 on 11th Aug'16. The 18-day Exponential Moving Average
of the commodity is currently at ̀ 186.36.
On the daily chart, the commodity has Relative Strength Index (14-day) value of 48. One can buy in the
range of ̀ 185-180 with the stop loss of ̀ 175 for a target of ̀ 210.
NICKEL MCX (SEPTEMBER) contract closed at 685.50 on 08th Sep'16. The contract made its high of
`740.10 on 21st July'16 and a low of ̀ 627 on 27th June'16. The 18-day Exponential Moving Average of the
commodity is currently at ̀ 680.18.
On the daily chart, the commodity has Relative Strength Index (14-day) value of 43. One can buy in the
range of ̀ 680 - 670 with the stop loss of ̀ 650 for a target of ̀ 710.
`
SOYAREFINED NCDEX (OCTOBER) contract closed at 659.20 on 08th Sept'16. The contract made its
high of `680.05 on 19th Aug'16 and a low of `621.40 on 29 July'16. The 18-day Exponential Moving
Average of the commodity is currently at ̀ 655.29.
On the daily chart, the commodity has Relative Strength Index (14-day) value of 58. One can buy in the
range of ̀ 655 - 645 with the stop loss of ̀ 638 for a target of ̀ 670.
`
®
NATURAL GAS MCX (SEP)
NICKEL MCX (SEPTEMBER)
SOYAREFINED NCDEX (OCTOBER)
NOTES : 1) These levels should not be confused with the daily trend sheet, which is sent every morning by e-mail in the name of Daily report- commodities (Morning Mantra).
2) Sometimes you will find the stop loss to be too far but if we change the stop loss once, we will find more strength coming into the commodity. At the moment, the stop loss will be far as we are seeing the graphs on weekly basis and taking a long-term view and not a short-term view.
EXCHANGE COMMODITY CONTRACT CLOSING DATE TREND TREND RATE TREND SUPPORT RESISTANCE CLOSING
PRICE CHANGED CHANGED STOP/LOSS
NCDEX SOYABEAN OCT 3242.00 12.05.16 Down 4037.00 - 3400.00 3450.00
NCDEX JEERA OCT 17835.00 12.08.16 Down 18520.00 - 18450.00 18600.00
NCDEX REF.SOY OIL OCT 659.20 08.09.16 Sideways
NCDEX RM SEEDS OCT 4722.00 24.08.16 Down 4637.00 - 4800.00 4900.00
MCX MENTHA OIL SEPT 900.10 01.09.16 Down 888.70 905.00 920.00
MCX CARDAMOM OCT 1180.90 16.08.16 UP 1039.00 1150.00 - 1110.00
MCX SILVER DEC 46714.00 08.09.16 UP 46714.00 45000.00 - 44000.00
MCX GOLD OCT 31203.00 16.06.16 Up 30607.00 30800.00 - 30500.00
MCX COPPER NOV 314.00 22.08.16 Down 324.95 - 320.00 325.00
MCX LEAD SEPT 127.75 25.08.16 Up 125.20 121.00 - 120.00
MCX ZINC SEPT 153.90 03.03.16 UP 123.85 150.00 - 148.00
MCX NICKEL SEPT 685.50 25.08.16 Sideways
MCX ALUMINUM SEPT 105.45 08.09.16 Sideways
MCX CRUDE OIL SEPT 3164.00 08.09.16 Sideways
MCX NATURAL GAS SEPT 186.10 25.08.16 Up 194.00 185.00 - 180.00
TREND SHEET
*Closing as on 08.09.16

COMMODITY
NEWS DIGEST
In the week gone by, commodity market witnessed some improvement on some improved
economic condition of China amid some fall in dollar index. CRB closed above 186levels. Even
Baltic Dry Index has rebounded and the international shipping market improved. China's
August imports unexpectedly rose 1.5%, the first expansion in 22 months, suggesting domestic
demand in the world's second-largest economy is picking up. Exports fell by 2.8% from a year
earlier, less than markets had expected. In industrial metals, copper and nickel moved up
whereas zinc, lead and aluminum prices melted down. Copper was holding near its highest
level in a fortnight, after a string of softening economic reports pushed back U.S. rate hike
expectations and undermined the dollar Zinc dropped the most in a week as some investors
closed out bullish bets on this year's best-performing major commodity. Zinc has rallied 45%
this year on expectations of a supply shortage after mine closures from Australia to Ireland.
Gold rose to a fresh two-and-a-half-week high, as disappointing U.S. economic data reinforced
expectations the U.S. Federal Reserve will keep rates on hold in September. Silver also moved
up on strong sentiments in gold and some base metals. In energy counter, both crude and
natural gas regained fire. Crude oil futures pared gains after top producers Russia and Saudi
Arabia confirmed they had agreed to cooperate on stabilizing the oil market, including limiting
output, amid dropdown in inventories news. OPEC and non-OPEC producers, like Russia, will
hold informal talks in Algeria on Sept. 26-28. Many in the market are sceptical that a deal will
happen. Natural gas prices dragged on inventories issue. There is plenty of gas in inventories
these days to meet whatever the winter season throws at the market. In fact, there is more gas
in stockpiles now than there was last year or over the average of the past five years. On
Thursday, it saw sudden surge in the prices on smaller than expected increase in the amount of
natural gas in storage and closed the week on a positive note.
Agri commodities saw mixed move last week. In spices, turmeric and jeera saw further fall
whereas cardamom and dhaniya prices augmented on renewed buying. Most of the oil seeds
prices dropped down on record production expectation. It was only crude palm oil which
moved up in the counter. Expectation of record production in maize stimulated selling
pressure across the board. Guar counter saw some lower level buying.
WEEKLY COMMENTARY
COMMODITY UNIT 08.09.16 DIFFERENCEQTY. QTY.
BARLEY MT 7312.00 7053.00 -259.00
CORIANDER NEW MT 10443.00 10463.00 20.00
COTTON SEED OILCAKE MT 15073.00 12278.00 -2795.00
GUARGUM MT 22196.00 20090.00 -2106.00
GUARSEED MT 15753.00 15453.00 -300.00
JEERA NEW MT 5144.00 5021.00 -123.00
MAIZE MT 7060.00 3392.00 -3668.00
RM SEED MT 33593.00 32511.00 -1082.00
SUGAR MT 530.00 300.00 -230.00
TURMERIC MT 7671.00 7474.00 -197.00
WHEAT MT 13409.00 13022.00 -387.00
01.09.16 COMMODITY UNIT 08.09.16 DIFFERENCE
QTY. QTY.
CARDAMOM MT 6.60 7.50 0.90
GOLD KGS 1180.00 1180.00 0.00
GOLD MINI KGS 122.70 6.50 -116.20
GOLD GUINEA KGS 8.14 8.14 0.00
MENTHA OIL KGS 2953586.63 2795613.58 -157973.05
SILVER (30 KG Bar) KGS 84026.40 76109.89 -7916.51
01.09.16
•China CPI advanced 1.3% from a year ago, following a 1.8% increase in July.
•Gross sales of American gold Eagle coins to authorized dealers meantime rose to 1.8 tonnes in August, data from the US Mint show, after dipping on July's strong price rise.
•ECB held interest rates at record lows.
•US initial claims for state unemployment benefits decreased 4,000 to a seasonally adjusted 259,000 for the week ended Sept. 3, the lowest level since mid-July.
•SEBI fixed daily price limits for non-agricultural commodities. The aggregate limit is up to 6% for steel and 9% for gold and other non-agri commodities.
•Rajasthan agriculture department released first advance estimate for 2016-17 Kharif crop which revealed that Guar seed output in the state likely to fall to 19.62 lakh tonnes against 22.23 lakh tonnes last year.
•United States Department of Agriculture (USDA) has lowered barley production estimates in India during crop year 2016-17 by 1.90 lakh tonnes.
•India's oil meal exports during the month of August dropped 38% at 56,597 tonnes compared with 91,834 tonnes same period a year ago, according to monthly data released SEA.
•FAO sugar price index averaged 285.6 points in August, up 6.9 points (2.5%) from July, reaching its highest level since October 2012 and as much as 75% above the corresponding period last year.
WEEKLY STOCK POSITIONS IN WAREHOUSE (MCX)
12
®
WEEKLY STOCK POSITIONS IN WAREHOUSE (NCDEX)
NCDEX TOP GAINERS & LOSERS (% Change) MCX TOP GAINERS & LOSERS (% Change)
6.35
3.81
2.442.25
1.99
-2.32
-1.28
-0.59 -0.47
-3.00
-2.00
-1.00
0.00
1.00
2.00
3.00
4.00
5.00
6.00
7.00
CRUDE OIL CARDAMOM
NICKEL MINI CPO SILVER 1000
ZINC MINI
LEAD MINI
NATURAL GAS
ALUMINIUM MINI
5.29
3.43
2.20
1.80 1.80
-2.41 -2.36
-1.87
-1.48
-0.86
-3.00
-2.00
-1.00
0.00
1.00
2.00
3.00
4.00
5.00
6.00
CRUDE OIL SUGAR M KAPAS
MAIZE KHARIF
CRUDE PALM OIL SOYABEAN
SHANKAR KAPAS JEERA
RAPE MUSTARD SEEDS TURMERIC

COMMODITY
COMMODITY EXCHANGE CONTRACT 02 08.09.16 CHANGE%
ALUMINIUM LME 3 MONTHS 1594.00 1590.50 -0.22
COPPER LME 3 MONTHS 4627.00 4664.00 0.80
LEAD LME 3 MONTHS 1943.00 1925.00 -0.93
NICKEL LME 3 MONTHS 10060.00 10345.00 2.83
ZINC LME 3 MONTHS 2364.00 2314.00 -2.12
GOLD COMEX DEC 1326.70 1341.60 1.12
SILVER COMEX DEC 19.37 19.68 1.61
LIGHT CRUDE OIL NYMEX OCT 44.44 47.62 7.16
NATURAL GAS NYMEX OCT 2.79 2.81 0.50
.09.16
PRICES OF METALS IN LME/ COMEX/ NYMEX (in US $)
WEEKLY STOCK POSITIONS IN LME (IN TONNES)
COMMODITY STOCK POSITION STOCK POSITION DIFFERENCE
01.09.16 08.09.16
ALUMINIUM 2234050 2210100 -23950
COPPER 293525 339600 46075
NICKEL 370116 367752 -2364
LEAD 187300 186500 -800
ZINC 451950 449925 -2025
INTERNATIONAL COMMODITY PRICES
COMMODITY EXCHANGE CONTRACT UNIT 02.09.16 08.09.16 CHANGE(%)
Soybean CBOT NOV Cent per Bushel 952.50 976.75 2.55
Corn CBOT DEC Cent per Bushel 328.50 338.50 3.04
CPO BMD NOV MYR per MT 2595.00 2609.00 0.54
Sugar LIFFE AUG 10 cents per MT 539.00 541.40 0.45
13
®
SPOT PRICES (% change) Price Movement of commodities in Aug. 2016
Mixed trade was witnessed in spice complex in the month of August. Cardamom jumped almost 29% on squeezed supply due to late first phase picking of capsules in current season. The expectation of picking up demand ahead of festival season in the country from next month also supported the prices. Jeera and turmeric lost almost 11% due to its own fundamentals. Jeera prices declined due decreased domestic and export demand on higher level. Even depleting stock also couldn't save the jeera prices to slide. Turmeric faded due to lack of quality arrival and demand and favorable condition in growing areas. Oilseeds, soybean and RM seeds lost its ground while edible oils traveled north. A weak trend continued in soybean prices in major spot markets due to continued lower demand of soymeal and prospects of better crop this season amid favorable weather condition in most of the producing states. Weakness in soybean and lower demand on higher level also pressurized the prices of mustard seed. CPO took a big jump on bullish global cues and lower stocks at the various ports amid improving domestic demand ahead of festival. The selling pressure witnessed in Kapas future amid slack demand from mills and spinners at higher prices. The news of light rain showers have been reported across the cotton sowing belts in Maharashtra which will be beneficial for the growth of cotton crop. Sugar prices continued to downward in consecutive month on the news that government will impose a limit on the amount of sugar that mills can hold at the end of September and October to keep prices under check ahead of key festivals. The government finally imposed limits.
Gold prices cracked below the `31,000-mark last month, picking weak overseas cues amid muted demand from jewellers in the domestic spot market. Expectations for a rate increase received a boost in recent days, after top Fed officials waxed optimistic about the U.S. economy. Silver, however, traded higher on scattered enquiries from consuming industries. Crude prices rose sharply on informal talk among oil exporting countries including OPEC to oil freeze production. Base metals behaved in different way. Zinc, which neared 15-month highs after China's manufacturing activity unexpectedly expanded in August, typically a quiet month for metals demand. Lead also saw solid revival due to expectation of tight supply. Aluminum and copper witnessed selling pressure on higher stock but Aluminum limit its losses by taking support from higher crude prices.
-4.79
-2.94
-2.14
-1.82
-1.60
-1.16
-0.95
-0.07
0.00
0.13
0.23
0.53
0.70
0.70
0.85
2.48
4.78
5.13
-6.00 -4.00 -2.00 0.00 2.00 4.00 6.00
TURMERIC (NIZAMABAD)
CORIANDER (KOTA)
COTTON SEED OIL CAKE (AKOLA)
COTTON (KADI)
JEERA (UNJHA)
BARLEY (JAIPUR)
PEPPER MALABAR GAR (KOCHI)
WHEAT (DELHI)
CHANA (DELHI )
SUGAR (KOLKATA)
MUSTARD (JAIPUR)
SOYABEAN (INDORE)
GUR (MUZAFFARNGR.)
GUAR SEED (JODHPUR)
GUAR GUM (JODHPUR)
CRUDE PALM OIL (KANDLA)
RAW JUTE (KOLKATA)
SILVER 5 KG (DELHI)
CURRENCY
Currency Table
Currency Pair* Open High Low Close
USD/INR 66.75 66.80 66.52 66.59
EUR/INR 74.51 75.26 74.48 75.21
GBP/INR 88.90 89.35 88.80 89.00
JPY/INR 64.67 65.69 64.42 65.50
News Flows of last week
6th Sep Strong exports and household demand drove economic expansion in the euro zone in the second quarter.
6th Sep The Bank of England will wait until its November meeting before slicing 15 basis points from Bank Rate in an effort to cushion the expected blow from the Brexit vote.
8th Sep The number of Americans filing for unemployment benefits unexpectedly fell last week, pointing to sustained labor market strength even as the pace of job growth is slowing.
8th Sep German economic growth will nearly halve in 2017 as Brexit and other risks hit exporters
8th Sep The European Central Bank held interest rates at record lows and kept the door open to more stimulus
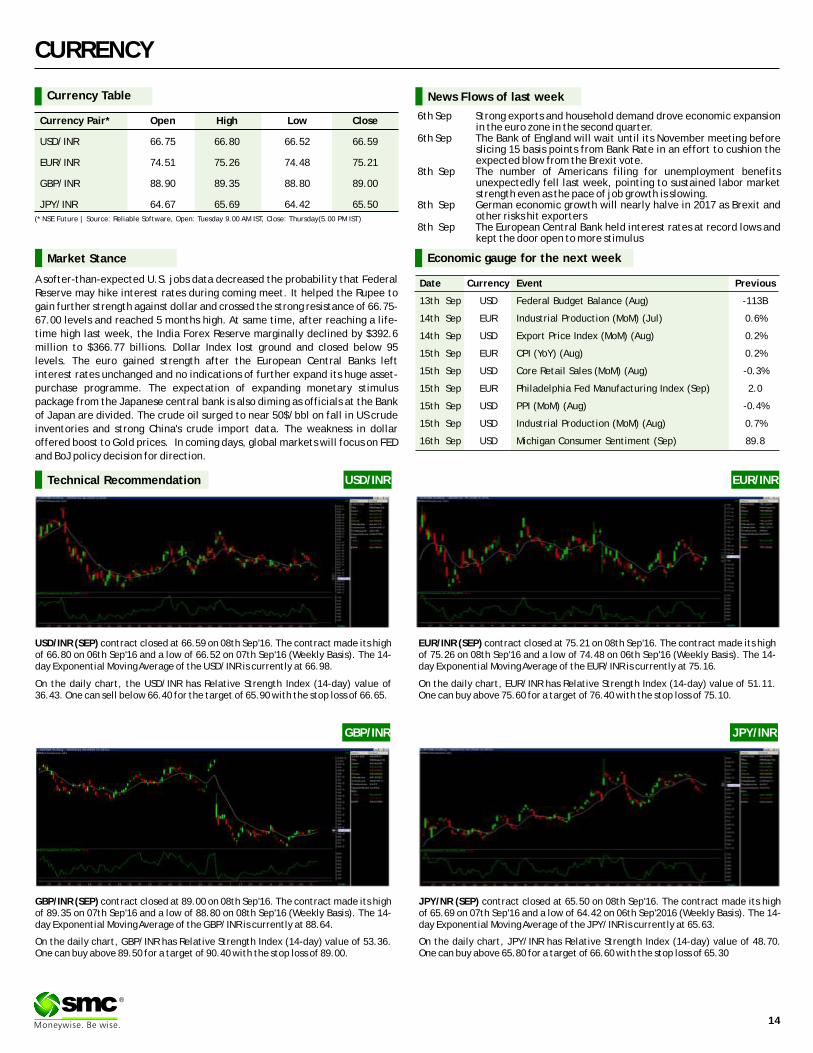
EUR/INR (SEP) contract closed at 75.21 on 08th Sep'16. The contract made its high of 75.26 on 08th Sep'16 and a low of 74.48 on 06th Sep'16 (Weekly Basis). The 14-day Exponential Moving Average of the EUR/INR is currently at 75.16.
On the daily chart, EUR/INR has Relative Strength Index (14-day) value of 51.11. One can buy above 75.60 for a target of 76.40 with the stop loss of 75.10.
JPY/NR (SEP) contract closed at 65.50 on 08th Sep'16. The contract made its high of 65.69 on 07th Sep'16 and a low of 64.42 on 06th Sep'2016 (Weekly Basis). The 14-day Exponential Moving Average of the JPY/INR is currently at 65.63.
On the daily chart, JPY/INR has Relative Strength Index (14-day) value of 48.70. One can buy above 65.80 for a target of 66.60 with the stop loss of 65.30
(* NSE Future | Source: Reliable Software, Open: Tuesday 9.00 AM IST, Close: Thursday(5.00 PM IST)
Market Stance
A softer-than-expected U.S. jobs data decreased the probability that Federal
Reserve may hike interest rates during coming meet. It helped the Rupee to
gain further strength against dollar and crossed the strong resistance of 66.75-
67.00 levels and reached 5 months high. At same time, after reaching a life-
time high last week, the India Forex Reserve marginally declined by $392.6
million to $366.77 billions. Dollar Index lost ground and closed below 95
levels. The euro gained strength after the European Central Banks left
interest rates unchanged and no indications of further expand its huge asset-
purchase programme. The expectation of expanding monetary stimulus
package from the Japanese central bank is also diming as officials at the Bank
of Japan are divided. The crude oil surged to near 50$/bbl on fall in US crude
inventories and strong China's crude import data. The weakness in dollar
offered boost to Gold prices. In coming days, global markets will focus on FED
and BoJ policy decision for direction.
EUR/INR
USD/INR (SEP) contract closed at 66.59 on 08th Sep'16. The contract made its high of 66.80 on 06th Sep'16 and a low of 66.52 on 07th Sep'16 (Weekly Basis). The 14-day Exponential Moving Average of the USD/INR is currently at 66.98.
On the daily chart, the USD/INR has Relative Strength Index (14-day) value of 36.43. One can sell below 66.40 for the target of 65.90 with the stop loss of 66.65.
GBP/INR (SEP) contract closed at 89.00 on 08th Sep'16. The contract made its high of 89.35 on 07th Sep'16 and a low of 88.80 on 08th Sep'16 (Weekly Basis). The 14-day Exponential Moving Average of the GBP/INR is currently at 88.64.
On the daily chart, GBP/INR has Relative Strength Index (14-day) value of 53.36. One can buy above 89.50 for a target of 90.40 with the stop loss of 89.00.
USD/INRTechnical Recommendation
Economic gauge for the next week
Date Currency Event Previous
13th Sep USD Federal Budget Balance (Aug) -113B
14th Sep EUR Industrial Production (MoM) (Jul) 0.6%
14th Sep USD Export Price Index (MoM) (Aug) 0.2%
15th Sep EUR CPI (YoY) (Aug) 0.2%
15th Sep USD Core Retail Sales (MoM) (Aug) -0.3%
15th Sep EUR Philadelphia Fed Manufacturing Index (Sep) 2.0
15th Sep USD PPI (MoM) (Aug) -0.4%
15th Sep USD Industrial Production (MoM) (Aug) 0.7%
16th Sep USD Michigan Consumer Sentiment (Sep) 89.8
GBP/INR JPY/INR
14
®

About the company
Book Running Lead Manager
Kotak Mahindra Capital Company Ltd
DSP Merrill Lynch Limited
SBI Capital Markets Ltd.
Name of the registrar
Karvy Computershare Private Limited
Shareholding Pattern (%)
Particulars Pre-issue Post issue
Promoters & promoters group 100.00% 89.77%
QIB 0.00% 5.11%
NIB 0.00% 1.53%
Retail 0.00% 3.58%
Total 100.00% 100.00%
Issue Highlights
Industry ER&D
Total Issue(Shares)-Offer for sale 10,400,000
Total Issue(Shares)-Fresh Issue 0
Net Offer to the Public 10,400,000
Issue Size (` Cr.) 884-894
Price Band (`) 850-860
Offer Date 12-Sep-16
Close Date 15-Sep-16
Face Value `2
Lot Size 16 Equity Share
Issue Composition
Total Issue for Sale 10,400,000
QIB 5,200,000
NIB 1,560,000
Retail 3,640,000
In shares
Incorporated in 2012, L&T Technology Services Ltd is India based third-party ER&D (Engineering,
Research and Development) service provider. L&T Tech provide services to manufacturing,
technology and process engineering companies to help them develop and build products,
processes and infrastructure required to deliver products and services to their end customers.
SMC Ranking
(3/5)
JM Financial Institutional Securities Limited
Competitive Strengths
Leading global pure-play ER&D services company:
As a pure-play ER&D Services Company, the company has developed a comprehensive range of
service offerings in order to address the varied and expanding requirements of its customers.
Well-diversified player :
The Company believes that its success in the customer engagements in various segments has
enhanced its recognition in the global ER&D market. It has long-standing relationships with its
customers, which include more than 50 leading Fortune 500 companies and technology leaders
in their industry including P&G, UTC, Danaher, Eaton, Rockwell Automation and Calsonic Kansei.
Objects of the Issue
1. To achieve the benefits of listing the Equity Shares
on the Stock Exchanges and
2. To carry out the sale of up to 10,400,000 Equity
Shares by the Selling Shareholder.
Valuation
At upper price band of Rs.860 , EPS and P/E of FY2017 are
Rs. 48.65 and 17.68 multiple respectively and at a lower
price band of Rs. 850, P/E multiple is 17.47; at upper
price band of Rs.860 , book value and P/B of FY2017 are
Rs.110.81 and 7.76 multiple respectively and at a lower
price band of Rs. 850, P/B multiple is 7.67. No change in
pre and post issue EPS and Book Value as the company is
not making fresh issue of capital.
Strategy
Drive higher growth in key segments: The Company aims to pursue growth strategies to expand its market share across key segments
and verticals, geographies and solutions. The company is working on enhancing its capacity in
AUTOSAR, functional safety, hardware in loop (“HIL”) and cyber security.
Grow its revenues from existing customers and develop new customer relationships The company aims to further penetrate the business of its existing customers by expanding the
nature and scope of its services. The company plans to focus on driving these initiatives through
its “T30:A3” model.
Focus on driving solutions-oriented engineering services that are applicable across verticals The company focuses on building a portfolio of solutions-oriented engineering services that can
be applied across verticals.
Expand its business and geographical footprint through selective acquisitions The company intends to augment its organic growth by continuing to pursue selective
acquisitions and strategic alliances that provide us access to better infrastructure, industry
knowledge, technology expertise and geographical reach and allow it to expand its vertical
offerings and customer base.
Risk FactorxRevenues are highly dependent on customers primarily located in North America and EuropexIntense competition in the market for ER&D services
Outlook
The company delivers services through a network of delivery centres located across the U.S. and
India and from its customers' locations. However its revenues of the company are highly
dependent on customers primarily located in North America and Europe as well as on customers
concentrated in certain segments, notably industrial products, transportation, telecom and hi-
tech, process industry and medical devices. A long term investors may consider investment in
this issue.
Focused on driving innovation through in-house R&D, IP and strategic alliances:
The company is focused on driving innovation and adopting solutions in line with technological
trends. The company works closely with international and national scientific institutions in
order to continually source ideas for engineering solutions.
15
®

®
16
FIXED DEPOSIT MONITOR
• Interest structure may be revised by company from time to time. Pls confirm Interest rates before submitting the application.
* For Application Greater Than Rs. Fifty Lakhs Or equal to Fifty Lakhs, Please Contact to Head Office.
* Email us at [email protected]
FIXED DEPOSIT COMPANIES
PERIOD MIN.ADDITIONAL RATE OF INTEREST (%)
S.NO (NBFC COMPANY -NAME)12M 18M 24M 36M 45M 48M 60M 84M INVESTMENT
1 BAJAJ FINANCE LTD.(UPTO RS. 5 CR.) 8.30 8.40 8.45 8.45 - 8.45 8.45 - 0.25% FOR SR. CITIZEN, 0.10% FOR DELHI NCR &
EXISTING LOAN CUSTOMER AND ON RENEWAL MUMBAI-75000,
UPTO RS. 1CRORE OTHER-50000/-
2 DEWAN HOUSING FINANCE CORPORATION LTD 13M=8.60% 14M=8.60% 18M=8.60% 40M=8.65% 0.25% EXTRA FOR SR. CITIZEN,WIDOW, 13M=50000;
ARMED, PERSONNEL, EXISTING DHFL HOME 14M=10000;
BORROWERS, 0.25% EXTRA FOR DEPOSIT
50 LAC AND ABOVE
3 DEWAN HOUSING FINANCE CORPORATION LTD (AASHRAY) 8.25 - 8.50 8.60 - 8.65 - 8.65 10,000/-
4 GRUH FINANCE LTD. 7.50 13M=7.50 7.75 8.00 - 8.00 8.00 8.00 96-120M=8.00%; 0.25% FOR FEMALE, 1000/-
SR. CITIZEN & TRUST
5 HDFC PREMIUM DEPOSIT FOR INDIVIUAL (UPTO RS. 2 CR.) 15M=8.00 30M=8.00 22M=8.05 44M=8.05 - 0.25% FOR SR. CITIZEN UPTO RS. 1 CR. 20000/-, 40000/-
IN MONTHLY
6 HDFC PREMIUM DEPOSIT FOR TRUST & INSTITUTION (UPTO RS. 10 CR.) 20M=7.95 - 40M=7.95 -
7 HDFC LTD FOR INDIVIDUAL & TRUST (UPTO RS.5 CR.) 7.90 - 7.90 7.90 - 7.90 7.90 - 0.25% FOR SR. CITIZEN UPTO RS. 1 CR.
8 HUDCO LTD.(IND & HUF) 7.70 - 7.70 7.70 - 7.70 7.55 7.55 0.25% FOR SR. CITIZEN 10000/-
9 HUDCO LTD.(TRUST/CO/INSTITUTION) 7.50 - 7.50 7.50 - 7.50 7.50 7.50 - 10000/-
10 KTDFC (Kerela Transport) 8.50 - 8.50 8.50 - 8.25 8.25 - 0.25% extra for Sr. Citizen, 10000/-
11 LIC HOUSING FINANCE LTD.(UPTO RS. 5 CR.) 8.00 8.00 8.10 8.15 - - 8.25 - 0.25% FOR SR.CITIZEN IF APP ABOVE RS. 50,000/- APP 10000/-
UPTO RS. 50,000/- & 0.10% IF APP upto Rs. 50,000/-
11 M&M FINANCIAL SERVICES LTD (FOR BELOW RS. 1 CRORE) 8.45 8.45 8.45 8.45 - 8.45 8.45 - 0.25% FOR SR. CITIZEN 10000/-
12 Omaxe Ltd. 11.50 - 12.00 12.50 - - - - - 50000/-
12 PNB HOUSING FINANCE LTD.(UPTO RS. 5 CR.) 8.00 - 8.00 8.25 - 8.25 8.25 8.25 0.25% EXTRA FOR SR. CITIZEN UPTO RS.1 CRORE 20000/-
13 PNB HOUSING FINANCE LTD.(UPTO RS. 5 CR.) 15M=8.05 30M=8.35 22M=8.05 44M=8.45 - 0.25% FOR SR. CITIZEN
14 SHRIRAM TRANSPORT FINANCE-UNNATI SCHEME 8.25 - 8.25 8.50 - 8.75 8.75 - 0.25% FOR SR. CITIZEN 5000/-
15 SHRIRAM CITY UNION SCHEME 8.25 - 8.25 8.50 - 8.75 8.75 - 0.25% FOR SR. CITIZEN 5000/
(FOR TRUST ONLY) (FOR WOMEN ONLY)


Returns (%) Risk Market Cap (%)
Scheme Name NAV Launch QAAUM 3M 6M 1Y 3Y Since Std.Dev Jenson LARGE MID SMALL DEBT &
(`) Date (` Cr.) Launch CAP CAP CAP OTHER
DSP BlackRock Balanced Fund - Growth 127.32 27-May-1999 1101.03 13.01 24.29 21.64 25.75 15.84 1.78 0.20 50.56 18.80 2.46 28.17
ICICI Prudential Balanced - Growth 106.41 03-Nov-1999 2791.56 13.23 22.17 20.58 25.11 15.06 1.65 0.15 52.51 16.99 1.15 29.35
Birla Sun Life Balanced 95 - Growth 649.84 10-Feb-1995 2797.01 9.69 21.31 20.37 25.41 21.33 1.66 0.18 43.60 24.16 N.A 32.24
Kotak Balance - Growth 21.18 05-Nov-2014 265.19 9.12 21.86 19.91 N.A 10.22 1.61 0.11 41.57 22.08 1.42 34.93
Mirae Asset Prudence Fund - Reg - Growth 11.33 29-Jul-2015 211.64 9.07 20.01 19.63 N.A 11.86 1.77 0.10 63.07 3.92 N.A 33.01
HDFC Prudence Fund - Growth 426.18 01-Feb-1994 8317.25 12.47 25.61 19.61 27.11 19.42 2.08 0.08 40.28 17.67 8.64 33.41
HDFC Balanced Fund - Growth 123.84 11-Sep-2000 5707.42 9.89 21.55 18.73 27.85 17.03 1.68 0.15 43.49 24.36 1.29 30.86
Annualised
Returns (%) RiskAverage Yield till
Scheme Name NAV Launch QAAUM Since Std. SharpeMaturity (Days) Maturity
1W 2W 1M 6M 1Y 3Y(`) Date (`Cr.) Launch Dev.
ICICI Prudential Dynamic Bond F - Prem Plus - G 18.61 14-Jan-2010 908.37 29.18 22.08 18.86 19.67 13.93 12.43 9.79 22.20 0.26 2434.55 7.78
HDFC Income Fund - Growth 36.78 11-Sep-2000 2964.98 26.03 23.41 22.76 23.27 13.65 11.55 8.48 27.42 0.19 6139.30 7.53
ICICI Prudential LTP - Growth 19.38 20-Jan-2010 839.77 23.81 17.87 17.05 22.46 13.46 13.39 10.48 28.46 0.20 3697.45 7.31
ICICI Prudential Income Fund -Growth 50.16 09-Jul-1998 3205.75 27.23 21.10 19.38 22.67 12.93 11.45 9.28 28.70 0.18 4040.55 7.57
Kotak Bond Deposit - Reg - Growth 42.37 25-Nov-1999 4191.67 23.80 20.77 21.31 21.49 12.65 10.78 8.97 28.75 0.16 4423.80 7.69
Reliance Dynamic Bond Fund - Growth 21.63 15-Nov-2004 5366.60 29.99 23.37 21.08 19.73 12.43 11.12 6.75 25.91 0.18 4431.11 7.58
Reliance Income Fund - G P - Growth 51.71 01-Jan-1998 1962.52 28.64 22.42 20.66 20.18 12.26 10.56 9.18 26.96 0.17 4894.64 7.55
Returns (%) Risk Average Yield tillScheme Name NAV Launch QAAUM Since Std. Sharpe Maturity (Days) Maturity
1W 2W 1M 6M 1Y 3Y(`) Date (`Cr.) Launch Dev.
Birla Sun Life Dynamic Bond Fund - Ret - DAP 19.81 08-Apr-2009 12444.60 28.06 22.99 22.31 22.90 13.90 12.53 9.64 23.91 0.24 6741.55 7.78
HDFC HIF - Dynamic - Growth 55.20 27-Apr-1997 1920.84 23.34 20.93 20.55 22.29 13.24 11.66 9.21 27.40 0.19 4916.55 7.54
Kotak Flexi Debt Fund - Reg - Growth 24.72 07-Dec-2004 376.91 25.26 19.86 20.70 16.96 12.20 10.12 8.00 18.02 0.16 2175.39 7.93
Birla Sun Life Treasury Optimizer Plan - DAP 186.13 22-Jun-2009 5427.04 18.98 15.74 15.71 15.84 12.07 11.16 8.99 12.80 0.29 2233.80 7.69
ICICI Prudential Banking & PSU Debt F - Reg - G 17.92 01-Jan-2010 3961.68 20.27 16.17 14.28 15.61 11.73 10.35 9.11 11.94 0.27 1620.61 7.56
Birla Sun Life Short Term Opportunities F - Reg - G 26.21 24-Apr-2003 3659.39 16.82 14.30 15.08 14.20 11.07 10.69 7.46 10.16 0.30 1715.50 8.26
HDFC HIF - S T P - Growth 31.31 06-Feb-2002 1570.33 16.34 14.80 13.92 13.96 10.41 10.22 8.13 10.68 0.23 1788.50 8.22
Returns (%) Risk Average Yield tillScheme Name NAV Launch QAAUM Since Std. Sharpe Maturity (Days) Maturity
1W 2W 1M 3M 1Y 3Y(`) Date (`Cr.) Launch Dev.
Kotak Banking and PSU Debt F - Reg - G 35.32 29-Dec-1998 373.28 17.27 14.96 13.09 12.82 9.51 9.48 7.39 4.37 0.40 1251.95 7.65
ICICI Prudential Ultra Short Term Plan - Reg - G 16.03 11-Aug-2009 6639.27 13.01 11.40 10.70 11.73 9.76 9.56 6.89 5.77 0.38 824.90 7.60
Birla Sun Life Floating Rate F - LTP - Reg - G 190.57 24-Mar-2009 1915.00 9.43 9.83 10.87 10.98 9.63 9.64 9.02 3.97 0.52 602.25 7.52
Franklin India Low Duration Fund - G 17.54 26-Jul-2010 1749.86 9.08 10.09 10.18 10.80 9.62 10.01 9.61 4.85 0.48 456.25 9.53
IDFC Money Manager - Invest Plan - Plan A - G 23.81 09-Aug-2004 1706.92 11.85 10.33 9.95 10.42 9.20 9.36 7.44 6.35 0.26 624.15 7.64
Reliance Medium Term Fund - Growth 32.73 14-Sep-2000 4816.79 9.35 9.81 9.27 10.34 9.15 9.40 7.70 3.90 0.45 500.05 7.82
Birla Sun Life Savings Fund - Reg - G 305.61 15-Apr-2003 13606.00 9.95 9.75 9.57 10.03 9.32 9.60 7.81 3.12 0.62 474.50 7.62
Returns (%) Risk Market Cap (%)
Scheme Name NAV Launch QAAUM 3M 6M 1Y 3Y Since Std.Dev Beta Jenson LARGE MID SMALL DEBT &
(`) Date (` Cr.) Launch CAP CAP CAP OTHER
Sundaram Rural India Fund - Reg - G 34.51 12-May-2006 156.53 14.11 38.30 39.60 33.69 12.74 2.24 0.88 0.33 27.11 49.64 8.79 14.45
SBI Magnum COMMA Fund - Growth 29.72 08-Aug-2005 195.53 17.03 35.00 34.48 22.37 10.32 2.46 0.90 0.07 68.71 15.16 9.62 6.52
Birla Sun Life Small & Midcap Fund - G 31.23 31-May-2007 203.96 14.78 35.21 32.77 41.09 13.05 2.38 0.85 0.38 5.27 73.39 6.60 14.73
Franklin India Smaller Companies Fund - G 48.15 13-Jan-2006 2886.58 12.71 32.26 30.66 46.69 15.89 2.12 0.78 0.31 10.96 58.78 12.88 17.38
Mirae Asset Emerging Bluechip Fund - G 37.88 09-Jul-2010 1556.80 15.15 30.53 30.35 46.00 24.08 2.24 0.85 0.37 31.97 55.60 2.40 10.02
JM Basic Fund - Growth 26.29 02-Jun-1997 141.48 20.52 41.45 30.30 32.19 17.16 2.49 1.01 0.29 82.85 16.57 N.A 0.58
DSP BlackRock Micro Cap Fund - Reg - G 51.20 14-Jun-2007 2680.20 12.23 32.06 30.01 53.57 19.32 2.59 0.90 0.46 N.A 67.04 23.51 9.45
Note: Indicative corpus are including Growth & Dividend option. The above mentioned data is on the basis of 08/09/2016Beta, Sharpe and Standard Deviation are calculated on the basis of period: 1 year, frequency: Weekly Friday, RF: 7%
Annualised
18
MUTUAL FUND Performance Charts
EQUITY (Diversified)
INCOME FUND
ULTRA SHORT TERM
SHORT TERM FUND
Due to their inherent long term nature, the following 3 categories have been sorted on the basis of 1 year returns
Due to their inherent short term nature, Short term funds and Ultra short term funds have been sorted on the basis of 6month and 3month returns respectively
Annualised
®
BALANCED