Wisconsin's Forest Resources - dnr.wi.gov · middle 3 S ince 1968, Wisconsin’s forests have...
11
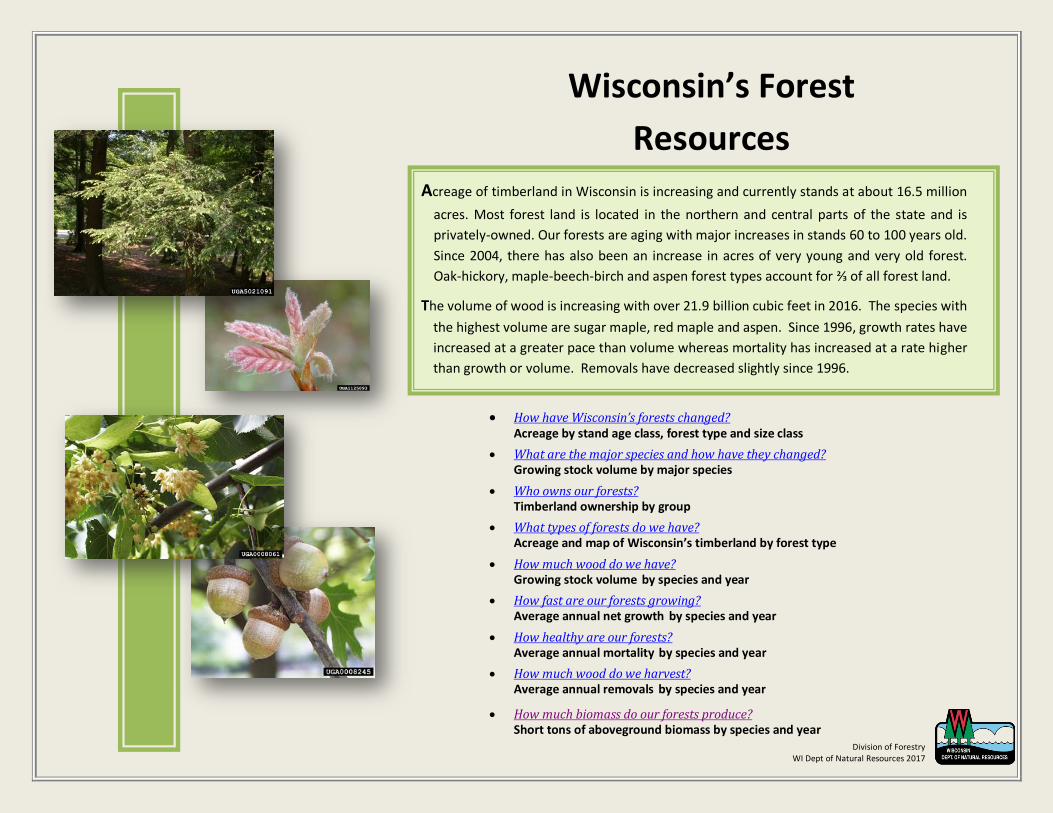
Wisconsin’s Forest Resources How have Wisconsin’s forests changed? Acreage by stand age class, forest type and size class What are the major species and how have they changed? Growing stock volume by major species Who owns our forests? Timberland ownership by group What types of forests do we have? Acreage and map of Wisconsin’s timberland by forest type How much wood do we have? Growing stock volume by species and year How fast are our forests growing? Average annual net growth by species and year How healthy are our forests? Average annual mortality by species and year How much wood do we harvest? Average annual removals by species and year How much biomass do our forests produce? Short tons of aboveground biomass by species and year Acreage of timberland in Wisconsin is increasing and currently stands at about 16.5 million acres. Most forest land is located in the northern and central parts of the state and is privately-owned. Our forests are aging with major increases in stands 60 to 100 years old. Since 2004, there has also been an increase in acres of very young and very old forest. Oak-hickory, maple-beech-birch and aspen forest types account for ⅔ of all forest land. The volume of wood is increasing with over 21.9 billion cubic feet in 2016. The species with the highest volume are sugar maple, red maple and aspen. Since 1996, growth rates have increased at a greater pace than volume whereas mortality has increased at a rate higher than growth or volume. Removals have decreased slightly since 1996. Division of Forestry WI Dept of Natural Resources 2017
Transcript of Wisconsin's Forest Resources - dnr.wi.gov · middle 3 S ince 1968, Wisconsin’s forests have...
Wisconsin’s Forest
Resources
How have Wisconsin’s forests changed? Acreage by stand age class, forest type and size class
What are the major species and how have they changed? Growing stock volume by major species
Who owns our forests? Timberland ownership by group
What types of forests do we have? Acreage and map of Wisconsin’s timberland by forest type
How much wood do we have? Growing stock volume by species and year
How fast are our forests growing? Average annual net growth by species and year
How healthy are our forests? Average annual mortality by species and year
How much wood do we harvest? Average annual removals by species and year
How much biomass do our forests produce? Short tons of aboveground biomass by species and year
Acreage of timberland in Wisconsin is increasing and currently stands at about 16.5 million
acres. Most forest land is located in the northern and central parts of the state and is
privately-owned. Our forests are aging with major increases in stands 60 to 100 years old.
Since 2004, there has also been an increase in acres of very young and very old forest.
Oak-hickory, maple-beech-birch and aspen forest types account for ⅔ of all forest land.
The volume of wood is increasing with over 21.9 billion cubic feet in 2016. The species with
the highest volume are sugar maple, red maple and aspen. Since 1996, growth rates have
increased at a greater pace than volume whereas mortality has increased at a rate higher
than growth or volume. Removals have decreased slightly since 1996.
Division of Forestry WI Dept of Natural Resources 2017

Figure 1. Acreage of timberland by forest type and inventory year (USDA Forest Service, Forest Inventory & Analysis).
“How have Wisconsin’s forests changed?”
Acreage by stand age class, forest type and size class
There were about 16.5 million acres of timberland in Wisconsin in 2016. This is an increase of 1.8 million acres since 1983 and 845,000 acres
since 1996. Most of this increase has been in central and southeast Wisconsin.
About two-thirds of all timberland is classified as either maple- beech- birch, oak- hickory or aspen- birch forest type (Figure 1). Since 1938, the
acreage in aspen-birch has decreased by over 2 million acres and the acreage of oak-hickory has increased by over 2 million acres. Acreage in
maple- beech- birch and elm-ash-cottonwood has increased by over 1 million acres each.
For a table of acreage by forest type and county, go to:
Timberland acreage by forest type group and county
- 1,000 2,000 3,000 4,000 5,000 6,000
Oak-hickory
Maple-beech-birch
Aspen-birch
Elm-ash-cottonwood
White-red-jack pine
Spruce-fir
4,285
3,764
2,905
1,713
1,676
1,348
Thousand acres
Acres of timberland by forest type
2016
2004
1996
1983
1938

Since 1968, Wisconsin’s forests have become more
middle-aged with fewer acres in the very youngest and
very oldest age classes (Figure 2). For example, from
1968 to 2016, acreage in stands 40 years old or less
decreased from 50% of all acres to only 27%. But this
trend may be changing. Since 2004, acreage in young
stands (less than 20 years old) has increased 7% and
acreage in stands over 100 years old has increased by
66%.
The distribution of acreage by stand size class reflects
the same process of forest maturation (Figure 3).
Between 1968 and 2016, the area in sawtimber
stands increased by 4.4 million acres whereas the
acreage in seedling/sapling and pole stands
decreased by over 2.2 million acres.
%.
Figure 2. Acreage of timberland by stand age class and inventory year (USDA Forest Service, Forest Inventory & Analysis)
For tables of stand age and size class by county go to:
Acreage of timberland by stand age class and county
Acreage of timberland by stand size class and county
Figure 3. Acreage of timberland by stand size class and inventory year (USDA Forest Service, Forest Inventory & Analysis)
0
0.5
1
1.5
2
2.5
3
3.5
4
4.5
5
0-20 21-40 41-60 61-80 81-100 101-120 121+
Acr
es
Tho
usa
nd
acr
es
Stand age class (yrs)
Area of timberland by stand age class
1968 1983 1996 2004 2016
-
1
2
3
4
5
6
7
8
9
Seedling/sapling Poletimber Sawtimber
8.1
2.92.4
3.4
5.5
7.5M
illio
n ac
res
Area of timberland by stand size class
1938
1968
1983
1996
2004
2016

0.0
0.5
1.0
1.5
2.0
2.5
3.0
Sugar
maple
Red maple Northern
red oak
White pine Red pine Ash Basswood White oaks Black &
northern pin
oaks
Northern
white-cedar
Spruce Hemlock Elm Tamarack Hickory Black
cherry
Yellow
birch
Jack pine Balsam Fir Paper Birch Aspen
Bil
lio
n c
ub
ic f
ee
t
Volume of growing stock for major species
1983 1996 2006 2016
“What are the major species and how have they changed?”
Growing stock volume by major species
There are 21.9 billion cubic feet of wood in Wisconsin’s forests. The species with the greatest growing stock volume is sugar maple where volume
has increased by 62% since 1983. The second highest is red maple where volume has doubled since 1983.
The greatest percentage volume gains since 1983 have been in eastern white pine (220%), tamarack (141%), red pine (127%), red maple (98%),
ash (97%) and the white oak group (64%, white oak, bur oak, swamp white oak). The greatest percentage volume losses since 1983 have
been in jack pine (-57%), paper birch (-55%), elm (-28%), balsam fir (-25%) and aspen (-12%).
Figure 4. Volume of growing stock (billon cubic feet) by species and inventory year (USDA Forest Service, Forest Inventory & Analysis)
57%
6%
2%
2%
2%
10%
7%
14%
Acreage of timberland by owner group
Individual
Corporate
Forest industry
Native American
Other private
Federal
State
Other government
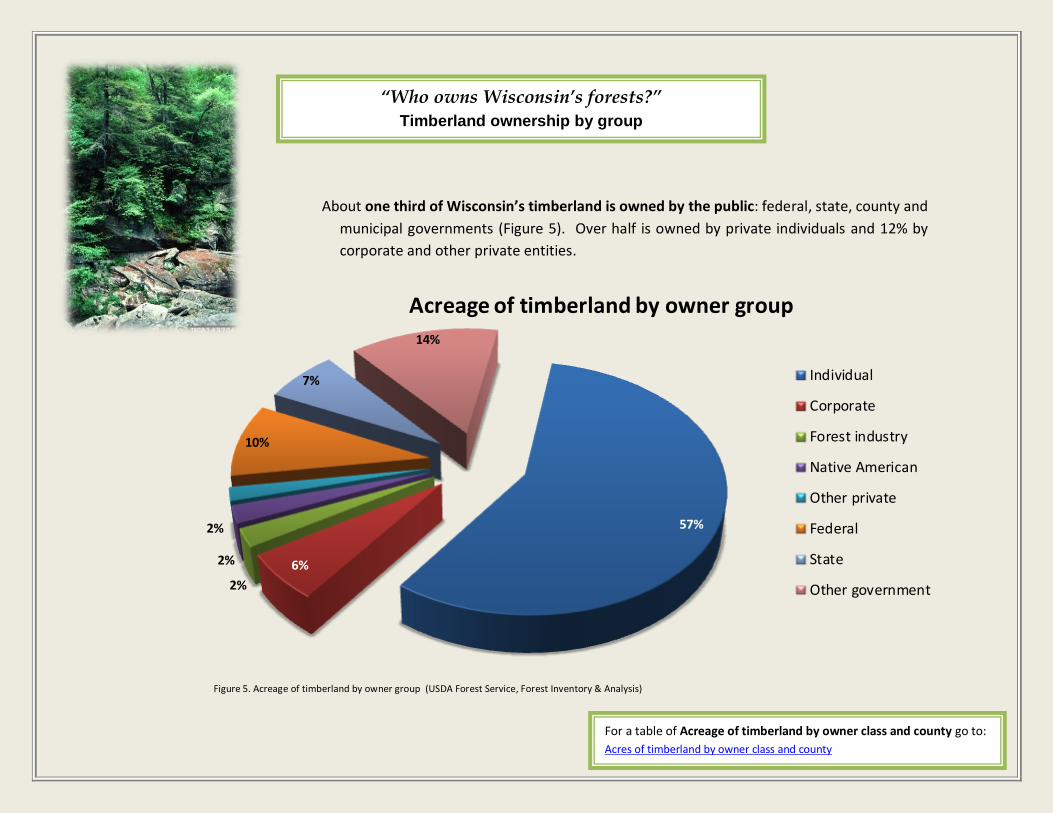
“Who owns Wisconsin’s forests?”
Timberland ownership by group
About one third of Wisconsin’s timberland is owned by the public: federal, state, county and
municipal governments (Figure 5). Over half is owned by private individuals and 12% by
corporate and other private entities.
For a table of Acreage of timberland by owner class and county go to:
Acres of timberland by owner class and county
Figure 5. Acreage of timberland by owner group (USDA Forest Service, Forest Inventory & Analysis)

“What types of forests do we have?”
Acreage and map of Wisconsin’s timberland by forest type
Wisconsin’s forests are located mostly in the northern and central
parts of the state (Table 1, map). Pine and oak-pine predominate
in the sandy soils of central, northwest and northeast Wisconsin.
Oak-hickory forest type occurs mostly in the southwest and
central parts of the state. Aspen-birch, maple-basswood and
spruce fir are primarily northern forest types. Bottomland
hardwoods are distributed throughout the state in low-lying
areas.
Source: WISCLAND land cover, Wisconsin Dept. of Natural Resources, 1998
Table 1. Acres (1,000) of timberland by major forest type and region of the state
Forest type group North east
North west
Central Southwest
Southeast
Total
Oak-hickory 374 920 1,202 1,317 472 4,285
Maple-beech-birch 1,417 1,466 375 320 187 3,764
Aspen-birch 917 1,465 352 112 58 2,905
Elm-ash-cottonwood 333 492 334 205 349 1,713
White-red- jack pine 472 449 600 79 76 1,676
Spruce-fir 639 513 121 6 69 1,348
Oak-pine 142 145 186 25 27 525
Minor types* 41 76 83 48 61 308
Total 4,334 5,526 3,253 2,112 1,300 16,524
* Includes nonstocked land, exotic hardwoods and exotic softwoods. Source: USDA Forest Service, Forest Inventory & Analysis data

“How much wood do we have?”
Growing stock volume by species and year
Table 2. Growing stock volume in million cubic feet on timberland.
Species group 1983 1996 2006 2016 Change
since 1983
Sugar maple 1,494 2,234 2,205 2,414 62%
Aspen 2,628 2,520 2,342 2,318 -12%
Red maple 1,132 1,834 2,013 2,245 98%
N red oak 1,423 1,845 1,665 1,944 37%
E white pine 567 1,073 1,282 1,817 220%
Red pine 766 1,024 1,443 1,739 127%
Ash 738 1,021 1,184 1,455 97%
Basswood 836 1,117 1,068 1,207 44%
White oaks 633 1,021 1,010 1,038 64%
Black & N pin oaks 627 688 848 795 27%
N white-cedar 472 617 686 715 52%
Paper Birch 1,053 845 639 469 -56%
Spruce 325 399 443 455 40%
Hemlock 284 439 425 453 59%
Balsam Fir 556 479 402 417 -25%
Tamarack 134 270 279 322 140%
Elm 435 284 384 311 -28%
Hickory 194 220 250 298 54%
Black cherry 164 207 246 261 59%
Yellow birch 208 266 271 256 23%
Jack pine 526 388 283 226 -57%
Black walnut 23 50 84 124 440%
Minor species 200 322 383 620 210%
Total 15,417 19,164 19,835 21,897 42%
Wisconsin has 21.9 billion cubic feet of growing stock volume in trees over
5 inches in diameter, an increase of 42% since 1983 (Figure 6). The
volume of white pine has tripled and the volume of red maple,
tamarack, ash and red pine has doubled since 1983 (Table 2). White
oak, hemlock, black cherry, hickory, northern white cedar and sugar
maple volume has also increased by over 50%. The volume of black
walnut has increased fivefold.
Jack pine and paper birch have undergone the largest decrease in volume
in the last three decades. Balsam fir, elm and aspen also have shown
declines.
Source: USDA Forest Service, Forest Inventory & Analysis
Figure 6. Volume of growing stock (billion cubic feet) by inventory year (USDA Forest Service, Forest Inventory & Analysis).
21.9
-
5
10
15
20
25
1938 1943 1948 1953 1958 1963 1968 1973 1978 1983 1988 1993 1996 2004 2009 2016
Bill
ion
cubi
c fe
et
Total growing stock volume

Table 3. Growing stock volume net growth and the ratio of growth to volume by species.
Species Growing stock
volume (million cft) Average annual net growth (million cft)
Ratio of growth to volume
Black walnut 124 6.0 4.8%
Red pine 1,739 70.5 4.1%
White pine 1,817 71.1 3.9%
Beech 35 1.1 3.3%
Aspen 2,318 71.9 3.1%
Red maple 2,245 67.6 3.0%
N red oak 1,944 54.1 2.8%
Black cherry 261 7.2 2.8%
Hickory 298 8.2 2.8%
Ash 1,455 36.8 2.5%
Tamarack 322 8.1 2.5%
Balsam Fir 417 9.7 2.3%
Sugar maple 2,414 53.2 2.2%
Jack pine 226 4.5 2.0%
Basswood 1,207 24.0 2.0%
N white-cedar 715 14.2 2.0%
Spruce 455 8.4 1.8%
White oaks 1,038 19.1 1.8%
Yellow birch 256 4.0 1.6%
Hemlock 453 6.4 1.4%
Black & N pin oaks 795 9.2 1.2%
Elm 311 1.1 0.4%
Paper Birch 469 -2.8 -0.6%
Minor species 585 20.8 3.6%
Total 21,897 574.4 2.6%
“How fast are our forests growing?”
Average annual net growth by species and year
Average annual net growth has increased about 17% since 1983 to 574
million cubic feet (Figure 7). The average ratio of growth to volume
is 2.6% statewide but some species surpass this.
Black walnut, red pine, eastern white pine, American beech, aspen and
red maple have the highest growth to volume ratios. Paper birch,
elm, yellow birch, hemlock, black oak and northern pin oak have
growth ratios far below average. High mortality will decrease net
growth significantly (net growth is equal to gross growth minus
mortality) as is the case with aspen, elm, paper birch, black and
northern pin oaks and balsam fir.
Figure 7. Average annual net growth of growing stock by inventory year (USDA Forest Service, Forest Inventory & Analysis).
500 493 490
542574
0
100
200
300
400
500
600
1968 1983 1996 2009 2016
Mil
lio
n c
ft
Average annual net growth

“How healthy are our forests?”
Average annual mortality by species and year
Table 4. Annual mortality, gross growth of growing stock (million cubic feet) and the ratio of mortality to growth by species.
Species group Annual mortality
(million cft)
Volume of growing stock
(million cft)
Ratio of mortality to
volume
Elm 20.9 311.2 6.7%
Balsam Fir 17.7 417.4 4.2%
Paper Birch 18.0 468.6 3.8%
Jack pine 7.2 225.7 3.2%
Aspen 64.4 2,317.7 2.8%
Black & N pin oaks 17.1 795.3 2.1%
Spruce 9.2 454.9 2.0%
Black cherry 4.3 260.9 1.7%
Yellow birch 2.9 256.1 1.1%
Tamarack 3.6 321.7 1.12%
Ash 12.2 1,455.0 0.8%
Hemlock 3.5 452.8 0.8%
Basswood 8.2 1,206.7 0.7%
Hickory 1.9 297.9 0.6%
White oaks 4.4 1,037.8 0.4%
Northern red oak 7.5 1,944.0 0.4%
Red maple 8.2 2,244.6 0.4%
N white-cedar 2.3 715.1 0.3%
White pine 5.6 1,816.7 0.3%
Sugar maple 6.2 2,413.9 0.3%
Red pine 2.8 1,739.5 0.2%
Beech 0.0 34.9 0.1%
Black walnut 0.0 124.2 0.0%
Minor species 5.0 584.9 0.8%
Total 233.1 21,897 1.1%
Source: USDA Forest Service, Forest Inventory & Analysis
Average annual mortality has increased at a faster pace than
volume since 1996 and is currently 233 million cubic feet per
year. Volume increased 12.7% but morality increased by 23.9%
(Figure 8). Over 1% of all volume is lost to mortality (Table 4).
Certain species have experienced elevated mortality, especially
elm, balsam fir, paper birch, jack pine, aspen, black oak and
northern pin oak.
The species with the lowest ratio of mortality to volume are black
walnut, red pine, sugar maple, northern white-cedar, eastern
white pine, red maple, American beech and northern red oak.
60
135
189212
233
0
50
100
150
200
250
1968 1983 1996 2009 2016
Mill
ion
cu
bic
feet
Average annual mortality
Figure 8. Average annual mortality by inventory year (USDA Forest Service, Forest Inventory & Analysis).

“How much wood do we harvest?”
Average annual removals by species and year
On average, we harvest 300.3 million cubic feet annually, down from 332
million cubic feet in 1996 (Figure 9). This is about half of annual growth.
Average annual removals for paper birch, jack pine, black and northern pin
oaks, and elm equaled or exceeded annual growth (Table 5). Most of this
is due to high mortality causing low net growth. The species with the
highest growth to removals ratio include northern white-cedar, eastern
white pine, American beech, tamarack, hickory, ash and northern red oak
due to low removals and/or high growth rates.
Table 5. Average annual removals, net growth and the ratio of growth to removals.
Species group Annual
removals (million cft)
Annual net growth (million cft)
Ratio of growth to removals
N white-cedar 1.0 14.2 14.5
White pine 11.5 71.1 6.2
Beech 0.3 1.1 4.1
Tamarack 2.0 8.1 4.0
Hemlock 1.7 6.4 3.9
Hickory 2.2 8.2 3.7
N red oak 16.8 54.1 3.2
Ash 12.3 36.8 3.0
Black walnut 2.0 6.0 3.0
Black cherry 3.2 7.2 2.3
Sugar maple 23.9 53.2 2.2
White oaks 9.2 19.1 2.1
Basswood 11.7 24.0 2.0
Red maple 33.6 67.6 2.0
Red pine 39.5 70.5 1.8
Balsam Fir 5.5 9.7 1.8
Yellow birch 2.4 4.0 1.7
Spruce 5.8 8.4 1.5
Aspen 66.0 71.9 1.1
Jack pine 7.6 4.5 0.6
Black & N pin oaks 20.1 9.2 0.5
Elm 2.8 1.1 0.4
Paper Birch 13.1 -2.8 (0.2)
Minor species 6.1 20.8 3.4
Grand Total 300.3 574.4 1.9
Source: USDA Forest Service, Forest Inventory & Analysis
Figure9. Average annual removals (million cubic feet) of growing stock by inventory year (USDA Forest Service, Forest Inventory & Analysis).
233 227
332 346314 300
0
50
100
150
200
250
300
350
400
1968 1983 1996 2004 2009 2016
Mill
ion
cubi
c fee
t
Average annual removals
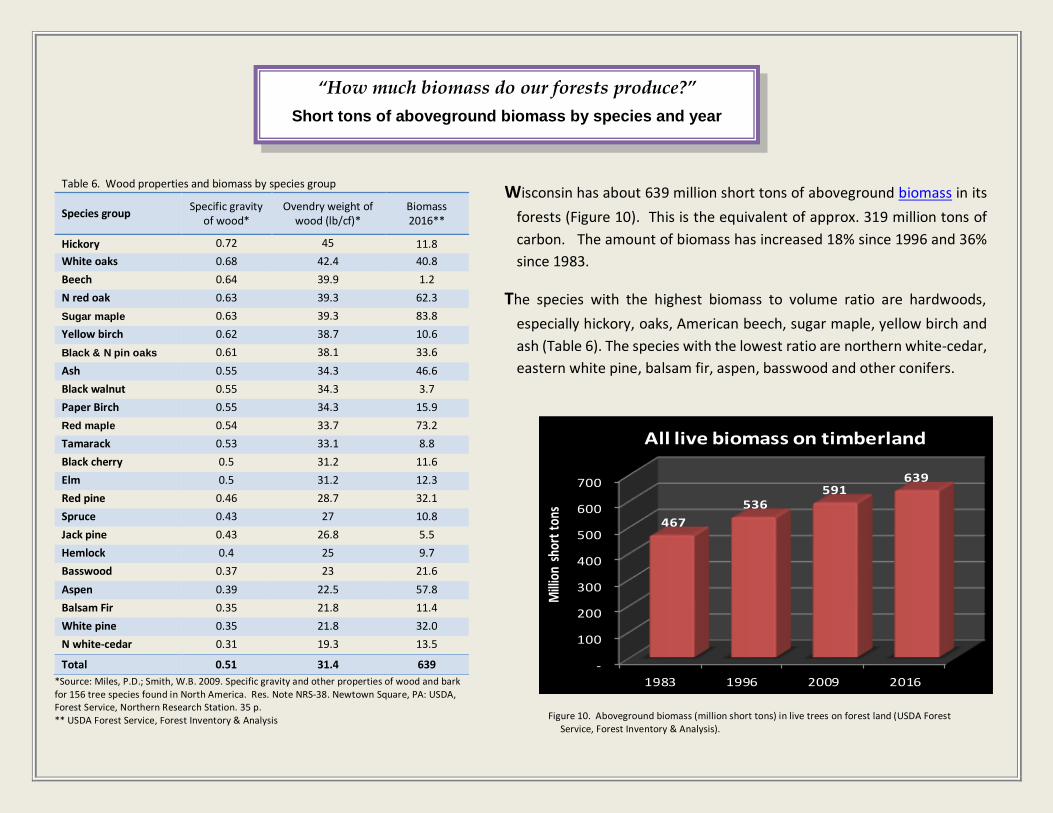
Table 6. Wood properties and biomass by species group
Species group Specific gravity
of wood* Ovendry weight of
wood (lb/cf)* Biomass 2016**
Hickory 0.72 45 11.8
White oaks 0.68 42.4 40.8
Beech 0.64 39.9 1.2
N red oak 0.63 39.3 62.3
Sugar maple 0.63 39.3 83.8
Yellow birch 0.62 38.7 10.6
Black & N pin oaks 0.61 38.1 33.6
Ash 0.55 34.3 46.6
Black walnut 0.55 34.3 3.7
Paper Birch 0.55 34.3 15.9
Red maple 0.54 33.7 73.2
Tamarack 0.53 33.1 8.8
Black cherry 0.5 31.2 11.6
Elm 0.5 31.2 12.3
Red pine 0.46 28.7 32.1
Spruce 0.43 27 10.8
Jack pine 0.43 26.8 5.5
Hemlock 0.4 25 9.7
Basswood 0.37 23 21.6
Aspen 0.39 22.5 57.8
Balsam Fir 0.35 21.8 11.4
White pine 0.35 21.8 32.0
N white-cedar 0.31 19.3 13.5
Total 0.51 31.4 639
*Source: Miles, P.D.; Smith, W.B. 2009. Specific gravity and other properties of wood and bark for 156 tree species found in North America. Res. Note NRS-38. Newtown Square, PA: USDA, Forest Service, Northern Research Station. 35 p. ** USDA Forest Service, Forest Inventory & Analysis
Wisconsin has about 639 million short tons of aboveground biomass in its
forests (Figure 10). This is the equivalent of approx. 319 million tons of
carbon. The amount of biomass has increased 18% since 1996 and 36%
since 1983.
The species with the highest biomass to volume ratio are hardwoods,
especially hickory, oaks, American beech, sugar maple, yellow birch and
ash (Table 6). The species with the lowest ratio are northern white-cedar,
eastern white pine, balsam fir, aspen, basswood and other conifers.
Figure 10. Aboveground biomass (million short tons) in live trees on forest land (USDA Forest Service, Forest Inventory & Analysis).
“How much biomass do our forests produce?”
Short tons of aboveground biomass by species and year
-
100
200
300
400
500
600
700
1983 1996 2009 2016
467
536 591
639
Mill
ion
shor
t to
ns
All live biomass on timberland