Wisconsin Occupational Health Indicator Report · Occupational health indicators are summary...
65
Wisconsin Occupational Health Indicator Report Summary of Worker Health and Safety Data For Years 2003 – 2012 Published April 2016 Wisconsin Department of Health Services Division of Public Health Bureau of Environmental and Occupational Health Wisconsin Occupational Health Program Available online at http://www.dhs.wisconsin.gov/publications/p4/p45104.pdf Funded by the Wisconsin Department of Health Services through CDC-NIOSH State-Based Occupational Safety and Health Surveillance, Grant Number 1 U60 OH 010898. Suggested Citation: Wisconsin Department of Health Services, Division of Public Health, Bureau of Environmental and Occupational Health. Wisconsin Occupational Health Indicator Report: Summary of worker health and safety data for years 2003-2012. P-45104 (04/2016)
Transcript of Wisconsin Occupational Health Indicator Report · Occupational health indicators are summary...

Wisconsin Occupational Health Indicator Report Summary of Worker Health and Safety Data For Years 2003 – 2012 Published April 2016 Wisconsin Department of Health Services Division of Public Health Bureau of Environmental and Occupational Health Wisconsin Occupational Health Program
Available online at http://www.dhs.wisconsin.gov/publications/p4/p45104.pdf Funded by the Wisconsin Department of Health Services through CDC-NIOSH State-Based Occupational Safety and Health Surveillance, Grant Number 1 U60 OH 010898. Suggested Citation: Wisconsin Department of Health Services, Division of Public Health, Bureau of Environmental and Occupational Health. Wisconsin Occupational Health Indicator Report: Summary of worker health and safety data for years 2003-2012. P-45104 (04/2016)

Wisconsin Occupational Health Indicator Report 2
Wisconsin Occupational Health Program Staff Henry Anderson, MD, Chief Medical Officer Phone: 608-266-1253 Email: [email protected] Mark Werner, PhD, Health Hazard Evaluation Section Chief Phone: 608-266-7480 Email: [email protected] Carrie Tomasallo, PhD, MPH, Senior Epidemiologist Phone: 608-267-4465 Email: [email protected] Yi Ou, MPH, CDC and CSTE Applied Public Health Informatics Fellow Phone: 608-266-2393 Email: [email protected] Acknowledgments This project is supported by the National Institute for Occupational Safety and Health (NIOSH). The contributors also wish to acknowledge our colleagues at NIOSH, the Council of State and Territorial Epidemiologists, and other state health and labor departments for their contributions in developing, maintaining, and publicizing the Occupational Health Indicators.

Wisconsin Occupational Health Indicator Report 3
From the Wisconsin Department of Health Services Increasingly, workers, employers, and public health professionals have turned to state government
agencies for education, expertise, and protection to ensure a safe and healthy workplace. During the
past century major advances have been made in recognizing, evaluating, and preventing hazards that
contribute to occupational injury, illness, and death. The Department of Health Services is proud to
continue in a leadership role promoting this advance.
The Division of Public Health’s Bureau of Environmental and Occupational Health has taken the lead to
move Wisconsin forward to meet the vision of Healthiest Wisconsin 2020,1 the State Health Plan:
“everyone living better, longer” by:
• Tracking occupational injuries, illnesses, and death. • Investigating circumstances around workplace illness, injury, and death in Wisconsin. • Participating in national work groups and local coalitions. • Linking environmental health, protection, and preparedness, with occupational safety,
community coalitions, and governmental agencies. • Developing and disseminating materials to educate workers and administrators about workplace
hazards and how to prevent them. • Evaluating the effectiveness of workplace interventions.
This document produced by the Bureau’s Occupational Health Program serves as an added tool to move
us toward this vision. It provides an update to the first surveillance report, released in 2006,2 and uses
the Council of State and Territorial Epidemiologists (CSTE)/National Institute of Occupational Safety and
Health (NIOSH) 22 indicators to inform the health and safety of Wisconsin’s workers. These data are
intended to empower both employers and workers to produce effective responses to illness, injury, and
death in the workplace.
Jeff Phillips Director
Henry A. Anderson, MD Chief Medical Officer

Wisconsin Occupational Health Indicator Report 4
Table of Contents Executive Summary………………………………………………………………………………………………………………………… 5 Introduction …………………………………………………………………………………………………………………………………… 7 Wisconsin Employment Demographics Profile……………………………………………………………….................. 9 CSTE/NIOSH Indicators 1. Non-fatal injuries and illnesses reported by employers……………………………………………………………. 11 2. Work-related hospitalizations………………………………………………………………………………………………….. 17 3. Fatal work-related injuries……………………………………………………………………………………………………….. 19 4. Amputations reported by employers……………………………………………………………………………………….. 23 5. Amputations identified in state workers’ compensation system……………………………………………… 25 6. Hospitalizations for work-related burns…………………………………………………………………………………… 27 7. Musculoskeletal disorders reported by employers………………………………………………………………….. 29 8. Carpal tunnel syndrome cases identified in state workers’ compensation system…………………… 31 9. Pneumoconiosis hospitalizations…………………………………………………………………………………………….. 33 10. Pneumoconiosis mortality……………………………………………………………………………………………………… 35 11. Acute work-related pesticide poisonings reported by Poison Control Center………………………… 37 12. Incidence of malignant mesothelioma…………………………………………………………………………………… 39 13. Elevated blood lead levels among adults……………………………………………………………………………….. 41 14. Workers employed in industries with high risk for occupational morbidity……………………………. 43 15. Workers employed in occupations with high risk for occupational morbidity………………………… 45 16. Workers employed in industries & occupations with high risk for occupational mortality……… 47 17. Occupational safety and health professionals………………………………………………………………………… 49 18. Occupational safety and health administration (OSHA) enforcement activities……………………… 51 19. Workers’ compensation awards…………………………………………………………………………………………….. 53 20. Low back disorder hospitalizations………………………………………………………………………………………… 55 21. Work-related asthma....………………………………………………………………………………………………………… 57 22. Work-related severe traumatic injury hospitalizations …………………………………………………………. 59 References……………………………………………………………………………………………………………………………………… 61 Data Sources………………………………………………………………………………………………………………………………….. 63

Wisconsin Occupational Health Indicator Report 5
Executive Summary It is the mission of the Bureau of Environmental and Occupational Health (in the Wisconsin Division of Public Health) to promote the public’s health through statewide programs that increase awareness of environmental and occupational health hazards and disease, and to reduce the morbidity and mortality of Wisconsin residents by preventing and controlling exposure to those hazards. The Wisconsin Occupational Health Program values a safe and healthy work environment for all people of Wisconsin and plans to continuously improve the safety of workers and the work environment through surveillance, education, and outreach. The program will track and evaluate work-related illness and injury in order to identify problem areas, inform Wisconsin residents about illness and injury in the workplace, and develop and implement effective interventions to prevent such incidents. The Wisconsin Occupational Health Program maintains a federally funded occupational health surveillance system and bases its activities around collecting detailed information for 22 indicators identified by the Council for State and Territorial Epidemiologists (CSTE) and the National Institute for Occupational Safety and Health (NIOSH). This report provides the most recent surveillance data available and is an update of the report, Occupational Health in Wisconsin – An Annual Report 2006.2 The intent of the Wisconsin Occupational Health Indicator Report is to:
• Describe the Wisconsin Occupational Health Program and its activities • Summarize data collected through indicators of occupational health and safety • Educate workers, employers, and community members to promote safe and healthy work
conditions.
Wisconsin data are available for the years 2003-2012 and are summarized for each indicator in this report, with comparisons to the latest available national estimate.
Listed below are some key findings for Wisconsin:
• In 2012, Wisconsin had 72,900 non-fatal injuries and illnesses in the workplace. o Rate declined during 2003-2012, although it remained higher than the national average in
2012. o Total work-related injury and illness rate and rate involving days away from work decreased
by 6% per year. o Rates were highest in agriculture, forestry, fishing, and mining industries, followed by
manufacturing. o Top occupations for injuries and illnesses included laborers and freight, stock, and material
movers; truck drivers; and nursing assistants. o Sprains, strains, and tears were the main reasons for days away from work in 2012.
• Wisconsin’s work-related hospitalization rate declined during 2003-2012 and was below the national average; o Most work-related hospitalizations are for musculoskeletal disorders and acute injury. o On average, there were 51 annual hospitalizations for work-related burns in Wisconsin
during 2003-2012. o Total pneumoconiosis, asbestosis, silicosis, and coal workers’ pneumoconiosis
hospitalization rates significantly decreased during 2003-2012. o Low back disorder hospitalizations have declined an average of 12% per year. o The rate of work-related severe traumatic injury hospitalizations declined an average of 4%
per year.

Wisconsin Occupational Health Indicator Report 6
• In 2012, Wisconsin had 114 fatalities in the workplace. o The rate of fatal injuries in Wisconsin remains steady despite prevention efforts. o The majority of work-related fatalities in Wisconsin occurred from motor vehicle operation
(i.e., transportation) and in construction and farming occupations. o The greatest percentage of fatalities occurred among workers older than 45 years of age,
with a disproportionately high percentage among workers aged 65 years and older. • The incidence rate of amputations filed with workers’ compensation declined by 2% per year
during 2003-2012. In 2012, there were 259 amputations filed with Wisconsin Workers’ Compensation.
• Although work-related musculoskeletal disorders (MSDs) in Wisconsin declined during 2003-2012, they continue to remain higher than the national average.
• The death rates for all pneumoconiosis, asbestosis, and silicosis, as well as malignant mesothelioma, decreased since 2003; however, the rates of mesothelioma in Wisconsin remain higher than national estimates.
• Prevalence and incidence of elevated blood lead levels in adults have declined since 2003. • Wisconsin Workers’ Compensation awards have increased during 2003-2012. Wisconsin
workers’ compensation benefits paid an average of $1.1 million per year, $407 per covered worker.
• The number of Wisconsin’s occupational health professionals remained steady during 2003-2012. Similar to national estimates, Wisconsin has less than half of the American Medical Association-recommended professionals certified in occupational health needed to protect the health of its workers.
• Adults with asthma who reported that their asthma was caused or made worse by exposures at work ranged between 50% and 60% during 2011-2013, an average of 228,000 adults annually.

Wisconsin Occupational Health Indicator Report 7
Introduction Wisconsin Occupational Health Program
The Wisconsin Occupational Health Program is part of the Bureau of Environmental and Occupational Health (BEOH) within the Division of Public Health at the Wisconsin Department of Health Services (DHS). BEOH strives to protect the public’s health from adverse conditions in physical and natural environments. The Occupational Health Program specifically focuses on adverse conditions that affect worker health. The Program seeks to improve the quality of life for workers and their families by identifying and assessing occupational risk through surveillance, by collaborating with others through a statewide occupational health and safety network to develop and disseminate interventions, and by providing educational opportunities and helping to develop workplace health policy. Collaboration, Education, and Health Promotion
Successful occupational health practice requires the collaboration and participation of multiple partners such as employers, workers, physicians, nurses, college and university professors, industrial hygienists, toxicologists, education specialists, engineers, and safety professionals. This collaboration serves to inform the development of strategies that ensure a healthy and safe work environment. Occupational Health Program activities have included and contributed to the following outcomes:
• Outreach to adults with elevated blood lead levels resulting from workplace exposures. • Collaboration with Wisconsin Department of Agriculture, Trade and Consumer Protection to
further examine pesticide poisonings reported to the Wisconsin Poison Center. • Follow-back investigation of carbon monoxide poisoning at an indoor ice hockey event. • Creation of public service announcements to inform medical facility workers about the use of
lifts and other devices to assist in moving patients to reduce worker injury. • Employer training on the prevention of repetitive motion injuries. • Training of lead abatement workers. • Interest in occupational health professions at both UW-Madison and UW-Milwaukee. • Support for the modification of a DHS administrative rule to require direct reporting of work-
related illness. • Support for increasing the minimum age for operating farm equipment. • Development of strategies to reduce the adult asthma triggers in the workplace. • A preparedness plan for industry support during a major health event such as pandemic flu.
CSTE/NIOSH Indicators
The Wisconsin Occupational Health Program maintains a federally funded occupational health surveillance system and bases its activities around collecting detailed information for 22 indicators identified by the Council for State and Territorial Epidemiologists (CSTE) and the National Institute for Occupational Safety and Health (NIOSH). Occupational health indicators are summary measures that describe key aspects of adverse health outcomes associated with working in Wisconsin. More specifically, an occupational health indicator is a measure of a work-related disease or injury, or a factor associated with occupational health such as workplace exposures. The Wisconsin occupational health indicators describe key trends in occupational fatalities, non-fatal injuries, and health effects. These measures can be used as a foundation for developing appropriate intervention and prevention strategies and designing programs to address key occupational health concerns.

Wisconsin Occupational Health Indicator Report 8
The 22 indicators described in this document fall into five categories: • Health effects indicators (15) as measures of injury or illness that indicate adverse effects from
exposure to known or suspected occupational hazards (indicators 1-12, and 20-22). • An exposure indicator (1) as a measure of markers in human tissue or fluid that identify the
presence of a potentially harmful substance resulting from a workplace exposure (indicator 13). • Hazard indicators (3) as measures of potential for worker exposure to health and safety hazards
in the workplace (indicators 14-16). • Intervention indicators (2) as measures of intervention activities or capacity to reduce
workplace health and safety hazards (indicators 17 & 18). • A socioeconomic impact indicator as a measure of the economic impact of work-related injuries
and illnesses (indicator 19).
This report provides a comparative analysis of Wisconsin occupational health data collected from 2003 through 2012. One exception is indicator 21, work-related asthma, for which 2011-2013 data are presented. For general comparison purposes, 2010 data from other states with occupational health surveillance programs are provided in a map format, along with the national estimate. Two exceptions are indicator 21 (work-related asthma) and indicator 22 (work-related severe traumatic injury hospitalizations), for which 2012 data are shown in maps. The Wisconsin data presented in this report are comparative analyses over time. The statistical significance of trends is presented when comparisons are appropriate; however, a small change over time in an indicator that measures severe health outcomes (e.g., fatal occupational illness) may have a greater impact than indicators that measure less serious health outcomes. Indicator Data Methods
The CSTE indicators are a passive surveillance system that utilizes data from multiple sources and billing systems. Data sources are listed at the bottom of each indicator page as well as in the “Data Source” section of this document. Full documentation of all 22 indicators and data collection methods for calculation of the most recent (2012) indicators can be found in the manual3 on the CSTE website: http://c.ymcdn.com/sites/www.cste.org/resource/resmgr/OccupationalHealth/2015EdofOHIGuidanceManualFin.pdf Indicator Data Interpretation
This document presents both national and Wisconsin-specific estimates for each of the 22 CDC/CSTE occupational health indicators. Under the “National” section for each indicator, a map of the U.S. is presented with 2010 estimates by state. The “Wisconsin” section includes Wisconsin’s indicator estimates from 2003-2012 and the U.S. estimate from the latest year available. A brief discussion of the state trends over time and comparison to the national estimate are also presented in this section. Analysis of state data trends over time are based on Poisson regression models, and significant trends (with p-value less than 0.05) and marginally significant trends (with p-value between 0.05 and 0.1) are presented as the average annual percent change. The national maps present state indicator data by quartiles, rather than displaying individual state estimates. States’ data are divided into a ranked set of four quartiles (Q1, Q2, Q3, and Q4), each quartile containing an equal number of observations. The group Q1 can be considered as the lowest 25% of the data values, while the fourth quartile (Q4) contains estimates within the highest 25% of the dataset. This type of ranking enables the identification of states that may have the lowest rates (lightest blue, Q1) or the highest rates (dark blue, Q4) of occupational injury and illness. Not all indicators are conducive to state-to-state or state-national comparisons due to variations in availability of data, data collection methodology or underlying employment demographics. Specifically,

Wisconsin Occupational Health Indicator Report 9
indicators using workers’ compensation system or hospital discharge data (OHIs 2, 5, 6, 8, 9, 19, 20, and 22) may not be comparable across states due to workers’ compensation eligibility criteria and availability of data from state workers’ compensation programs. Indicators based on Survey of Occupational Injuries and Illnesses (SOII) data (OHIs 1, 4, 7) may not be comparable across states or with national estimates due to differences in industry concentration and sample size. General Data Limitations and Considerations for Use
Several other factors influence the current quantity and quality of data being collected as part of the Occupational Health Surveillance program. Passive data collection creates a lag time of one to three years between when events actually occur and when data are available to BEOH for analyzing and reporting results. The numbers reflected in this report may underestimate the full extent of the problem. Occupational diseases are difficult to identify and there is also evidence that injuries are underreported. In addition, the Annual Bureau of Labor Statistics (BLS) SOII, which is used to calculate three indicators, excludes public sector workers, the self-employed, household workers, and workers on farms with fewer than 11 employees, although together these sectors comprise approximately 21% of the U.S. workforce.4 The quality of results is also impacted by under-reporting, inadequate health care provider recognition of work relatedness, difficulties in attributing diseases with long latency from the time of exposure to disease manifestation (e.g., silicosis), and/or from multifactorial causes (e.g., lung cancer) to occupational causation. Not all injured workers seek medical treatment. Other factors may be ICD-9 coding discrepancies and the differences in administrative database structure used for surveillance. Specific to the workers’ compensation claims database, not all injured persons may file a claim, and self-employed workers are not covered by workers’ compensation. Much of the data used for the indicator calculations come from a probability sample, rather than being a complete census of all employers or employees. Finally, definitions, methods of reporting, or diagnosis codes of work-related injury/illness may differ among states. Some states do not participate in the surveys used to obtain indicator data. Thus, caution should be used when comparing indicator data between states.
Employment Demographic Profile Table 1. Wisconsin (2003 and 2012) and U.S. (2012) Employment Demographics
Wisconsin U.S. 2003 2012 2012 Total employed persons 2,905,000 2,860,000 142,469,000 Percentage of civilian workforce unemployed 5.6 7.1 8.1 Percentage of civilian employment self-employed 7.2 5.7 6.7 Percentage of civilian employment in part-time jobs 20.9 24.7 19.4 Percentage of civilian employment by number of hours worked
<40 hours 36.1 40.1 34.6 40 hours 33.2 31.8 41.3 41+ hours 30.7 28.0 24.1 Percentage of civilian employment by sex Males 51.8 51.7 53.0 Females 48.2 48.3 47.0

Wisconsin Occupational Health Indicator Report 10
Wisconsin U.S. 2003 2012 2012 Percentage of civilian employment by age group 16 to 17 2.8 1.5 1.0 18 to 64 93.5 93.3 93.8 65+ 3.7 5.2 5.2 Percentage of civilian employment by race White 93.8 91.2 80.6 Black 3.3 4.3 11.1 Other 2.9 4.5 8.3 Percentage of civilian employment by Hispanic origin 4.3 5.1 15.4 Percentage of civilian employment by industry Mining 0.2 <0.05 0.7 Construction 7.2 5.1 6.3 Manufacturing–Durable goods 12.2 10.0 6.5 Manufacturing–Non-durable goods 7.1 6.7 3.8 Wholesale and retail trade 15.3 14.1 14.0 Transportation and utilities 3.8 4.2 5.1 Information 1.6 2.3 2.1 Financial activities 6.3 6.0 6.7 Professional and business services 7.6 9.2 11.6 Education and health services 21.1 23.6 22.7 Leisure and hospitality 8.1 8.9 9.3 Other services 3.7 4.4 5.0 Public administration 3.0 3.1 4.7 Agriculture 2.8 2.3 1.5 Percentage of civilian employment by occupation Management, business, and financial operations 14.5 15.9 15.9 Professional and related occupations 18.1 20.9 22.0 Service 15.5 17.0 17.9 Sales and related occupations 10.5 10.3 10.8 Office and administrative support 13.6 12.2 12.4 Farming, fishing, and forestry 1.0 1.0 0.7 Construction and extraction 5.5 3.9 4.9 Installation, maintenance, and repair 3.8 2.7 3.4 Production 10.8 9.4 5.9 Transportation and material moving 6.7 6.6 6.0
Data Source: BLS Geographic Profiles of Employment and Unemployment and Current Population Survey (CPS)

Wisconsin Occupational Health Indicator Report 11
Indicator 1: Non-Fatal Injuries and Illnesses Reported by Employers This indicator tracks work-related injuries or illnesses that result in an employee having to take time away from work and is based on data collected by the Bureau of Labor Statistics (BLS) in the annual SOII. Examples of work-related injuries include falls, burns, fractures, electric shocks, cuts, amputations, and needle-sticks. Examples of work-related illnesses include asthma, some types of cancer, asbestosis, carpal-tunnel syndrome, frostbite, and hearing loss. Injuries and illnesses prevent an employee from participating in normal activities and adversely impact the employee, the employee’s family, and the employer. Work-related injuries and illnesses are preventable with proper training and control of occupational hazards. National In 2010, the BLS reported an estimated total of 3.1 million injury and illness cases within the private sector workforce, with an estimated annual incidence rate of 3,500 cases per 100,000 full-time equivalent (FTE) workers. More than half of these cases involved missed days of work, job transfer, or other restrictions. The annual rate of cases involving days away from work was 1,077 cases per 100,000 FTEs. The rates of non-fatal work-related injuries and illnesses by state are shown in Figure 1.1. States in the highest quartile of rates (at or above 4,201 cases per 100,000 FTEs) include Montana, Washington, Iowa, and Wisconsin. Note that the rates may reflect differences in concentrations of high-risk industries across states. Figure 1.1 Annual Rate° of Non-Fatal Work-Related Injuries and Illnesses by State and Overall U.S., 2010
*Rate per 100,000 FTEs (Full-time equivalent or the workload of an employed person) Data Source: Annual BLS Survey of Occupational Injuries and Illness Limitation: Difference in industry concentration and sample size prohibit state-level data from being directly compared to other states or with national estimates.

Wisconsin Occupational Health Indicator Report 12
Wisconsin In 2012, the rate of new (incident) non-fatal work-related injuries in Wisconsin was above the national average (4,000 per 100,000 FTEs, compared to 3,400 per 100,000 FTEs nationally). According to BLS, this rate has been declining since 2000 in both Wisconsin and the nation. Both the total work-related injury and illness rate and the rate involving days away from work decreased by an estimated average of 6% per year during 2003-2012 in Wisconsin. These data are being used to track our success in meeting the Healthiest Wisconsin 2020 objectives of decreasing occupational injury and illness. The Wisconsin OSHA currently uses these data for its site-specific targeting program to inspect Wisconsin companies with the highest injury rates. Figure 1.2. Rate of Non-Fatal Work-Related Injuries and Illnesses in Wisconsin, 2003-2012
Data Source: Annual BLS Survey of Occupational Injuries and Illness Table 1.1. Number and Rate of Non-Fatal Work-Related Injuries and Illnesses in Wisconsin (2003-2012) and U.S. (2012)
Wisconsin U.S. 2003 2004 2005 2006 2007 2008 2009 2010 2011 2012 2012
Number of injuries and illnesses 121,000 117,500 109,900 103,400 101,400 93,500 76,300 77,100 74,400 72,900 2,976,400
Incidence rate of injuries and illnesses per 100,000 full-time workers
6,500 6,400 5,800 5,500 5,300 4,900 4,200 4,300 4,200 4,000 3,400
Number of injuries and illnesses involving days away from work 34,800 33,200 32,000 27,800 27,700 26,700 21,300 21,800 19,200 19,300 905,700
Incidence rate of injuries and illnesses involving days away from work per 100,000 full-time workers
1,900 1,600 1,700 1,500 1,400 1,400 1,000 1,200 1,100 1,100 1,000
Number of injuries and illnesses involving more than 10 days away from work 14,510 12,860 12,070 11,190 11,050 12,160 8,650 8,670 7,580 7,930 416,300
Data Source: Annual BLS Survey of Occupational Injuries and Illness
0
1,000
2,000
3,000
4,000
5,000
6,000
7,000
2003 2004 2005 2006 2007 2008 2009 2010 2011 2012
Rate
per
100
,000
full-
time
empl
oyee
s
Year
Total work-related injury and illnessCases involving days away from work

Wisconsin Occupational Health Indicator Report 13
Additional Wisconsin-specific data are presented for non-fatal occupational injuries and illnesses involving days away from work. Non-fatal occupational injuries and illnesses involving days away from work occurred predominantly in white males, between 45 and 54 years of age. The occurrence was highest among workers employed more than five years at the same employer, followed by workers who have been employed one to five years by the same company (Table 1.2). Table 1.2. Percent Distribution of Non-Fatal Occupational Injuries and Illnesses Involving Days Away from Work by Selected Worker Characteristics, All Ownerships, Wisconsin 2012
Characteristic Percent (%) Gender Male 62.9 Female 36.9 Age (years) 16-19 2.2 20-24 7.9 25-34 20.6 35-44 19.5 45-54 26.2 55-64 20.4 65 and over 2.6 Length of service with employer Less than 3 months 9.4 3 to 11 months 15.6 1 to 5 years 29.9 More than 5 years 44.5 Race or ethnic origin* White only 56.5 Black only 3.6 Hispanic or Latino only 5.4 Asian only 0.6 Native Hawaiian/other Pacific Islander -- American Indian or Alaska Native 0.3 Hispanic or Latino and other race -- Multi-race 0.1 Not reported 33.4 *Race and ethnicity data do not add to total. Some cases may be counted as both “multi-race” and “Hispanic and other race” Data Source: Annual BLS Survey of Survey of Occupational Injuries and Illness In 2012, the incidence of injury and illnesses in Wisconsin were highest in the agriculture, forestry, fishing, and mining industries with an incidence rate of 5,600 injuries and/or illnesses per 100,000 full-time workers (Figure 1.3). Of these, 52% resulted in days away from work. Manufacturing was the second leading industry in this category, with an incidence rate of 5,500 injuries/illnesses per 100,000 full-time employees. The second leading industry that resulted in days away from work due to an injury or an illness was construction with an incidence rate of 1,600 injuries/illnesses per 100,000 full-time workers. The occupations that most frequently resulted in days away from work due to injuries and illnesses were laborers and freight, stock, and material movers, followed by truck drivers with 1,760 and 1,340 cases respectively (Figure 1.4).

Wisconsin Occupational Health Indicator Report 14
Figure 1.3. Incidence Rate of Injury and Illnesses per 100,000 Full-Time Workers by Selected Industries in Wisconsin, 2012
Figure 1.4. Top Ten Occupations with Injuries and Illnesses Requiring Days Away from Work in Wisconsin, 2012
Data Source: Wisconsin Annual BLS Survey of Occupational Injuries and Illness
300
500
900
500
700
1,300
1,200
1,600
1,400
2,900
1,100
1,400
1,900
2,600
3,400
4,100
4,800
5,200
5,500
5,600
0 1000 2000 3000 4000 5000 6000
Financial Activities
Information
Professional & Business Services
Other Services
Leisure & Hospitality
Trade, Transportation, Utilities
Education & Health Services
Construction
Manufacturing
Agriculture, Forestry, Fishing & Mining
Rate of injuries and illnesses per 100,000 full-time workers
Rate of Overall Injury/Illness
Rate of Injury/Illness with DaysAway from Work
400
400
430
540
570
620
810
1,220
1,340
1,760
0 250 500 750 1000 1250 1500 1750 2000
Registered nurses
Light truck or delivery services drivers
Retail salespersons
Police & sheriff's patrol officers
Maintenance & repair workers, general
Construction laborers
Janitors & cleaners, except maids & housekeeping
Nursing assistants
Heavy and tractor-trailer truck drivers
Laborers & freight, stock, & material movers
Number of injuries and illnesses

Wisconsin Occupational Health Indicator Report 15
In 2012, sprains, strains, and tears were the main reasons for days away from work among full-time workers, with a rate of 452 days away from work per 100,000 full-time workers. Soreness and pain were a distant second with an incidence rate of 139 rates of days away from work among full-time employees. Tendonitis, chemical burns, and corrosions were responsible for the fewest days at home due to injury or illness, with a rate of three days away from work per 100,000 full-time workers. Figure 1.5. Incidence Rate of Injury and Illnesses Involving Days Away From Work per 100,000 Full-Time Workers by Nature of Injury in Wisconsin, 2012
Data Source: Wisconsin Annual BLS Survey of Occupational Injuries and Illness
3
3
9
15
15
26
73
93
105
139
452
0 50 100 150 200 250 300 350 400 450 500
Chemical burns and corrosions
Tendonitis
Amputations
Heat (thermal) burns
Carpal tunnel syndrome
Multiple traumatic injuries
Bruise, contusions
Cuts, lacerations, punctures
Fractures
Soreness, pain
Sprains, strains, tears
Rate of days away from work per 100,000 full-time workers

Wisconsin Occupational Health Indicator Report 16
Page intentionally left blank.

Wisconsin Occupational Health Indicator Report 17
Indicator 2: Work-Related Hospitalizations This indicator represents the number of hospitalizations that occur from work-related injuries or illnesses. Work-related hospitalizations are defined in this indicator as hospitalizations in which workers’ compensation is the payer source. Tracking these significant adverse health effects can help document the burden of occupational injuries and illnesses, to design, target, and evaluate the impact of prevention efforts over time, and to identify settings in which workers may continue to be at high risk for injury or illness. Individuals hospitalized with work-related injuries and illnesses have some of the most serious and costly work-related adverse health outcomes. According to CSTE, approximately 3% of workplace injuries and illnesses nationwide result in hospitalizations, and hospital charges for work-related conditions exceed $3 billion annually.3 Most identified work-related hospitalizations are for treatment of musculoskeletal disorders and acute injuries. National In 2010, there was an estimated annual rate of 82.2 work-related hospitalizations per 100,000 employed persons covered by state workers’ compensation systems occurring at the national level. The rates of work-related hospitalizations by state are shown in Figure 2.1. States with rates in the highest quartile (at or above 103.7 work-related hospitalizations per 100,000 employed persons) include Wyoming, New York, Washington, Connecticut and New Mexico. Note that the rates may reflect differences in eligibility criteria and availability of data among state workers’ compensation programs.
Figure 2.1 Annual Rate* of Work-Related Hospitalizations by State and Overall U.S., 2010
* Rate per 100,000 employed persons with primary payer coded as workers’ compensation Data Source: Hospital discharge data; BLS Current Population Survey data Limitation: Workers’ compensation eligibility criteria and availability of data from workers’ compensation programs varies among states, prohibiting state-level data from being directly compared to other states or with national estimates.

Wisconsin Occupational Health Indicator Report 18
Wisconsin In Wisconsin, the rate of work-related hospitalizations decreased by an average of 7% per year during 2003-2012 (Figure 2.2). In 2010, the rate of work-related hospitalizations in Wisconsin (76.8 per 100,000 employed persons) was below the national average of 82.2 per 100,000 employed persons (Table 2.1). Figure 2.2. Rate of Work-Related Hospitalizations in Wisconsin, 2003-2012
Data Source: Hospital discharge data; BLS Current Population Survey data Table 2.1. Number and Rate of Work-Related Hospitalizations in Wisconsin (2003-2012) and U.S. (2010)
Wisconsin U.S. 2003 2004 2005 2006 2007 2008 2009 2010 2011 2012 2010
Number of work-related hospitalizations for persons age 16 years or older 3,546 3,435 3,247 3,060 2,995 2,834 2,233 2,160 2,051 1,737 114,242
Crude rate of work-related hospitalization per 100,000 employed persons age 16 years or older
122.1 117.8 112.7 105.2 102.3 96.1 78.7 76.8 72.0 60.7 82.2 Data Source: Hospital discharge data; BLS Current Population Survey data
0
20
40
60
80
100
120
140
2003 2004 2005 2006 2007 2008 2009 2010 2011 2012
Rate
per
100
,000
em
ploy
ed p
erso
ns
Year

Wisconsin Occupational Health Indicator Report 19
Indicator 3: Fatal Work-Related Injuries This indicator tracks fatal work-related injuries. Fatalities due to work-related injuries are devastating for both the family of the deceased and the workplace and entail a huge economic burden. It has been estimated that the total medical and indirect costs of fatal work-related injuries and diseases in 2011 were over $60 billion in the U.S.5 In 2012, the fatal injury rate was 3.4 fatalities per 100,000 full-time workers. The fatal work-related injury rate has decreased from the previous year’s rate of 3.5 fatalities per 100,000 full-time workers.6 Monitoring of rates and trends of work-related deaths serves as a critical tool in identifying new hazards and evaluating health and safety practices to prevent fatal injuries in the workplace. National The Census of Fatal Occupational Injuries (CFOI) —conducted annually by the Bureau of Labor Statistics (BLS)—compiles data on all fatal work-related injuries in the U.S. In 2010, the CFOI identified 4,690 deaths in the U.S. as a result of a work-related injury, resulting in a national rate of 3.6 fatal cases per 100,000 FTEs. As shown in Figure 3.1, states with rates in the highest quartile (at or above 4.9 deaths per 100,000 FTEs) included Wyoming (11.9 cases), North Dakota (8.4 cases), Montana (8.2 cases), Louisiana (6.2 cases), Nebraska (5.8 cases), and Iowa (5.3 cases). Occupational groups with high rates of fatality in 2010 included farming, fishing and forestry; transportation and material moving; and construction and extraction. Over one-fourth of all occupational fatalities in the United States involved workers in transportation and material-moving operations. Nationwide, agriculture, forestry, fishing and hunting; and transportation and warehousing were the industries with the highest rates, together accounting for 30% of all fatal injuries. Figure 3.1 Annual Crude Work-Related Fatality Rate* by State and Overall U.S., 2010
*Rate per 100,000 FTEs Data Source: U.S. Bureau of Labor Statistics, U.S. Department of Labor, 2015. Census of Fatal Occupational Injuries charts for 2010, available at http://www.bls.gov/iif/oshcfoi1.htm
Wisconsin Occupational Health Indicator Report 20
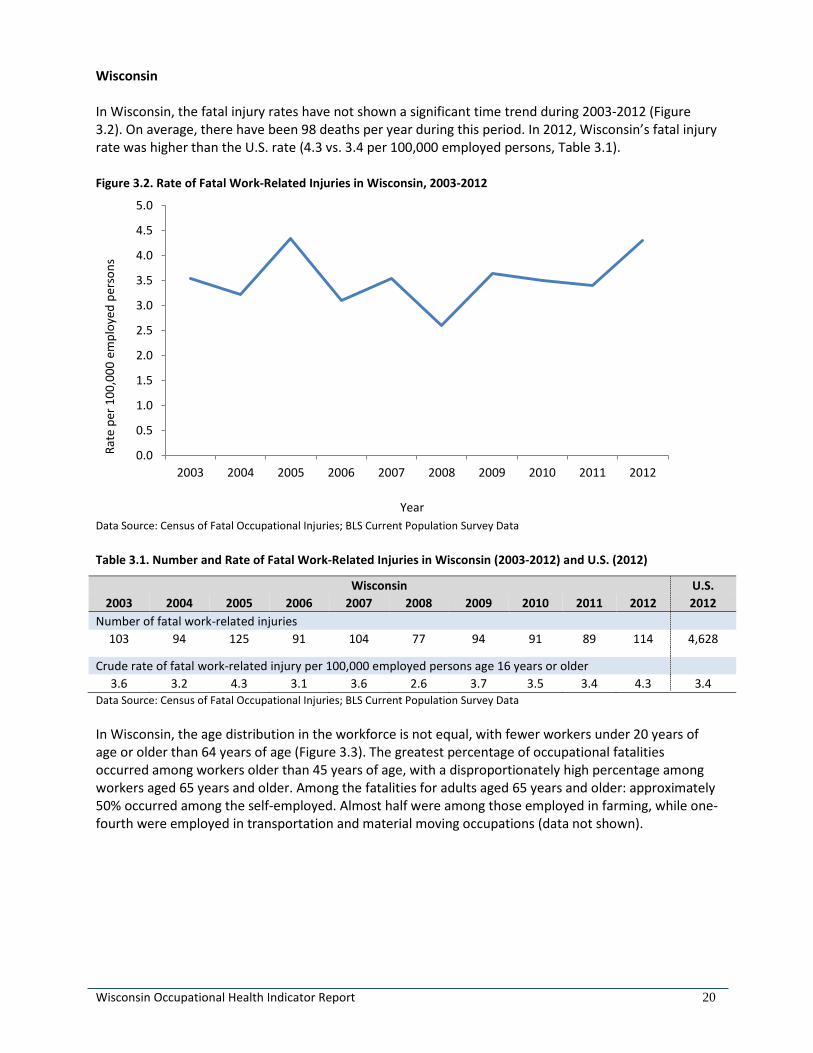
Wisconsin In Wisconsin, the fatal injury rates have not shown a significant time trend during 2003-2012 (Figure 3.2). On average, there have been 98 deaths per year during this period. In 2012, Wisconsin’s fatal injury rate was higher than the U.S. rate (4.3 vs. 3.4 per 100,000 employed persons, Table 3.1). Figure 3.2. Rate of Fatal Work-Related Injuries in Wisconsin, 2003-2012
Data Source: Census of Fatal Occupational Injuries; BLS Current Population Survey Data Table 3.1. Number and Rate of Fatal Work-Related Injuries in Wisconsin (2003-2012) and U.S. (2012)
Wisconsin U.S. 2003 2004 2005 2006 2007 2008 2009 2010 2011 2012 2012
Number of fatal work-related injuries 103 94 125 91 104 77 94 91 89 114 4,628
Crude rate of fatal work-related injury per 100,000 employed persons age 16 years or older
3.6 3.2 4.3 3.1 3.6 2.6 3.7 3.5 3.4 4.3 3.4 Data Source: Census of Fatal Occupational Injuries; BLS Current Population Survey Data In Wisconsin, the age distribution in the workforce is not equal, with fewer workers under 20 years of age or older than 64 years of age (Figure 3.3). The greatest percentage of occupational fatalities occurred among workers older than 45 years of age, with a disproportionately high percentage among workers aged 65 years and older. Among the fatalities for adults aged 65 years and older: approximately 50% occurred among the self-employed. Almost half were among those employed in farming, while one-fourth were employed in transportation and material moving occupations (data not shown).
0.0
0.5
1.0
1.5
2.0
2.5
3.0
3.5
4.0
4.5
5.0
2003 2004 2005 2006 2007 2008 2009 2010 2011 2012
Rate
per
100
,000
em
ploy
ed p
erso
ns
Year

Wisconsin Occupational Health Indicator Report 21
Figure 3.3. Wisconsin Residents Employed and Fatalities by Age Group, 2012
Despite similar percentages of males and females working in Wisconsin, the majority of fatalities occurred among men (Figure 3.4). There was a slightly greater percentage of worker fatalities among minority populations than would be expected from the employment distribution. Figure 3.4. Wisconsin Residents Employed and Fatalities by Gender and Race, 2012
0
5
10
15
20
25
30
0
5
10
15
20
25
30
19 andyounger
20-24 25-34 35-44 45-54 55-64 65 andolder
Age group
Tota
l Wisc
onsin
Fat
aliti
es (%
)
Wisc
onsin
Res
iden
ts E
mpl
oyed
(%)
% WI employed % WI worker fatalities
0102030405060708090100
0102030405060708090
100
Males Females White Black Other
Gender Race
Tota
l Wisc
onsin
Fat
aliti
es (%
)
Wisc
onsin
Res
iden
ts E
mpl
oyed
(%)
% WI employed % WI worker fatalities

Wisconsin Occupational Health Indicator Report 22
Wisconsin had greater percentage of fatalities in management; farming, fishing and forestry; production; sales; and business occupations, compared to the U.S. (Figure 3.5). Figure 3.5. Top Ten Occupations with Fatalities, Wisconsin vs. U.S., 2012
The top event leading to workplace deaths in Wisconsin was transportation, although the state had lower percentages than the U.S. in comparison. Wisconsin had greater percentages of fatalities resulting from violence and contact with objects or equipment, compared to the U.S. (Figure 3.6). Figure 3.6. Work-related Fatalities by Event, Wisconsin vs. U.S., 2012
0 5 10 15 20 25 30 35
Business and financial operations
Protective service
Installation maintenance and repair
Building & grounds cleaning/ maintenance
Sales and related
Production
Farming fishing & forestry
Construction & extraction
Transportation & material moving
Management
Percent of total fatalities
WI fatalities
US fatalities
0 10 20 30 40 50
Fires and Explosions
Exposures
Falls, Trips, and slips
Contact with objects orequipment
Violence
Transportation
Percent of total fatalities
WI fatalities
US fatalities

Wisconsin Occupational Health Indicator Report 23
Indicator 4: Amputations Reported by Employers An amputation is defined as full or partial loss of a protruding body part—an arm, hand, finger, leg, foot, toe, ear, or nose. An amputation is a preventable injury, and may greatly reduce a worker’s job skills and earning potential as well as significantly affect general quality of life. Amputations are widespread and involve a variety of activities and equipment, from workers operating unguarded or inadequately safeguarded machines to using forklifts, trash compactors, and powered and nonpowered hand tools.
Two indicators measure the number of amputations that occur due to work-related activities: amputations reported by employers through data collected by the BLS in the annual SOII (Indicator 4) and amputations that involve workers’ compensation claims (Indicator 5). While these two indicators measure similar outcomes, the data used to create each indicator produce different estimates of the number of amputations with lost work time. It is important to examine both indicators to obtain the best estimate for amputations with lost work time. National In 2010, 5,260 non-fatal amputations were reported by the private sector across the U.S. The median number of days away from work for those with an amputation was 21 days. Most amputations occurred in males (82%) and the overwhelming majority of amputations (95%) involved a hand. The industries with the largest number of amputations included production, transportation and material moving, and construction and extraction. The national rate of work-related amputation involving days away from work was 6 cases per 100,000 FTE workers in the private sector. Figure 4.1 displays state-specific rates of work-related amputations per 100,000 FTEs. States in the highest quartile of rates (at or above 11.1 cases per 100,000 FTEs) include Nebraska, Montana, Iowa, and Louisiana. Note that the rates may reflect differences in concentrations of high-risk industries across states. Figure 4.1 Annual Rate* of Work-related Amputation with Days Away from Work by State and Overall U.S., 2010
*Rate per 100,000 FTEs (Full-time equivalent or the workload of an employed person) Data Source: Annual BLS Survey of Occupational Injuries and Illness Limitation: Difference in industry concentration and sample size prohibit state-level data from being directly compared to other states or with national estimates.

Wisconsin Occupational Health Indicator Report 24
Wisconsin In Wisconsin, the rate of amputations reported by employers varies by year. During 2003-2012, the trend in rates shows a marginally significant decrease of 3% per year on average (Figure 4.2). The annual variation noted in Wisconsin is in part due to the small numbers of amputations reported. Employers are only required to report the details of an injury when a worker misses more than one day of work. Furthermore, workers may not be counted if they are placed on restrictive duty and do not miss work. In 2012, Wisconsin’s rate of amputations was higher than the U.S. rate (10.0 vs. 6.0 per 100,000 FTEs, Table 4.1). Figure 4.2. Incidence Rate of Work-Related Amputations Involving Days away from Work in Wisconsin, 2003-2012
Data Source: Annual BLS Survey of Occupational Injuries and Illness Note: Change in data coding structure (i.e., modification to the amputation definition) in 2011 may affect count and rate comparisons from 2003-2010 to 2011 and later. However, due to the similarity in amputation definitions, trends are presented for the entire time period 2003-2012. Table 4.1. Number and Incidence Rate of Work-Related Amputations involving Days away from Work Reported by Private Sector Employers in Wisconsin (2003-2012) and U.S. (2012)
Wisconsin U.S. 2003 2004 2005 2006 2007 2008 2009 2010 2011 2012 2012
Number of work-related amputations involving days away from work 210 260 319 160 210 150 160 190 170 180 5,100
Incidence rate of amputations involving days away from work per 100,000 full-time workers
11.0 14.0 12.0 9.0 11.0 8.0 9.0 11.0 9.0 10.0 6.0 Data Source: Annual BLS Survey of Occupational Injuries and Illness
0
2
4
6
8
10
12
14
16
2003 2004 2005 2006 2007 2008 2009 2010 2011 2012
Rate
per
100
,000
full-
time
empl
oyee
s
Year
chan
ge in
cod
ing
stru
ctur
e

Wisconsin Occupational Health Indicator Report 25
Indicator 5: Amputations Identified in State Workers’ Compensation Systems This amputation indicator utilizes state workers’ compensation claims data to characterize the numbers, rates, and trends of amputations across the U.S. Annually, the indicator measures the number of amputation cases with work-time loss, identified in the state workers’ compensation claims, per 100,000 workers covered by state workers’ compensation system. Males were more likely to experience a nonfatal work-related amputation with days away from work. The body parts most commonly affected by amputation are hands and fingers, which often limit a worker’s job skill set and income.7 National Annual incidence rates of amputation cases with lost work-time filed with state workers’ compensation systems were available for the states shown in Figure 5.1. States with rates in the highest quartile (at or above 6.6 cases per 100,000 workers) included Wisconsin, North Dakota, Iowa, Wyoming, and Washington. Note that the rates may reflect differences in eligibility criteria and availability of data among state workers’ compensation programs. National estimates are not available for this indicator. Figure 5.1 Annual Incidence Rate* of Amputation Cases with Lost Work-Time Filed with State Workers’ Compensation System by State and Overall U.S., 2010
*Rate per 100,000 workers covered by state workers’ compensation system Data Source: State Workers’ compensation systems data available at CSTE website; National Academy of Social Insurance (NASI) estimate of workers covered by workers’ compensation. Limitation: Workers’ compensation eligibility criteria and availability of data from workers’ compensation programs varies among states, prohibiting state-level data from being directly compared to other states or with national estimates.

Wisconsin Occupational Health Indicator Report 26
Wisconsin Data collected from the Wisconsin Workers’ Compensation System during 2003-2012 show that the incidence rate of amputations filed with workers’ compensation declined by 2% per year on average. In 2012, the breakdown of body parts involved in the amputations included 87% finger(s), 11% thumb, and 2% other, including toe(s) and/or foot. Figure 5.2. Incidence Rate of Amputations Filed with Wisconsin Workers’ Compensation System (2003-2012)
Data Source: Wisconsin Workers’ Compensation data from Wisconsin Department of Workforce Development; National Academy of Social Insurance (NASI) estimate of workers covered by workers’ compensation Table 5.1. Number and Incidence Rate of Amputations Filed with Wisconsin Workers’ Compensation System (2003-2012)
Wisconsin U.S. 2003 2012 2005 2006 2007 2008 2009 2010 2011 2012 2012
Number of amputations filed with Wisconsin Workers’ Compensation System 291 309 329 321 304 312 233 261 257 259 *
Incidence rate of amputations filed with WI Workers’ Compensation per 100,000 covered workers
11.2 11.8 12.4 12.0 11.3 11.7 9.2 10.3 10.1 10.3 * * U.S. data not calculated due to varying eligibility criteria among states Data Source: Wisconsin Workers’ Compensation data from Wisconsin Department of Workforce Development; National Academy of Social Insurance (NASI) estimate of workers covered by workers’ compensation available at http://www.nasi.org/sites/default/files/research/NASI_Work_Comp_Year_2014.pdf
0
2
4
6
8
10
12
14
2003 2004 2005 2006 2007 2008 2009 2010 2011 2012
Rate
per
100
,000
wor
kers
cov
ered
by
WC
Year

Wisconsin Occupational Health Indicator Report 27
Indicator 6: Hospitalizations for Work-Related Burns Burns encompass injuries to tissues caused by contact with dry heat (fire), moist heat (steam), chemicals, electricity, friction, or radiation. To track the incidence of hospitalizations for burns related to work activity, this indicator utilizes data from hospital discharge records in which workers’ compensation is the anticipated payer. Although work-related hospitalized burns are unusual events, they are some of the most devastating, painful, and expensive injuries to treat. Many burns result in disfigurement, often leaving the individual unable to maintain their current position in the workforce. In addition, burns are the most common cause of work-related hospitalization for young workers. It is estimated that of all burns, 30-40% occur in occupational settings.8 NIOSH estimated that there are 150,000 work-related burns treated in emergency rooms each year in the U.S. According to the New England Regional Burn Program, 55% of all burns among adults are work related, with younger people and males more frequently hurt.9 National In 2010, the annual estimated rate of work-related burn hospitalizations was 0.8 hospitalizations per 100,000 covered workers. As depicted in Figure 6.1, the states with the rates of work-related burn hospitalizations in the highest quartile (at or above 2.0 hospitalizations per 100,000 workers) included Washington, Wyoming, New York, Colorado, and Georgia. Note that the rates may reflect differences in eligibility criteria and availability of data among state workers’ compensation programs. Figure 6.1 Annual Rate* of Hospitalizations for Work-Related Burns by State and Overall U.S., 2010
* Rate per 100,000 employed persons with primary payer coded as workers’ compensation Data Source: Hospital discharge data; BLS Current Population Survey data Limitation: Workers’ compensation eligibility criteria and availability of data from workers’ compensation programs varies among states, prohibiting state-level data from being directly compared to other states or with national estimates.

Wisconsin Occupational Health Indicator Report 28
Wisconsin Although the annual number of work-related burns in Wisconsin is small and the numbers fluctuate from year to year, the data show a marginally significant 5% decrease per year on average during 2003-2012. In 2010, Wisconsin’s rate of work-related burns was higher than the U.S. rate (1.2 vs. 0.8 per 100,000 employed persons, Table 6.1). Figure 6.2. Rate of Hospitalizations for Work-Related Burns in Wisconsin, 2003-2012
Data Source: Hospital discharge data; BLS Current Population Survey Data Table 6.1. Number and Rate of Hospitalizations for Work-Related Burns in Wisconsin (2003-2012) and U.S. (2010)
Wisconsin U.S. 2003 2004 2005 2006 2007 2008 2009 2010 2011 2012 2010
Number of hospitalizations for work-related burns for persons age 16 years or older 59 60 60 64 40 53 57 33 59 28 1,176
Crude rate of hospitalization for work-related burns per 100,000 employed persons age 16 years or older
2.0 2.1 2.1 2.2 1.4 1.8 2.0 1.2 2.1 1.0 0.8 Data Source: Hospital discharge data; BLS Current Population Survey Data
0.0
0.5
1.0
1.5
2.0
2.5
3.0
2003 2004 2005 2006 2007 2008 2009 2010 2011 2012
Rate
per
100
,000
em
ploy
ed p
erso
ns
Year

Wisconsin Occupational Health Indicator Report 29
Indicator 7: Musculoskeletal Disorders Reported by Employers Work-related musculoskeletal disorders (MSDs) are injuries or disorders of muscles, tendons, nerves, ligaments, joints, or spinal discs that are caused or aggravated by work activities. Workplace risk factors for MSDs include repetitive forceful motions, awkward postures, use of vibrating tools or equipment, and manual handling of heavy, awkward loads. MSDs also can be caused by single, traumatic events such as falls. This occupational health indicator is based on data collected by the BLS in the annual SOII. The BLS definition of MSDs includes sprains, strains, pain, hurt back, carpal tunnel syndrome, and hernia in which the event leading to the condition is reported as overexertion, repetitive motion, or bending, reaching, or twisting. MSDs that resulted in days away from work accounted for one-third of all lost workday cases reported by private sector employers. Two indicators measure the number of carpal tunnel syndrome (CTS) cases that occur due to work-related activities: CTS cases reported by employers (one component of Indicator 7) and CTS cases that involve workers’ compensation claims (Indicator 8). While these two indicators measure similar outcomes, the data used to create each indicator will produce different estimates of the number of CTS cases with lost work time. It is important to examine both indicators to obtain the best estimate. National
The 2010 national incidence rate of all MSD involving days away from work was 328 cases per 100,000 FTEs (Figure 7.1). States with rates in the highest quartile (at or above 446.1 MSDs per 100,000 FTEs) included Washington, Montana, Oregon, Connecticut, Massachusetts, and Iowa. Note that the rates may reflect differences in concentrations of high-risk industries across states. Figure 7.1 Annual Incidence Rate* of All MSDs Involving Days Away from Work by State and Overall U.S., 2010
*Rate per 100,000 FTEs (Full-time equivalent or the workload of an employed person) Data Source: Annual BLS Survey of Occupational Injuries and Illness Limitation: Difference in industry concentration and sample size prohibit state-level data from being directly compared to other states or with national estimates.

Wisconsin Occupational Health Indicator Report 30
Wisconsin Wisconsin has seen a decline in all musculoskeletal disorders during 2003-2012. The incidence rate of all MSDs declined by an average of 6% per year during this period. Similarly, the rates for back MSDs, neck MSDs and CTS cases also declined during this period, by an average of 7%, 6%, and 12%, respectively. Although the rates of work-related MSDs in Wisconsin have declined, they continue to remain higher than the national average in 2012 (total MSDs: 420 vs. 355 per 100,000 FTEs). Figure 7.2. Number and Rate of Hospitalizations for Work-Related MSDs in Wisconsin, 2003-2012
Note: Change in data coding structure (i.e., modification to the MSD definition) in 2011 may affect count and rate comparisons from 2003-2010 to 2011 and later. However, due to the similarity in MSD definitions, trends are presented for the entire time period 2003-2012. Table 7.1. Number and Incidence Rate* of Work-Related MSDs involving Days away from Work in Wisconsin (2003-2012) and U.S. (2012)
Wisconsin U.S. 2003 2004 2005 2006 2007 2008 2009 2010 2011 2012 2012
Number of work-related MSDs involving days away from work All MSDs 12,950 12,860 11,090 9,380 10,200 10,060 7,150 7,970 8,200 7,700 314,470 Back 6,250 6,110 5,340 4,430 4,830 4,400 3,380 3,340 3,320 3,420 133,640 Neck+ 4,070 4,240 3,890 2,740 3,170 3,140 2,180 2,600 2,710 2,350 94,380 CTS 820 690 870 420 450 390 250 360 330 290 7,540 Incidence rate of MSDs involving days away from work per 100,000 full-time workers All MSDs 691 700 588 503 530 525 393 444 459 420 355 Back 333 333 283 237 251 229 186 186 186 187 151 Neck+ 217 230 181 146 165 164 119 146 151 128 107 CTS 44 37 48 23 23 20 14 20 18 16 9
*Rate per 100,000 FTEs. Notes: Neck+ includes Neck, Shoulder, Upper Extremities; CTS = Carpal Tunnel Syndrome Data Source: Annual BLS Survey of Occupational Injuries and Illness
0
100
200
300
400
500
600
700
800
2003 2004 2005 2006 2007 2008 2009 2010 2011 2012
Rate
per
100
,000
full-
time
empl
oyee
s
Year
All
Back
Neck, Shoulder and Upper Extremities
Carpal Tunnel Syndrome
chan
ge in
cod
ing
stru
ctur
e

Wisconsin Occupational Health Indicator Report 31
Indicator 8: Carpal Tunnel Syndrome Cases Identified in State Workers’ Compensation System The U.S. Department of Labor defines Carpal Tunnel Syndrome (CTS) as a disorder associated with the peripheral nervous system, which includes nerves and ganglia located outside the spinal cord and brain. Symptoms include numbness, tingling, weakness, or muscle atrophy in the hand and fingers when the median nerve at the wrist is compressed. CTS is caused by repetitive movements at the wrist, which increase the pressure within the carpal tunnel. Activities often reported as initiating the symptoms include: keyboarding, driving, talking on the phone, crocheting, and other activities that involve maintaining a certain wrist position for prolonged time periods. National The annual incidence rate of CTS is estimated at 0.8 per 10,000 full time equivalents (FTEs). In 2012, 7,590 cases of CTS occurred among private sector employees and led to a median of 30 days away from work. Annual incidence rates of Carpal Tunnel Syndrome cases with lost work-time filed with state workers’ compensation systems were available for the states shown in Figure 8.1. States with rates in the highest quartile (at or above 26.4 cases per 100,000 workers) included Florida, Washington, Connecticut, California, and Illinois. Note that the rates may reflect differences in eligibility criteria and availability of data among state workers’ compensation programs. National estimates are not available for this indicator. Figure 8.1 Annual Incidence Rate* of Carpal Tunnel Syndrome Cases among Covered Workers by State, 2010
*Rate per 100,000 workers covered by state workers’ compensation system Data Source: State Workers’ compensation systems data available at CSTE website; National Academy of Social Insurance (NASI) estimate of workers covered by workers’ compensation. Limitation: Workers’ compensation eligibility criteria and availability of data from workers’ compensation programs varies among states, prohibiting state-level data from being directly compared to other states or with national estimates.

Wisconsin Occupational Health Indicator Report 32
Wisconsin Wisconsin’s incidence rate of carpal tunnel syndrome cases filed with workers’ compensation declined by an average of 11% annually during 2003-2012. Wisconsin workers’ compensation insurance paid an average of $3 million per year for carpal tunnel syndrome alone.10 CTS has the longest average disability duration among the top 10 workers’ compensable injuries.8
Figure 8.2. Incidence Rate of Carpal Tunnel Syndrome Cases Filed with Wisconsin Workers’ Compensation System (2003-2012)
Data Source: Wisconsin Workers’ Compensation data from Wisconsin Department of Workforce Development; National Academy of Social Insurance (NASI) estimate of workers covered by workers’ compensation Table 8.1. Number and Incidence Rate of Carpal Tunnel Syndrome Cases Filed with Wisconsin Workers’ Compensation System (2003-2012)
Wisconsin U.S. 2003 2004 2005 2006 2007 2008 2009 2010 2011 2012 2012
Number of carpal tunnel syndrome cases filed with Wisconsin Workers’ Compensation System 1219 1090 1000 890 776 703 588 573 460 384 *
Incidence rate of carpal tunnel syndrome cases filed with Wisconsin Workers’ Compensation per 100,000 workers covered by system
46.8 41.5 37.6 33.2 28.8 26.3 23.2 22.7 18.0 15.2 * * U.S. data not calculated due to varying eligibility criteria among states Data Source: Wisconsin Workers’ Compensation data from Wisconsin Department of Workforce Development; National Academy of Social Insurance (NASI) estimate of workers covered by workers’ compensation available at http://www.nasi.org/sites/default/files/research/NASI_Work_Comp_Year_2014.pdf
05
101520253035404550
2003 2004 2005 2006 2007 2008 2009 2010 2011 2012Rate
per
100
,000
wor
kers
cov
ered
by
WC
Year

Wisconsin Occupational Health Indicator Report 33
Indicator 9: Pneumoconiosis Hospitalizations Pneumoconiosis is a disease of the lungs caused by long-continued inhalation of mineral or metallic dust, and predominantly attributable to occupational exposures. Pneumoconiosis prevalence varies geographically and is influenced by local industrial activities and migration of affected individuals. Common types include silicosis, asbestosis, and coal workers' pneumoconiosis. Complications of various pneumoconioses and other conditions associated with exposure to the same type of pneumoconiosis-causing dusts may include chronic bronchitis, lung cancer, respiratory infections (e.g., tuberculosis), progressive systematic sclerosis, and renal disease. Controlling occupational dust exposure is the most effective method of preventing pneumoconiosis.8 National The national age-standardized rate pneumoconiosis hospital discharges was 41.7 per 1 million residents in 2010. States with rates in the highest quartile (at or above 117.1 hospital discharges per 1 million residents) included Massachusetts (154.7 hospitalizations), Montana (187.1 hospitalizations), New Jersey (213.5 hospitalizations), Maryland (221.2 hospitalizations), and Kentucky (572 hospitalizations). Figure 9.1 Annual Age-Standardized Rate* of Total Pneumoconiosis Hospital Discharges by State and Overall U.S., 2010
* Rate per 1,000,000 residents, age-adjusted to U.S. 2000 Standard Population. Data Source: Hospital discharge data; state population estimates from the U.S. Bureau of the census; Year 2000 U.S. standard population (for age-standardization)

Wisconsin Occupational Health Indicator Report 34
Wisconsin In Wisconsin, total pneumoconiosis, asbestosis, silicosis, and coal workers’ pneumoconiosis hospitalization rates significantly decreased during 2003-2012. The rates for total pneumoconiosis decreased by 6% per year on average, while rates for asbestosis, silicosis, and coal workers’ pneumoconiosis decreased by an average of 5%, 8%, and 16%, respectively, during this period. There was no significant trend in other and unspecified pneumoconiosis. Wisconsin hospitalization rates associated with total pneumoconiosis, asbestosis, and silicosis were higher than 2010 national estimates. Wisconsin has many foundries and ceramics companies where silica exposures occurred in the past as well as current industrial processes using silica and sandblasting. This may explain the high rate of silicosis in Wisconsin. There are no coal mines in Wisconsin; thus, Wisconsin has lower rates of coal workers’ pneumoconiosis than the nation. Figure 9.2. Age-Standardized Rate of Hospitalizations from or with Pneumoconiosis in Wisconsin, 2003-2012
Data Source: Hospital discharge data; state population estimates from the U.S. Bureau of the census; Year 2000 U.S. standard population (for age-standardization) Table 9.1. Number and Age-standardized Rate of Hospitalizations from or with Pneumoconiosis in Wisconsin (2003-2012) and U.S. (2010)
Wisconsin U.S. 2003 2004 2005 2006 2007 2008 2009 2010 2011 2012 2010
Number of pneumoconiosis inpatient hospitalizations All 345 352 365 360 336 347 319 252 247 224 10,262 Asbestosis 231 255 265 283 238 251 240 187 185 173 8,123 Silicosis 81 71 78 64 68 80 63 51 49 36 249 Coal workers’ 29 24 20 12 16 14 8 10 7 8 670 Other 11 9 6 7 15 6 10 5 7 5 1,220 Age-standardized rate of pneumoconiosis inpatient hospitalizations per million residents All 77.2 77.3 79.1 78.1 71.6 72.0 65.8 51.5 49.5 43.5 41.7 Asbestosis 51.8 56.1 57.3 61.3 50.7 52.3 50.0 38.3 37.2 33.4 33.2 Silicosis 18.1 15.6 16.9 13.9 14.4 16.4 12.6 10.1 9.6 7.0 1.2 Coal workers’ 6.5 5.1 4.4 2.6 3.5 2.8 1.6 2.2 1.3 1.6 2.6 Other 2.4 1.9 1.5 1.6 3.2 1.7 2.1 1.1 1.6 1.0 4.7
Data Source: Hospital discharge data; state population estimates from the U.S. Bureau of the census; Year 2000 U.S. standard population (for age-standardization)
0
10
20
30
40
50
60
70
80
90
2003 2004 2005 2006 2007 2008 2009 2010 2011 2012
Rate
per
mill
ion
popu
latio
n
Year
AllAsbestosisSilicosisCoal workers'Other

Wisconsin Occupational Health Indicator Report 35
Indicator 10: Pneumoconiosis Mortality Overall, the number of deaths from pneumoconiosis has been declining in the U.S. This is primarily due to the reduction in the number of coal workers and the Federal Coal Workers Act, which reduces the amount of coal dust in the working environment. However, pneumoconiosis is still more commonly listed as the contributing cause of death than as the underlying cause of death, and deaths from asbestosis have been increasing nationally. National The national age-standardized incidence rate of pneumoconiosis deaths was 8.0 per 1 million residents in 2010. The highest rates of cases per million residents were seen among the following states: Montana (39.6 cases), Kentucky (22.9 cases), Louisiana (11.6 cases), Oregon (10.8 cases), and New Mexico (10.3 cases). Figure 10.1 Annual Age-Standardized Incidence Rate* of Pneumoconiosis by State and Overall U.S., 2010
* Rate per 1,000,000 residents, age-adjusted to U.S. 2000 Standard Population Data Source: Death certificate records from state vital statistics; State population estimates from the U.S. Bureau of the Census; Year 2000 U.S. Standard Population (for age-standardization) Limitations: People may not die in the state in which they were exposed.

Wisconsin Occupational Health Indicator Report 36
Wisconsin In Wisconsin, the death rates from all pneumoconiosis, asbestosis, and silicosis decreased during the 2003-2012 surveillance period. Silicosis death rates are suppressed due to low numbers of events in 2008, and 2010-2012. Too few deaths from coal workers’ or other pneumoconiosis were reported annually to evaluate trends during this period. Wisconsin’s mortality rate from all pneumoconiosis and was lower than the national average in 2010. Figure 10.2. Age-Standardized Rate of Death from or with Pneumoconiosis in Wisconsin, 2003-2012
Note: Silicosis rates not shown for years 2008 and 2010-2012, since annual number was less than five events. Coal workers’ and other pneumoconiosis rates are not shown (less than five events per year during the period 2003-2012). Data Source: Death certificate records from state vital statistics; U.S. Bureau of the Census Table 10.1. Number and Age-Standardized Rate of Death from or with Pneumoconiosis in Wisconsin (2003-2012) and U.S. (2010)
Wisconsin U.S. 2003 2004 2005 2006 2007 2008 2009 2010 2011 2012 2010
Number of pneumoconiosis deaths All 32 33 23 31 26 26 27 24 22 21 2,037 Asbestosis 22 20 14 19 18 20 19 19 17 14 1,318 Silicosis 8 12 10 8 7 * 6 * * * 101 Coal workers’ * * * * * * * * * * 486 Other * * * * * * * * * * 148 Age-standardized rate of pneumoconiosis death per million residents All 7.0 7.1 4.9 6.6 5.7 5.3 5.4 5.1 4.5 3.9 8.0 Asbestosis 4.8 4.4 3.0 4.1 4.0 4.2 3.9 4.1 3.5 2.6 5.2 Silicosis 1.7 2.5 2.2 1.7 1.5 ° 1.1 * * * 0.4 Coal workers’ * * * * * * * * * * 1.9 Other * * * * * * * * * * 0.6
* less than five events; rate not calculated Data Source: Death certificate records from state vital statistics; U.S. Bureau of the Census
0
1
2
3
4
5
6
7
8
2003 2004 2005 2006 2007 2008 2009 2010 2011 2012
Rate
per
mill
ion
popu
latio
n
Year
All
Asbestosis
Silicosis

Wisconsin Occupational Health Indicator Report 37
Indicator 11: Acute Work-Related Pesticide Poisonings Reported to Poison Control Centers Pesticides such as fungicides, herbicides, insecticides, rodenticides, and sanitizers are among the few chemicals produced that are specifically designed to kill and cause harm. Workers who handle pesticide chemicals are at greater risk of illness from occupational exposure. Agricultural workers, groundskeepers, pet groomers, and fumigators are a few occupations at risk for exposure to pesticides. In the U.S., approximately 1.1 billion pounds of pesticide active ingredients are used annually, and over 17,000 pesticide products are being marketed. The Environmental Protection Agency (EPA) estimates that between 10,000 and 20,000 physician-diagnosed poisonings occur each year among U.S. agriculture workers due to pesticide chemical exposures.11 Poison Control Centers (PCCs) across the country actively identify and report cases to the National Poison Data System (NPDS) associated with occupational exposures, most notably acute poisonings and chemical exposures. National As shown in Figure 11.1, the national incidence rate of acute work-related pesticide poisoning was 2.1 cases per 100,000 workers. States with rates in the highest quartile (at or above 3.7 cases per 100,000 workers) were Iowa (5.2 cases), North Dakota (4.7 cases), Nebraska (4.3 cases), Oregon (4.0 cases), Montana (3.7 cases), and, Kentucky (3.7 cases). Figure 11.1 Annual Incidence Rate* of Reported Work-Related Pesticide Poisoning Cases by State and Overall U.S., 2010
*Rate per 100,000 employed persons age 16 years or older Data Source: National Poison Data System data; BLS Current Population Survey Data Limitations: (1) Poison Control Centers (PCC) capture only a small proportion of acute occupational pesticide-related illness cases; (2) PCCs do not systematically collect information on industry and occupation; (3) Not all states have poison control centers.

Wisconsin Occupational Health Indicator Report 38
Wisconsin In Wisconsin, the rate of acute work-related pesticide poisoning showed a significant average increase of 8% per year during the time period 2003-2012, and Wisconsin’s rates during 2010-2012 were higher than national rates during these years. In 2012, the Wisconsin Poison Control Center (PCC) reported 1,775 pesticide poisoning cases. Of these, 72 occurred in the workplace. Further examination of 2012 Wisconsin PCC data found that the top occupational exposure substances were disinfectants (44%), insecticides (29%), and herbicides (24%). Agricultural exposures were a small subset (approximately 10%) of all pesticide exposures. It is important to note that these numbers may not reflect the true extent of the problem since workplace poisoning may go unreported or unrecognized. Figure 11.2. Annual Incidence Rate of Reported Work-Related Pesticide Poisoning Cases in Wisconsin, 2003-2012
Data Source: National Poison Data System data; BLS Current Population Survey data Table 11.1. Number and Rate of Reported Work-Related Pesticide Poisoning Cases* in Wisconsin (2003-2012) and U.S. (2011)
Wisconsin U.S. 2003 2004 2005 2006 2007 2008 2009 2010 2011 2012 2011
Number of reported work-related pesticide poisoning cases 39 39 43 40 54 50 35 71 61 72 2,833
Incidence rate of fatal work-related injury per 100,000 employed persons age 16 years or older
1.3 1.3 1.5 1.4 1.8 1.7 1.2 2.5 2.1 2.5 2.0 Case definition defined in 2015 CSTE Occupational Health Indicators Guide Data Source: National Poison Data System data; BLS Current Population Survey Data
0.0
0.5
1.0
1.5
2.0
2.5
3.0
2003 2004 2005 2006 2007 2008 2009 2010 2011 2012
Rate
per
100
,000
em
ploy
ed p
erso
ns
Year

Wisconsin Occupational Health Indicator Report 39
Indicator 12: Incidence of Malignant Mesothelioma, Ages 15 and Older Malignant mesothelioma is a type of cancer in which malignant cells are found in the lining of the chest or abdomen. While relatively rare, it is a fatal cancer and 3,000 deaths are attributed to the disease annually.12 It has been estimated that up to 90% of malignant mesothelioma cases are caused by exposure to asbestos. These data can be useful to design, implement, and evaluate the impact of prevention and intervention efforts longitudinally, and to identify previously unrecognized work settings in which workers may be continuously at risk of asbestos exposure. National In 2010, the U.S. overall experienced an age-standardized incidence rate of 12.5 malignant mesothelioma cases per 1 million residents ages 15 years and older. States with rates in the highest quartile (at or above 15.2 cases per 1 million residents) included Washington (19.7 cases), Louisiana (18.4 cases), New Jersey (17.9 cases), Minnesota (17.2 cases), Wisconsin (16.1 cases), and Massachusetts (15.5 cases). Figure 12.1 Annual Age-Standardized Mesothelioma Incidence Rate* by State and Overall U.S., 2010
*Rate per 1,000,000 residents ages 15 years or older Data Source: State-wide cancer registry data; State population estimates from the U.S. Bureau of the Census; Year 2000 U.S. standard population (for age-standardization) Limitations: (1) Not all cases of malignant mesothelioma are caused by occupational exposures; (2) Cancer is a disease of long latency, current incidence is not indicative of current exposures.

Wisconsin Occupational Health Indicator Report 40
Wisconsin Although the annual number of malignant mesothelioma cases in Wisconsin is small and the numbers fluctuate from year to year, the data show a significant 3% decrease on average per year during 2003-2012, a trend primarily driven by the rates at the end of the period. The only well-established risk factor for mesothelioma is exposure to asbestos fibers. Nationally, the annual number of mesothelioma cases, which increased steeply from the 1970s through the mid-1990s, leveled off and began to decline around 2000. This trend is due in part to reductions in raw asbestos use and a decline in workplace airborne asbestos levels. Figure 12.2. Annual Age-Standardized Mesothelioma Incidence Rate* in Wisconsin, 2003-2012
*Rate per 1,000,000 residents ages 15 years or older Data Source: Statewide cancer registry data; State population estimates from the U.S. Bureau of the Census; Year 2000 U.S. standard population (for age-standardization) Table 12.1. Number and Rate of Malignant Mesothelioma in Wisconsin (2003-2012) and U.S. (2011)
Wisconsin U.S. 2003 2004 2005 2006 2007 2008 2009 2010 2011 2012 2011
Number of incident mesothelioma cases 70 83 62 84 72 72 86 80 71 57 3,108
Incidence rate of mesothelioma per 1,000,000 residents ages 15 years and older
16.1 19.3 15.6 18.2 15.6 14.9 18.2 16.1 14.0 11.0 12.4 Data Source: State-wide cancer registry data; State population estimates from the U.S. Bureau of the Census; Year 2000 U.S. standard population (for age-standardization)
0
5
10
15
20
25
2003 2004 2005 2006 2007 2008 2009 2010 2011 2012
Rate
per
mill
ion
popu
latio
n
Year

Wisconsin Occupational Health Indicator Report 41
Indicator 13: Elevated Blood Lead Levels among Adults Lead poisoning among adults is a persistent, mainly occupational, public health problem. During 2003–2012, 145,811 persons aged ≥16 years in 41 states were reported with blood lead levels (BLLs) ≥10 µg/dL through the national Adult Blood Lead Epidemiology and Surveillance (ABLES) program.13 An elevated BLL is defined as a BLL ≥5 µg/dL of whole blood. Lead adversely affects multiple organ systems and can cause permanent damage. There is increasing concern over the toxicity of low doses of lead and its association with hypertension, adverse effects on cognitive dysfunction, and adverse female reproduction outcome. The U.S. Department of Labor lists more than 900 occupations that are associated with lead use. Construction workers are at risk of lead poisoning during the maintenance, repainting, or demolition of bridges or other steel structures coated with lead-containing paint. Occupations in the mining and manufacturing industries may also expose workers to lead.14 It is estimated that about 24,000 U.S. children with elevated blood lead levels are unintentionally exposed to lead brought home by a parent from the workplace. Lead exposure in children can cause irreversible damage to organ systems. Behavioral changes and learning disabilities due to lead poisoning in children can manifest at BLLs as low as 5 µg/dL. National The U.S. experienced an annual prevalence rate of 6.7 cases per 100,000 workers with blood lead levels that were greater than or equal to 25 µg/dL (Figure 13.1). States with rates in the highest quartile (at or above 5.5 cases per 100,000 workers) included Missouri (30.6 cases), Iowa (10.9 cases), Kentucky (8.0 cases), New York (5.9 cases), and North Carolina (5.5 cases). Figure 13.1 Prevalence Rate* of Elevated Blood Lead Levels (≥25 µg/dL) among Employed Adults age 16 years or older by State and Overall U.S., 2010
*Rate per 100,000 employed persons age 16 years or older Data Source: ABLES Program data based on reports of elevated BLLs from laboratories; BLS Current population survey data Limitations: (1) An elevated body burden of lead may not be detected if the lead test is done more than several weeks after the most recent lead exposure; (2) Some states do not require laboratories to report elevated BLLs; (3) Not all workers with significant occupational lead exposure are tested; (4) Tests may be done in a state different than where the worker was exposed.

Wisconsin Occupational Health Indicator Report 42
Wisconsin In Wisconsin, there has been a significant decline in the prevalence and incidence rates of adult blood lead levels (BLLs) above 10 µg/dl, 25 µg/dl, and 40 µg/dl during the years 2003-2012. For example, incidence rates above each of these three cut-offs have declined between 6% and 7% on average per year over this period. Not only has the number of adults with high blood lead levels declined, but the mean reported adult blood lead value has also declined during this period, from 7.7 µg/dl in 2003 to 6.3 µg/dl in 2012. Figure 13.2. Prevalence and Incidence Rates of Blood Lead Levels (BLL) ≥ 10, 25 and 40 µg/dL among Working Wisconsin Residents Age 16 years or Older by Year (2003-2012)
*Rate per 100,000 employed persons age 16 years or older Data Source: ABLES Program data based on reports of elevated BLLs from laboratories; BLS Current population survey data Table 13.1 Number, Prevalence and Incidence Rate* of Residents with Elevated Blood Lead Levels (BLL) in Wisconsin (2003-2012) and U.S. (2010)
Wisconsin U.S. 2003 2004 2005 2006 2007 2008 2009 2010 2011 2012 2010
BLL ≥ 10 µg/dL Number 1095 1090 1055 931 964 990 873 830 781 708 28,667 Prevalence 37.7 37.4 36.6 32.0 32.9 33.6 30.8 29.5 27.4 24.8 24.8 Incidence 17.5 19.1 17.6 14.3 16.8 16.3 12.9 11.7 11.1 10.2 14.3 BLL ≥ 25 µg/dL Number 213 202 173 153 233 190 159 119 117 100 8,432 Prevalence 7.3 6.9 6.0 5.3 8.0 6.4 5.6 4.2 4.1 3.5 6.7 Incidence 4.0 4.2 3.3 3.0 5.6 3.9 3.3 2.2 2.5 2.1 4.0 BLL ≥ 40 µg/dL Number 27 26 15 16 24 22 23 14 13 11 1,313 Prevalence 0.9 0.9 0.5 0.6 0.8 0.8 0.8 0.5 0.5 0.4 1.0 Incidence 0.8 0.8 0.4 0.5 0.7 0.6 0.7 0.4 0.4 0.3 n/a *Rate per 100,000 employed persons age 16 years or older Data Source: ABLES Program data based on reports of elevated BLLs from laboratories; BLS Current population survey data
0
5
10
15
20
25
30
35
40
2003 2004 2005 2006 2007 2008 2009 2010 2011 2012
Rate
per
100
,000
em
ploy
ed p
erso
ns
BLL ≥ 10µg/dL - Prevalence BLL ≥ 10µg/dL - Incidence BLL ≥ 25µg/dL - Prevalence BLL ≥ 25µg/dL - Incidence BLL ≥ 40µg/dL - Prevalence

Wisconsin Occupational Health Indicator Report 43
Indicator 14: Workers Employed in Industries with High Risk for Occupational Morbidity In 2012, there were over 3 million reportable work-related injuries and illnesses in the private industry sector nationally. Over half of these cases were of a more serious nature involving days away from work, job transfer, or restriction and occurred at a rate of 1.8 cases per 100 full-time workers (BLS, 2014). This indicator measures the percent of workers employed in industries with high risk for occupational morbidity. The 55 industries identified in 2008 with rates more than double the national rate, or 7.8 cases per 100 FTE workers or higher, were considered high risk. These high-risk industries accounted for 7.96 million private-sector workers nationally and 16% of the Occupational Safety and Health Administration (OSHA) reportable injuries and illnesses in 2008 (BLS, 2010). Many high-risk industries for occupational morbidity are in the manufacturing, health care and social assistance, wholesale trade, and transportation and warehousing sectors. National Nationally, approximately 7.2% of employed persons worked in high morbidity risk industries in 2010 (Figure 14.1). By state, North Dakota (11.5%), Iowa (11.3%), Nebraska (10.1%), Kentucky (9.6%), Minnesota (9.0%), and Wisconsin (9.4%) had the highest percentages of workers employed in high-risk industries. Figure 14.1 Percentage of Workers in Industries with High Risk for Occupational Morbidity by State and Overall U.S., 2010
Data Sources: U.S. Census Bureau County Business Patterns (CBP) Limitations: (1) New employers may not be counted; (2) High-risk industries within a specific state may differ from those identified from national data; (3) Employers may not report lost workday cases; (4) The CBP is based on mid-March payrolls

Wisconsin Occupational Health Indicator Report 44
Wisconsin In Wisconsin, the percent of workers employed in industries with high risk of illness or injury has remained fairly static during the time periods 2003-2007 and 2008-2012, even though there was a change in the definition of high-risk industries in 2008 to include additional industries. Some examples of added industries include additional food processing industries, additional machinery manufacturing industries, furniture manufacturing, support activities for transportation, pet and pet supply stores, veterinary services, additional health care services and specialty hospitals, spectator sports, skiing facilities, and special food services industries. Compared to the national estimate in 2011 (7.2%), Wisconsin had a higher percentage of workers in high-risk industries (9.5%). Figure 14.2. Percentage of Workers in Industries at High Risk for Occupational Morbidity in Wisconsin, 2003-2012
Data Sources: U.S. Census Bureau County Business Patterns (CBP) Table 14.1. Number and Percentage of Workers in Industries at High Risk for Occupational Morbidity in Wisconsin (2003-2012) and U.S. (2011)
Wisconsin U.S. 2003 2004 2005 2006 2007 2008 2009 2010 2011 2012* 2011
Number of employed persons in high morbidity risk industries 196,626 194,134 215,641 216,733 212,857 234,179 223,591 217,410 223,664 225,654 8,159,146 Percentage of employed persons in high morbidity risk industries
8.3 8.0 8.8 8.7 8.6 9.4 9.5 9.4 9.5 9.5 7.2 Data Source: U.S. Census Bureau, County Business Patterns (CBP) *2012 data include 2011 numbers as proxies for nine high risk industry NAICS codes
0
2
4
6
8
10
12
2003 2004 2005 2006 2007 2008 2009 2010 2011 2012
Perc
ent o
f em
ploy
ed p
erso
ns (%
)
Year
high
-mor
bidi
ty in
dust
ries
upda
ted

Wisconsin Occupational Health Indicator Report 45
Indicator 15: Workers Employed in Occupations with High Risk for Occupational Morbidity National Nationally, the Bureau of Labor Statistics (BLS) reported over 3 million work-related injuries and illnesses that resulted in ‘days away from work’ in 2012. The risk of these injuries and illnesses was significantly higher in certain occupations. High-risk occupations were based on 61 occupation categories identified in 2008 with ‘days away from work’ injury and illness rates higher than 226.2 cases per 100,000 FTE workers. These occupations accounted for about 1.8 million private sector workers in the U.S. (16.1% of the private sector employment), but 44.1% of OSHA days away from work cases.3 Examples include truck drivers, janitorial staff and housekeeping, nurses and other healthcare workers, police and correctional officers, carpenters and other construction workers, and certain types of manufacturing employees. In 2010, the U.S. had 15.4% of employed workers in occupations with high risk for occupational morbidity (Figure 15.1). States with the highest percentage of employed persons in high-risk occupations included New York (21.9%), Wyoming (21.1%), Texas (18.5%), Kentucky (18.5%), Iowa (18.4%), and North Dakota (17.2%). Figure 15.1 Percentage of Employed Persons in Occupations at High Risk for Occupational Morbidity by State and Overall U.S., 2010
Data Source: BLS Current Population Survey data Limitations: Regional industrial practices/occupations may differ.

Wisconsin Occupational Health Indicator Report 46
Wisconsin In Wisconsin, the percentage of workers employed in occupations with high risk of workplace morbidity was unchanged during the periods of 2003-2007 and 2008-2012, despite the update to the list of high-morbidity occupations in 2008. Some examples of new occupations include athletes, coaches, umpires and related workers, police and sheriff patrol officers, animal control workers, pest control workers, janitors and housekeeping cleaners, boilermakers, masons, plumbers, roofers, highway maintenance workers, food processing workers, welders, flight attendants, and bus and taxi drivers. The percentage of workers employed in high-risk occupations in Wisconsin was similar to the national estimate in 2012. Figure 15.2. Percentage of Workers in Occupations at High Risk for Occupational Morbidity in Wisconsin, 2003-2012
Data Source: BLS Current Population Survey data Table 15.1. Number and Percentage of Workers in Occupations at High Risk for Occupational Morbidity in Wisconsin (2003-2012) and U.S. (2012)
Wisconsin U.S. 2003 2004 2005 2006 2007 2008 2009 2010 2011 2012* 2012*
Number of employed persons in high morbidity risk occupations 378,413 360,313 368,243 361,849 376,567 400,630 332,430 343,519 362,294 343,045 17,600,379 Percentage of employed persons in high morbidity risk occupations
13.0 12.3 12.8 12.3 12.8 13.6 15.5 16.0 16.7 15.5 15.7 Data Source: BLS Current Population Survey data *2012 data include 2011 numbers as proxies for seven high-risk occupation codes
0
2
4
6
8
10
12
14
16
18
2003 2004 2005 2006 2007 2008 2009 2010 2011 2012
Perc
ent o
f em
ploy
ed p
erso
ns (%
)
Year
high
-mor
bidi
ty o
ccup
atio
ns u
pdat
ed

Wisconsin Occupational Health Indicator Report 47
Indicator 16: Workers Employed in Industries and Occupations with High Risk for Occupational Mortality This indicator looks at the proportion of workers who work for companies engaged in a particular kind of commercial enterprise (industries) and the proportion of workers who perform an activity as their regular source of livelihood (occupation) that previously had a high number of work-related deaths. While the number of these industries and occupations vary among states, these differences can help explain the differences in injury mortality rates among states. Some of the most dangerous jobs include logging workers, fishers and fishing-related workers, aircraft pilots and flight engineers, roofers, refuse and recyclable material collectors, mining machine operators, driver/sales workers and truck drivers, and farmers, ranchers and other agricultural managers. National Over 4,500 work-related fatalities are reported to the Census of Fatal Occupational Injuries (CFOI) program each year in the U.S. On an average day, 12 workers die as a result of injuries sustained at work. The risks for these occupational fatalities are significantly higher in certain industries and occupations. The national estimate of workers in occupations with high risk for occupational mortality was 12.3% in 2010 (Figure 16.1). States with the highest percentage of workers in these occupations included Wyoming (30.7%), North Dakota (18.8%), New Mexico (15.5%), Montana (15.2%), and Texas (15.0%). National estimates for workers employed in industries with high risk for occupational mortality are not presented here. Figure 16.1 Percentage of Employed Persons in Occupations with High Risk for Occupational Mortality by State and Overall U.S., 2010
Data Source: Bureau of Labor Statistics Current Population Survey (CPS) Limitations: (1) Industries and occupations in each state vary; (2) The CFOI program counts suicides at work as work-related fatalities, even when the cause of death may not be due to factors at work; (3) CFOI does not count military deaths.

Wisconsin Occupational Health Indicator Report 48
Wisconsin Wisconsin’s workers employed in occupations and industries with high risk of mortality were static, during the periods 2003-2007 and 2008-2012, with the exception of workers employed in occupations at high-risk for mortality, which increased an average of 4% per year during 2008-2012. The change in the definition of “high-risk for mortality” industries and occupations in 2008 included, for example, industries of forestry, metal ore mining, steel product manufacturing, farm supply wholesalers, rail and pipeline transportation, sound recording, industrial machinery and equipment repair and maintenance, and occupations including athletes, coaches, umpires, announcers, pest control workers, tour and travel guides, glaziers, insulation workers, painters, construction and maintenance workers, riggers, metal and plastic molding occupations, welders, and industrial truck and tractor operators. Wisconsin’s percentages are similar to the national averages in 2012. Figure 16.2. Percentage of Workers Employed in Industries and Occupations at High Risk for Occupational Mortality in Wisconsin, 2003-2012
Data Source: Bureau of Labor Statistics Current Population Survey (CPS) Table 16.1. Number and Percentage of Workers Employed in Industries and Occupations at High Risk for Occupational Mortality in Wisconsin (2003-2012) and U.S. (2012)
Wisconsin U.S. 2003 2004 2005 2006 2007 2008 2009 2010 2011 2012* 2012*
Number of employed persons in high mortality risk industries 431,802 420,240 280,704 394,849 377,243 402,278 244,268 344,524 365,199 367,146 18,713,621 Percentage of employed persons in high mortality risk industries
14.9 14.4 11.5 13.5 12.8 13.6 11.4 14.2 14.8 14.7 15.3 Number of employed persons in high mortality risk occupations 310,476 285,783 305,239 289,812 302,583 321,103 222,977 285,268 296,759 305,084 15,073,127 Percentage of employed persons in high mortality risk occupations
10.7 9.8 10.6 9.9 10.3 10.9 10.4 11.7 12.0 12.2 12.3 Data Source: Bureau of Labor Statistics Current Population Survey (CPS) *2012 data for occupations include 2011 numbers as proxies for three high-risk occupation codes
0
2
4
6
8
10
12
14
16
2003 2004 2005 2006 2007 2008 2009 2010 2011 2012
Perc
ent o
f em
ploy
ed p
erso
ns (%
)
Year
High-risk industriesHigh-risk occupations
high
-risk
indu
strie
s and
occ
upat
ions
upd
ated

Wisconsin Occupational Health Indicator Report 49
Indicator 17: Occupational Safety and Health Professionals In order to reach the goal of reducing workplace illness and injury, there must be sufficient personnel trained to recognize work-related illness, provide care when needed, evaluate workplace hazards, and implement prevention strategies. In 1989, the American Medical Association (AMA) recommended that there be 100 professionals certified in occupational health per 100,000 employees. Industrial hygienists and safety professionals are typically the primary individuals responsible for evaluating workplaces and making recommendations to prevent occupational injuries and illnesses. National The national rate of select occupational safety and health professionals (including board-certified occupational medicine physicians, occupational health nurses, industrial hygienists, safety health professionals and safety engineers) was 42.5 per 100,000 employees in 2010. States with rates in the lowest quartile (at or under 35.6 professionals per 100,000 employees) included North Dakota (15.7 professionals), Florida (27.7 professionals), New York (27.7 professionals), Nebraska (30.5 professionals), California (35.1 professionals), Georgia (35.6 professionals), and Michigan (35.6 professionals). Figure 17.1 Rate* of Select Safety Health Professionals (BCSP) by State and Overall U.S., 2010
*Rate per 100,000 employees Limitations: (1) Other important occupational health specialties such as fire prevention, health physicists, ergonomists are not included; (2) The completeness of the data varies by each organization; (3) Out-of-state professionals are counted by the state where the main business is located. Data Source: American Board of Preventive Medicine (ABPM) diplomate database; American Board of Occupational Health Nurses directory; American Board of Industrial Hygiene, Board of Certified Safety Professionals member directory; American Society of Safety Engineers member directory; Bureau of Labor Statistics Current Population Survey data.

Wisconsin Occupational Health Indicator Report 50
Wisconsin The rates of select occupational safety and health professionals in Wisconsin in 2010 are depicted in Figure 17.2. The percent of occupational safety and health professionals, when compared to the workforce, has been steady in Wisconsin during 2003-2012 (Table 17.1). In 2012, Wisconsin percentages by type of professional were similar to national estimates. Figure 17.2. Rate of Select Occupational Safety and Health Professionals* in Wisconsin per 100,000 workers, 2010
*Including board-certified occupational medicine physicians, occupational health nurses, industrial hygienists, safety health professionals, and American Society of Safety Engineers members. See Data Source under table below. Table 17.1. Rates of Select Occupational Safety and Health Professionals in Wisconsin (2003-2012) and U.S. (2012)
Wisconsin U.S. 2003 2004 2005 2006 2007 2008 2009 2010 2011 2012 2012
Rate of board-certified occupational medicine physicians per 100,000 employees 1.8 1.8 1.9 1.9 2.0 2.1 2.3 2.2 * 1.9 2.1
Rate of board-certified occupational health registered nurses per 100,000 employees 7.0 7.0 7.3 7.7 7.2 7.2 7.3 7.0 * * *
Rate of board-certified industrial hygienists per 100,000 employees 3.0 2.8 3.1 3.0 3 2.9 2.9 3.1 * 2.0 3.3
Rate of board-certified safety health professionals per 100,000 employees 6.9 7.1 7.3 7.7 8.0 7.9 8.7 9.1 * 9.7 9.2
Rate of American Society of Safety Engineers members per 100,000 employees 22.6 24.7 27.1 22.5 22.6 23.5 24.2 24.2 * 23.8 22.7
*Data not available Data Source: American Board of Preventive Medicine (ABPM) diplomate database; American Board of Occupational Health Nurses directory; American Board of Industrial Hygiene, Board of Certified Safety Professionals member directory; American Society of Safety Engineers member directory; Bureau of Labor Statistics Current Population Survey data.
0
5
10
15
20
25
30
35
40
45
50
2010
Rate
per
100
,000
wor
kers
Year
American Society of SafetyEngineers members
Board-certified safety healthprofessionals
Board-certified industrialhygienists
Board-certified occupationalhealth nurses
Board-certified occupationalmedicine physicians

Wisconsin Occupational Health Indicator Report 51
Indicator 18: Occupational Safety and Health Administration (OSHA) Enforcement Activities The Occupational Safety and Health Administration (OSHA), established in 1970, has a mission to "assure so far as possible every working man and woman in the nation safe and healthful working conditions.” This involves tools such as standards, enforcement activities, and compliance assistance. Employers are responsible for providing a safe and healthful worksite for all of their workers under the OSHA law. The worksites to be inspected are selected both randomly and on the basis of injury incidence rates. Inspections also occur after a fatality, hospitalization of at least three workers, worker complaint or referral from outside agencies or the media.3 National Nationally, 3.6% of OSHA-covered employees had workplaces that were inspected by OSHA in 2010 (Figure 18.1). Among the states with data available for this indicator in the lowest quartile (at or below 1.6%) were seen among states including Louisiana (0.8%), Florida (1%), New Hampshire (1.2% ), Texas (1.2%), Maryland (1.3%), North Dakota (1.5%), and Massachusetts (1.6%). Figure 18.1 Percentage of OSHA-Covered Employees Eligible for Inspection Whose Work Areas were Inspected by OSHA, by State and Overall U.S., 2010
Data Source: OSHA annual reports: total inspections conducted, number of workers covered; Bureau of Labor Statistics on Covered Employers and Wages (ES-202/CEW) Limitations: (1) Includes only enforcement activity where penalties were imposed; (2) Data may include duplication by counting routine/regular inspections and inspections that were initiated by a worker complaint as two separate events; (3) Some states do not inspect smaller farms; (4) Employer voluntary programs are exempted from routine inspections.

Wisconsin Occupational Health Indicator Report 52
Wisconsin Over 95% of Wisconsin’s workplace establishments are under OSHA jurisdiction. The percentage of OSHA-covered establishments eligible for inspection that were inspected by Wisconsin’s OSHA increased very slightly (less than 1% per year) during 2003-2012. There was no significant change in the percent of OSHA-covered employees whose work area was inspected by OSHA during this time. In 2012, 3% of employees in Wisconsin establishments under OSHA jurisdiction were inspected, which translates to almost 70,000 employees inspected. This percentage was slightly lower than the national estimate in 2012. Figure 18.2. Percentage of OSHA-Covered Employees and Establishments Eligible for Inspection in Wisconsin Inspected by OSHA, 2003-2012
Data Source: OSHA annual reports: total inspections conducted, number of workers covered; Bureau of Labor Statistics on Covered Employers and Wages (ES-202/CEW) Table 18.1. OSHA Enforcement Activities* in Wisconsin (2003-2012) and U.S. (2012)
Wisconsin U.S. 2003 2004 2005 2006 2007 2008 2009 2010 2011 2012 2012
Number of OSHA-covered establishments inspected by OSHA 1,514 1,502 1,429 1,626 1,647 1,593 1,650 1,750 1,645 1,610 91,550
Percentage of OSHA-covered establishments eligible for inspection that were inspected by OSHA 1.0 1.0 0.9 1.1 1.0 1.1 1.1 1.2 1.1 1.1 1.0
Number OSHA-covered employees whose work area was inspected by OSHA 70,342 64,987 52,370 55,564 73,369 56,641 54,416 58,134 56,068 69,177 3,637,571
Percentage of OSHA-covered employees whose work area was inspected by OSHA 3.0 2.8 2.2 2.3 2.7 2.4 2.4 2.6 2.4 3.0 3.3
*excluding miners and farm workers Data Source: OSHA annual reports: total inspections conducted, number of workers covered; Bureau of Labor Statistics on Covered Employers and Wages (ES-202/CEW)
0.0
0.5
1.0
1.5
2.0
2.5
3.0
3.5
2003 2004 2005 2006 2007 2008 2009 2010 2011 2012
Perc
ent i
nspe
cted
by
OSH
A (%
)
Year
OHSA Covered Employees
OHSA Covered Establishments

Wisconsin Occupational Health Indicator Report 53
Indicator 19: Workers’ Compensation Awards Workers' compensation benefits are paid to workers with occupational injuries or illnesses and include payments for medical care and wage-replacement to workers or their surviving dependents. Awards represent known work-related injuries and illnesses, and often more severe cases. This indicator represents the average amount of benefits paid per covered worker to estimate the economic burden of these work-related events. National In 2010, the national average amount of workers’ compensation benefits was $462 per employed worker covered by the state workers’ compensation systems. Figure 19.1 presents state-level data for this indicator. States in the lowest quartile of benefits paid (at or below $365 per covered worker) include Texas ($180), Massachusetts ($327), North Dakota ($333), Missouri ($338), Michigan ($354), Nebraska ($360), and North Carolina ($365). Note that the rates may reflect differences in eligibility criteria and availability of data among state workers’ compensation programs, as well as differences in injury type, etc., and are not conducive to state-to-state comparisons. Figure 19.1 Average Workers’ Compensation Benefit* Paid per Covered Worker by State and by Overall U.S., 2010
*Workers’ compensation benefits paid in dollars Data Source: National Academy of Social Insurance (NASI) tables: http://www.nasi.org/research/workers-compensation Limitations: (1) Workers’ compensation eligibility criteria and availability of data from workers’ compensation programs varies among states, prohibiting state-level data from being directly compared to other states or with national estimates; (2) Noneconomic costs are not included; (3) Compensation determination varies by state.
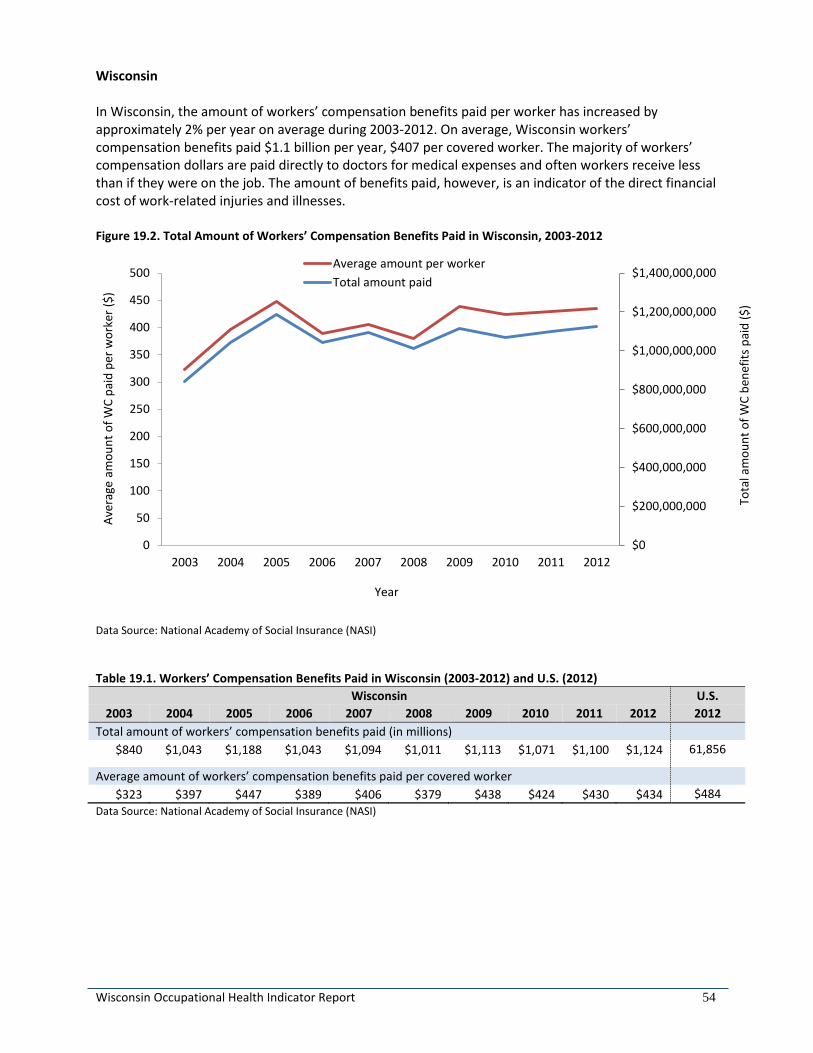
Wisconsin Occupational Health Indicator Report 54
Wisconsin In Wisconsin, the amount of workers’ compensation benefits paid per worker has increased by approximately 2% per year on average during 2003-2012. On average, Wisconsin workers’ compensation benefits paid $1.1 billion per year, $407 per covered worker. The majority of workers’ compensation dollars are paid directly to doctors for medical expenses and often workers receive less than if they were on the job. The amount of benefits paid, however, is an indicator of the direct financial cost of work-related injuries and illnesses. Figure 19.2. Total Amount of Workers’ Compensation Benefits Paid in Wisconsin, 2003-2012
Data Source: National Academy of Social Insurance (NASI) Table 19.1. Workers’ Compensation Benefits Paid in Wisconsin (2003-2012) and U.S. (2012)
Wisconsin U.S. 2003 2004 2005 2006 2007 2008 2009 2010 2011 2012 2012
Total amount of workers’ compensation benefits paid (in millions) $840 $1,043 $1,188 $1,043 $1,094 $1,011 $1,113 $1,071 $1,100 $1,124 61,856
Average amount of workers’ compensation benefits paid per covered worker $323 $397 $447 $389 $406 $379 $438 $424 $430 $434 $484
Data Source: National Academy of Social Insurance (NASI)
$0
$200,000,000
$400,000,000
$600,000,000
$800,000,000
$1,000,000,000
$1,200,000,000
$1,400,000,000
0
50
100
150
200
250
300
350
400
450
500
2003 2004 2005 2006 2007 2008 2009 2010 2011 2012
Tota
l am
ount
of W
C be
nefit
s pai
d ($
)
Aver
age
amou
nt o
f WC
paid
per
wor
ker (
$)
Year
Average amount per workerTotal amount paid

Wisconsin Occupational Health Indicator Report 55
Indicator 20: Low Back Disorder Hospitalizations Annually, 15-20% of Americans report back pain, resulting in over 100 million lost workdays and over 10 million physician visits. According to National Health Interview survey data, two-thirds of all low back pain cases are attributable to activities at work.3 The cost of back pain is also disproportionate, as it represents about 20% of workers’ compensation claims, but nearly 40% of the costs. Work-related back disorders result in adverse health effects and financial burdens, including significant functional impairment and disability, high absenteeism, reduced work performance, lost productivity, and high direct medical costs. Well-recognized prevention efforts need to be planned and implemented for high-risk occupational activities to reduce the physical and economic burden of work-related low back disorders.15, 16 National In 2010, the national rate of work-related low back disorder hospitalizations was 14.3 per 100,000 workers (Figure 20.1). States with rates in the highest quartile (at or above 22.0 hospitalizations per 100,000 workers) included Connecticut (37.6 hospitalizations), New York (36.6 hospitalizations), Washington (35.5 hospitalizations), and Montana (23.2 hospitalizations). Figure 20.1 Annual Rate* of Work-Related Low Back Disorder Hospitalizations by State and Overall U.S., 2010
* Rate per 100,000 employed persons with primary payer coded as workers’ compensation Data Source: Hospital discharge data; BLS Current Population Survey data Limitation: Workers’ compensation eligibility criteria and availability of data from workers’ compensation programs varies among states, prohibiting state-level data from being directly compared to other states or with national estimates.

Wisconsin Occupational Health Indicator Report 56
Wisconsin In Wisconsin, the rate of all work-related low back disorder hospitalizations has declined an average of 12% per year during 2003-2012. Similarly, the rate of work-related surgical low back disorder hospitalizations has also declined (11% per year on average) during this period. In 2010, the overall rate in Wisconsin was higher than the national estimate; however, there was no difference in the rate of surgical low back disorder hospitalizations. Figure 20.2. Rate of Work-Related Low Back Disorder Hospitalizations in Wisconsin, 2003-2012
Data Source: Hospital discharge data; BLS Current Population Survey Data Table 20.1. Number and Rate of Work-Related Low Back Disorder Hospitalizations in Wisconsin (2003-2012) and U.S. (2010)
Wisconsin U.S. 2003 2004 2005 2006 2007 2008 2009 2010 2011 2012 2010
Number of work-related low back disorder hospitalizations for persons age 16 years or older 1439 1158 976 1020 918 835 671 583 481 355 19,861
Crude rate of work-related low back disorder hospitalization per 100,000 workers age 16 years or older
49.5 39.7 33.9 35.1 31.4 28.3 23.7 20.7 16.9 12.4 14.3
Number of work-related surgical low back disorder hospitalizations for persons age 16 years or older 794 675 524 548 524 448 397 360 282 201 17,323
Crude rate of work-related surgical low back disorder hospitalization per 100,000 workers age 16 years or older
27.3 23.1 18.2 18.8 17.9 15.2 14.0 12.8 9.9 7.0 12.5 Data Source: Hospital discharge data; BLS Current Population Survey Data
0
10
20
30
40
50
60
2003 2004 2005 2006 2007 2008 2009 2010 2011 2012
Rate
per
100
,000
em
ploy
ed p
erso
ns
Year
All low back disorder hospitalizations
Surgical low back disorder hospitalizations
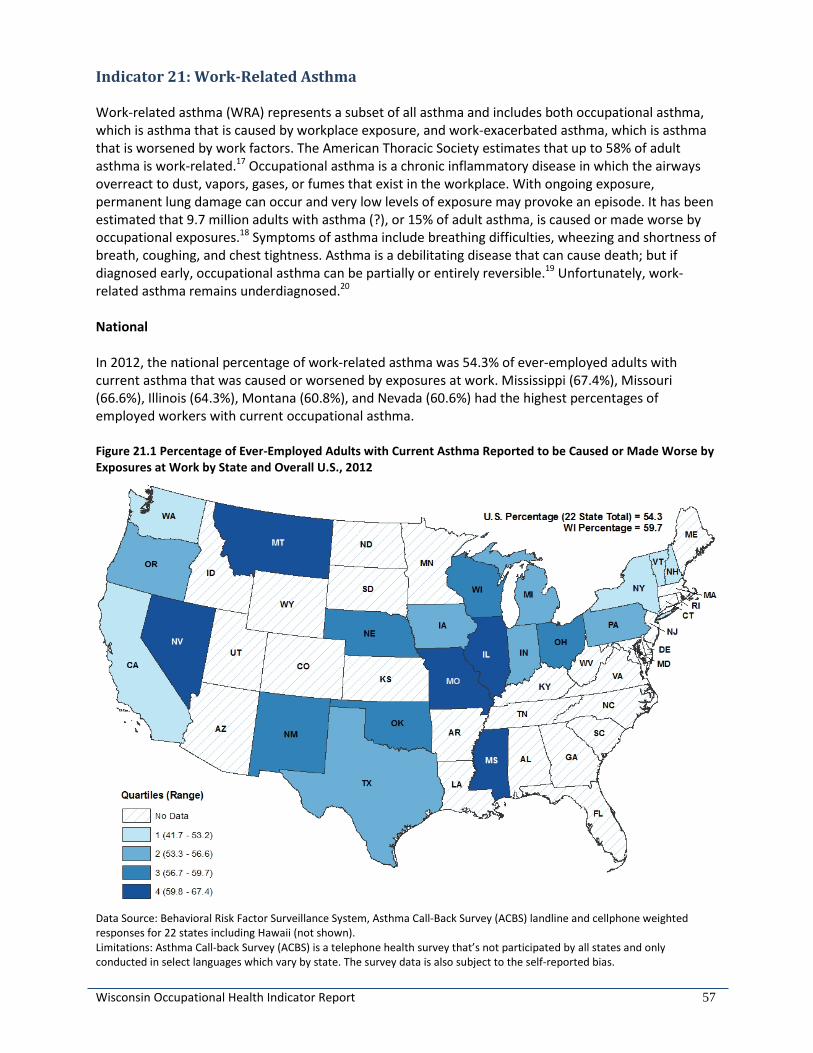
Wisconsin Occupational Health Indicator Report 57
Indicator 21: Work-Related Asthma Work-related asthma (WRA) represents a subset of all asthma and includes both occupational asthma, which is asthma that is caused by workplace exposure, and work-exacerbated asthma, which is asthma that is worsened by work factors. The American Thoracic Society estimates that up to 58% of adult asthma is work-related.17 Occupational asthma is a chronic inflammatory disease in which the airways overreact to dust, vapors, gases, or fumes that exist in the workplace. With ongoing exposure, permanent lung damage can occur and very low levels of exposure may provoke an episode. It has been estimated that 9.7 million adults with asthma (?), or 15% of adult asthma, is caused or made worse by occupational exposures.18 Symptoms of asthma include breathing difficulties, wheezing and shortness of breath, coughing, and chest tightness. Asthma is a debilitating disease that can cause death; but if diagnosed early, occupational asthma can be partially or entirely reversible.19 Unfortunately, work-related asthma remains underdiagnosed.20 National In 2012, the national percentage of work-related asthma was 54.3% of ever-employed adults with current asthma that was caused or worsened by exposures at work. Mississippi (67.4%), Missouri (66.6%), Illinois (64.3%), Montana (60.8%), and Nevada (60.6%) had the highest percentages of employed workers with current occupational asthma. Figure 21.1 Percentage of Ever-Employed Adults with Current Asthma Reported to be Caused or Made Worse by Exposures at Work by State and Overall U.S., 2012
Data Source: Behavioral Risk Factor Surveillance System, Asthma Call-Back Survey (ACBS) landline and cellphone weighted responses for 22 states including Hawaii (not shown). Limitations: Asthma Call-back Survey (ACBS) is a telephone health survey that’s not participated by all states and only conducted in select languages which vary by state. The survey data is also subject to the self-reported bias.

Wisconsin Occupational Health Indicator Report 58
Wisconsin In Wisconsin, the proportion of working adults with current asthma who reported that their asthma was caused or made worse by exposures at work ranged between 50% and 60% during 2011-2013, an average of 228,000 adults annually. These state-based percentages are similar to the national estimates during this period. Table 21.1. Weighted Frequency and Proportion of Ever-Employed Adults with Current Asthma Reported to Be Caused or Made Worse by Exposures at Work in Wisconsin (2011-2013) and U.S. (2012)
Wisconsin U.S. 2011 2012 2013 2012
Weighted frequency of asthma caused or made worse by work 190,622 235,460 256,790 6,475,692
Proportion (95% Confidence Interval) of asthma caused or made worse by work 50.2 (40.5 – 59.9) 59.7 (49.6 – 69.8) 56.8 (46.6 – 67.0) 54.3 (54.5 – 57.0)
Data Source: Behavioral Risk Factor Surveillance System, Asthma Call-Back Survey (landline and cellphone weighted responses)

Wisconsin Occupational Health Indicator Report 59
Indicator 22: Work-Related Severe Traumatic Injury Hospitalizations This indicator represents the number of severe traumatic injury hospitalizations that occur from work-related injuries and illnesses. Work-related hospitalizations are defined in this indicator as hospitalizations in which workers’ compensation is the payer. Severe work-related trauma is a major cause of death and long-term disability for U.S. employees. In 2010, more than 4,500 U.S. workers died from occupational injuries.21 Recent estimates show that the medical and productivity cost for occupational injuries is approximately $192 billion, which is a burden to the workers’ compensation system and society as a whole.22 Tracking significant adverse health effects from severe injuries and illnesses can help to document the burden of occupational injuries and illnesses; to design, target, and evaluate the impact of prevention efforts over time; and to identify settings in which workers may continue to be at high risk for injury or illness. National In 2012 rates of work-related severe traumatic injury hospitalizations per 100,000 workers are shown in Figure 22.1. The national estimate was not available for 2012. States with rates in the highest quartile (at or above 11.5 hospitalizations per 100,000 workers) included New Mexico (27.4 hospitalizations), Nebraska (14.5 hospitalizations), Washington (13.6 hospitalizations), Colorado (13.4 hospitalizations), and Florida (11.6 hospitalizations). Figure 22.1 Annual Rate* of Work-Related Severe Traumatic Injury Hospitalizations by State and Overall U.S., 2012
* Rate per 100,000 employed persons with primary payer coded as workers’ compensation Data Source: Hospital discharge data; BLS Current Population Survey data Limitation: Workers’ compensation eligibility criteria and availability of data from workers’ compensation programs varies among states, prohibiting state-level data from being directly compared to other states or with national estimates.

Wisconsin Occupational Health Indicator Report 60
Wisconsin In Wisconsin, the rate of work-related severe traumatic injury hospitalizations declined an average of 4% per year during 2003-2012. National estimates are not available for comparison. Figure 22.2. Rate of Work-Related Severe Traumatic Injury Hospitalizations in Wisconsin, 2003-2012
Data Source: Hospital discharge data; BLS Current Population Survey Data Table 22.1. Number and Rate of Work-Related Severe Traumatic Injury Hospitalizations in Wisconsin (2003-2012)
Wisconsin 2003 2004 2005 2006 2007 2008 2009 2010 2011 2012
Number of work-related hospitalizations for severe traumatic injury persons age 16 years or older 328 380 414 365 379 389 249 282 287 242
Crude rate of work-related hospitalization for severe traumatic injury per 100,000 employed persons age 16 years or older
11.3 13.0 14.4 12.5 12.9 13.2 8.8 10.0 10.1 8.5 Data Source: Hospital discharge data; BLS Current Population Survey Data
0
2
4
6
8
10
12
14
16
2003 2004 2005 2006 2007 2008 2009 2010 2011 2012
Rate
per
100
,000
em
ploy
ed p
erso
ns
Year

Wisconsin Occupational Health Indicator Report 61
References 1. Wisconsin Department of Health Services, Division of Public Health. Healthiest Wisconsin 2020: Everyone living better, longer. Available at https://www.dhs.wisconsin.gov/publications/p0/p00187.pdf. 2. Wisconsin Department of Health Services. Occupational Health in Wisconsin – An Annual Report 2006. Available at https://www.dhs.wisconsin.gov/publications/p4/p45104.pdf. 3. Council of State and Territorial Epidemiologists (CSTE). Occupational health indicators: a guide for tracking occupational health conditions and their determinants. Atlanta (GA): Council of State and Territorial Epidemiologists (CSTE); 2015. 123 p. Available at http://c.ymcdn.com/sites/www.cste.org/resource/resmgr/PDFs/2015_Ed_of_OHI_Guidance_Manu.pdf. 4. Baron SL, Steege AL, Marsh SM, Menendez CC, Myers JR. Nonfatal work-related injuries and illnesses – United States 2010. MMWR, 2013; 62(3):35-44. 5. Leigh, JP. Economic burden of occupational injury and illness in the United States; Milbank Quarterly; 89(4):728-772. 6. U.S. Bureau of Labor Statistics, U.S. Department of Labor. Chartbook: Rate of fatal work injuries, 2006-2013. Available at http://www.bls.gov/iif/oshwc/cfoi/cfch0012.pdf. Accessed 3/22/16. 7. U.S. Bureau of Labor Statistics, U.S. Department of Labor. BLS News Release: Nonfatal occupational injuries and illnesses requiring days away from work, 2014. Available at http://www.bls.gov/news.release/pdf/osh2.pdf. Accessed 3/22/16. 8. Baggs J, Curwick C, Silverstein B. Work-related burns in Washington State, 1994-1998. J Occup Environ Med. 2002; 44:692-9. 9. Rossignol AM, Locke JA, Burke JF. Employment status and the frequency and causes of burn injuries in New England. J Occup Med. 1989; 31:751-757. 10. Wisconsin Department of Workforce Development, Workers Compensation Division. Annual Report on Injury and Illness Claims. Available at https://dwd.wisconsin.gov/wc/research_statistics/DOI_reports/2006_rpt_doi.pdf 11. National Institute for Occupational Safety and Health (NIOSH), Centers for Disease Control and Prevention (CDC). Pesticide illness and injury surveillance. Available at http://www.cdc.gov/niosh/topics/pesticides/. Accessed on 3/22/16. 12. North American Association of Central Cancer Registries, 2012. Available at http://www.cancer-rates.info/naaccr/. 13. National Institute for Occupational Safety and Health (NIOSH), Centers for Disease Control and Prevention (CDC). Adult Blood Lead Epidemiology & Surveillance (ABLES) Program description. 2015. Available at: http://www.cdc.gov/niosh/topics/ables/description.html. Accessed on 3/22/16. 14. National Institute for Occupational Safety and Health (NIOSH), Centers for Disease Control and Prevention (CDC). Lead. 2016. Available at http://www.cdc.gov/niosh/topics/lead/. Accessed on 3/22/16.
Wisconsin Occupational Health Indicator Report 62
15. Stewart WF, Ricci JA, Chee E, et al.: Lost productive time and cost due to common pain conditions in the US workforce. JAMA 290:2443-2454, 2003. 16. Ricci JA, Stewart WF, Chee E, et al.: Back pain exacerbations and lost productive time costs in United States workers. Spine 31:3052-3060, 2006. 17. Balmes J, Becklake M, Blanc P, Henneberger P, Kreiss K, Mapp C, et al. American Thoracic Society statement: occupational contribution to the burden of airway disease. Am J Respir Crit Care Med. 2003;167:787–97. 18. Knoeller GE, Mazurek JM, Moorman JE. Work-Related Asthma Among Adults with Current Asthma in 33 States and DC: Evidence from the Asthma Call-Back Survey, 2006–2007. Public Health Rep 126; 603-611, 2011. 19. Tarlo SM, Balmes J, Balkissoon R, et al. Diagnosis and Management of Work-Related Asthma: ACCP Consensus Statement. Chest; 134: 1S-41S, 2008. 20. Milton DK, Solomon GM, Rosiello RA, Herrick RF. Risk and Incidence of Asthma Attributable to Occupational Exposure Among HMO Members. Am J Ind Med, 33:1-10, 1998. 21. National Institute for Occupational Safety and Health (NIOSH), Centers for Disease Control and Prevention (CDC). Workplace Safety and Health Topics: Traumatic Occupational Injuries. 2012. Available at: http://www.cdc.gov/niosh/injury/. Accessed on 3/22/16. 22. Leigh JP. Economic burden of occupational injury and illness in the United States. Milbank Quarterly. 2011. 89(4):728-72.

Wisconsin Occupational Health Indicator Report 63
Data Sources Adult Blood Lead Evaluation System (ABLES)
The Wisconsin Adult Blood Lead Epidemiology and Surveillance (ABLES) program is housed within the Occupational Health Program. The ABLES program helps to reduce the burden of lead poisoning in adults in Wisconsin by functioning as a repository of adult laboratory lead test results, tracking those results over time, and developing interventions for industries and workers in industries determined to be at-risk for causing elevated levels of lead in blood. One industry determined to have high risk for lead poisoning is the primary metal industry. Behavioral Risk Factor Survey (BRFS) and Asthma Call-Back Survey (ACBS)
The Wisconsin Behavioral Risk Factor Survey (BRFS) is an annual, statewide telephone survey of a random sample of Wisconsin household residents aged 18 and older that produces estimates representative of the non-institutionalized population living in Wisconsin. The Wisconsin BRFS is housed within the Office of Health Informatics (DPH, DHS). The Wisconsin BRFS is part of the national Behavioral Risk Factor Surveillance System (BRFSS), which is coordinated by the U.S. Centers for Disease Control and Prevention (CDC). Every state health department, the District of Columbia, and three U.S. territories conduct a survey as part of the system to measure adult health risk behaviors and attitudes and the use of preventive health services. The CDC has included questions on asthma prevalence on the BRFSS since 1999.
In 2006, Wisconsin began conducting the adult and child asthma call-back surveys (ACBS), in which adults and children who were identified in the BRFS as having lifetime asthma were invited to participate in an additional survey to provide in-depth information about their asthma history. This “call-back” survey includes detailed questions about symptoms, medication usage, health care utilization, asthma self-management knowledge, household environmental exposures, work-related asthma, and comorbid conditions. Bureau of Labor Statistics (BLS), Current Population Survey (CPS)
The Current Population Survey (CPS) is a monthly survey of households conducted by the Bureau of Census for the Bureau of Labor Statistics. It provides a comprehensive body of data on the labor force, employment, unemployment, persons not in the labor force, hours of work, earnings, and other demographic and labor force characteristics. Cancer Registry
The Wisconsin population-based cancer registry, the Wisconsin Cancer Reporting System (WCRS), is housed within the Office of Health Informatics (DPH, DHS). The WCRS website provides direct access to information about cancer incidence and mortality in Wisconsin. The WCRS contributes to the understanding of cancer incidence and mortality in Wisconsin, the development of prevention and treatment programs, and the ultimate goal of reducing cancer mortality. Census of Fatal Occupational Injuries (CFOI)
These reports are a complete study of work-related fatalities that occurred in Wisconsin regardless of coverage by OSHA or Worker's Compensation using a wide variety of reports (death certs., WC, coroners/medical examiners, OSHA, etc.). The data are collected annually by the Bureau of Labor Statistics/Occupational Safety and Health Statistics unit, part of the Wisconsin State Laboratory of Hygiene (WSLH) and contracted with the U.S. Department of Labor’s Bureau of Labor Statistics (BLS).

Wisconsin Occupational Health Indicator Report 64
Council of State and Territorial Epidemiologists (CSTE)
For more than five decades, the Council of State and Territorial Epidemiologists (CSTE) and the Centers for Disease Control and Prevention (CDC) have worked together in partnership to improve the public's health by supporting the efforts of epidemiologists working at the state and local level by promoting the effective use of epidemiologic data to guide public health practice and improve health. CSTE and its members represent two of the four basic components of public health—epidemiology and surveillance. County Business Patterns (CBP)
The U.S. Census Bureau’s County Business Patterns (CBP) is an annual series that provides subnational economic data by industry. This series includes the number of establishments, employment during the week of March 12, first quarter payroll, and annual payroll. These data are useful for studying the economic activity of small areas; analyzing economic changes over time; and as a benchmark for other statistical series, surveys, and databases between economic censuses. Businesses use the data for analyzing market potential, measuring the effectiveness of sales and advertising programs, setting sales quotas, and developing budgets. Government agencies use the data for administration and planning. Death Certificate Records
Death certificates for deaths occurring in Wisconsin are collected by the Vital Records Unit in the Office of Health Informatics (DPH, DHS). The death certificates are submitted by the 72 County Register of Deeds offices and by two city health offices (West Allis and Milwaukee). Deaths of Wisconsin residents that occur in other states and countries are recorded by those governments and submitted to the Wisconsin Vital Records Unit. In 1999, the coding system used to classify causes of death changed to a newer version (from the International Classification of Diseases-9 (ICD-9) to ICD-10). Inpatient Hospitalizations
Inpatient hospitalization data have been available in Wisconsin since 1989 from the Bureau of Health Information and Policy (DPH, DHS). In October of 2003, the collection of inpatient hospitalization data was transferred to the Wisconsin Hospital Association. Data are reported by all of Wisconsin’s acute care, non-federal hospitals. Zip code information collected was used to determine county of residence. If a zip code straddled county boundaries, the patients from that zip code area were randomly allocated to a county based on a probability equal to the proportion of the zip code area’s population in each county. It is important to note that rates are based on the number of hospitalizations and not the number of unique individuals admitted to hospitals with a specific principal diagnosis. All hospitalization rates presented in this report occurred in Wisconsin hospitals for Wisconsin residents only. National Academy of Social Insurance (NASI)
The National Academy of Social Insurance (NASI) is a nonprofit, nonpartisan organization made up of the nation's leading experts on social insurance. Its mission is to advance solutions to challenges facing the nation by increasing public understanding of how social insurance contributes to economic security. Social insurance encompasses broad-based systems that help workers and their families’ pool risks to avoid loss of income due to retirement, death, disability, or unemployment, and to ensure access to health care. NASI publishes annual workers’ compensation reports, with benefits, coverage, and costs by state. These are the only comprehensive national data on this largely state-run program, including estimates of workers' compensation payments—cash and medical—for all 50 states, the District of Columbia, and federal programs providing workers' compensation.

Wisconsin Occupational Health Indicator Report 65
Occupational Safety and Health Professional Registries
The numbers of health and safety professionals are collected through current membership rosters of cited organizations, including the American College of Occupational and Environmental Medicine (ACOEM), American Board of Preventive medicine diplomats database, American Association of Occupational Health Nurses (AAOHN), American Board of Industrial Hygiene, American Industrial Hygiene Association (AIHA), Board Certified Safety Health Professionals (BCSP) member directory, and American Society of Safety Engineers (ASSE). Survey of Occupational Injuries and Illnesses (SOII)
The SOII is the largest nationwide data collection of workplace injury statistics. In Wisconsin, work injury information is requested from approximately 6,000 establishments throughout the state, across all industries each year. These reports provide statistical information on work-related injuries and illnesses (excluding first aid) collected from employers and OSHA records. The data are collected annually by the Bureau of Labor Statistics/Occupational Safety and Health Statistics unit, part of the Wisconsin State Laboratory of Hygiene (WSLH), and contracted with the U.S. Department of Labor’s Bureau of Labor Statistics (BLS). Occupational Safety and Health Administration (OSHA)
The Occupational Safety and Health Administration (OSHA) serves as the enforcement and inspection arm of Wisconsin workplaces. It routinely conducts inspections and injury investigations, issues fines and warnings, and provides technical assistance. In Wisconsin the state OSHA enforcement activities remain vital to workplace safety and health, targeting the most hazardous workplaces and the employers that have the highest injury and illness rates. By working together, OSHA and the Occupational Health program can address emerging concerns in a timely manner. As a result, we add value to business, to the workplace, and to life. Interventions developed include public service announcements on the use of lifts to reduce injury in healthcare workers, and training on burn hazards facing restaurant workers. Workers’ Compensation
The Wisconsin Department of Workforce Development (DWD) is the state agency charged with building and strengthening Wisconsin’s workforce. The Workers’ Compensation Division provides data to facilitate a variety of research, resulting in statistical information on workers injuries, illnesses, and fatalities. Wisconsin Poison Center (WPC)
The Wisconsin Poison Center, located in Milwaukee, provides 24- hour, toll-free poison information for all individuals in Wisconsin. In addition to assisting with poison exposure treatment, the center strives to provide comprehensive education regarding the prevention of poison injury. U.S. Census Bureau
The primary mission of the Census Bureau is conducting the U.S. Census every 10 years, which allocates the seats of the U.S. House of Representatives to the states based on their population. In addition to the decennial census, the Census Bureau continually conducts dozens of other censuses and surveys, including the American Community Survey, the U.S. Economic Census, and the Current Population Survey.