Wisconsin Forward Exam Mathematics Item Sampler Grade 7
32
Mathematics Item Sampler Grade 7
Transcript of Wisconsin Forward Exam Mathematics Item Sampler Grade 7
Mathematics Item Sampler
Grade 7

Grade 7 Mathematics Item Sampler ii
Developed and published under contract with the Wisconsin Department of Public Instruction by Data Recognition Corporation, 13490 Bass Lake Road, Maple Grove, MN 55311. Copyright © 2021 by the Wisconsin Department of Public Instruction. All rights reserved. Only State of Wisconsin educators and citizens may copy, download, and/or print the document, located online at https://dpi.wi.gov/assessment/forward/sample-items. Any other use or reproduction of this document, in whole or in part, requires written permission of the Wisconsin Department of Public Instruction.
The Wisconsin Department of Public Instruction does not discriminate on the basis of sex, race, color, religion, creed, age, national origin, ancestry, pregnancy, marital status or parental status, sexual orientation, or disability.
iiiGrade 7 Mathematics Item Sampler
Summary Data . . . . . . . . . . . . . . . . . . . . . . . . . . . . . . . . . . . . . . . . . . . . . . . . . . . . . . . . . . . . . . 20
TABLE OF CONTENTS
MATHEMATICS ITEM SAMPLER OVERVIEW . . . . . . . . . . . . . . . . . . . . . . . . . . . . . . . . . . . . . . . . . . 1Overview . . . . . . . . . . . . . . . . . . . . . . . . . . . . . . . . . . . . . . . . . . . . . . . . . . . . . . . . . . . . . . . . . . . . 1Connection to the Standards . . . . . . . . . . . . . . . . . . . . . . . . . . . . . . . . . . . . . . . . . . . . . . . . . . . . 1How Do I Use This Book? . . . . . . . . . . . . . . . . . . . . . . . . . . . . . . . . . . . . . . . . . . . . . . . . . . . . . . 1
Professional Development . . . . . . . . . . . . . . . . . . . . . . . . . . . . . . . . . . . . . . . . . . . . . . . . . . 1Improving Instruction . . . . . . . . . . . . . . . . . . . . . . . . . . . . . . . . . . . . . . . . . . . . . . . . . . . . . . 1Student Practice . . . . . . . . . . . . . . . . . . . . . . . . . . . . . . . . . . . . . . . . . . . . . . . . . . . . . . . . . . 1Test Preparation . . . . . . . . . . . . . . . . . . . . . . . . . . . . . . . . . . . . . . . . . . . . . . . . . . . . . . . . . . 2
Depth of Knowledge . . . . . . . . . . . . . . . . . . . . . . . . . . . . . . . . . . . . . . . . . . . . . . . . . . . . . . . . . . . 3Item Types . . . . . . . . . . . . . . . . . . . . . . . . . . . . . . . . . . . . . . . . . . . . . . . . . . . . . . . . . . . . . . . . . . 4
Selected-Response (SR) Items . . . . . . . . . . . . . . . . . . . . . . . . . . . . . . . . . . . . . . . . . . . . . . . 4Technology-Enhanced (TE) Items . . . . . . . . . . . . . . . . . . . . . . . . . . . . . . . . . . . . . . . . . . . . . 5Text-Dependent Analysis (TDA) Items . . . . . . . . . . . . . . . . . . . . . . . . . . . . . . . . . . . . . . . . . . 6
MATHEMATICS NON-CALCULATOR ITEMS—SESSION 1 . . . . . . . . . . . . . . . . . . . . . . . . . . . . . . . 8
MATHEMATICS CALCULATOR ITEMS—SESSION 2 . . . . . . . . . . . . . . . . . . . . . . . . . . . . . . . . . . . 12
MATHEMATICS—APPENDIX . . . . . . . . . . . . . . . . . . . . . . . . . . . . . . . . . . . . . . . . . . . . . . . . . . . . . . 20

Grade 7 Mathematics Item Sampler iv
THIS PAGE IS INTENTIONALLY BLANK.
1Grade 7 Mathematics Item Sampler
MATHEMATICS ITEM SAMPLER OVERVIEW
OVERVIEW
This document contains samples of test items similar to those on the Wisconsin Forward Mathematics Exam. Each sample test item has been through a rigorous review process by DRC, Wisconsin Educators, and a third party, to ensure alignment with the Wisconsin Academic Standards. These items will not be used on the state assessment and may, therefore, be used in Wisconsin for professional development and student practice. The items in this document illustrate a sample of the content and types of items that students will encounter on the Forward Exam. A Summary Data table in the Appendix section identifies the alignment (standard measured), answer key, depth of knowledge, and annotations for each item.
CONNECTION TO THE STANDARDS
Wisconsin Academic Standards for Mathematics are available on the DPI webpage. Test items require students to prove their knowledge and abilities as stated in the standards.
HOW DO I USE THIS BOOK?
Professional Development
Sample items are useful as educators engage in conversations about what students are expected to know and be able to do to demonstrate proficiency on the state assessments relative to the Wisconsin Academic Standards. Sample items can inform discussions about state and local standards, curriculum, instruction, and assessment.
Improving Instruction
Teachers may use sample items in classroom activities that help students understand how to
• review key vocabulary;
• solve problems;
• determine which answer choices are correct, which are incorrect, and why;
• approach long and/or multistep tasks;
• use good test-taking strategies.
Student Practice
Students may perform better and with less anxiety if they are familiar with the format of the test and with the types of items they will be required to answer. The Forward Exam is an online assessment; students will benefit from the use of the Online Tools Training in order to work within the system interface to answer items as they will appear on the assessment, as well as utilize the tools available to them in the online system.
Note: A student’s score on the practice test cannot be converted to a scale score, used to predict performance on the Forward Exam, or used to make inferences about the student’s learning.

Grade 7 Mathematics Item Sampler 2
MATHEMATICS ITEM SAMPLER OVERVIEW
Test Preparation
While using the Item Sampler for test preparation, care should be taken that this is done in a balanced manner and one that helps to enhance student knowledge of subject matter as well as test performance. Please note that test preparation is only useful to the extent that it is also teaching content area knowledge and skills. Therefore, the use of this resource for test preparation is of limited value to students due to the narrow opportunity for content learning. It is very important to ensure that teachers are teaching to the curriculum and not to the test, as teaching to the test narrows the focus of instruction to only that content covered by the test.
3Grade 7 Mathematics Item Sampler
MATHEMATICS ITEM SAMPLER OVERVIEW
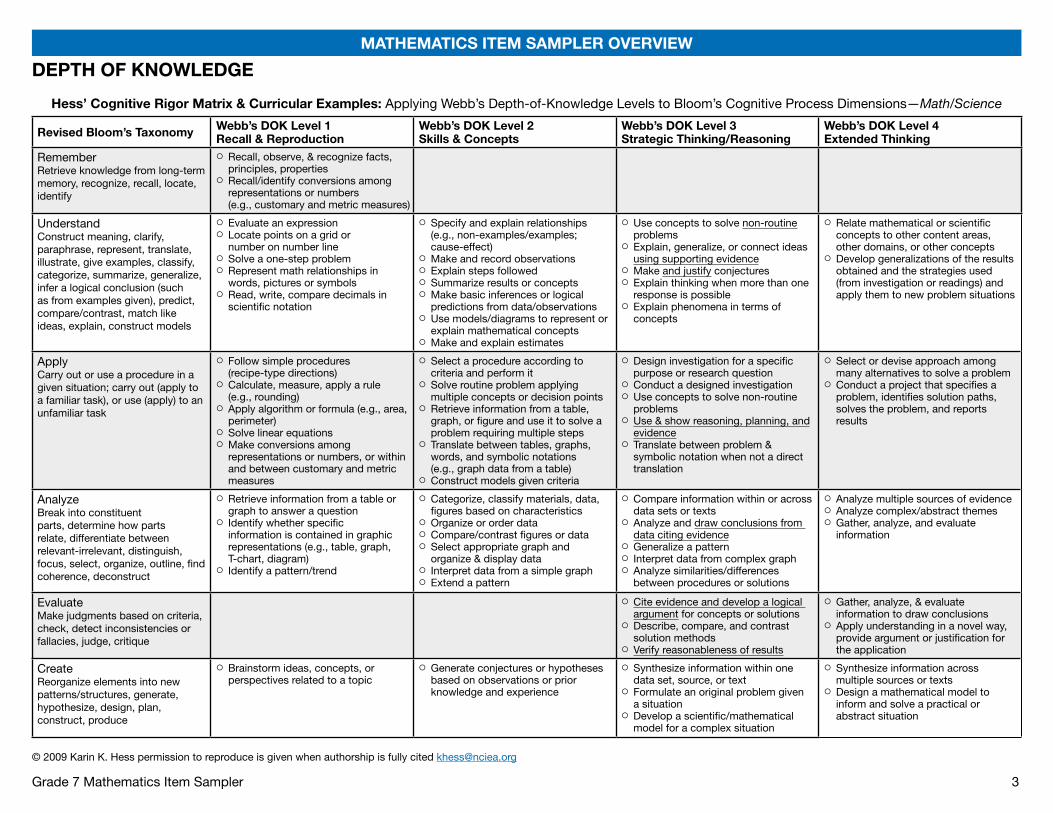
DEPTH OF KNOWLEDGE
Hess’ Cognitive Rigor Matrix & Curricular Examples: Applying Webb’s Depth-of-Knowledge Levels to Bloom’s Cognitive Process Dimensions—Math/Science
Revised Bloom’s Taxonomy Webb’s DOK Level 1 Recall & Reproduction
Webb’s DOK Level 2 Skills & Concepts
Webb’s DOK Level 3 Strategic Thinking/Reasoning
Webb’s DOK Level 4 Extended Thinking
Remember Retrieve knowledge from long-term memory, recognize, recall, locate, identify
{ Recall, observe, & recognize facts, principles, properties
{ Recall/identify conversions among representations or numbers (e.g., customary and metric measures)
Understand Construct meaning, clarify, paraphrase, represent, translate, illustrate, give examples, classify, categorize, summarize, generalize, infer a logical conclusion (such as from examples given), predict, compare/contrast, match like ideas, explain, construct models
{ Evaluate an expression { Locate points on a grid or number on number line
{ Solve a one-step problem { Represent math relationships in words, pictures or symbols
{ Read, write, compare decimals in scientific notation
{ Specify and explain relationships (e.g., non-examples/examples; cause-effect)
{ Make and record observations { Explain steps followed { Summarize results or concepts { Make basic inferences or logical predictions from data/observations
{ Use models/diagrams to represent or explain mathematical concepts
{ Make and explain estimates
{ Use concepts to solve non-routine problems
{ Explain, generalize, or connect ideas using supporting evidence
{ Make and justify conjectures { Explain thinking when more than one response is possible
{ Explain phenomena in terms of concepts
{ Relate mathematical or scientific concepts to other content areas, other domains, or other concepts
{ Develop generalizations of the results obtained and the strategies used (from investigation or readings) and apply them to new problem situations
Apply Carry out or use a procedure in a given situation; carry out (apply to a familiar task), or use (apply) to an unfamiliar task
{ Follow simple procedures (recipe-type directions)
{ Calculate, measure, apply a rule (e.g., rounding)
{ Apply algorithm or formula (e.g., area, perimeter)
{ Solve linear equations { Make conversions among representations or numbers, or within and between customary and metric measures
{ Select a procedure according to criteria and perform it
{ Solve routine problem applying multiple concepts or decision points
{ Retrieve information from a table, graph, or figure and use it to solve a problem requiring multiple steps
{ Translate between tables, graphs, words, and symbolic notations (e.g., graph data from a table)
{ Construct models given criteria
{ Design investigation for a specific purpose or research question
{ Conduct a designed investigation { Use concepts to solve non-routine problems
{ Use & show reasoning, planning, and evidence
{ Translate between problem & symbolic notation when not a direct translation
{ Select or devise approach among many alternatives to solve a problem
{ Conduct a project that specifies a problem, identifies solution paths, solves the problem, and reports results
Analyze Break into constituent parts, determine how parts relate, differentiate between relevant-irrelevant, distinguish, focus, select, organize, outline, find coherence, deconstruct
{ Retrieve information from a table or graph to answer a question
{ Identify whether specific information is contained in graphic representations (e.g., table, graph, T-chart, diagram)
{ Identify a pattern/trend
{ Categorize, classify materials, data, figures based on characteristics
{ Organize or order data { Compare/contrast figures or data { Select appropriate graph and organize & display data
{ Interpret data from a simple graph { Extend a pattern
{ Compare information within or across data sets or texts
{ Analyze and draw conclusions from data citing evidence
{ Generalize a pattern { Interpret data from complex graph { Analyze similarities/differences between procedures or solutions
{ Analyze multiple sources of evidence { Analyze complex/abstract themes { Gather, analyze, and evaluate information
Evaluate Make judgments based on criteria, check, detect inconsistencies or fallacies, judge, critique
{ Cite evidence and develop a logical argument for concepts or solutions
{ Describe, compare, and contrast solution methods
{ Verify reasonableness of results
{ Gather, analyze, & evaluate information to draw conclusions
{ Apply understanding in a novel way, provide argument or justification for the application
Create Reorganize elements into new patterns/structures, generate, hypothesize, design, plan, construct, produce
{ Brainstorm ideas, concepts, or perspectives related to a topic
{ Generate conjectures or hypotheses based on observations or prior knowledge and experience
{ Synthesize information within one data set, source, or text
{ Formulate an original problem given a situation
{ Develop a scientific/mathematical model for a complex situation
{ Synthesize information across multiple sources or texts
{ Design a mathematical model to inform and solve a practical or abstract situation
© 2009 Karin K. Hess permission to reproduce is given when authorship is fully cited [email protected]

Grade 7 Mathematics Item Sampler 4
MATHEMATICS ITEM SAMPLER OVERVIEW
ITEM TYPES
The Wisconsin Forward Exam has multiple types of test items. However, because this item sampler is in a format that can be printed, the majority of its items are multiple-choice. In the Forward Exam, there will be a more diverse array of item types, including the ones described below.
Selected-Response (SR) Items
Selected-Response (SR) items are an efficient method for measuring a broad range of content, and can be used to assess a variety of skills. Three types of SR items are used on the online assessments: Multiple-Choice (MC), Enhanced Selected-Response (ESR), and Evidence-Based Selected-Response (EBSR). In all cases, SR items require that a student determines the correct answer(s) to the item posed from a provided list. While it is still possible for a student to perform some work directly related to determining the correct answer, the student is not required to generate the content of the answer when responding to a Selected-Response item. An exception to this requirement is Mathematics Short-Response/Gridded-Response items where students will be required to enter a short alphanumeric response.
Multiple-Choice (MC) Items
Multiple-Choice (MC) items on Wisconsin’s assessments have four answer choices, including three distractors and one correct answer. Distractors for Mathematics represent common misconceptions, incorrect logic, incorrect application of an algorithm, computational errors, etc. Distractors for English Language Arts (ELA) are written to represent a common misinterpretation, predisposition, unsound reasoning, casual reading, etc. A correct response to an MC item is worth one raw point. The process skills, directives, and action statements within an MC item also specifically align with the Wisconsin Academic Standards. Multiple-Choice items are present in all grades and are used with all content areas.
Multiple-Choice items can be further defined by being linked to, or independent from, a stimulus source. Items that operate independent of a stimulus are also known as “stand-alone MC.” Stand-alone items may still have tables, graphs, or other information used in support of the stem. English Language Arts uses a mixture of MC items linked to a stimulus passage and some that are stand-alone. For Mathematics, all MC items are considered stand-alone.
Enhanced Selected-Response (ESR) Items
The Enhanced Selected-Response (ESR) items are multi-part autoscored items that may consist of varying combinations of Multiple-Choice, Multiple-Response, Gridded-Response, Completion or Short-Answer, and Technology-Enhanced items that explore in greater depth and cognitive complexity the knowledge, skills, and abilities specified by the standards of each content area. Typically, this item type has a common focus and explores authentic problem-solving skills. An example of a Statistics and Probability Mathematics ESR item would utilize a data-table stimulus with Part A using a Technology-Enhanced (TE) graphing tool to create a bar graph of the data presented and Part B asking students to calculate the mean of the data using a Short-Response item.
Two-Part Evidence-Based Selected-Response (EBSR) Items
The Evidence-Based Selected-Response (EBSR) items have two parts and are designed to elicit a response based on what a student has read from a stimulus passage. EBSR items may be linked to a stimulus passage or to a stimulus passage set. There are several variations of two-part EBSR items, but all two-part EBSR items have an Accuracy piece and an Evidence piece.
5Grade 7 Mathematics Item Sampler
MATHEMATICS ITEM SAMPLER OVERVIEW
The Accuracy piece of the item is Part A. Part A of a typical EBSR item will be similar to a standard MC test item. A student analyzes a passage and chooses a single, best (correct) answer from four answer choices. Part B of a typical EBSR item will elicit evidence from the stimulus passage and will require that the student selects one or more correct answers based on the response the student provided to Part A. Part B is also different from Part A in that it may have five or six answer options rather than just four answer options typical of an MC item and more than one option may be correct.
Technology-Enhanced (TE) Items
Technology-Enhanced (TE) item types share the same functional structure as traditional paper and pencil test items; however, the expansive features and functions of a computer-based medium allow for the incorporation of technical enhancements into traditional elements of a test item, such as the item stem, the stimulus (if any), the response area, or a combination of all three. TE items are used in the content areas of ELA, Mathematics, and Science.
Item types such as drag-and-drop, hot spot, and in-line selection of multiple answers from drop-down menus broaden item presentation with engaging, interactive open-ended items.
A wide variety of TE item types will be present on the Wisconsin Forward Exam, including, but not limited to:
• Clock Input, where a student is able to add an hour hand and a minute hand to the clock;
• Angle Draw Input, where given a base line, the student can represent an angle;
• Short Input, where there are many types of short inputs that can be used (The number of characters is usually limited to a relatively small number in order to facilitate auto-scoring. The types of characters allowed can also be limited to text only, numbers only, or a mix. An equation editor can be utilized to assist the student in creating something as basic as a fraction or something more complex. The available symbols and templates in the equation builder can be customized for a testing program. Certain Short Input items can also be used in a paper-based test (PBT) as a Gridded-Response item.);
• Bar Graph Input, where students can produce bar graphs with prepopulated titles, labels, and scales, or the system can allow the student to populate them (The number of bars and the color of the bars is predetermined by the system. A reset feature is available that allows the student to start over from the original configuration.);
• Number Line Input, where students can create a graph that might involve plotting points only or points and lines (Both solid and open “dots” are available as well as line segments and rays. Number line graphs can have prepopulated titles, labels, and scales or can allow the student to populate them.);
• Coordinate Graph Input, which allows for the graphing and labeling of points and lines (Regions, determined by plotted lines, can be shaded. Solid and open “dots” as well as solid and dashed lines are available to the student. Coordinate graphs can have prepopulated titles, labels, and scales or can allow the student to populate them.);
• Line Plot Input, which is used as another way to graphically represent data (The basic structure is provided for the student. Certain labeling on the line plot can be done by the student. A reset feature is available that allows the student to start over from the original configuration.);
• List Input, a combination of the short input described earlier that allows the student to add input boxes (For example, it can be used for describing the steps in a process without revealing to the student the number of steps needed. The added input boxes can be rearranged and/or deleted.);
• Drag-and-Drop Input, a wide variety of ways are available to utilize a drag-and-drop input (The main difference between it and a drag-and-paste is that each dragable entity can be used only once with a drag-and-drop input. A reset feature is available that allows the student to start over from the original configuration.);

Grade 7 Mathematics Item Sampler 6
MATHEMATICS ITEM SAMPLER OVERVIEW
• Drag-and-Paste Input, a wide variety of ways are available to utilize drag-and-paste input (The main difference between it and a drag-and-drop is that each dragable entity can be used more than once with a drag-and-paste input. A reset feature is available that allows the student to start over from the original configuration.);
• Drop-Down List Input, allows for the creation of a situation where a great deal of information about a student’s grasp of a concept can be determined with a single item (Students can be asked to choose from three function types, four number of real zero responses, and two inverse function responses. For one function alone, this provides 24 possible answer combinations. With the three functions, a considerable amount of information can be gained, making this almost an open-ended item type.);
• Pictograph using Drag-and-Paste, actually another example of drag-and-paste, but is worth mentioning on its own as it is a type of graphing often used at lower grade levels;
• Circle Graph, a graph that allows the student to create and label the “wedges” that represent the data (Circle graphs can have a prepopulated title or can allow the student to populate it. The color of the “wedges” is predetermined by the system.);
• Matching, allows for the use of text or graphics as the matching objects (The student clicks on one object and then clicks on a second object to connect them.);
• Highlighting Text, allows for designated text to be highlighted in a word, phrase, sentence, or paragraph; and the
• Graphic Modification Hot Spot, allows for one image to replace another image when a hot spot is clicked.
Text-Dependent Analysis (TDA) Items
The English Language Arts (ELA) section of the Forward Exam presents students with a Text-Dependent Analysis (TDA) item. A TDA is a text-based analysis based on a single passage or a multiple passage set that each student has read during the assessment. The passage or passage set will consist of either literary or informational text. In order to successfully answer a TDA, students must analyze and use information from the passage(s) to plan a comprehensive, holistic response. Students will then write their response including supporting evidence from the passage(s). Students will have up to 5,000 characters to formulate their response. Students’ responses are scored using a rubric that takes into account both the composition and the conventions of the student’s writing.
The TDA portion of the Forward Exam requires students to read the text and then respond in writing in one of two ways:
• identifying and explaining a theme or central idea, using textual evidence to support the claim about what that theme or central idea is, or
• analyzing the development of an event, character, central ideas, or theme, using textual evidence to support the explanation and analysis.
TDA Item Samplers are available at https://dpi.wi.gov/assessment/forward/sample-items.

7Grade 7 Mathematics Item Sampler
THIS PAGE IS INTENTIONALLY BLANK.

Grade 7 Mathematics Item Sampler 8
Go on to the next page.
MATHEMATICS NON-CALCULATOR ITEMS—SESSION 1
Answer the items below. A calculator may not be used to assist with calculations necessary to answer items in Session 1.
1 . Jorge writes the expression 0.88x to represent the final cost of a shirt. Which statement about the original cost of the shirt, x, is true?
A. To get the final cost of the shirt, the original cost of the shirt is decreased by 12%.
B. To get the final cost of the shirt, the original cost of the shirt is decreased by 88%.
C. To get the final cost of the shirt, the original cost of the shirt is increased by 12%.
D. To get the final cost of the shirt, the original cost of the shirt is increased by 88%.
2 . Jeremy is plotting points on a number line. The first point he plots is at –5. The absolute value of the difference between the first point and the second point is 3. On the number line shown, plot a point at all of the possible locations of Jeremy’s second point.
– 0101 – 99 – 88 – 77 – 66 – 55 – 44 –3 3–2 2–1 10
9Grade 7 Mathematics Item Sampler
MATHEMATICS NON-CALCULATOR ITEMS—SESSION 1
STOP.
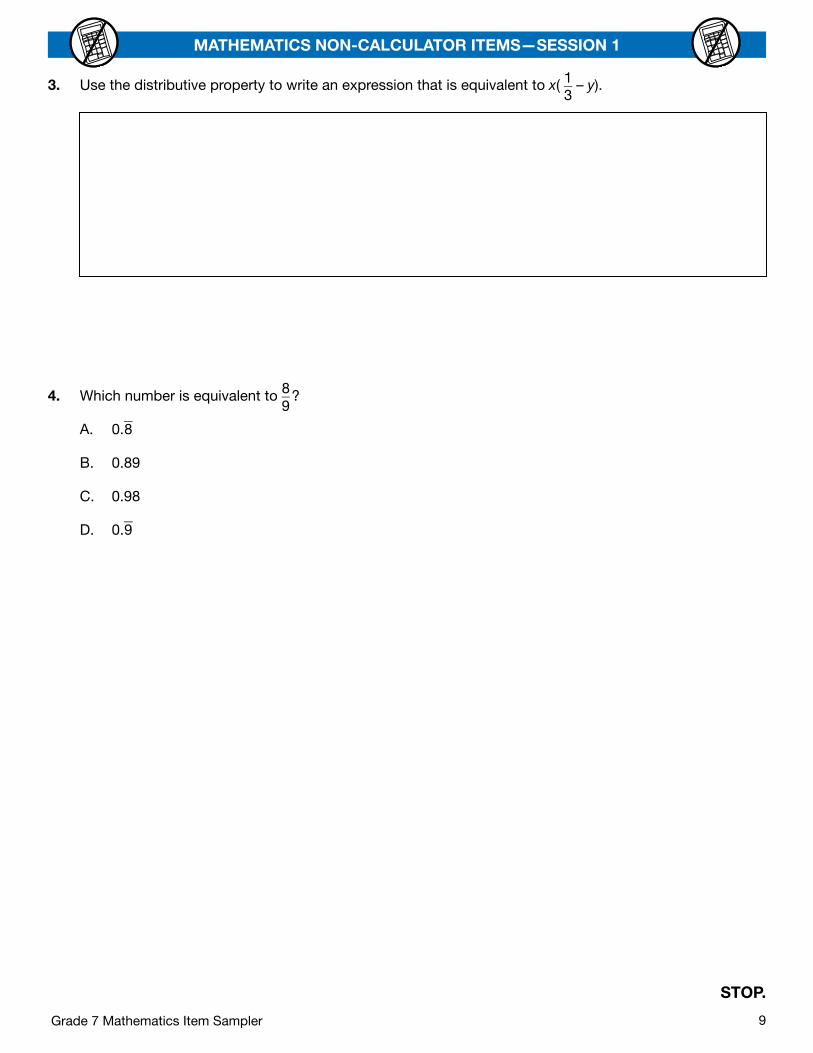
3 . Use the distributive property to write an expression that is equivalent to x( 1 } 3 – y).
4 . Which number is equivalent to 8 } 9 ?
A. 0. } 8
B. 0.89
C. 0.98
D. 0. } 9

Grade 7 Mathematics Item Sampler 10
MATHEMATICS NON-CALCULATOR ITEMS—SESSION 1
STOP.

11Grade 7 Mathematics Item Sampler
MATHEMATICS NON-CALCULATOR ITEMS—SESSION 1
STOP.

Grade 7 Mathematics Item Sampler 12
Go on to the next page.
MATHEMATICS CALCULATOR ITEMS—SESSION 2
Answer the items below. A calculator may be used to assist with calculations necessary to answer items in Session 2.
1 . A scale drawing of a stop sign is shown.
3 inches
Scale Drawing
The scale of the drawing is 1 inch represents 1 } 3 foot. All the sides of the stop sign are the same length.
How long, in inches, is each side of the actual stop sign?
A. 4
B. 7
C. 9
D. 12
13Grade 7 Mathematics Item Sampler
MATHEMATICS CALCULATOR ITEMS—SESSION 2
Go on to the next page.
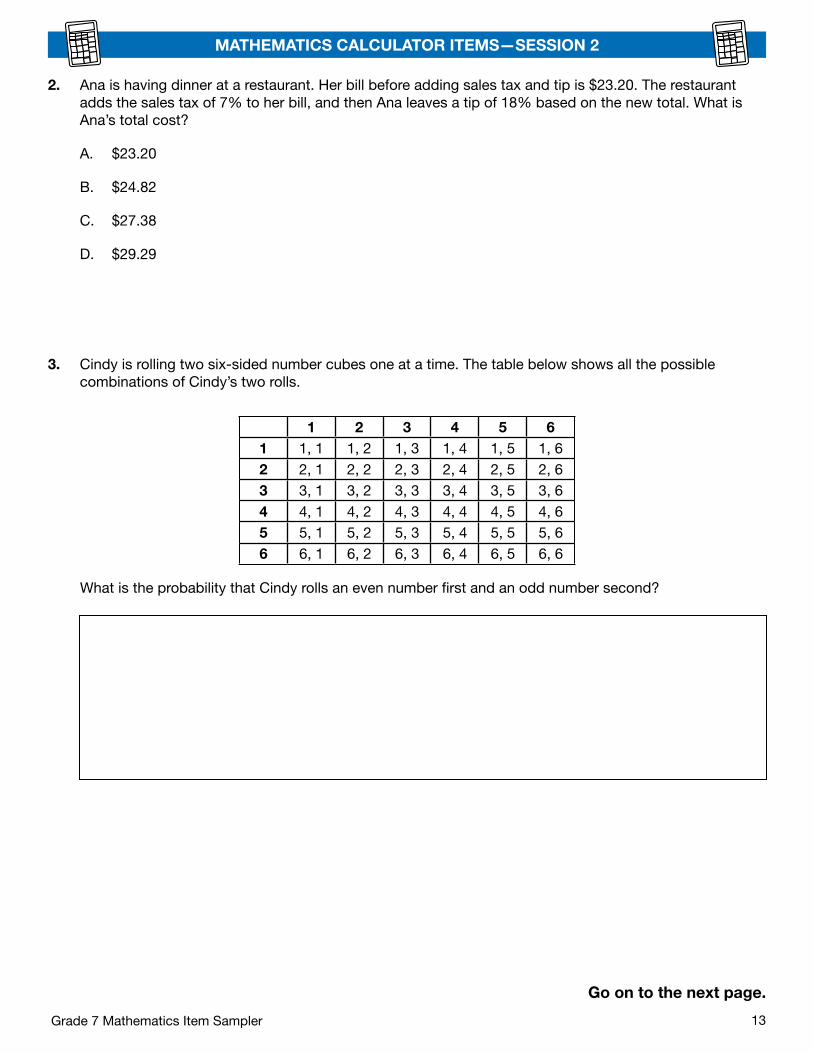
2 . Ana is having dinner at a restaurant. Her bill before adding sales tax and tip is $23.20. The restaurant adds the sales tax of 7% to her bill, and then Ana leaves a tip of 18% based on the new total. What is Ana’s total cost?
A. $23.20
B. $24.82
C. $27.38
D. $29.29
3 . Cindy is rolling two six-sided number cubes one at a time. The table below shows all the possible combinations of Cindy’s two rolls.
1 2 3 4 5 61 1, 1 1, 2 1, 3 1, 4 1, 5 1, 62 2, 1 2, 2 2, 3 2, 4 2, 5 2, 63 3, 1 3, 2 3, 3 3, 4 3, 5 3, 64 4, 1 4, 2 4, 3 4, 4 4, 5 4, 65 5, 1 5, 2 5, 3 5, 4 5, 5 5, 66 6, 1 6, 2 6, 3 6, 4 6, 5 6, 6
What is the probability that Cindy rolls an even number first and an odd number second?
Grade 7 Mathematics Item Sampler 14
MATHEMATICS CALCULATOR ITEMS—SESSION 2
Go on to the next page.
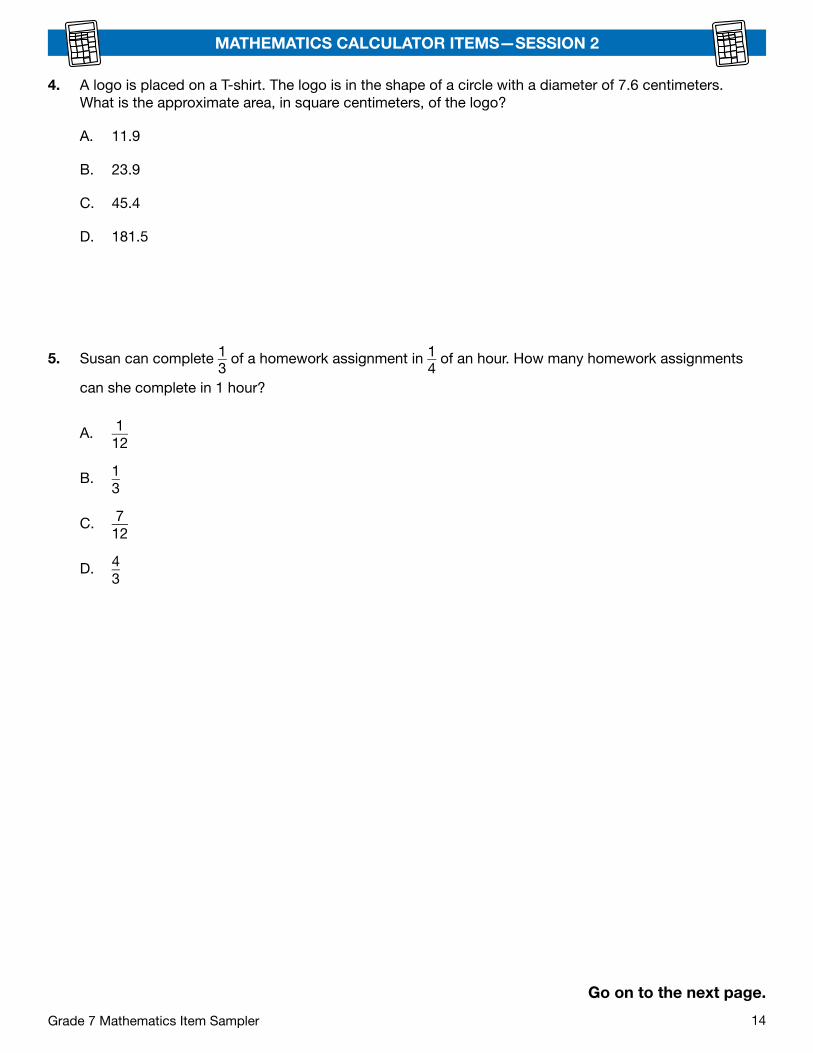
4 . A logo is placed on a T-shirt. The logo is in the shape of a circle with a diameter of 7.6 centimeters. What is the approximate area, in square centimeters, of the logo?
A. 11.9
B. 23.9
C. 45.4
D. 181.5
5 . Susan can complete 1 __ 3 of a homework assignment in 1 __
4 of an hour. How many homework assignments
can she complete in 1 hour?
A. 1 } 12
B. 1 } 3
C. 7 } 12
D. 4 } 3
15Grade 7 Mathematics Item Sampler
MATHEMATICS CALCULATOR ITEMS—SESSION 2
Go on to the next page.
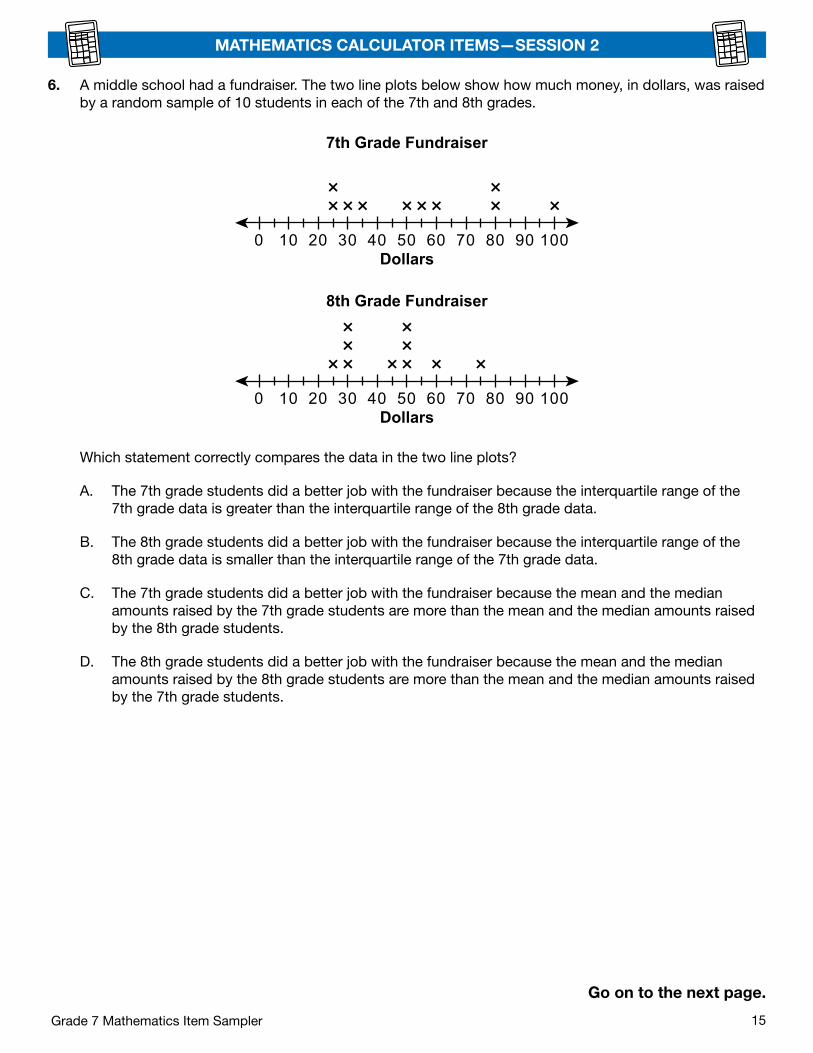
6 . A middle school had a fundraiser. The two line plots below show how much money, in dollars, was raised by a random sample of 10 students in each of the 7th and 8th grades.
0 10 20 30 40 50 60 70 80 90 100
××× ××× × ×× ×
7th Grade Fundraiser
0 10 20 30 40 50 60 70 80 90 100
× × × ××××
×××
8th Grade Fundraiser
Dollars
Dollars
Which statement correctly compares the data in the two line plots?
A. The 7th grade students did a better job with the fundraiser because the interquartile range of the 7th grade data is greater than the interquartile range of the 8th grade data.
B. The 8th grade students did a better job with the fundraiser because the interquartile range of the 8th grade data is smaller than the interquartile range of the 7th grade data.
C. The 7th grade students did a better job with the fundraiser because the mean and the median amounts raised by the 7th grade students are more than the mean and the median amounts raised by the 8th grade students.
D. The 8th grade students did a better job with the fundraiser because the mean and the median amounts raised by the 8th grade students are more than the mean and the median amounts raised by the 7th grade students.

Grade 7 Mathematics Item Sampler 16
MATHEMATICS CALCULATOR ITEMS—SESSION 2
Go on to the next page.
7 . A square pyramid is shown.
The pyramid is sliced with a single straight cut. The cut does not intersect the base of the pyramid. The exposed cross section is painted. Determine whether each shape in the table could be the painted cross section of the square pyramid.
Could Be Painted Cross Section
Could Not Be Painted Cross Section
square
triangle
trapezoid
non-square rectangle
8 . Fernando is playing basketball. He has made 18 free throws out of 30 attempts. At this rate, how many of Fernando’s next 50 free throws should he expect to make?
A. 18
B. 30
C. 38
D. 50
17Grade 7 Mathematics Item Sampler
MATHEMATICS CALCULATOR ITEMS—SESSION 2
Go on to the next page.
9 . There are 15 blue marbles, 8 green marbles, and 7 red marbles in a bag. Hanna randomly draws a marble from the bag. What is the probability that Hanna draws a blue marble?
A. 1 } 30
B. 7 } 30
C. 10 } 30
D. 15 } 30
10 . A trapezoid has an area of 88 square inches. The length of one of the bases of the trapezoid is 10 inches. The height of the trapezoid is 8 inches. The equation shown can be used to find the length, in inches, of the unknown base, b.
88 = (0.5)(8)(10 + b)
What is the length, in inches, of the unknown base of the trapezoid?
A. 12
B. 26
C. 32
D. 48
Grade 7 Mathematics Item Sampler 18
MATHEMATICS CALCULATOR ITEMS—SESSION 2
STOP.
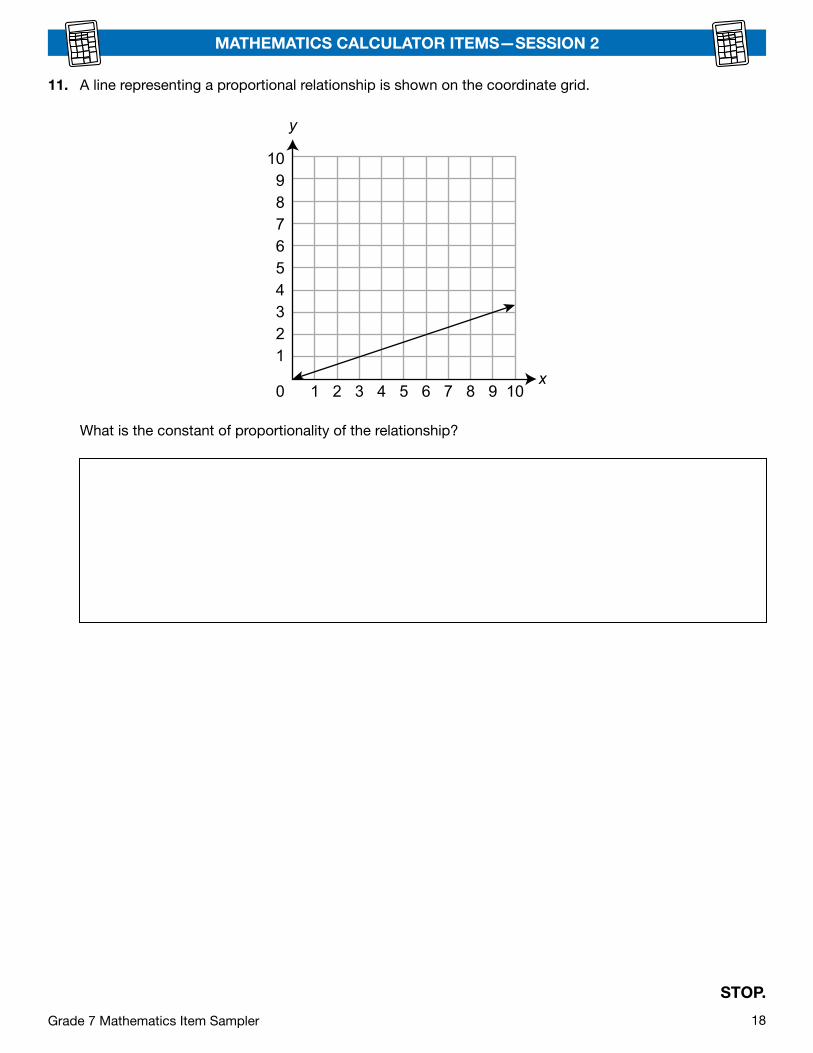
11 . A line representing a proportional relationship is shown on the coordinate grid.
10987654321
10 2 3 4 65 7 8 9 10
y
x
What is the constant of proportionality of the relationship?
19Grade 7 Mathematics Item Sampler
MATHEMATICS CALCULATOR ITEMS—SESSION 2
STOP.
Grade 7 Mathematics Item Sampler 20
MATHEMATICS—APPENDIX
SUMMARY DATA
Grade 7
Sample Number
AlignmentAnswer
KeyDepth of
KnowledgeAnnotations
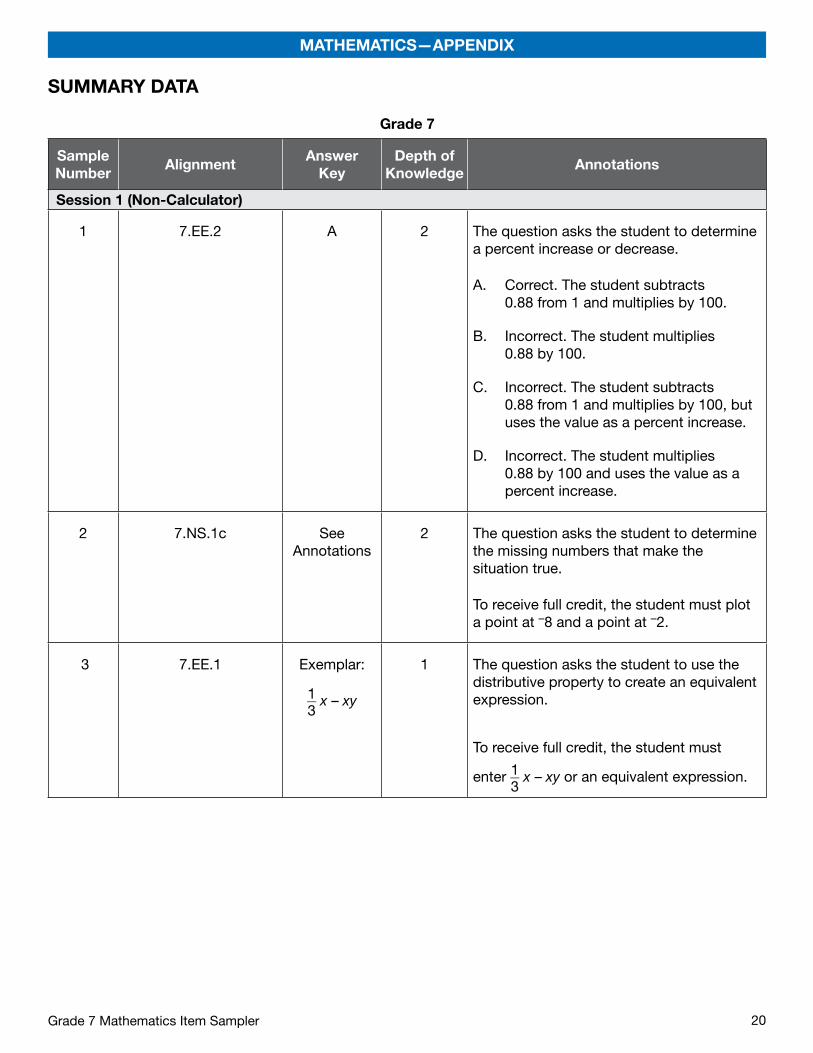
Session 1 (Non-Calculator)
1 7.EE.2 A 2 The question asks the student to determine a percent increase or decrease.
A. Correct. The student subtracts 0.88 from 1 and multiplies by 100.
B. Incorrect. The student multiplies 0.88 by 100.
C. Incorrect. The student subtracts 0.88 from 1 and multiplies by 100, but uses the value as a percent increase.
D. Incorrect. The student multiplies 0.88 by 100 and uses the value as a percent increase.
2 7.NS.1c See Annotations
2 The question asks the student to determine the missing numbers that make the situation true.
To receive full credit, the student must plot a point at –8 and a point at –2.
3 7.EE.1 Exemplar:
1 __ 3 x – xy
1 The question asks the student to use the distributive property to create an equivalent expression.
To receive full credit, the student must
enter 1 __ 3 x – xy or an equivalent expression.
21Grade 7 Mathematics Item Sampler
MATHEMATICS—APPENDIX
Grade 7
Sample Number
AlignmentAnswer
KeyDepth of
KnowledgeAnnotations
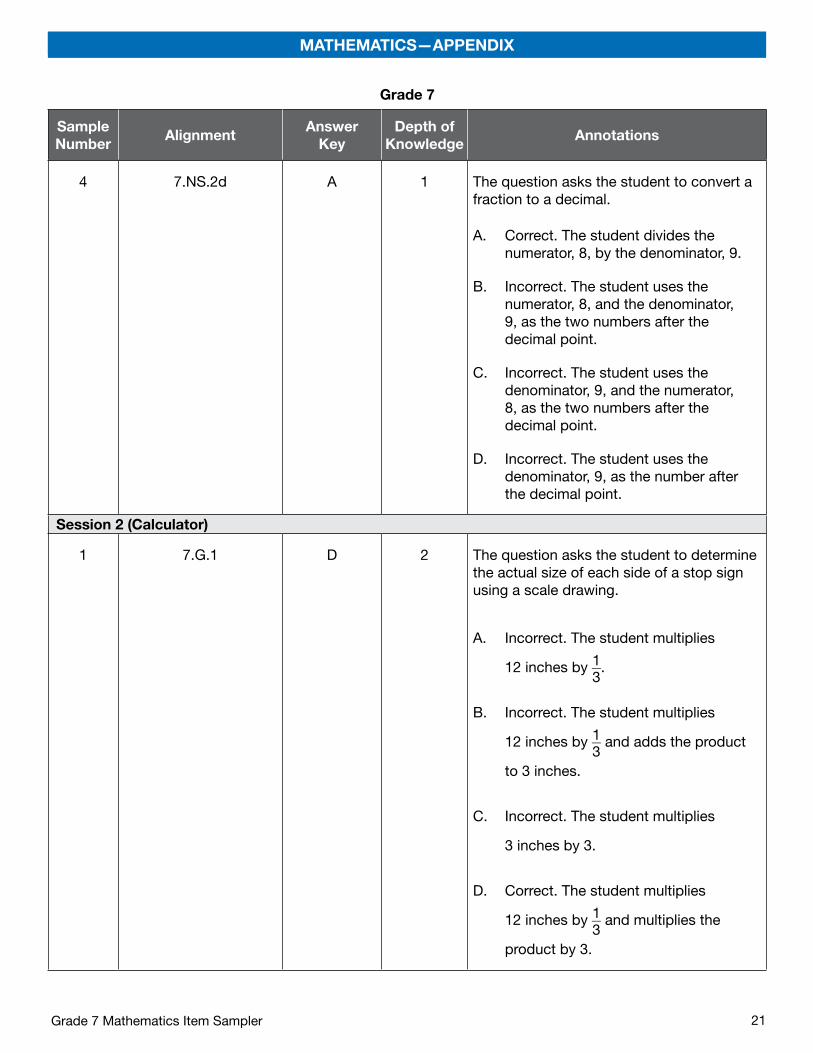
4 7.NS.2d A 1 The question asks the student to convert a fraction to a decimal.
A. Correct. The student divides the numerator, 8, by the denominator, 9.
B. Incorrect. The student uses the numerator, 8, and the denominator, 9, as the two numbers after the decimal point.
C. Incorrect. The student uses the denominator, 9, and the numerator, 8, as the two numbers after the decimal point.
D. Incorrect. The student uses the denominator, 9, as the number after the decimal point.
Session 2 (Calculator)
1 7.G.1 D 2 The question asks the student to determine the actual size of each side of a stop sign using a scale drawing.
A. Incorrect. The student multiplies
12 inches by 1 __ 3 .
B. Incorrect. The student multiplies
12 inches by 1 __ 3 and adds the product
to 3 inches.
C. Incorrect. The student multiplies
3 inches by 3.
D. Correct. The student multiplies
12 inches by 1 __ 3 and multiplies the
product by 3.

Grade 7 Mathematics Item Sampler 22
MATHEMATICS—APPENDIX
Grade 7
Sample Number
AlignmentAnswer
KeyDepth of
KnowledgeAnnotations
2 7.RP.3 D 2 The question asks the student to determine the total cost of Ana’s dinner.
A. Incorrect. The student uses the cost before adding sales tax and tip as the total cost.
B. Incorrect. The student multiplies $23.20 by 0.07 and adds the product to $23.20.
C. Incorrect. The student multiplies $23.20 by 0.18 and adds the product to $23.20.
D. Correct. The student multiplies $23.20 by 0.07 and adds the product to $23.20 to get $24.82. Then, the student multiplies $24.82 by 0.18 and adds the product to $24.84.
3 7.SP.8a Exemplar:
1 __ 4
2 The question asks the student to determine the probability of an event.
To receive full credit, the student must
enter 1 __ 4 or an equivalent value.
23Grade 7 Mathematics Item Sampler
MATHEMATICS—APPENDIX
Grade 7
Sample Number
AlignmentAnswer
KeyDepth of
KnowledgeAnnotations
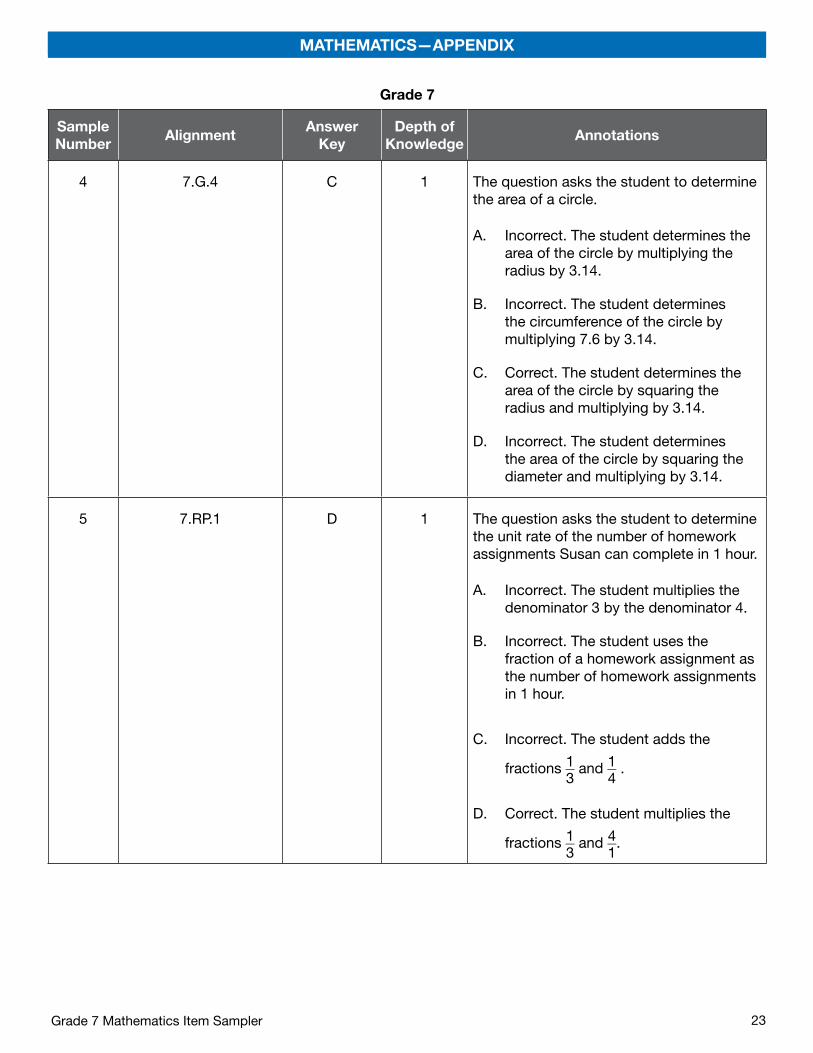
4 7.G.4 C 1 The question asks the student to determine the area of a circle.
A. Incorrect. The student determines the area of the circle by multiplying the radius by 3.14.
B. Incorrect. The student determines the circumference of the circle by multiplying 7.6 by 3.14.
C. Correct. The student determines the area of the circle by squaring the radius and multiplying by 3.14.
D. Incorrect. The student determines the area of the circle by squaring the diameter and multiplying by 3.14.
5 7.RP.1 D 1 The question asks the student to determine the unit rate of the number of homework assignments Susan can complete in 1 hour.
A. Incorrect. The student multiplies the denominator 3 by the denominator 4.
B. Incorrect. The student uses the fraction of a homework assignment as the number of homework assignments in 1 hour.
C. Incorrect. The student adds the
fractions 1 __ 3 and 1 __
4 .
D. Correct. The student multiplies the
fractions 1 __ 3 and 4 __
1 .

Grade 7 Mathematics Item Sampler 24
MATHEMATICS—APPENDIX
Grade 7
Sample Number
AlignmentAnswer
KeyDepth of
KnowledgeAnnotations
6 7.SP.4 C 3 The question asks the student to compare two line plots.
A. Incorrect. The student compares the interquartile ranges of the 7th grade fundraiser and the 8th grade fundraiser.
B. Incorrect. The student compares the interquartile ranges of the 7th grade fundraiser and the 8th grade fundraiser.
C. Correct. The student compares the measures of center between the 7th grade fundraiser and the 8th grade fundraiser.
D. Incorrect. The student reverses the comparison of the measures of center between the 7th grade fundraiser and the 8th grade fundraiser.
7 7.G.3 See Annotations
2 The question asks the student to determine the possible cross sections of a square pyramid.
To receive full credit, the student must indicate that a square and trapezoid can be the painted cross section and the triangle and non-square rectangle cannot be the painted cross section.
25Grade 7 Mathematics Item Sampler
MATHEMATICS—APPENDIX
Grade 7
Sample Number
AlignmentAnswer
KeyDepth of
KnowledgeAnnotations
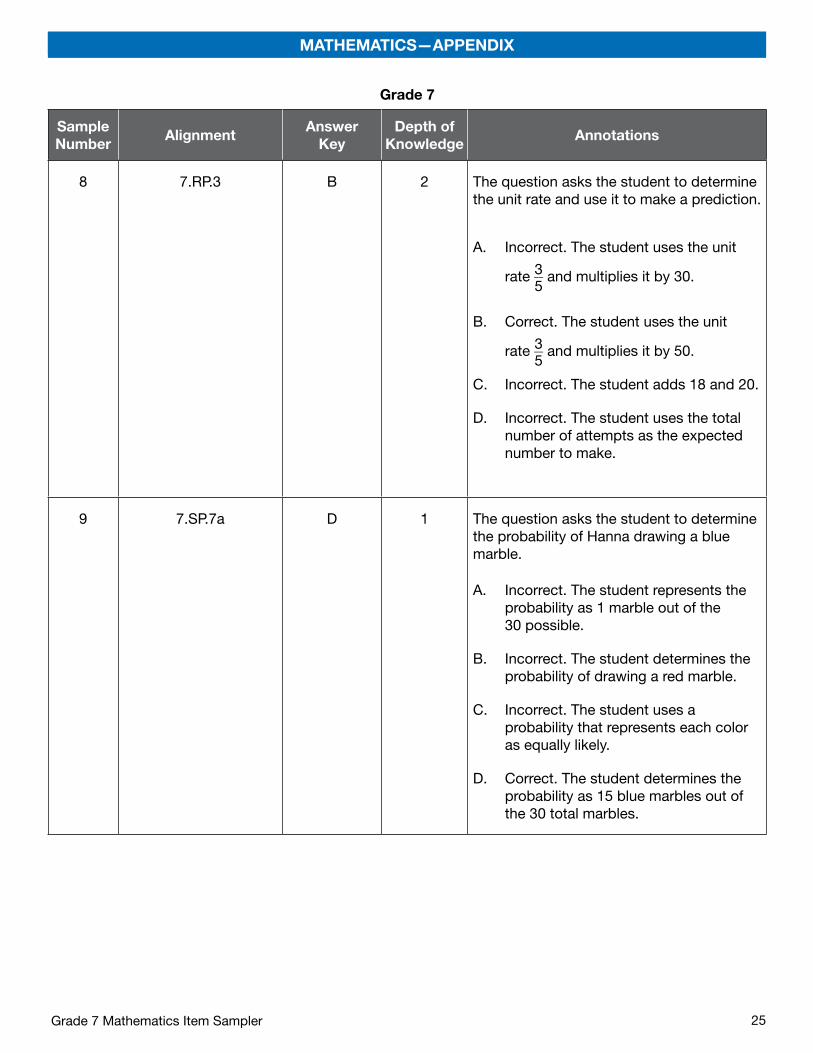
8 7.RP.3 B 2 The question asks the student to determine the unit rate and use it to make a prediction.
A. Incorrect. The student uses the unit
rate 3 __ 5 and multiplies it by 30.
B. Correct. The student uses the unit
rate 3 __ 5 and multiplies it by 50.
C. Incorrect. The student adds 18 and 20.
D. Incorrect. The student uses the total number of attempts as the expected number to make.
9 7.SP.7a D 1 The question asks the student to determine the probability of Hanna drawing a blue marble.
A. Incorrect. The student represents the probability as 1 marble out of the 30 possible.
B. Incorrect. The student determines the probability of drawing a red marble.
C. Incorrect. The student uses a probability that represents each color as equally likely.
D. Correct. The student determines the probability as 15 blue marbles out of the 30 total marbles.
Grade 7 Mathematics Item Sampler 26
MATHEMATICS—APPENDIX
Grade 7
Sample Number
AlignmentAnswer
KeyDepth of
KnowledgeAnnotations
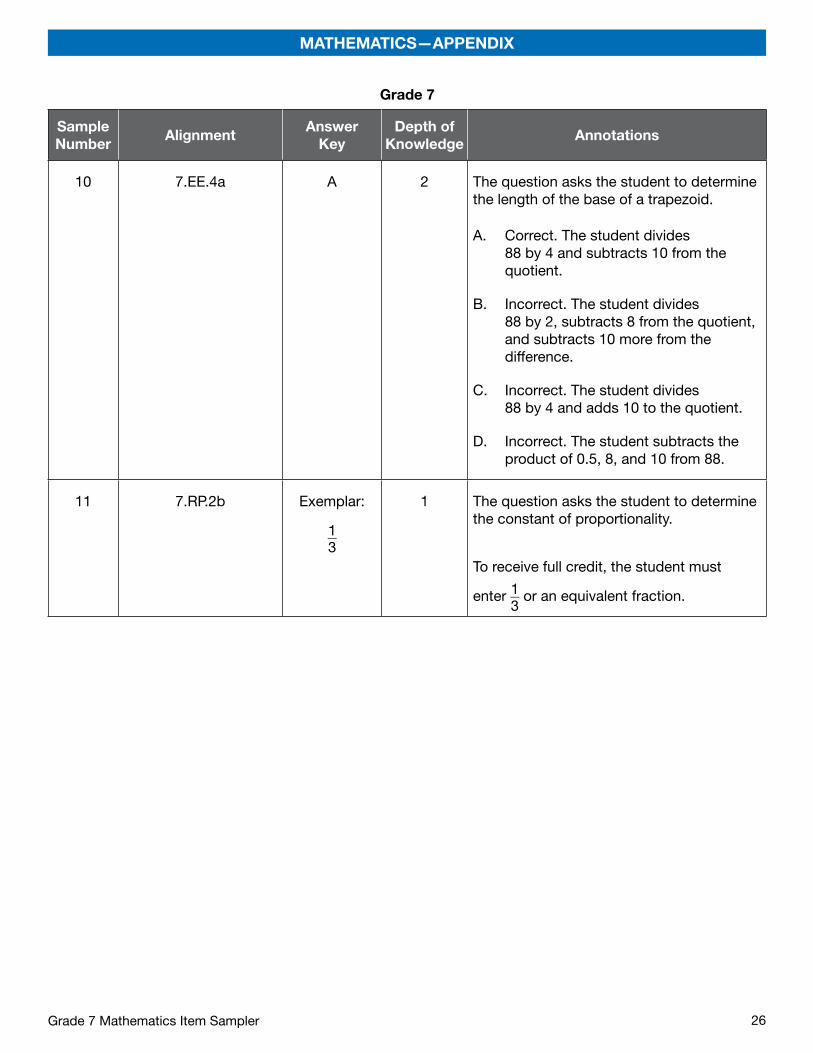
10 7.EE.4a A 2 The question asks the student to determine the length of the base of a trapezoid.
A. Correct. The student divides 88 by 4 and subtracts 10 from the quotient.
B. Incorrect. The student divides 88 by 2, subtracts 8 from the quotient, and subtracts 10 more from the difference.
C. Incorrect. The student divides 88 by 4 and adds 10 to the quotient.
D. Incorrect. The student subtracts the product of 0.5, 8, and 10 from 88.
11 7.RP.2b Exemplar:
1 __ 3
1 The question asks the student to determine the constant of proportionality.
To receive full credit, the student must
enter 1 __ 3 or an equivalent fraction.

27Grade 7 Mathematics Item Sampler
THIS PAGE IS INTENTIONALLY BLANK .

MathematicsItem Sampler
Grade 7
Copyright © 2021 by the Wisconsin Department of Public Instruction . The materials contained in this publication may be duplicated by Wisconsin educators for local classroom use . This
permission does not extend to the duplication of materials for commercial use .