Wireless Sensor Networks (WSNs) & Supervisory Control and Data Acquisition (SCADA) Meet Project...
55
Wireless Sensor Networks (WSNs) & Supervisory Control and Data Acquisition (SCADA) Meet Project Management Sterling S. Rooke, Ph.D. Candidate
-
Upload
esmond-riley -
Category
Documents
-
view
216 -
download
1
Transcript of Wireless Sensor Networks (WSNs) & Supervisory Control and Data Acquisition (SCADA) Meet Project...
Wireless Sensor Networks (WSNs) & Supervisory Control and Data Acquisition (SCADA) Meet Project Management
Sterling S. Rooke, Ph.D. Candidate

Introduction
• What is a Wireless Sensor Network– Various Topologies; Including Redundant Exchange
Wireless Links • Wireless Sensors and SCADA controls
– The internet of things• Application to Project Management
– PM domains of application– Facilities Management
• ERP Systems
– Case Study: Hydro Fracking

What is a Wireless Sensor Network?
What is a WSN?
• Wireless technology is common place– Various forms and protocols
• Most common is IEEE 802.11 (WiFi)• Zigbee 802.15.4 • Bluetooth 802.15.1

Zigbee
• Low power mesh networking• IEEE 802.15.4 Standard, based on Motorola’s
proposal• “Low power”, “Networked”, “Open standard”• Personal Operating Space (POS) of 10m radius, or
greater range; Often called a Personal Area Network (PAN)
• Mesh self-healing network
an.kaist.ac.kr/courses/2005/cs492/.../pptO9wPB7V7CA.ppt
Bluetooth
• Alternatives to cables• IEEE 802.15.1 standard (2002)• “Short range” and “Mobile products”• POS of 10m radius, with mobility• Ad-hoc connections between devices

Zigbee vs. Bluetooth

IEEE 802.11p
• By leveraging IEEE 802.11p, my research has proposed a concept called Redundant Exchange Wireless Links for data exchange between mobile facility assets
If we have time, I have a detailed discussion HERE

Comparison of Wireless Standardshttp://www.stg.com/wireless/ZigBee_comp.html
ZigBee 802.11(Wi-Fi)
Bluetooth UWB (Ultra Wide Band)
Wireless USB IR Wireless
Data Rate 20, 40, and 250 Kbits/s
11 & 54 Mbits/sec 1 Mbits/s 100-500 Mbits/s 62.5 Kbits/s 20-40 Kbits/s115 Kbits/s
4 & 16 Mbits/s
Range 10-100 meters 50-100 meters 10 meters <10 meters 10 meters <10 meters (line of sight)
Networking Topology Ad-hoc, peer to peer, star, or mesh
Point to hub Ad-hoc, very small networks
Point to point Point to point Point to point
Operating Frequency 868 MHz (Europe)900-928 MHz (NA),
2.4 GHz (worldwide)
2.4 and 5 GHz 2.4 GHz 3.1-10.6 GHz 2.4 GHz 800-900 nm
Complexity (Device and application impact)
Low High High Medium Low Low
Power Consumption (Battery option and life)
Very low (low power is a design goal)
High Medium Low Low Low
Security 128 AES plus application layer
security
64 and 128 bit encyption
Other Information Devices can join an existing network in
under 30ms
Device connection requires 3-5 seconds
Device connection requires up to 10
seconds
Typical Applications Industrial control and monitoring, sensor networks, building automation, home
control and automation, toys,
games
Wireless LAN connectivity,
broadband Internet access
Wireless connectivity between devices
such as phones, PDA, laptops, headsets
Streaming video, home entertainment
applications
PC peripheral connections
Remote controls, PC, PDA, phone, laptop
links

Network Topologies

Collaborative Wireless Sensors
11
Hydro-fracking Operations
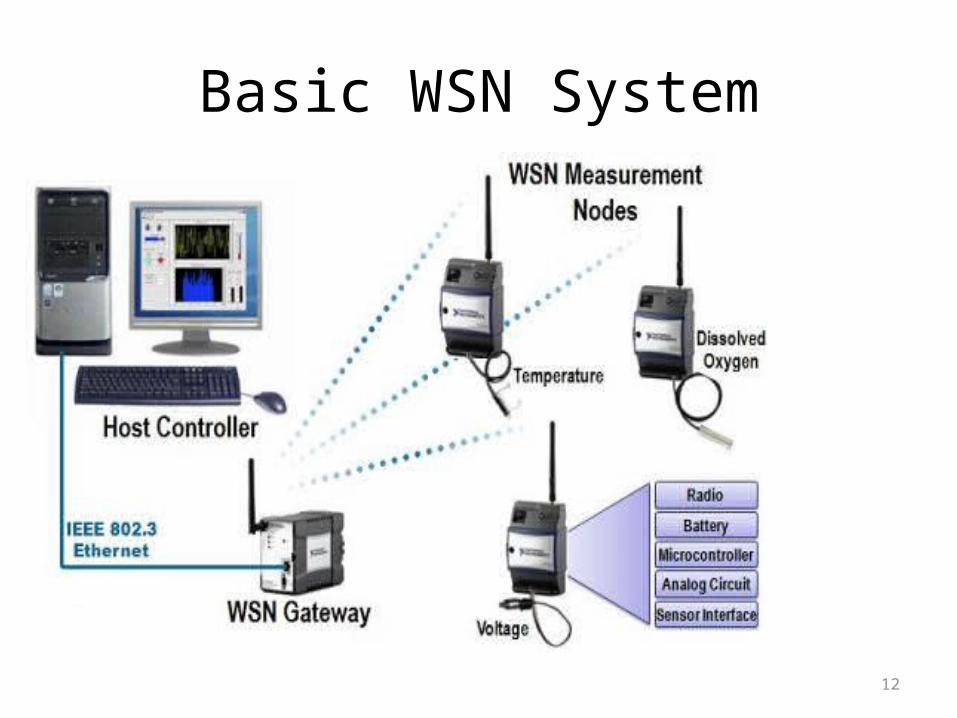
Basic WSN System
12

The Sensors
• temperature, pressure, occupancy • Really anything that can be measured that is
of value to the project• The faster this information is injected into
systems such as ERP, the quicker project adjustments can be made– (This is where wireless helps)
Wireless Sensors and SCADA controls
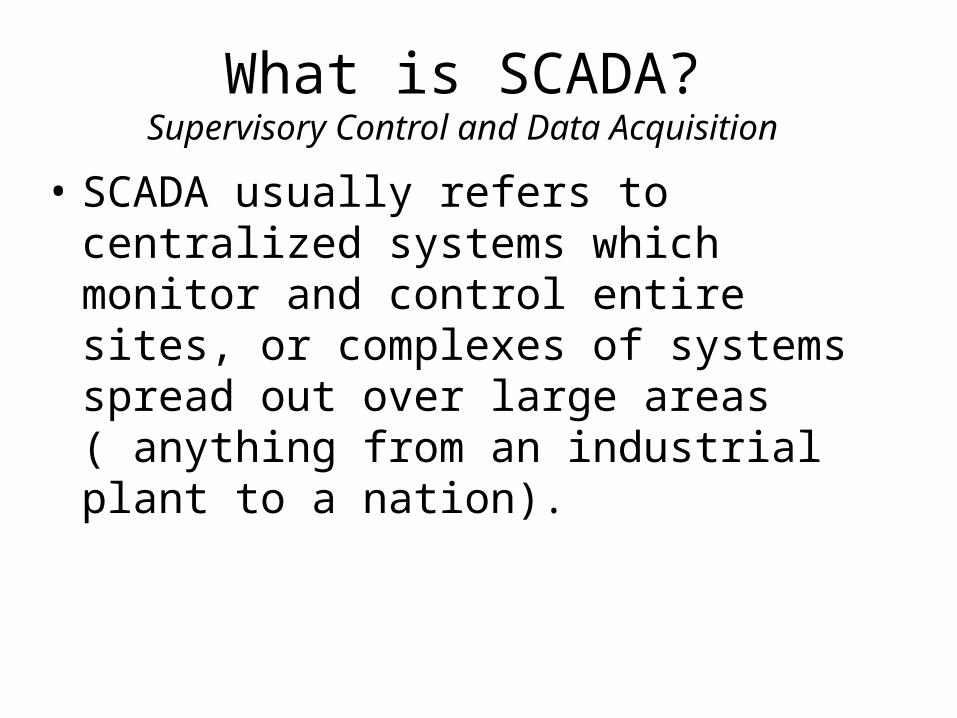
What is SCADA?Supervisory Control and Data Acquisition
• SCADA usually refers to centralized systems which monitor and control entire sites, or complexes of systems spread out over large areas ( anything from an industrial plant to a nation).
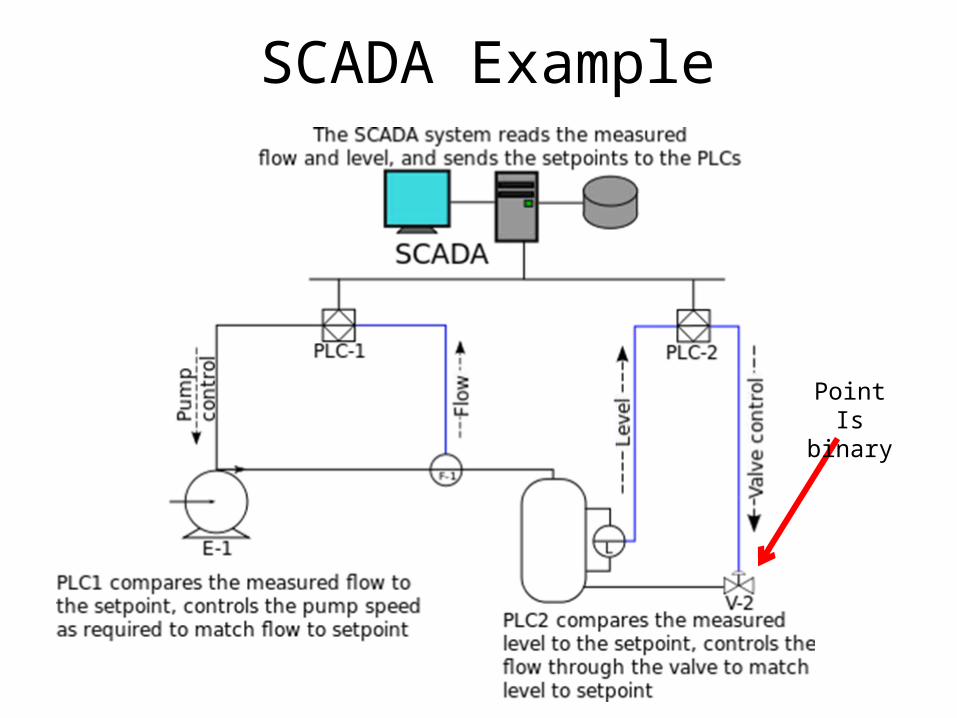
SCADA Example
PointIs binary

Wireless SCADA and the Internet of Things
• The future is total device connectivity in our everyday lives
• However, this will start where financial return is maximized
• Project management and control are critical areas that will gain productivity through the deployment of WSN and SCADA technology

Wireless SCADA and the internet of things
• This give us the ability to control and monitor almost anything in a project environment
• This gives us a dynamic tactical view of a project thus facilitating rapid strategic decisions
• There is a direct impact on PM…

Application to Project Management

ERP Systems
• Enterprise resource planning (ERP) systems integrate internal and external management information across an entire organization—embracing finance/accounting, manufacturing, sales and service, customer relationship management, etc. ERP systems automate this activity with an integrated software application. The purpose of ERP is to facilitate the flow of information between all business functions inside the boundaries of the organization and manage the connections to outside stakeholders *
• ERP systems can run on a variety of computer hardware and network configurations, typically employing a database as a repository for information *** Bidgoli, Hossein, (2004). The Internet Encyclopedia, Volume 1, John Wiley & Sons, Inc. p. 707.** Khosrow–Puor, Mehdi. (2006). Emerging Trends and Challenges in Information Technology Management. Idea Group, Inc. p. 865.

Building Control and Energy Management Systems
• Facility planners and owners can benefit greatly from fully integrated buildings and facilities. Specifically, systems integration results in a financial benefit through energy savings and efficient maintenance through instant information and intelligent planned maintenance. Most EMS and Intelligent building providers have expressed this as an operational incentive for their corporate engagement as a provider of ESPCs (Energy Service Performance Contract). In fact, the value of precise control and intelligence across a wide array of facilities is a portion of the cost multiplier effect that makes ESPCs so profitable for the vendor and by reducing system cost and ultimately saving the client form escalating energy cost while locking in a know profit for the provider. This author contends that the cyber risk should be included in ROI calculations on a facility by facility basis.
– S. Rooke 2009

WSNs & SCADA Meet PM
ERP System
WSN Facility
SCADA

PM Domains of Application for WSNs and SCADA
Adapted from PMBOK
• Planning• Execution• Monitoring and Controlling• Closing the Project• Professional and Social Responsibility
Planning
• Pre-construction or pre-development sensor measurements play directly into the planning process.– Lower cost and risk– Some project decisions are very costly or
impossible to change– Aid in site selection, cost realism calculations,
timeline refinement

Execution & Monitoring and Controlling
• During project execution having real time information can greatly enhance project success
• WSNs are a tool to gain this information• Wireless SCADA systems can make automated
changes during project execution– Commands can instantly be sent out

Closing the Project
• Business systems including ERP are constantly enriched with historical data during project execution
• Closeout will benefit greatly from a secure and verifiable feed of project information– This information can be formed to follow legal
standards for integrity should a legal action be required following project closeout

Professional and Social Responsibility
• Depending on the project, WSNs and possibly SCADA systems can remain behind after project closeout– Environmental monitoring and compliance– Long term lessons learned

Application examples (case studies)
Facilities Management&
Hydro fracking

Focus
Large Scale Multiple Entry Point FacilitiesHigh-Security Facilities Who should be in the facility and where? Should they be reassigned to enhance logistics?

Solutions
Biometric access controls and tracking General site access and specific access to systems and locations Tracking of human capital
Situational awareness of visitors and workers Directly interface with Project Status Technologies
Where are my human assets? Who should have local access? Live allocation of human resources!
Automated reallocation
Leverage asset tracking technologies
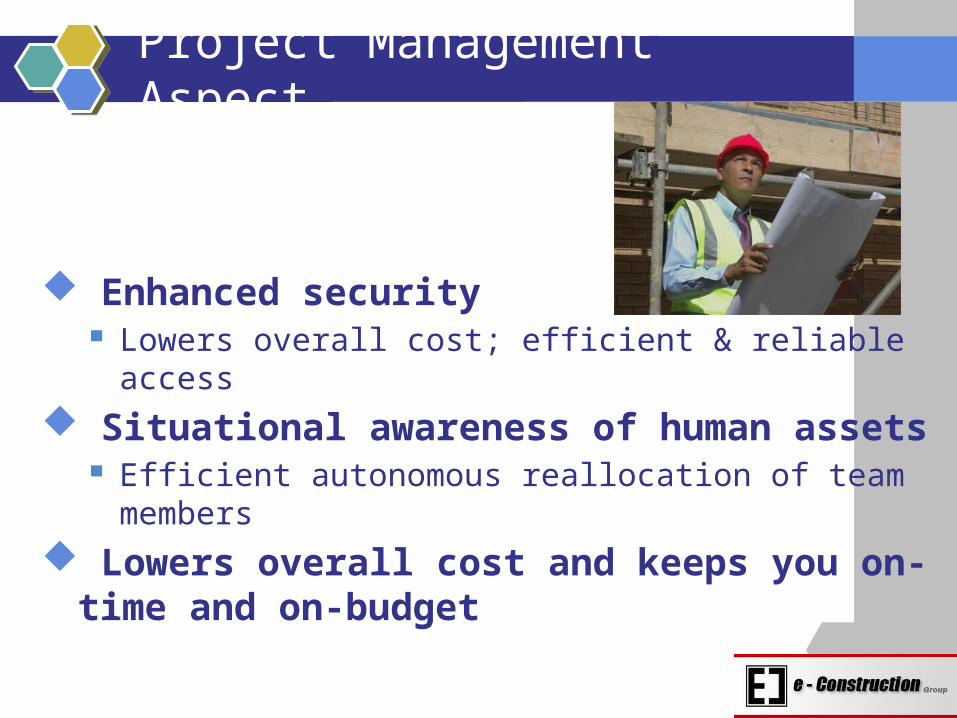
Project Management Aspect
Enhanced security Lowers overall cost; efficient & reliable access
Situational awareness of human assets Efficient autonomous reallocation of team
members Lowers overall cost and keeps you on-
time and on-budget

The Balance
Total System “Cost” Top-line cost
Bottom-line cost Contribution analysis
Added value to operations? Enhanced security Efficient human resource reallocation
Detraction analysis Added inconvenience? Maintenance and training costs Is the system more trouble then it is worth?

Collaboration
Interface with site security and human logistician experts From project concept through site operation

34
What is Hydrofracking?
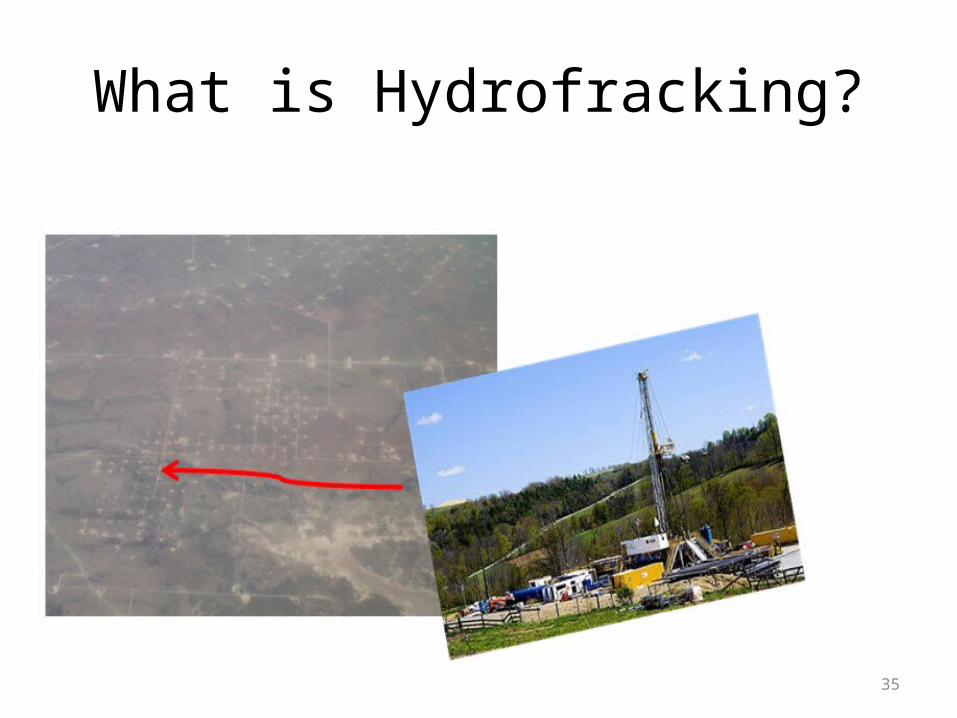
35
What is Hydrofracking?

36
What is Hydrofracking?

37
Gas intrusions? Contamination?

38
WSNs and SCADA with a Project Management Prospective
• Reduce environmental risk with real-time telemetry• Reduce insurance costs (for operations)
• Continuously prove and log field environmentals for a historical and ongoing prospective
• Answer the “They contaminated my water!” concern once and for all
• If the EPA works with the API (American Petroleum Institute) to strengthen Hydro-fracking guidelines and regulations in the future, continuous and historical sensor data will be invaluable to operations.
40
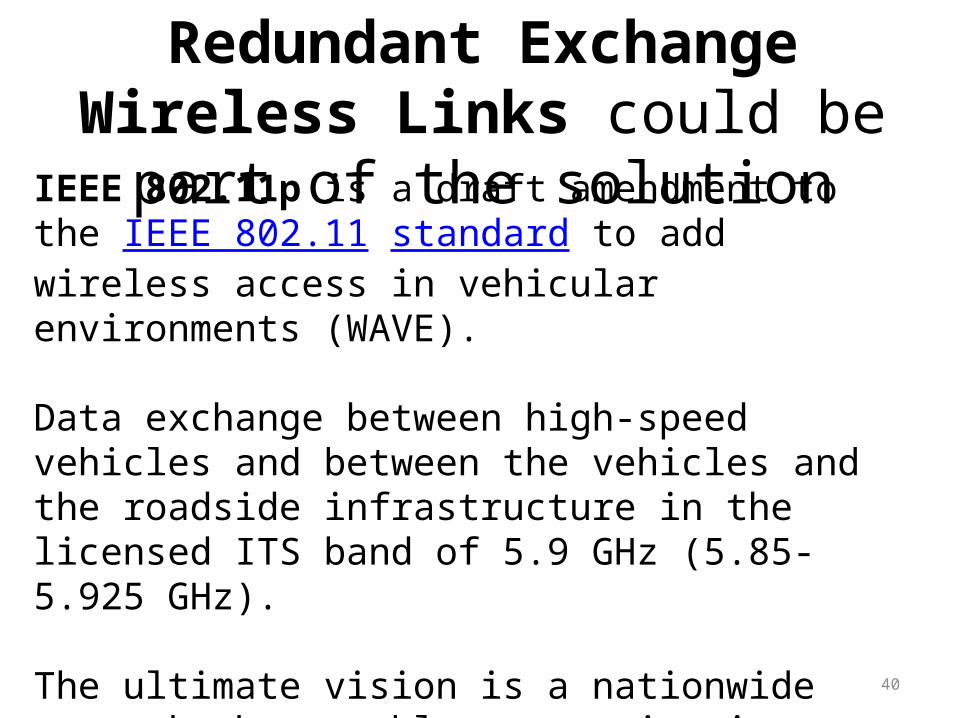
Redundant Exchange Wireless Links could be part of the solution
IEEE 802.11p is a draft amendment to the IEEE 802.11 standard to add wireless access in vehicular environments (WAVE).
Data exchange between high-speed vehicles and between the vehicles and the roadside infrastructure in the licensed ITS band of 5.9 GHz (5.85-5.925 GHz).
The ultimate vision is a nationwide network that enables communications between vehicles and roadside access points or other vehicles.

Emissions Trading – Transportation Redundant Exchange Wireless Links
41© 2009 Sterling S. Rooke
A
B
A,B
C
+B
+A
+C
+A,B

42
Emissions Trading – Transportation Redundant Exchange Wireless Links
© 2009 Sterling S. Rooke
A,B,C
A,B,C
TR,CMDs
TR,CMDs
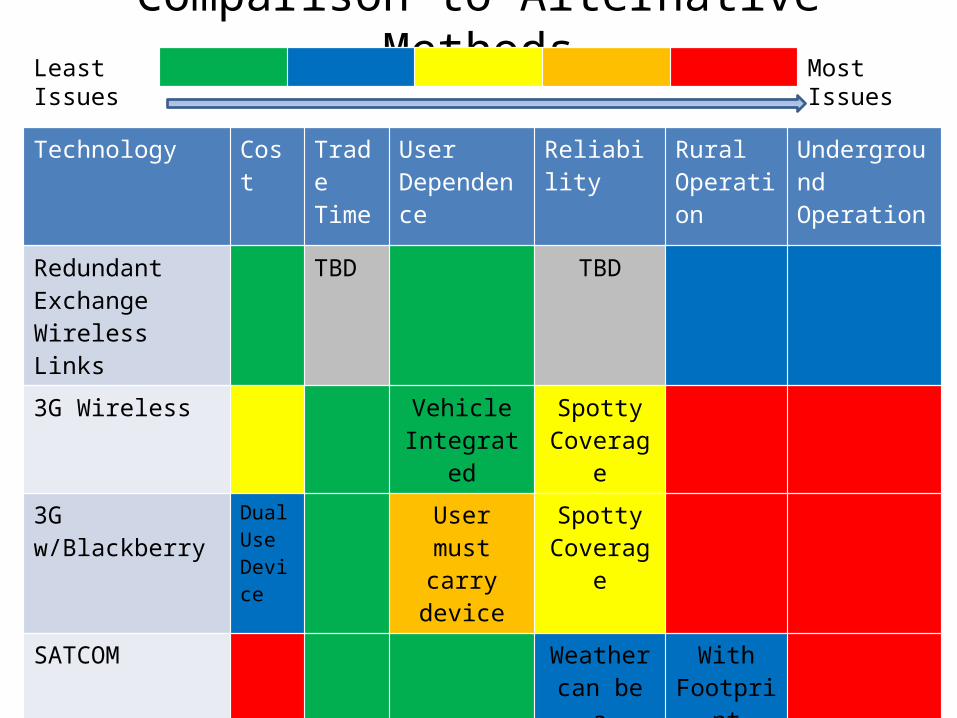
Comparison to Alternative Methods
© 2009 Sterling S. Rooke 43
Technology Cost Trade Time
User Dependence
Reliability Rural Operation
Underground Operation
Redundant Exchange Wireless Links
TBD TBD
3G Wireless Vehicle Integrated
Spotty Coverage
3G w/Blackberry Dual Use Device
User must carry device
Spotty Coverage
SATCOM Weather can be a
factor
With Footprint
Least Issues Most Issues
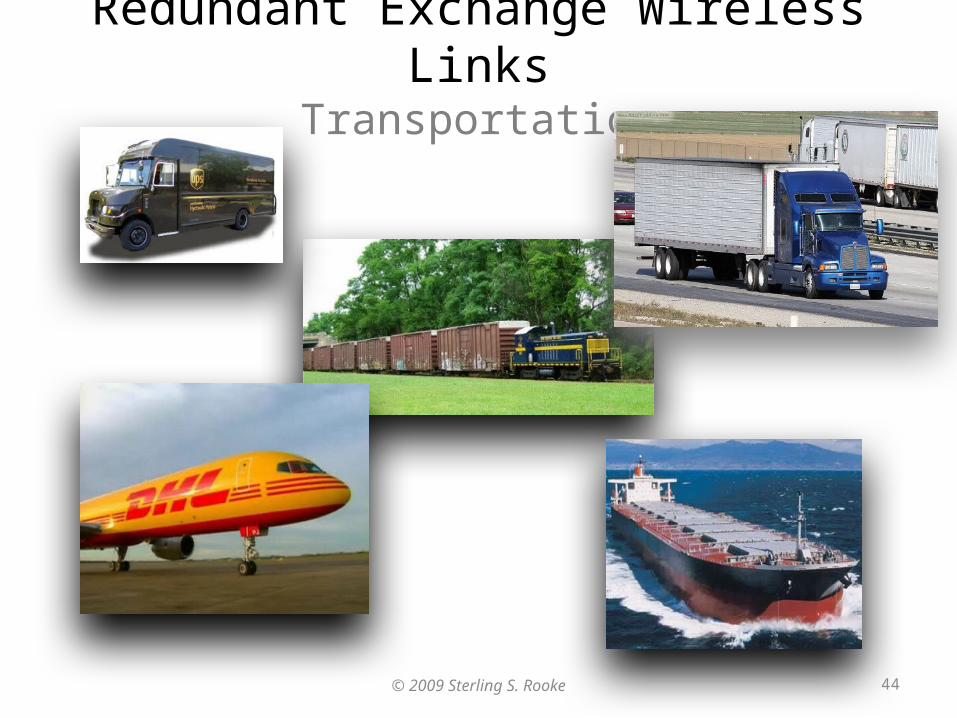
Redundant Exchange Wireless LinksTransportation
44© 2009 Sterling S. Rooke

Redundant Exchange Wireless LinksConstruction / Job Site
4545© 2009 Sterling S. Rooke

Redundant Exchange Wireless Links
46
Construction, Industrial,
Mining
Long Haul Transportation
Short Haul Transpiration Farming
© 2009 Sterling S. Rooke

MODSIM
© 2009 Sterling S. Rooke 47

Modeling and Simulation
48
• Utilize MATLAB• Introduce a notion of traffic, delivery density
and starting point• Consider wireless link budget and
performance• Actually simulate the passing of “Sandbox”
data• Consider distribution and location of
Government supported wireless internet access points.
• SCALABILITY? © 2009 Sterling S. Rooke

Data Needed for Model
© 2009 Sterling S. Rooke 49
• Wireless Link Budget
• Packet vs. Payload metrics
• Burden of encryption and security on throughput
• Amount of Hydrocarbons used by various vehicles
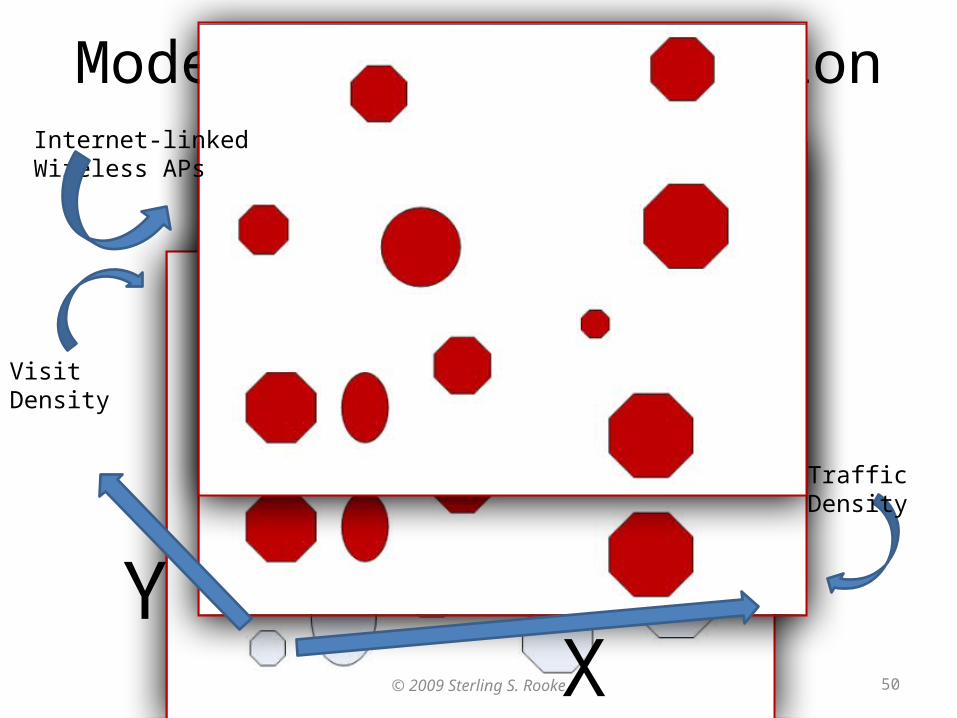
YX
Visit Density
Traffic Density
Modeling and SimulationInternet-linked Wireless APs
50© 2009 Sterling S. Rooke
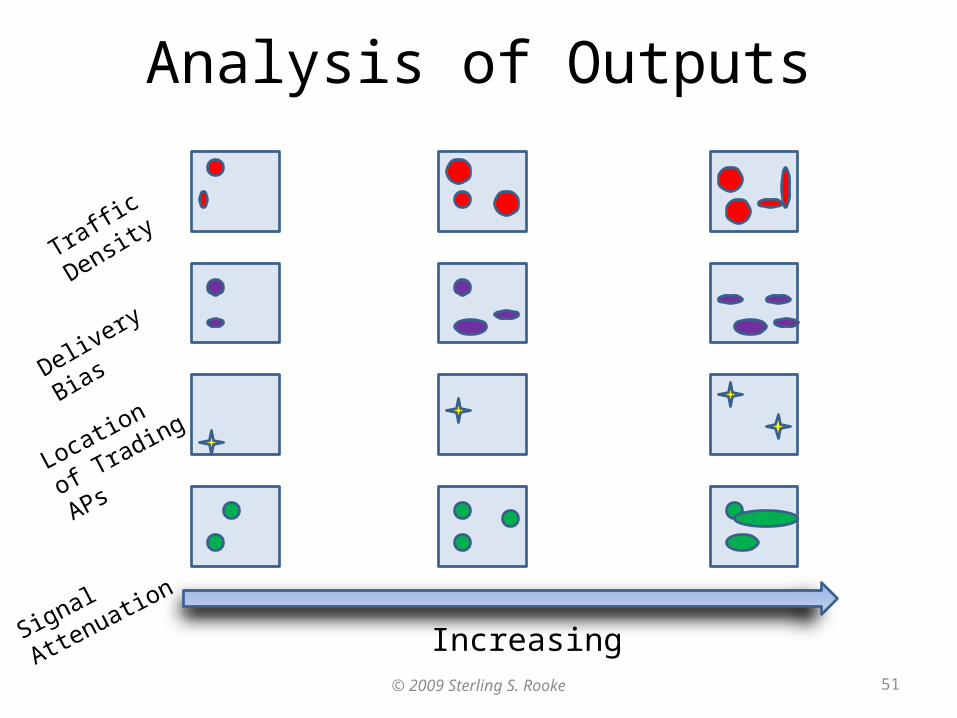
Analysis of Outputs
© 2009 Sterling S. Rooke 51
Delivery Bias
Traffic Density
Signal Attenuation
Location of
Trading APs
Increasing

What will the model tell us?
• Average emission time-to-register with emissions trading authority
• Relationship between participating vehicles, land area and DOT-EPA approved “internet access points”
• How do “slow traffic” areas affect this?• What about urban areas with more delivery
points or heavy traffic?• Are Redundant Exchange Wireless Links feasible?
52© 2009 Sterling S. Rooke

Introduction of RF into the Model
53© 2009 Sterling S. Rooke

How much data can we Tx/Rx?Two trucks closing at highway speeds
• 65MPH is about 29 Meters/sec• I will assume a maximum range of 1Km at highway
speeds per ASTM E2213-03 (IEEE 802.11p) at 5.9GHz• If we assume a broadside omni directional antenna
and equal Tx and Rx gain than the data exchange time will simply be 34 seconds(1000 meters) / (29 meters/sec) = 34 seconds
• My industry and protocol survey will reveal other factors such as: discovery/hand-shake time, security and packet overhead
• 34 seconds is a lot of time!54© 2009 Sterling S. Rooke

RF Assumptions
• I will not include the effects of multi-path• I will include a notional affect of urban
attenuation and loss.• I hope to include atmospheric attenuation in
my model• Select a reasonable data Tx / Rx rate based on
a COTS survey• Assume Separate Tx and Rx channels
55© 2009 Sterling S. Rooke

Consideration of Link Budget
• We must make some link budget assumptions– RF Power coupled to antenna– Antenna type
• Actual Tx RF power (consideration of gain)• Rx antenna gain
– Beam shape
– Acceptable BER for a selected protocol
56© 2009 Sterling S. Rooke