
Wireless pH Sensor Transmitter (DevPack for SensorTag ...
28
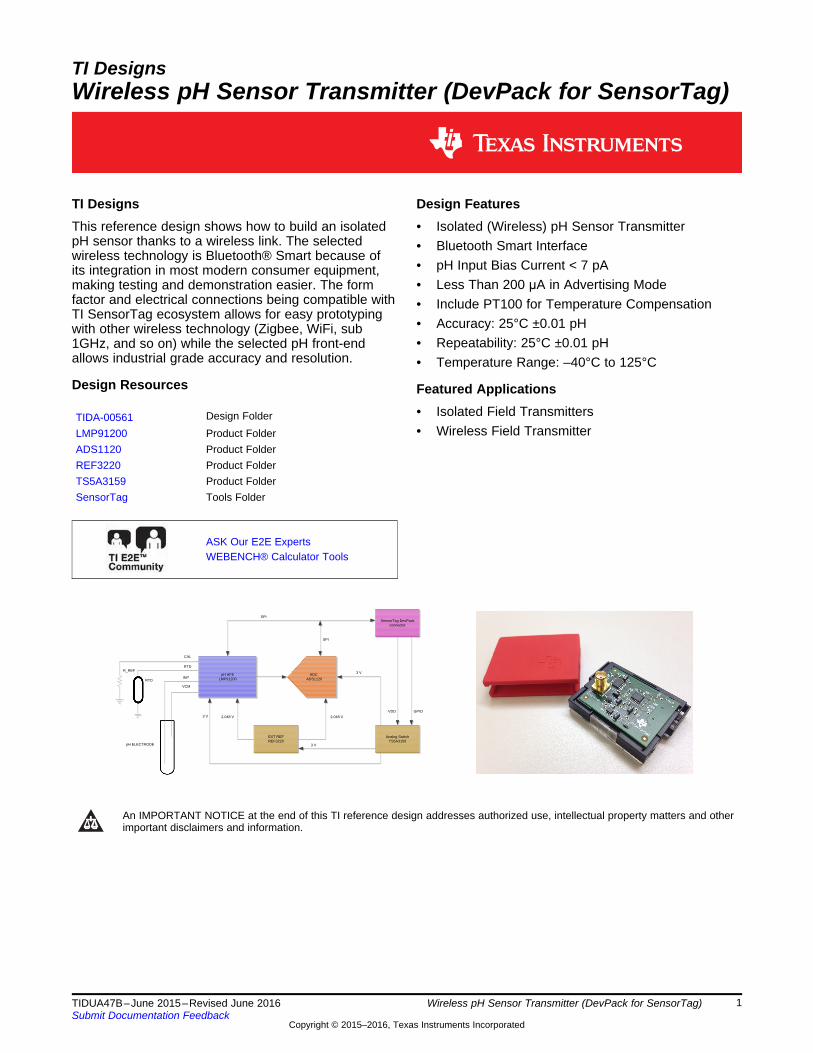
INP VCM EXT REF REF3220 2.048 V 2.048 V ADC ADS1120 Analog Switch TS5A3159 SensorTag DevPack connector pH AFE LMP91200 GPIO VDD SPI SPI 3 V 3 V 3 V pH ELECTRODE RTD R_REF CAL RTD 1 TIDUA47B – June 2015 – Revised June 2016 Submit Documentation Feedback Copyright © 2015–2016, Texas Instruments Incorporated Wireless pH Sensor Transmitter (DevPack for SensorTag) TI Designs Wireless pH Sensor Transmitter (DevPack for SensorTag) TI Designs This reference design shows how to build an isolated pH sensor thanks to a wireless link. The selected wireless technology is Bluetooth® Smart because of its integration in most modern consumer equipment, making testing and demonstration easier. The form factor and electrical connections being compatible with TI SensorTag ecosystem allows for easy prototyping with other wireless technology (Zigbee, WiFi, sub 1GHz, and so on) while the selected pH front-end allows industrial grade accuracy and resolution. Design Resources TIDA-00561 Design Folder LMP91200 Product Folder ADS1120 Product Folder REF3220 Product Folder TS5A3159 Product Folder SensorTag Tools Folder ASK Our E2E Experts WEBENCH® Calculator Tools Design Features • Isolated (Wireless) pH Sensor Transmitter • Bluetooth Smart Interface • pH Input Bias Current < 7 pA • Less Than 200 μA in Advertising Mode • Include PT100 for Temperature Compensation • Accuracy: 25°C ±0.01 pH • Repeatability: 25°C ±0.01 pH • Temperature Range: –40°C to 125°C Featured Applications • Isolated Field Transmitters • Wireless Field Transmitter An IMPORTANT NOTICE at the end of this TI reference design addresses authorized use, intellectual property matters and other important disclaimers and information.
Transcript of Wireless pH Sensor Transmitter (DevPack for SensorTag ...
INP
VCM
EXT REFREF3220
2.048 V 2.048 V
ADC ADS1120
Analog SwitchTS5A3159
SensorTag DevPack connector
pH AFELMP91200
GPIOVDD
SPI
SPI
3 V
3 V
3 VpH ELECTRODE
RTD
R_REF
CAL
RTD
1TIDUA47B–June 2015–Revised June 2016Submit Documentation Feedback
Copyright © 2015–2016, Texas Instruments Incorporated
Wireless pH Sensor Transmitter (DevPack for SensorTag)
TI DesignsWireless pH Sensor Transmitter (DevPack for SensorTag)
TI DesignsThis reference design shows how to build an isolatedpH sensor thanks to a wireless link. The selectedwireless technology is Bluetooth® Smart because ofits integration in most modern consumer equipment,making testing and demonstration easier. The formfactor and electrical connections being compatible withTI SensorTag ecosystem allows for easy prototypingwith other wireless technology (Zigbee, WiFi, sub1GHz, and so on) while the selected pH front-endallows industrial grade accuracy and resolution.
Design Resources
TIDA-00561 Design FolderLMP91200 Product FolderADS1120 Product FolderREF3220 Product FolderTS5A3159 Product FolderSensorTag Tools Folder
ASK Our E2E ExpertsWEBENCH® Calculator Tools
Design Features• Isolated (Wireless) pH Sensor Transmitter• Bluetooth Smart Interface• pH Input Bias Current < 7 pA• Less Than 200 μA in Advertising Mode• Include PT100 for Temperature Compensation• Accuracy: 25°C ±0.01 pH• Repeatability: 25°C ±0.01 pH• Temperature Range: –40°C to 125°C
Featured Applications• Isolated Field Transmitters• Wireless Field Transmitter
An IMPORTANT NOTICE at the end of this TI reference design addresses authorized use, intellectual property matters and otherimportant disclaimers and information.
System Overview www.ti.com
2 TIDUA47B–June 2015–Revised June 2016Submit Documentation Feedback
Copyright © 2015–2016, Texas Instruments Incorporated
Wireless pH Sensor Transmitter (DevPack for SensorTag)
1 System Overview
1.1 System IntroductionpH measurement is a generic area of measurement that spans from process control (the shift in pH canbe an indication of a process drift) to recycling plants as well as in non-industrial areas. pH measurementcould also be mentioned in test and measurement equipment for laboratories, home automationequipment like swimming pool monitoring, grid infrastructure monitoring like drinking water qualitymonitoring, and so on.
This reference design targets especially the needs of process control application with high accuracy,temperature compensation, and electrical isolation between the PLC/DCS/PAC and the sensing elementitself.
The system described in this TI Design aims at solving the following challenges:
Table 1. TIDA-00561 Industry Solutions
INDUSTRY CHALLENGE TIDA-00561 SOLUTIONGround loop potential differences Ground loop isolation through wireless communication
Wireless communication standard fragmentation Bluetooth Smart interface compatible with majority of portableelectronics
pH probe high impedance Analog front-end with <7-pA input bias current
pH sensing sensitive to ambient noise Triax probes (with shield around signal lines) supported by thehardware
1.2 Key System SpecificationTable 2 only specifies the performances of pH sensor board and temperature restrictions specific to theSensorTag applied when used in the full system.
Table 2. Key Systems Specification
PARAMETER SPECIFICATION VALUE DETAILSInput bias current 85°C < 6.5 pA See Section 3.1.4Accuracy < 0.02 pH See Section 4.2 and Section 6
Temperature range TA –40°C to 125°C
See Section 3.1.4,See Section 3.1.5,See Section 3.1.6,See Section 3.1.7
2Pt H buffer S, Cl AgCl Ag-
H HH 0
mpH lga lg
m
gæ ö= - = - ç ÷ç ÷
è ø
www.ti.com Theory of Operation
3TIDUA47B–June 2015–Revised June 2016Submit Documentation Feedback
Copyright © 2015–2016, Texas Instruments Incorporated
Wireless pH Sensor Transmitter (DevPack for SensorTag)
2 Theory of OperationThis section is intended as a general introduction to the topic of pH measurement, starting from theinternational standard definition of pH and helping the reader to understand the design decisions made insubsequent sections.
2.1 pHThis section covers the definition of pH, how pH is measured from both a chemical standpoint andelectronic standpoint, what accuracies can be reached, and under which conditions.
2.1.1 pH DefinitionThe concept of pH is unique among the commonly encountered physicochemical quantities in that itsdefinition is:
(1)
where• aH is the relative (molality basis) activity• yH is the molal activity coefficient of the hydrogen ion H+ at the molality mH
• m0 is the standard molality
pH involves a single ion activity (the hydrogen ion), which by definition is a purely theoretical definition andcannot be measured by any valid method. [1]
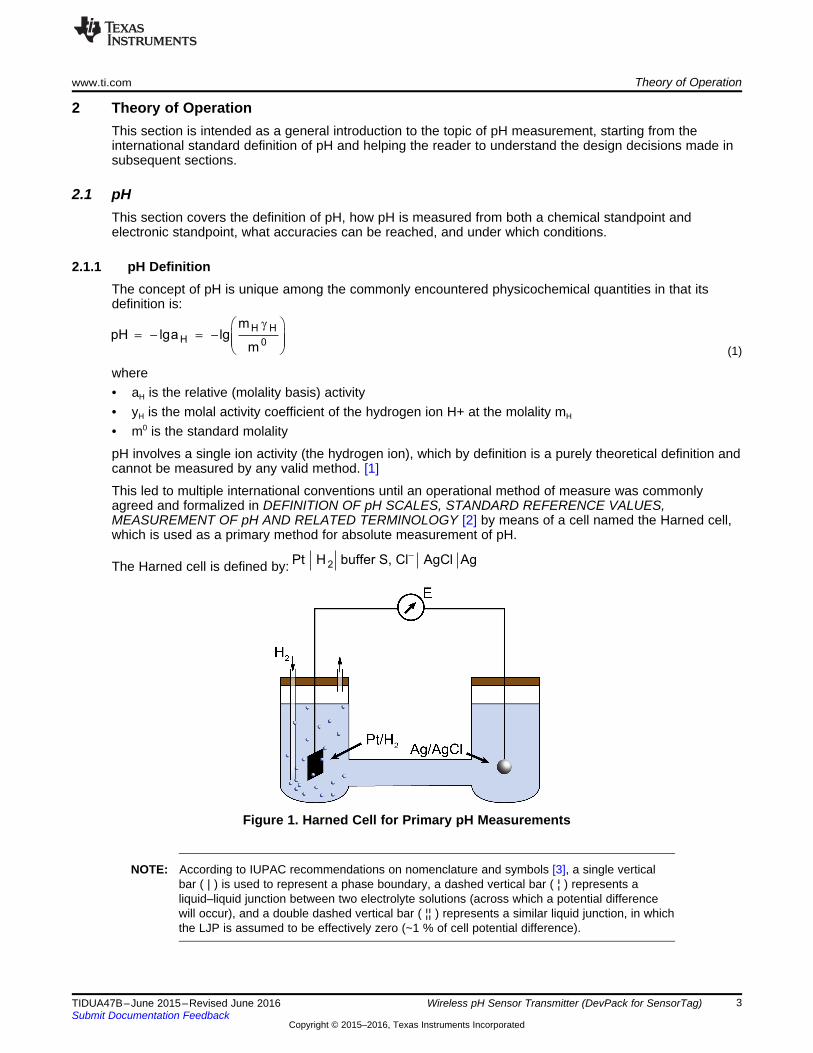
This led to multiple international conventions until an operational method of measure was commonlyagreed and formalized in DEFINITION OF pH SCALES, STANDARD REFERENCE VALUES,MEASUREMENT OF pH AND RELATED TERMINOLOGY [2] by means of a cell named the Harned cell,which is used as a primary method for absolute measurement of pH.
The Harned cell is defined by:
Figure 1. Harned Cell for Primary pH Measurements
NOTE: According to IUPAC recommendations on nomenclature and symbols [3], a single verticalbar ( | ) is used to represent a phase boundary, a dashed vertical bar ( ¦ ) represents aliquid–liquid junction between two electrolyte solutions (across which a potential differencewill occur), and a double dashed vertical bar ( ¦¦ ) represents a similar liquid junction, in whichthe LJP is assumed to be effectively zero (~1 % of cell potential difference).
Theory of Operation www.ti.com
4 TIDUA47B–June 2015–Revised June 2016Submit Documentation Feedback
Copyright © 2015–2016, Texas Instruments Incorporated
Wireless pH Sensor Transmitter (DevPack for SensorTag)
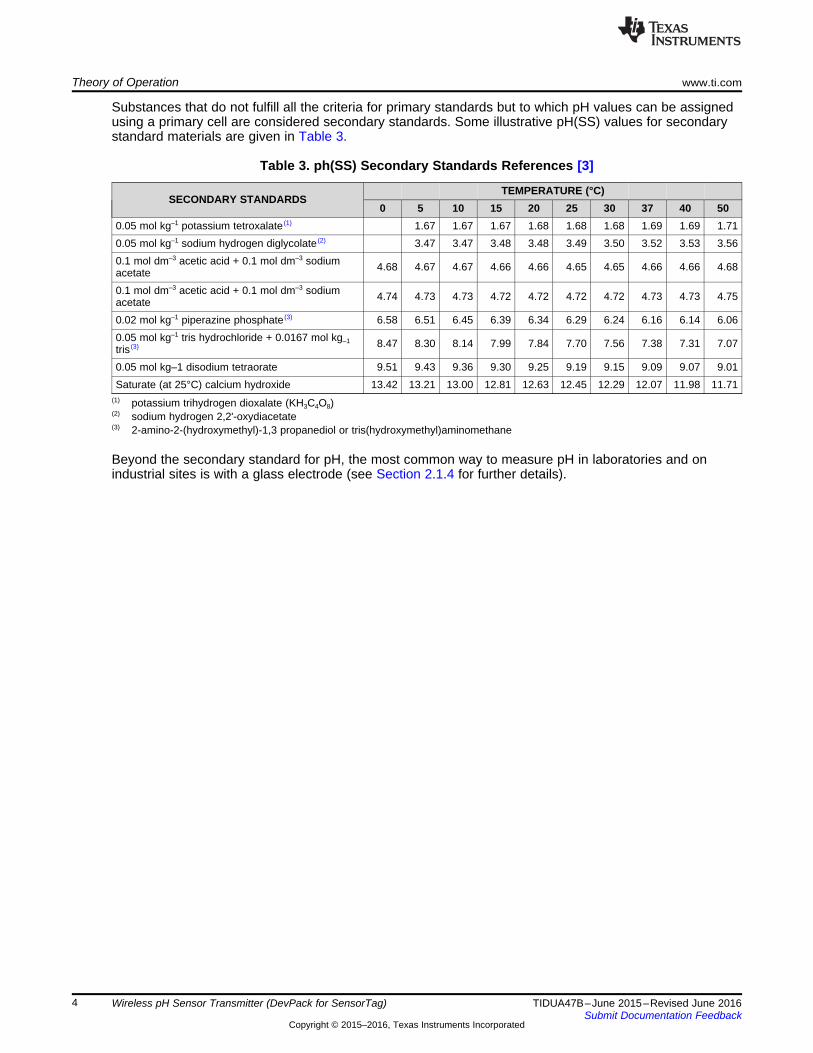
Substances that do not fulfill all the criteria for primary standards but to which pH values can be assignedusing a primary cell are considered secondary standards. Some illustrative pH(SS) values for secondarystandard materials are given in Table 3.
(1) potassium trihydrogen dioxalate (KH3C4O8)(2) sodium hydrogen 2,2'-oxydiacetate(3) 2-amino-2-(hydroxymethyl)-1,3 propanediol or tris(hydroxymethyl)aminomethane
Table 3. ph(SS) Secondary Standards References [3]
SECONDARY STANDARDSTEMPERATURE (°C)
0 5 10 15 20 25 30 37 40 500.05 mol kg–1 potassium tetroxalate (1) 1.67 1.67 1.67 1.68 1.68 1.68 1.69 1.69 1.710.05 mol kg–1 sodium hydrogen diglycolate (2) 3.47 3.47 3.48 3.48 3.49 3.50 3.52 3.53 3.560.1 mol dm–3 acetic acid + 0.1 mol dm–3 sodiumacetate 4.68 4.67 4.67 4.66 4.66 4.65 4.65 4.66 4.66 4.68
0.1 mol dm–3 acetic acid + 0.1 mol dm–3 sodiumacetate 4.74 4.73 4.73 4.72 4.72 4.72 4.72 4.73 4.73 4.75
0.02 mol kg–1 piperazine phosphate (3) 6.58 6.51 6.45 6.39 6.34 6.29 6.24 6.16 6.14 6.060.05 mol kg–1 tris hydrochloride + 0.0167 mol kg–1tris (3) 8.47 8.30 8.14 7.99 7.84 7.70 7.56 7.38 7.31 7.07
0.05 mol kg–1 disodium tetraorate 9.51 9.43 9.36 9.30 9.25 9.19 9.15 9.09 9.07 9.01Saturate (at 25°C) calcium hydroxide 13.42 13.21 13.00 12.81 12.63 12.45 12.29 12.07 11.98 11.71
Beyond the secondary standard for pH, the most common way to measure pH in laboratories and onindustrial sites is with a glass electrode (see Section 2.1.4 for further details).
0 1 2 3 4 5 6 7 8 9 10 11 12 13 14
pH scale
pH scale
0 1 2 3 4 5 6 7 8 9 10 11 12 13 14
increasing acidity
increasing acidity
increasing basicity
increasing basicity
15−1
A
B
www.ti.com Theory of Operation
5TIDUA47B–June 2015–Revised June 2016Submit Documentation Feedback
Copyright © 2015–2016, Texas Instruments Incorporated
Wireless pH Sensor Transmitter (DevPack for SensorTag)
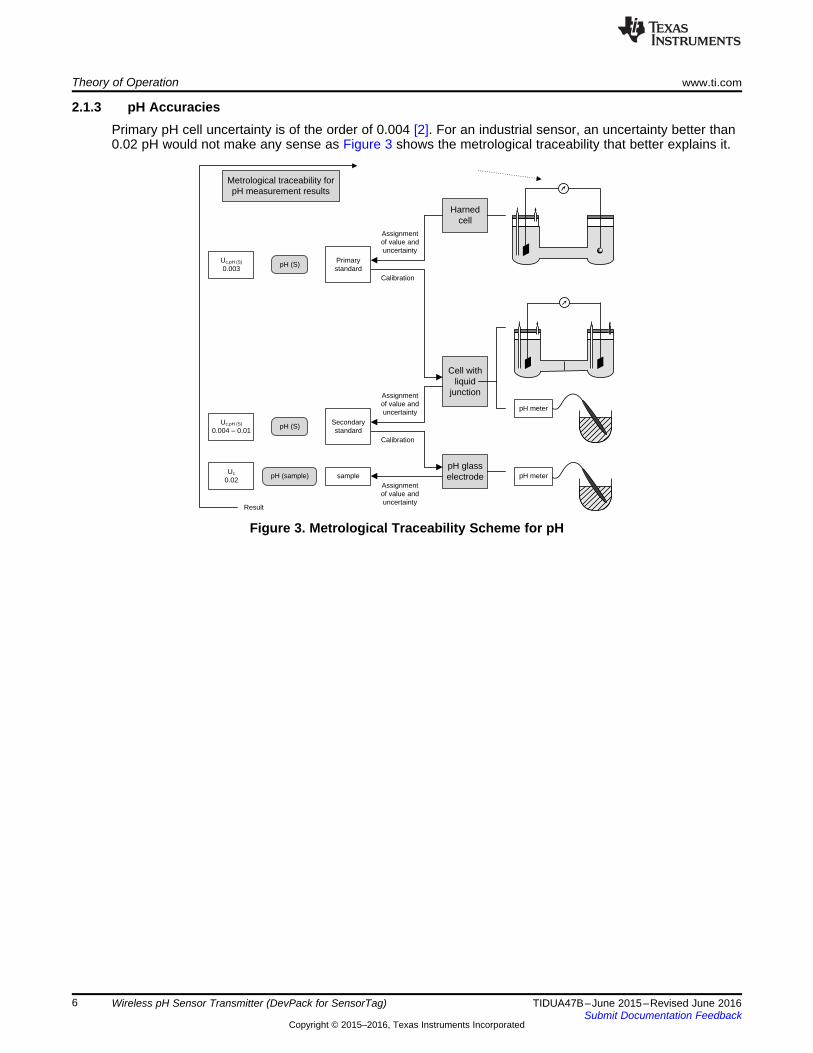
2.1.2 pH ScaleDespite the relatively common misconception, the pH value scale is not limited to 0 through 14. NegativepH values can be found in nature (for example, in extremely acidic mine waters) [3].
The reason for this misconception beyond the broad set of textbooks propagating this notion is alsorelated to lack of suitable buffer standards for pH < 1 and experimental challenges. A proposed pH scalerepresentation adopted for this design guide is given by Figure 2:
Figure 2. Two pH Scales: A) Typical Textbook Diagram,B) More Generic Diagram Showing an Open-Ended Scale
On a practical aspect, a literature review yields the following practical examples:• Hot springs near Ebeko volcano have estimated pH values as low as –1.7 [5] [6].• Waters from the Richmond Mine at Iron Mountain, CA have pH = –3.6 [9].• Industrial products with pH ranges –2 to 16 [10]• Other industrial mentioning that "solutions containing non-water solvents can have pH value outside
the [0 to 14] range" [11]
pH meter
pH meter
Harned cell
Cell with liquid
junction
pH glass electrode
Assignment of value and uncertainty
Calibration
Assignment of value and uncertainty
Calibration
Assignment of value and uncertainty
Primary standard
Secondary standard
sample
pH (S)
pH (S)
pH (sample)
Uc,pH (S)
0.003
Uc,pH (S)
0.004 ± 0.01
Uc
0.02
Metrological traceability for pH measurement results
Result
Theory of Operation www.ti.com
6 TIDUA47B–June 2015–Revised June 2016Submit Documentation Feedback
Copyright © 2015–2016, Texas Instruments Incorporated
Wireless pH Sensor Transmitter (DevPack for SensorTag)
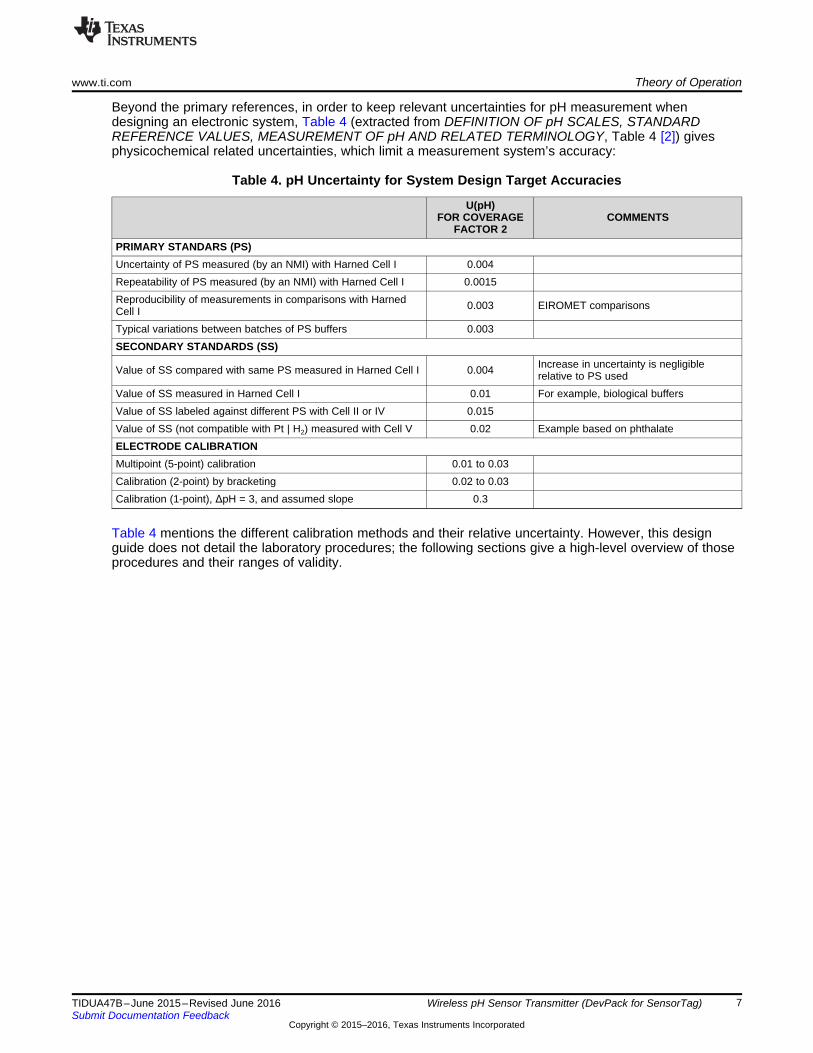
2.1.3 pH AccuraciesPrimary pH cell uncertainty is of the order of 0.004 [2]. For an industrial sensor, an uncertainty better than0.02 pH would not make any sense as Figure 3 shows the metrological traceability that better explains it.
Figure 3. Metrological Traceability Scheme for pH
www.ti.com Theory of Operation
7TIDUA47B–June 2015–Revised June 2016Submit Documentation Feedback
Copyright © 2015–2016, Texas Instruments Incorporated
Wireless pH Sensor Transmitter (DevPack for SensorTag)
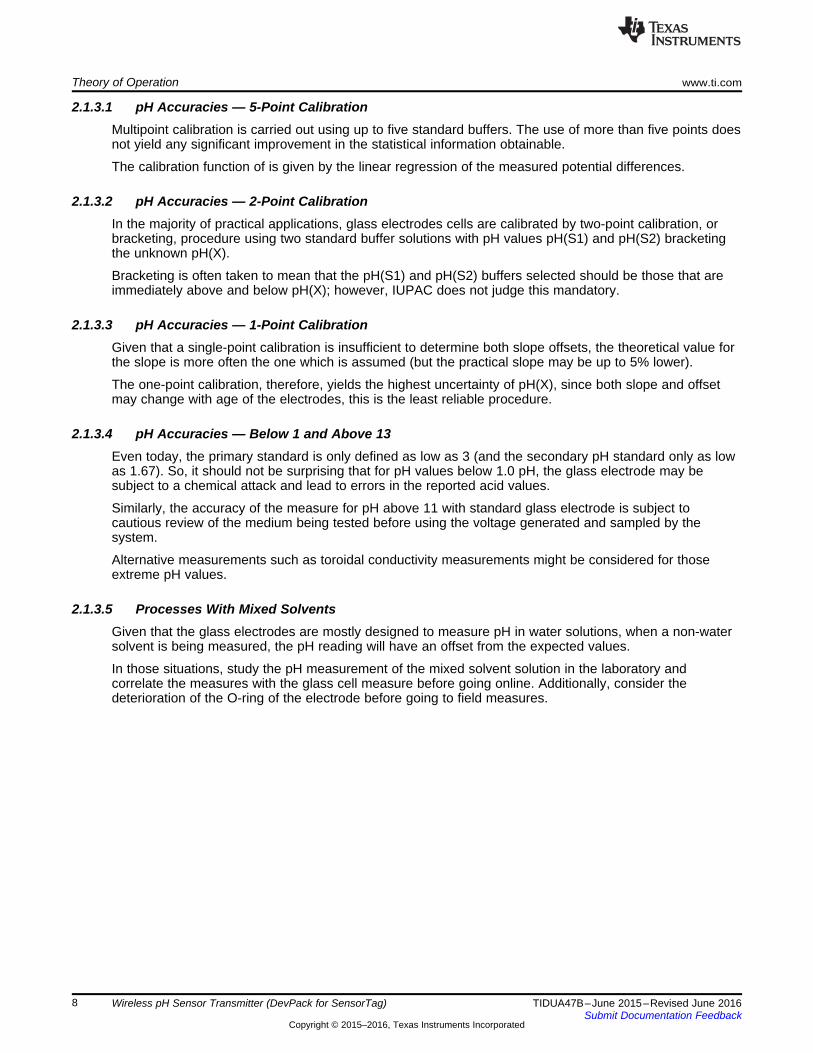
Beyond the primary references, in order to keep relevant uncertainties for pH measurement whendesigning an electronic system, Table 4 (extracted from DEFINITION OF pH SCALES, STANDARDREFERENCE VALUES, MEASUREMENT OF pH AND RELATED TERMINOLOGY, Table 4 [2]) givesphysicochemical related uncertainties, which limit a measurement system’s accuracy:
Table 4. pH Uncertainty for System Design Target Accuracies
U(pH)FOR COVERAGE
FACTOR 2COMMENTS
PRIMARY STANDARS (PS)Uncertainty of PS measured (by an NMI) with Harned Cell I 0.004Repeatability of PS measured (by an NMI) with Harned Cell I 0.0015Reproducibility of measurements in comparisons with HarnedCell I 0.003 EIROMET comparisons
Typical variations between batches of PS buffers 0.003SECONDARY STANDARDS (SS)
Value of SS compared with same PS measured in Harned Cell I 0.004 Increase in uncertainty is negligiblerelative to PS used
Value of SS measured in Harned Cell I 0.01 For example, biological buffersValue of SS labeled against different PS with Cell II or IV 0.015Value of SS (not compatible with Pt | H2) measured with Cell V 0.02 Example based on phthalateELECTRODE CALIBRATIONMultipoint (5-point) calibration 0.01 to 0.03Calibration (2-point) by bracketing 0.02 to 0.03Calibration (1-point), ΔpH = 3, and assumed slope 0.3
Table 4 mentions the different calibration methods and their relative uncertainty. However, this designguide does not detail the laboratory procedures; the following sections give a high-level overview of thoseprocedures and their ranges of validity.
Theory of Operation www.ti.com
8 TIDUA47B–June 2015–Revised June 2016Submit Documentation Feedback
Copyright © 2015–2016, Texas Instruments Incorporated
Wireless pH Sensor Transmitter (DevPack for SensorTag)
2.1.3.1 pH Accuracies — 5-Point CalibrationMultipoint calibration is carried out using up to five standard buffers. The use of more than five points doesnot yield any significant improvement in the statistical information obtainable.
The calibration function of is given by the linear regression of the measured potential differences.
2.1.3.2 pH Accuracies — 2-Point CalibrationIn the majority of practical applications, glass electrodes cells are calibrated by two-point calibration, orbracketing, procedure using two standard buffer solutions with pH values pH(S1) and pH(S2) bracketingthe unknown pH(X).
Bracketing is often taken to mean that the pH(S1) and pH(S2) buffers selected should be those that areimmediately above and below pH(X); however, IUPAC does not judge this mandatory.
2.1.3.3 pH Accuracies — 1-Point CalibrationGiven that a single-point calibration is insufficient to determine both slope offsets, the theoretical value forthe slope is more often the one which is assumed (but the practical slope may be up to 5% lower).
The one-point calibration, therefore, yields the highest uncertainty of pH(X), since both slope and offsetmay change with age of the electrodes, this is the least reliable procedure.
2.1.3.4 pH Accuracies — Below 1 and Above 13Even today, the primary standard is only defined as low as 3 (and the secondary pH standard only as lowas 1.67). So, it should not be surprising that for pH values below 1.0 pH, the glass electrode may besubject to a chemical attack and lead to errors in the reported acid values.
Similarly, the accuracy of the measure for pH above 11 with standard glass electrode is subject tocautious review of the medium being tested before using the voltage generated and sampled by thesystem.
Alternative measurements such as toroidal conductivity measurements might be considered for thoseextreme pH values.
2.1.3.5 Processes With Mixed SolventsGiven that the glass electrodes are mostly designed to measure pH in water solutions, when a non-watersolvent is being measured, the pH reading will have an offset from the expected values.
In those situations, study the pH measurement of the mixed solvent solution in the laboratory andcorrelate the measures with the glass cell measure before going online. Additionally, consider thedeterioration of the O-ring of the electrode before going to field measures.
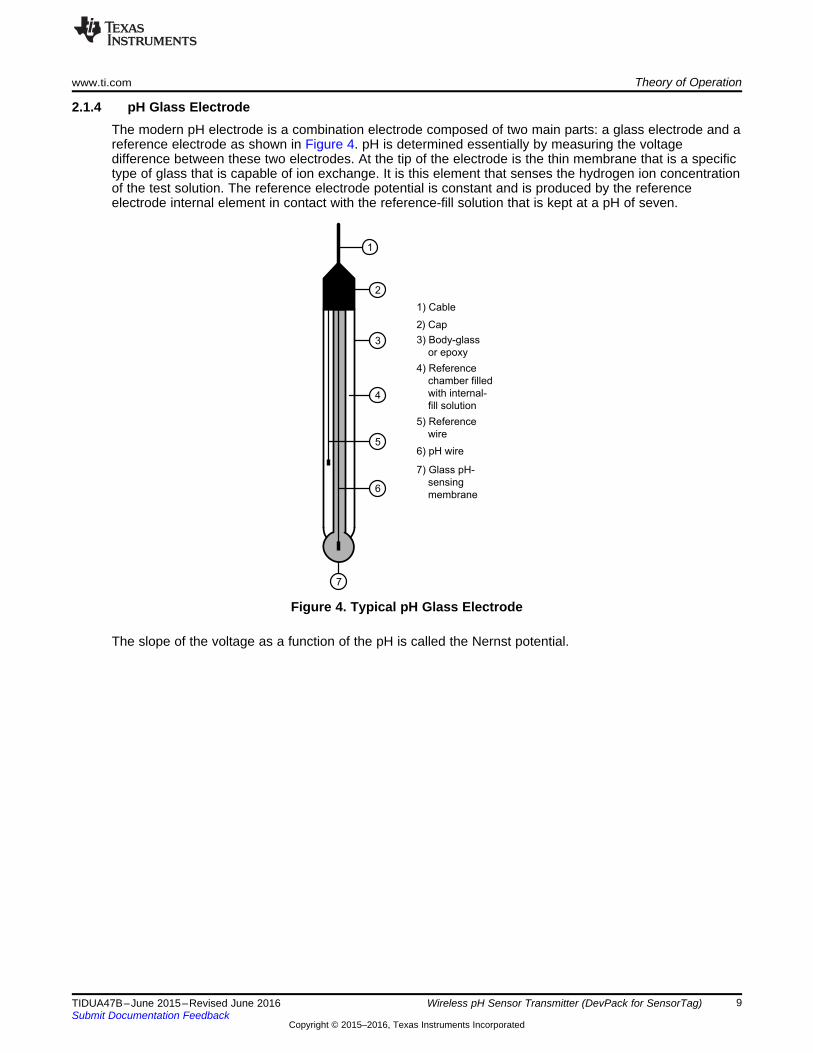
1) Cable
2) Cap
3) Body-glass
or epoxy
5) Reference
wire
4) Reference
chamber filled
with internal-
fill solution
7) Glass pH-
sensing
membrane
6) pH wire
7
6
5
4
3
2
1
www.ti.com Theory of Operation
9TIDUA47B–June 2015–Revised June 2016Submit Documentation Feedback
Copyright © 2015–2016, Texas Instruments Incorporated
Wireless pH Sensor Transmitter (DevPack for SensorTag)
2.1.4 pH Glass ElectrodeThe modern pH electrode is a combination electrode composed of two main parts: a glass electrode and areference electrode as shown in Figure 4. pH is determined essentially by measuring the voltagedifference between these two electrodes. At the tip of the electrode is the thin membrane that is a specifictype of glass that is capable of ion exchange. It is this element that senses the hydrogen ion concentrationof the test solution. The reference electrode potential is constant and is produced by the referenceelectrode internal element in contact with the reference-fill solution that is kept at a pH of seven.
Figure 4. Typical pH Glass Electrode
The slope of the voltage as a function of the pH is called the Nernst potential.
( )RT In 10or 0.000198T V / pH
F
1 3
2
5
4
7
6
9
8
11
10
13
12 14pH0
100
200
300
400
500
600
-600
-500
-400
-300
-200
-100
mV
0o
C (54.20 mV/pH)
100o
C (74.04 mV/pH)
25o
C (59.16 mV/pH)
+414 mV
0 2 4 7 10 12 14 pH
ACID BASE
+177 mV -414 mV-177 mV0 mV
( ) ( )( )
( )S XE E F
pH X pH SRT In 10
-= +
Theory of Operation www.ti.com
10 TIDUA47B–June 2015–Revised June 2016Submit Documentation Feedback
Copyright © 2015–2016, Texas Instruments Incorporated
Wireless pH Sensor Transmitter (DevPack for SensorTag)
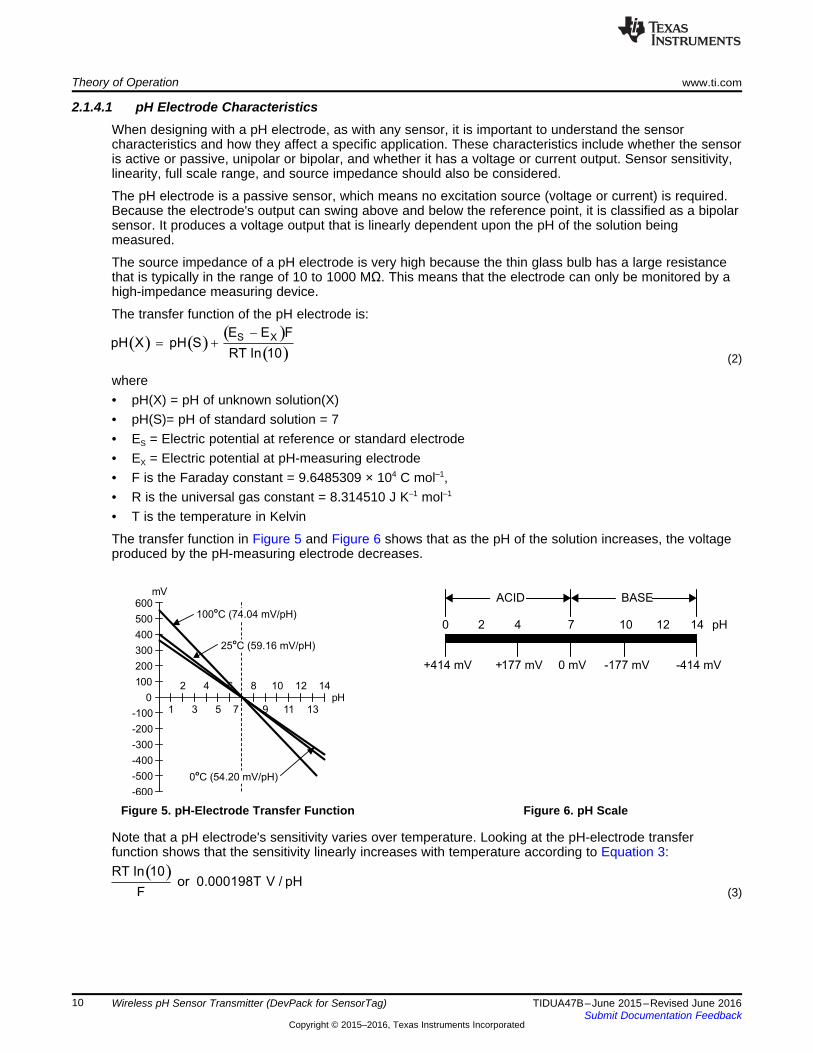
2.1.4.1 pH Electrode CharacteristicsWhen designing with a pH electrode, as with any sensor, it is important to understand the sensorcharacteristics and how they affect a specific application. These characteristics include whether the sensoris active or passive, unipolar or bipolar, and whether it has a voltage or current output. Sensor sensitivity,linearity, full scale range, and source impedance should also be considered.
The pH electrode is a passive sensor, which means no excitation source (voltage or current) is required.Because the electrode's output can swing above and below the reference point, it is classified as a bipolarsensor. It produces a voltage output that is linearly dependent upon the pH of the solution beingmeasured.
The source impedance of a pH electrode is very high because the thin glass bulb has a large resistancethat is typically in the range of 10 to 1000 MΩ. This means that the electrode can only be monitored by ahigh-impedance measuring device.
The transfer function of the pH electrode is:
(2)
where• pH(X) = pH of unknown solution(X)• pH(S)= pH of standard solution = 7• ES = Electric potential at reference or standard electrode• EX = Electric potential at pH-measuring electrode• F is the Faraday constant = 9.6485309 × 10⁴ C mol–1,• R is the universal gas constant = 8.314510 J K–1 mol–1
• T is the temperature in Kelvin
The transfer function in Figure 5 and Figure 6 shows that as the pH of the solution increases, the voltageproduced by the pH-measuring electrode decreases.
Figure 5. pH-Electrode Transfer Function Figure 6. pH Scale
Note that a pH electrode's sensitivity varies over temperature. Looking at the pH-electrode transferfunction shows that the sensitivity linearly increases with temperature according to Equation 3:
(3)
www.ti.com Theory of Operation
11TIDUA47B–June 2015–Revised June 2016Submit Documentation Feedback
Copyright © 2015–2016, Texas Instruments Incorporated
Wireless pH Sensor Transmitter (DevPack for SensorTag)
This results in a sensor output full-scale range that is dependent on the temperature. For example, at25°C, electrode sensitivity is 59.16 mV/pH and the output of the electrode will swing from –7 pH × –59.16mV/pH = 414.12 mV (pH 0 strong acid) to 7 pH × –59.16 mV/pH = –414.12 mV (pH 14 strong base).However, if the measured solution temperature is increased to 100°C, the output will swing from –7 pH ×–74.04 mV/pH = 518.29 mV down to 7pH × –74.04 mV/pH = –518.29 mV. Due to this behavior, it is criticalto know the temperature of the solution being measured and compensate the measurement accordingly.
An ideal electrode at 25°C will produce 0 mV when placed in a solution with a pH of seven. Of course,real-world electrodes are not ideal and will have an actual reading that varies from 0 mV. This variation iscalled the electrode's off set error. As stated previously, the sensitivity of an ideal electrode at 25°C is59.16 mV per pH unit. Any variation from this ideal value is specified as the electrode's span error. Theseerrors will need to be accounted for through calibration if high system accuracy is required.
2.1.5 Electrical NoiseGiven the high output impedance, the most classical approach is to design an active input circuitry with ahigh input impedance to avoid the voltage readings to be biased because of Ohm’s law.
The consequence of this high input impedance circuitry is that in noisy environment, the noise picked upby the pH probe cable can be significant (that is, higher than the stated system accuracy).
To this effect, multiple possibilities exist:• Analog domain filtering (any way needed for rejection of aliasing noise at the ADC stage)• Digital domain filtering (which allows having a running average and standard deviation with the extra
benefit of rejecting outliers)• Usage of triax electrode cables (which will shield the signal from the noise)
INP
VCM
EXT REFREF3220
2.048 V 2.048 V
ADC ADS1120
Analog SwitchTS5A3159
SensorTag DevPack connector
pH AFELMP91200
GPIOVDD
SPI
SPI
3 V
3 V
3 VpH ELECTRODE
RTD
R_REF
CAL
RTD
Design Methodology www.ti.com
12 TIDUA47B–June 2015–Revised June 2016Submit Documentation Feedback
Copyright © 2015–2016, Texas Instruments Incorporated
Wireless pH Sensor Transmitter (DevPack for SensorTag)
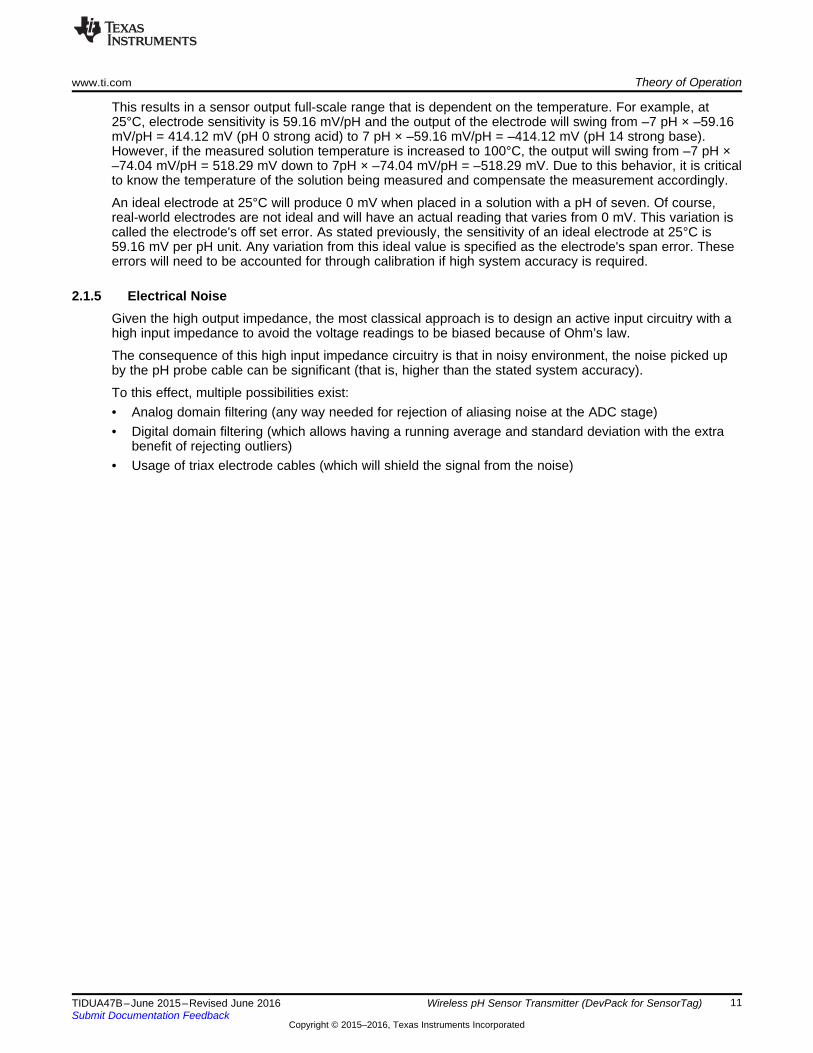
3 Design Methodology
Figure 7. pH Sensor Electronics as Extension Board for Wireless Sensor Tag
A wireless system for pH measurement needs to address multiple functional needs:• High input impedance for the pH electrode voltage sampling• Temperature measurement for pH temperature dependency compensation• Low power to maximize the battery run time• Noise rejection to minimize the measurement uncertainty
The following sections cover how to solve those design challenges.
www.ti.com Design Methodology
13TIDUA47B–June 2015–Revised June 2016Submit Documentation Feedback
Copyright © 2015–2016, Texas Instruments Incorporated
Wireless pH Sensor Transmitter (DevPack for SensorTag)
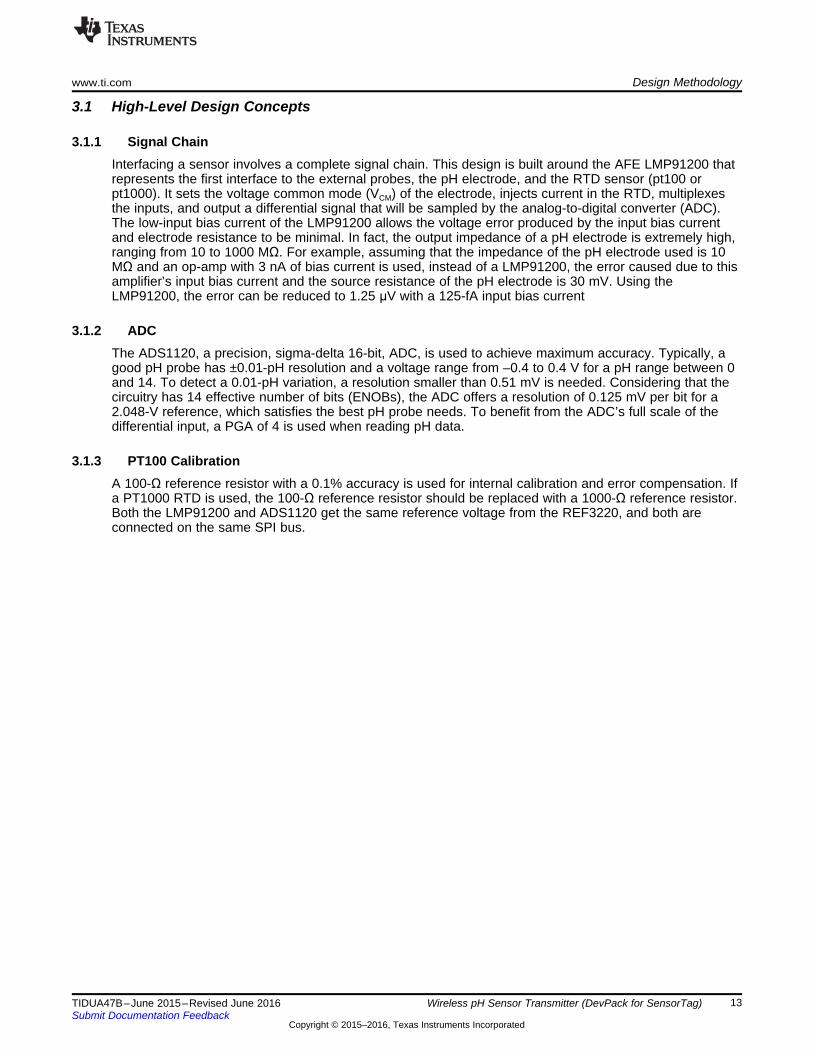
3.1 High-Level Design Concepts
3.1.1 Signal ChainInterfacing a sensor involves a complete signal chain. This design is built around the AFE LMP91200 thatrepresents the first interface to the external probes, the pH electrode, and the RTD sensor (pt100 orpt1000). It sets the voltage common mode (VCM) of the electrode, injects current in the RTD, multiplexesthe inputs, and output a differential signal that will be sampled by the analog-to-digital converter (ADC).The low-input bias current of the LMP91200 allows the voltage error produced by the input bias currentand electrode resistance to be minimal. In fact, the output impedance of a pH electrode is extremely high,ranging from 10 to 1000 MΩ. For example, assuming that the impedance of the pH electrode used is 10MΩ and an op-amp with 3 nA of bias current is used, instead of a LMP91200, the error caused due to thisamplifier’s input bias current and the source resistance of the pH electrode is 30 mV. Using theLMP91200, the error can be reduced to 1.25 μV with a 125-fA input bias current
3.1.2 ADCThe ADS1120, a precision, sigma-delta 16-bit, ADC, is used to achieve maximum accuracy. Typically, agood pH probe has ±0.01-pH resolution and a voltage range from –0.4 to 0.4 V for a pH range between 0and 14. To detect a 0.01-pH variation, a resolution smaller than 0.51 mV is needed. Considering that thecircuitry has 14 effective number of bits (ENOBs), the ADC offers a resolution of 0.125 mV per bit for a2.048-V reference, which satisfies the best pH probe needs. To benefit from the ADC’s full scale of thedifferential input, a PGA of 4 is used when reading pH data.
3.1.3 PT100 CalibrationA 100-Ω reference resistor with a 0.1% accuracy is used for internal calibration and error compensation. Ifa PT1000 RTD is used, the 100-Ω reference resistor should be replaced with a 1000-Ω reference resistor.Both the LMP91200 and ADS1120 get the same reference voltage from the REF3220, and both areconnected on the same SPI bus.
CSB
+
-
PGA
VDD
SCLK
SDI
VOUT
VOCM
VREF
SDO_DIAG
GND
VCMHI
VCM
GUARD2
INP
GUARD1
CAL
RTD
VCM
BUFFER
RANGE
SETTING
LMP91200
SPI
pH ELECTRODE
CONTROLLER
2-wire RTD
R_REF
pH
BUFFER
VOUT
MUX
VCM
MUX
Design Methodology www.ti.com
14 TIDUA47B–June 2015–Revised June 2016Submit Documentation Feedback
Copyright © 2015–2016, Texas Instruments Incorporated
Wireless pH Sensor Transmitter (DevPack for SensorTag)
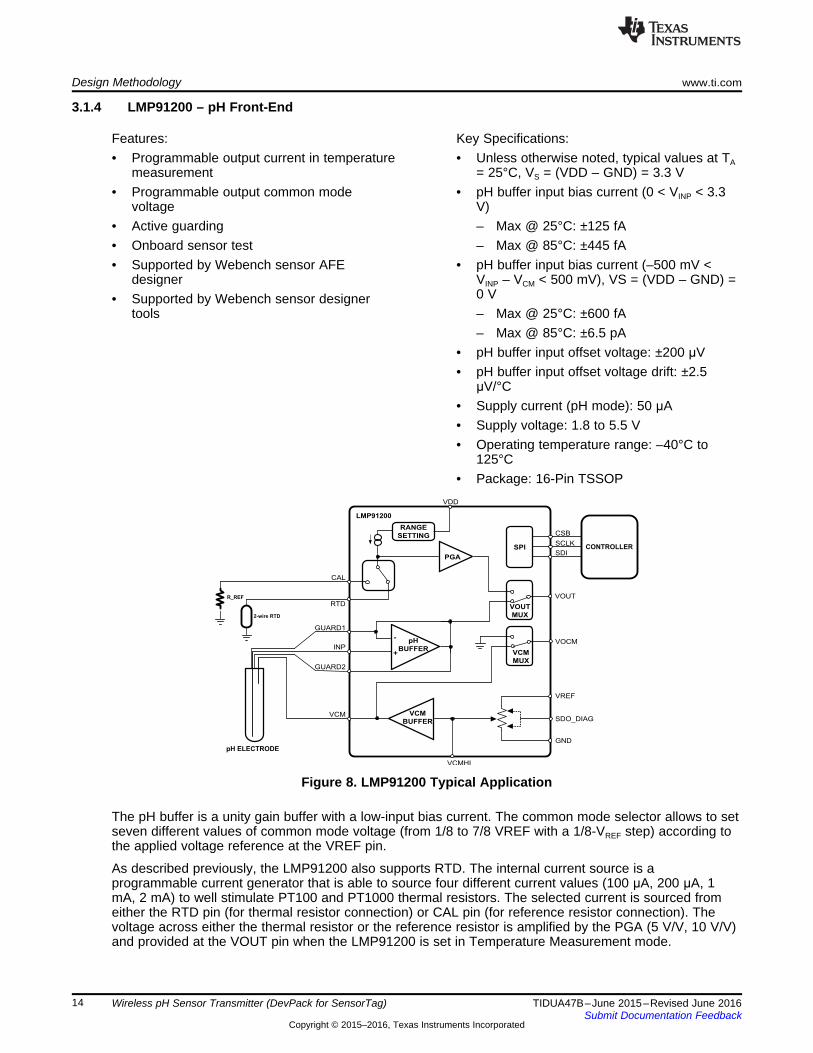
3.1.4 LMP91200 – pH Front-End
Features:• Programmable output current in temperature
measurement• Programmable output common mode
voltage• Active guarding• Onboard sensor test• Supported by Webench sensor AFE
designer• Supported by Webench sensor designer
tools
Key Specifications:• Unless otherwise noted, typical values at TA
= 25°C, VS = (VDD – GND) = 3.3 V• pH buffer input bias current (0 < VINP < 3.3
V)– Max @ 25°C: ±125 fA– Max @ 85°C: ±445 fA
• pH buffer input bias current (–500 mV <VINP – VCM < 500 mV), VS = (VDD – GND) =0 V– Max @ 25°C: ±600 fA– Max @ 85°C: ±6.5 pA
• pH buffer input offset voltage: ±200 μV• pH buffer input offset voltage drift: ±2.5
μV/°C• Supply current (pH mode): 50 μA• Supply voltage: 1.8 to 5.5 V• Operating temperature range: –40°C to
125°C• Package: 16-Pin TSSOP
Figure 8. LMP91200 Typical Application
The pH buffer is a unity gain buffer with a low-input bias current. The common mode selector allows to setseven different values of common mode voltage (from 1/8 to 7/8 VREF with a 1/8-VREF step) according tothe applied voltage reference at the VREF pin.
As described previously, the LMP91200 also supports RTD. The internal current source is aprogrammable current generator that is able to source four different current values (100 μA, 200 μA, 1mA, 2 mA) to well stimulate PT100 and PT1000 thermal resistors. The selected current is sourced fromeither the RTD pin (for thermal resistor connection) or CAL pin (for reference resistor connection). Thevoltage across either the thermal resistor or the reference resistor is amplified by the PGA (5 V/V, 10 V/V)and provided at the VOUT pin when the LMP91200 is set in Temperature Measurement mode.
AINP
AINN
Low Drift
Oscillator
Reference
Mux
Precision
Temp Sensor
AIN0/REFP1
AIN1
AIN2
AIN3/REFN1
SCLK
CS
AVDD
AVSS
DOUT/DRDY
DIN
DRDY
DGND
REFP0 REFN0
Internal
Reference
CLK
50 A to
1.5 mA
Mux
DVDD
PGA16-bit
ΔΣADC
Digital Filter
and
SPI
www.ti.com Design Methodology
15TIDUA47B–June 2015–Revised June 2016Submit Documentation Feedback
Copyright © 2015–2016, Texas Instruments Incorporated
Wireless pH Sensor Transmitter (DevPack for SensorTag)
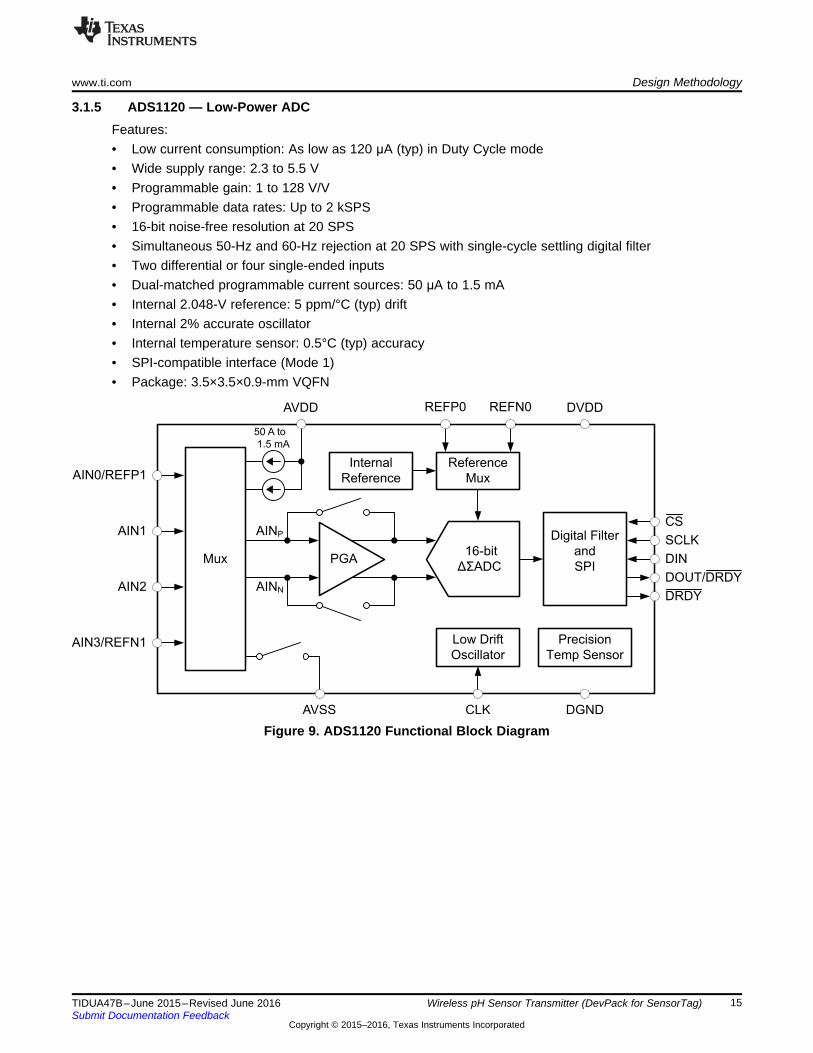
3.1.5 ADS1120 — Low-Power ADCFeatures:• Low current consumption: As low as 120 μA (typ) in Duty Cycle mode• Wide supply range: 2.3 to 5.5 V• Programmable gain: 1 to 128 V/V• Programmable data rates: Up to 2 kSPS• 16-bit noise-free resolution at 20 SPS• Simultaneous 50-Hz and 60-Hz rejection at 20 SPS with single-cycle settling digital filter• Two differential or four single-ended inputs• Dual-matched programmable current sources: 50 μA to 1.5 mA• Internal 2.048-V reference: 5 ppm/°C (typ) drift• Internal 2% accurate oscillator• Internal temperature sensor: 0.5°C (typ) accuracy• SPI-compatible interface (Mode 1)• Package: 3.5×3.5×0.9-mm VQFN
Figure 9. ADS1120 Functional Block Diagram
NCCOM
IN
NO
Design Methodology www.ti.com
16 TIDUA47B–June 2015–Revised June 2016Submit Documentation Feedback
Copyright © 2015–2016, Texas Instruments Incorporated
Wireless pH Sensor Transmitter (DevPack for SensorTag)
3.1.6 REF3220 — Voltage ReferenceFeatures:• Excellent specified drift performance:
– 7 ppm/°C (max) at 0°C to 125°C– 20 ppm/°C (max) at –40°C to 125°C
• Microsize package: SOT23-6• High output current: ±10 mA• High accuracy: 0.01%• Low quiescent current: 100 μA• Low dropout: 5 mV
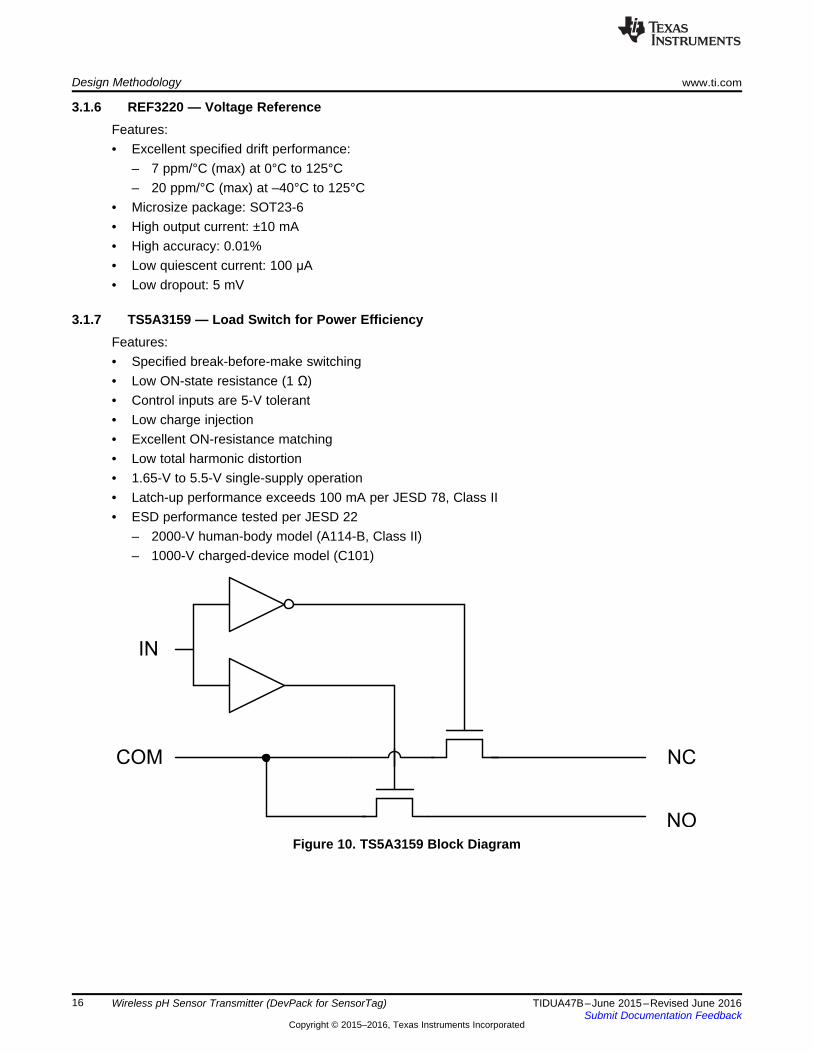
3.1.7 TS5A3159 — Load Switch for Power EfficiencyFeatures:• Specified break-before-make switching• Low ON-state resistance (1 Ω)• Control inputs are 5-V tolerant• Low charge injection• Excellent ON-resistance matching• Low total harmonic distortion• 1.65-V to 5.5-V single-supply operation• Latch-up performance exceeds 100 mA per JESD 78, Class II• ESD performance tested per JESD 22
– 2000-V human-body model (A114-B, Class II)– 1000-V charged-device model (C101)
Figure 10. TS5A3159 Block Diagram
( )( )2
RMSTotal Error Budget En _RMSpH NADS1120 4 30 V= + ´ = m
( )CM MIN
AVDD AVSSV AVSS
2
-³ +
( )IN
CM MIN
V PGAV AVDD 0.2
2
´³ - -
( )IN
CM MIN
V PGAV AVSS 0.2
2
´³ + +
www.ti.com Design Calculations
17TIDUA47B–June 2015–Revised June 2016Submit Documentation Feedback
Copyright © 2015–2016, Texas Instruments Incorporated
Wireless pH Sensor Transmitter (DevPack for SensorTag)
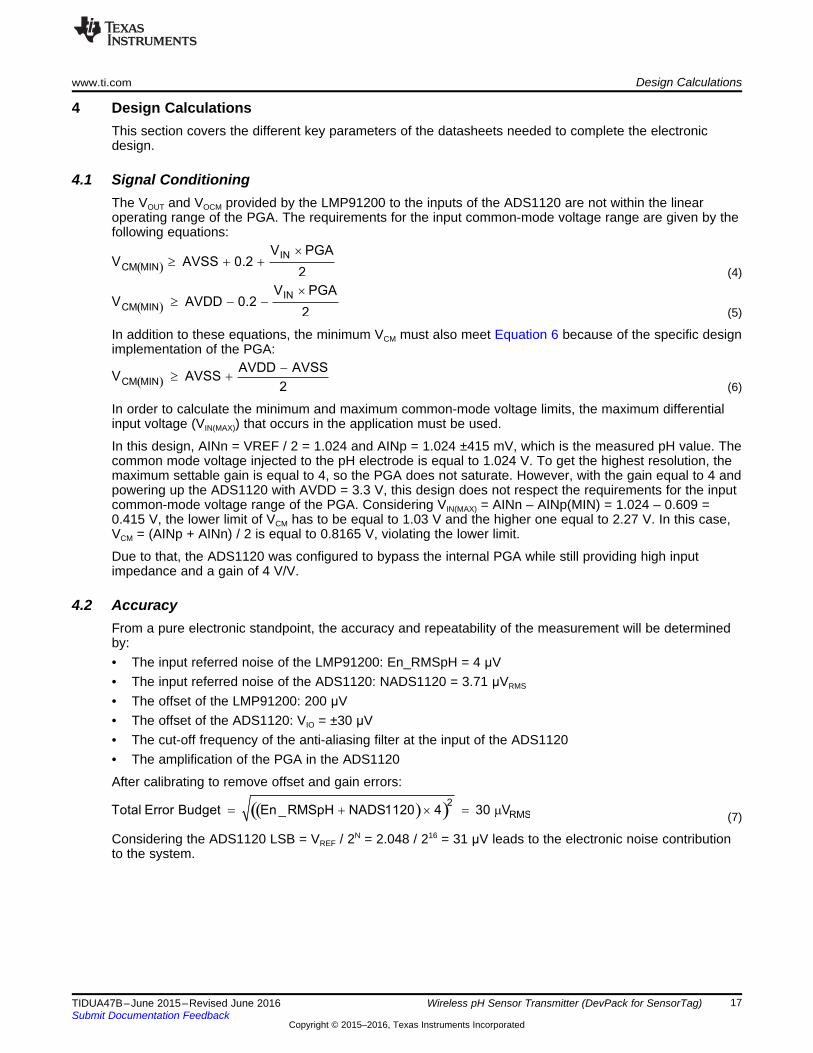
4 Design CalculationsThis section covers the different key parameters of the datasheets needed to complete the electronicdesign.
4.1 Signal ConditioningThe VOUT and VOCM provided by the LMP91200 to the inputs of the ADS1120 are not within the linearoperating range of the PGA. The requirements for the input common-mode voltage range are given by thefollowing equations:
(4)
(5)
In addition to these equations, the minimum VCM must also meet Equation 6 because of the specific designimplementation of the PGA:
(6)
In order to calculate the minimum and maximum common-mode voltage limits, the maximum differentialinput voltage (VIN(MAX)) that occurs in the application must be used.
In this design, AINn = VREF / 2 = 1.024 and AINp = 1.024 ±415 mV, which is the measured pH value. Thecommon mode voltage injected to the pH electrode is equal to 1.024 V. To get the highest resolution, themaximum settable gain is equal to 4, so the PGA does not saturate. However, with the gain equal to 4 andpowering up the ADS1120 with AVDD = 3.3 V, this design does not respect the requirements for the inputcommon-mode voltage range of the PGA. Considering VIN(MAX) = AINn – AINp(MIN) = 1.024 – 0.609 =0.415 V, the lower limit of VCM has to be equal to 1.03 V and the higher one equal to 2.27 V. In this case,VCM = (AINp + AINn) / 2 is equal to 0.8165 V, violating the lower limit.
Due to that, the ADS1120 was configured to bypass the internal PGA while still providing high inputimpedance and a gain of 4 V/V.
4.2 AccuracyFrom a pure electronic standpoint, the accuracy and repeatability of the measurement will be determinedby:• The input referred noise of the LMP91200: En_RMSpH = 4 μV• The input referred noise of the ADS1120: NADS1120 = 3.71 μVRMS
• The offset of the LMP91200: 200 μV• The offset of the ADS1120: VIO = ±30 μV• The cut-off frequency of the anti-aliasing filter at the input of the ADS1120• The amplification of the PGA in the ADS1120
After calibrating to remove offset and gain errors:
(7)
Considering the ADS1120 LSB = VREF / 2N = 2.048 / 216 = 31 μV leads to the electronic noise contributionto the system.
Layout Consideration www.ti.com
18 TIDUA47B–June 2015–Revised June 2016Submit Documentation Feedback
Copyright © 2015–2016, Texas Instruments Incorporated
Wireless pH Sensor Transmitter (DevPack for SensorTag)
5 Layout ConsiderationThis section covers mechanical needs for SensorTag and layout considerations for low-noise pickup fromthe pH.
The designed board has to be mechanically stacked with the SensorTag board, and then both have to fitinside a red rubber case to have a portable system. In this sense, the dimension of the board and theposition of the skin connector play a crucial role.
In order to connect the two boards properly, it is important that the bottom layer of the designed board iswithout components apart from the skin connector Also, all the components placed on the top layer haveto be SMD because the through hole ones could cause connectivity problems due to their leads thatprotrude through a PCB.
In pH measurement, due to the high impedance of the pH electrode, careful circuit layout is required.Guarding techniques are highly recommended to reduce parasitic leakage current by isolating theLMP91200’s input from large voltage gradients across the PCB. A guard is a low impedance conductorthat surrounds an input line and its potential is raised to the input line’s voltage. The input pin should befully guarded as shown in the layout. The guard traces should completely encircle the input connections.In addition, they should be located on both sides of the PCB and be connected together. The LMP91200makes the guard ring easy to be implemented without any other external op-amp. The ring needs to beconnected to the guard pins (GUARD1 and GUARD2), which are at the same potential of the INP pin. Thesolder mask should not cover the input and the guard area including guard traces on either side of thePCB.
Also for wireless designs, the RF transceiver should be located as far as possible from the pH probe.
0
RTE E 2.3 logaH
nF
æ ö= + +ç ÷
è ø
www.ti.com Verification and Characterization
19TIDUA47B–June 2015–Revised June 2016Submit Documentation Feedback
Copyright © 2015–2016, Texas Instruments Incorporated
Wireless pH Sensor Transmitter (DevPack for SensorTag)
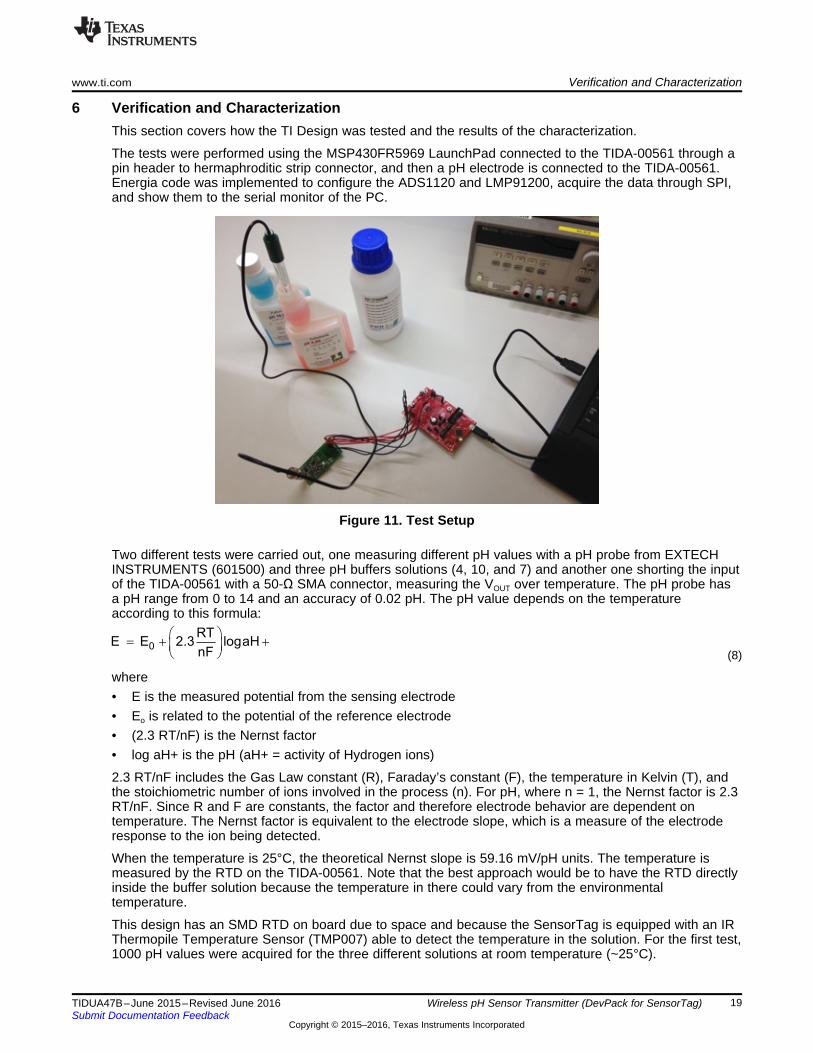
6 Verification and CharacterizationThis section covers how the TI Design was tested and the results of the characterization.
The tests were performed using the MSP430FR5969 LaunchPad connected to the TIDA-00561 through apin header to hermaphroditic strip connector, and then a pH electrode is connected to the TIDA-00561.Energia code was implemented to configure the ADS1120 and LMP91200, acquire the data through SPI,and show them to the serial monitor of the PC.
Figure 11. Test Setup
Two different tests were carried out, one measuring different pH values with a pH probe from EXTECHINSTRUMENTS (601500) and three pH buffers solutions (4, 10, and 7) and another one shorting the inputof the TIDA-00561 with a 50-Ω SMA connector, measuring the VOUT over temperature. The pH probe hasa pH range from 0 to 14 and an accuracy of 0.02 pH. The pH value depends on the temperatureaccording to this formula:
(8)
where• E is the measured potential from the sensing electrode• Eo is related to the potential of the reference electrode• (2.3 RT/nF) is the Nernst factor• log aH+ is the pH (aH+ = activity of Hydrogen ions)
2.3 RT/nF includes the Gas Law constant (R), Faraday’s constant (F), the temperature in Kelvin (T), andthe stoichiometric number of ions involved in the process (n). For pH, where n = 1, the Nernst factor is 2.3RT/nF. Since R and F are constants, the factor and therefore electrode behavior are dependent ontemperature. The Nernst factor is equivalent to the electrode slope, which is a measure of the electroderesponse to the ion being detected.
When the temperature is 25°C, the theoretical Nernst slope is 59.16 mV/pH units. The temperature ismeasured by the RTD on the TIDA-00561. Note that the best approach would be to have the RTD directlyinside the buffer solution because the temperature in there could vary from the environmentaltemperature.
This design has an SMD RTD on board due to space and because the SensorTag is equipped with an IRThermopile Temperature Sensor (TMP007) able to detect the temperature in the solution. For the first test,1000 pH values were acquired for the three different solutions at room temperature (~25°C).
Vout_pH(mV)
pH 7
10.75 10.81 10.87 10.93 10.99 11.05 11.110
25
50
75
100
125
150
175
200
225
D003 pH
pH 7
6.7927 6.7937 6.7947 6.7957 6.7967 6.7977 6.79870
25
50
75
100
125
150
175
200
225
D005
( )OUTV mVpH 7
mV59.16
pH
= -æ öç ÷è ø
Verification and Characterization www.ti.com
20 TIDUA47B–June 2015–Revised June 2016Submit Documentation Feedback
Copyright © 2015–2016, Texas Instruments Incorporated
Wireless pH Sensor Transmitter (DevPack for SensorTag)
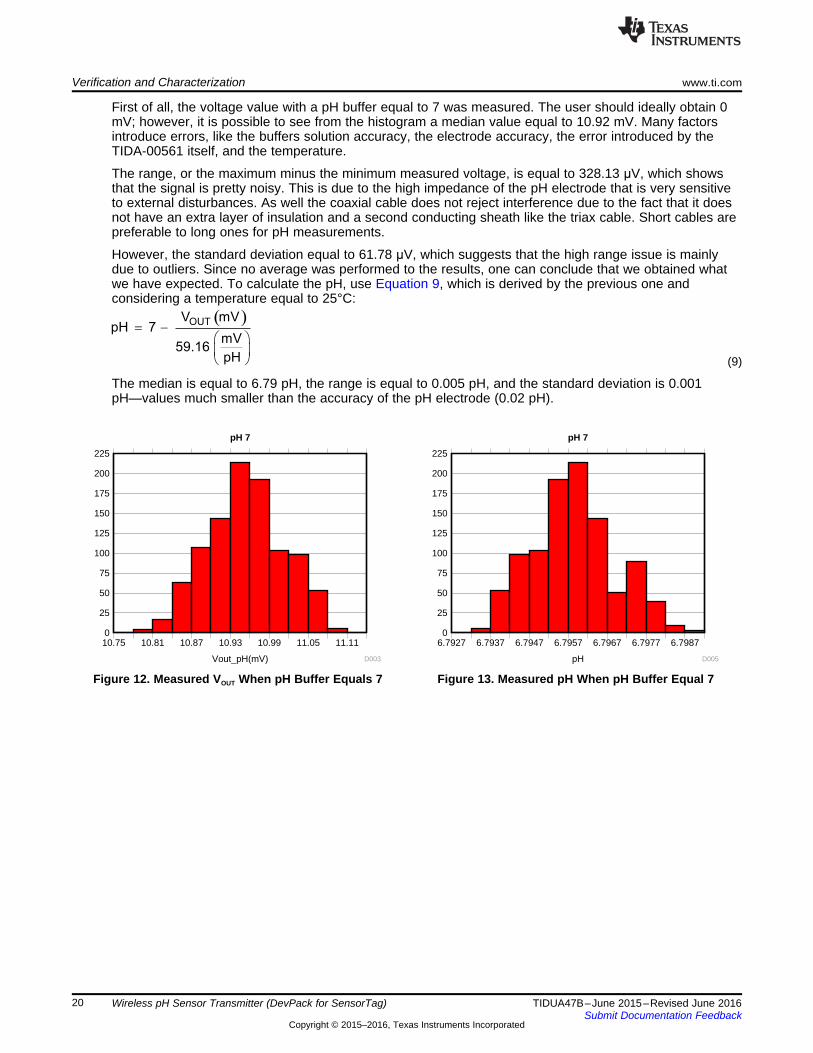
First of all, the voltage value with a pH buffer equal to 7 was measured. The user should ideally obtain 0mV; however, it is possible to see from the histogram a median value equal to 10.92 mV. Many factorsintroduce errors, like the buffers solution accuracy, the electrode accuracy, the error introduced by theTIDA-00561 itself, and the temperature.
The range, or the maximum minus the minimum measured voltage, is equal to 328.13 μV, which showsthat the signal is pretty noisy. This is due to the high impedance of the pH electrode that is very sensitiveto external disturbances. As well the coaxial cable does not reject interference due to the fact that it doesnot have an extra layer of insulation and a second conducting sheath like the triax cable. Short cables arepreferable to long ones for pH measurements.
However, the standard deviation equal to 61.78 μV, which suggests that the high range issue is mainlydue to outliers. Since no average was performed to the results, one can conclude that we obtained whatwe have expected. To calculate the pH, use Equation 9, which is derived by the previous one andconsidering a temperature equal to 25°C:
(9)
The median is equal to 6.79 pH, the range is equal to 0.005 pH, and the standard deviation is 0.001pH—values much smaller than the accuracy of the pH electrode (0.02 pH).
Figure 12. Measured VOUT When pH Buffer Equals 7 Figure 13. Measured pH When pH Buffer Equal 7
Vout_pH(mV)
pH 10
-151.75 -151.69 -151.63 -151.57 -151.51 -151.45 -151.390
25
50
75
100
125
150
175
200
D002 pH
pH 10
9.5396 9.5408 9.5420 9.5432 9.5444 9.5456 9.54680
25
50
75
100
125
150
175
200
225
D006
Vout_pH(mV)
pH 4
185.29 185.33 185.37 185.41 185.45 185.49 185.530
50
100
150
200
250
300
D001 pH
pH 4
3.8442 3.8448 3.8454 3.8460 3.8466 3.8472 3.8478 3.84840
25
50
75
100
125
150
175
200
225
250
275
300
D004
www.ti.com Verification and Characterization
21TIDUA47B–June 2015–Revised June 2016Submit Documentation Feedback
Copyright © 2015–2016, Texas Instruments Incorporated
Wireless pH Sensor Transmitter (DevPack for SensorTag)
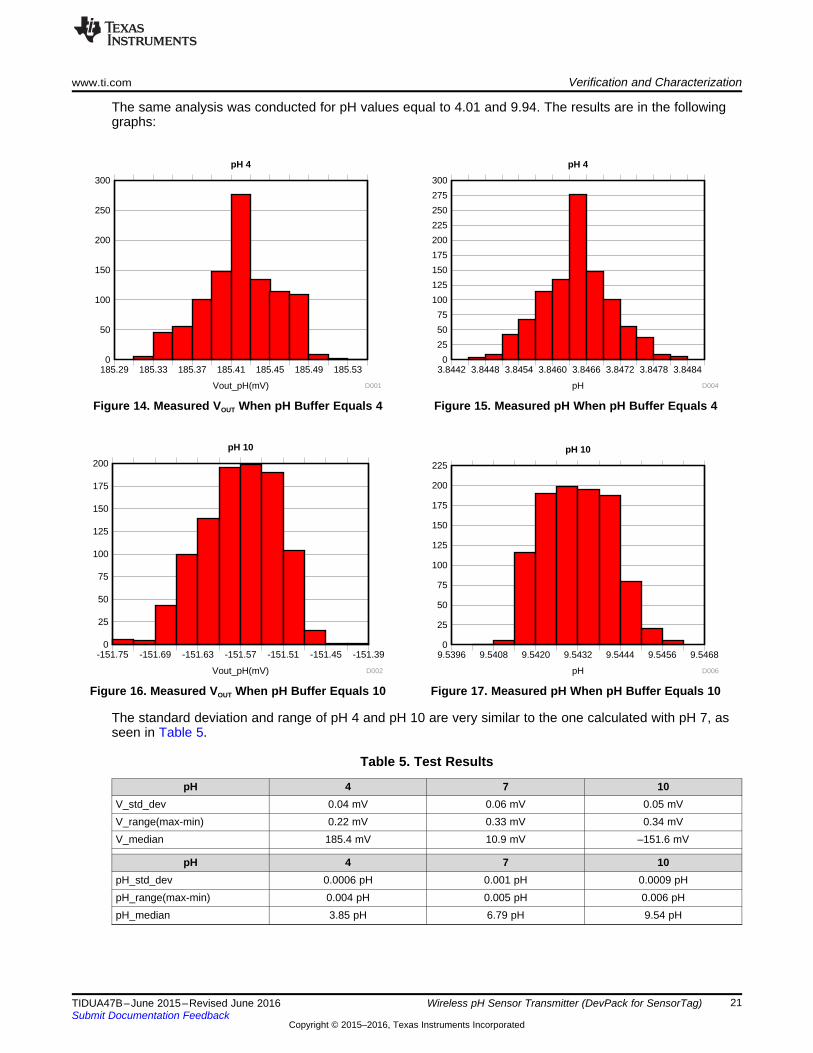
The same analysis was conducted for pH values equal to 4.01 and 9.94. The results are in the followinggraphs:
Figure 14. Measured VOUT When pH Buffer Equals 4 Figure 15. Measured pH When pH Buffer Equals 4
Figure 16. Measured VOUT When pH Buffer Equals 10 Figure 17. Measured pH When pH Buffer Equals 10
The standard deviation and range of pH 4 and pH 10 are very similar to the one calculated with pH 7, asseen in Table 5.
Table 5. Test Results
pH 4 7 10V_std_dev 0.04 mV 0.06 mV 0.05 mVV_range(max-min) 0.22 mV 0.33 mV 0.34 mVV_median 185.4 mV 10.9 mV –151.6 mV
pH 4 7 10pH_std_dev 0.0006 pH 0.001 pH 0.0009 pHpH_range(max-min) 0.004 pH 0.005 pH 0.006 pHpH_median 3.85 pH 6.79 pH 9.54 pH
Vout(mV)
Offset @ 85C
-0.2031 -0.1875 -0.1719 -0.1562 -0.14060
100
200
300
400
500
600
700
800
900
1000
D008
Vout
Offset @ -40
-18.0000 -17.0000 -16.0000 -15.0000 -14.00000
100
200
300
400
500
600
700
800
900
1000
D011 Vout
Offset @ 25C
-16.0000 -15.0000 -14.0000 -13.0000 -12.00000
100
200
300
400
500
600
700
800
900
1000
D012
Verification and Characterization www.ti.com
22 TIDUA47B–June 2015–Revised June 2016Submit Documentation Feedback
Copyright © 2015–2016, Texas Instruments Incorporated
Wireless pH Sensor Transmitter (DevPack for SensorTag)
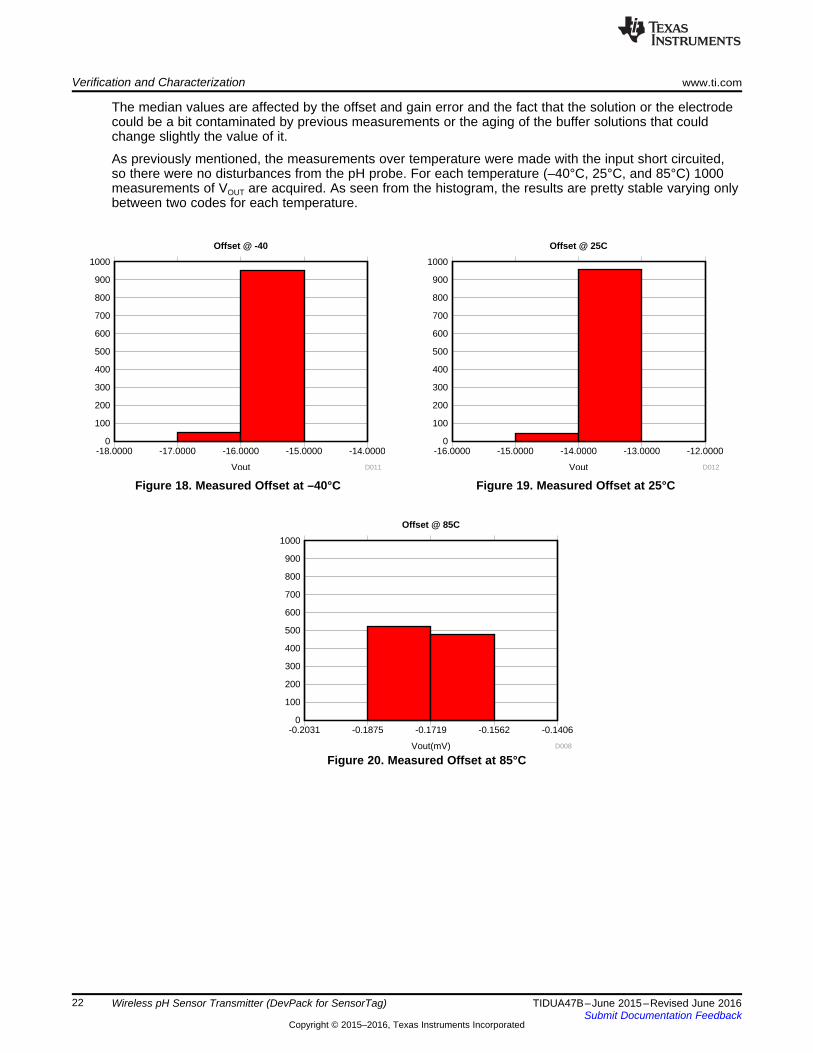
The median values are affected by the offset and gain error and the fact that the solution or the electrodecould be a bit contaminated by previous measurements or the aging of the buffer solutions that couldchange slightly the value of it.
As previously mentioned, the measurements over temperature were made with the input short circuited,so there were no disturbances from the pH probe. For each temperature (–40°C, 25°C, and 85°C) 1000measurements of VOUT are acquired. As seen from the histogram, the results are pretty stable varying onlybetween two codes for each temperature.
Figure 18. Measured Offset at –40°C Figure 19. Measured Offset at 25°C
Figure 20. Measured Offset at 85°C
Temp(C)
Vou
t(m
V)
Offset vs Temp
-60 -40 -20 0 20 40 60 80 100-0.26
-0.25
-0.24
-0.23
-0.22
-0.21
-0.2
-0.19
-0.18
-0.17
-0.16
D010
www.ti.com Getting Started
23TIDUA47B–June 2015–Revised June 2016Submit Documentation Feedback
Copyright © 2015–2016, Texas Instruments Incorporated
Wireless pH Sensor Transmitter (DevPack for SensorTag)
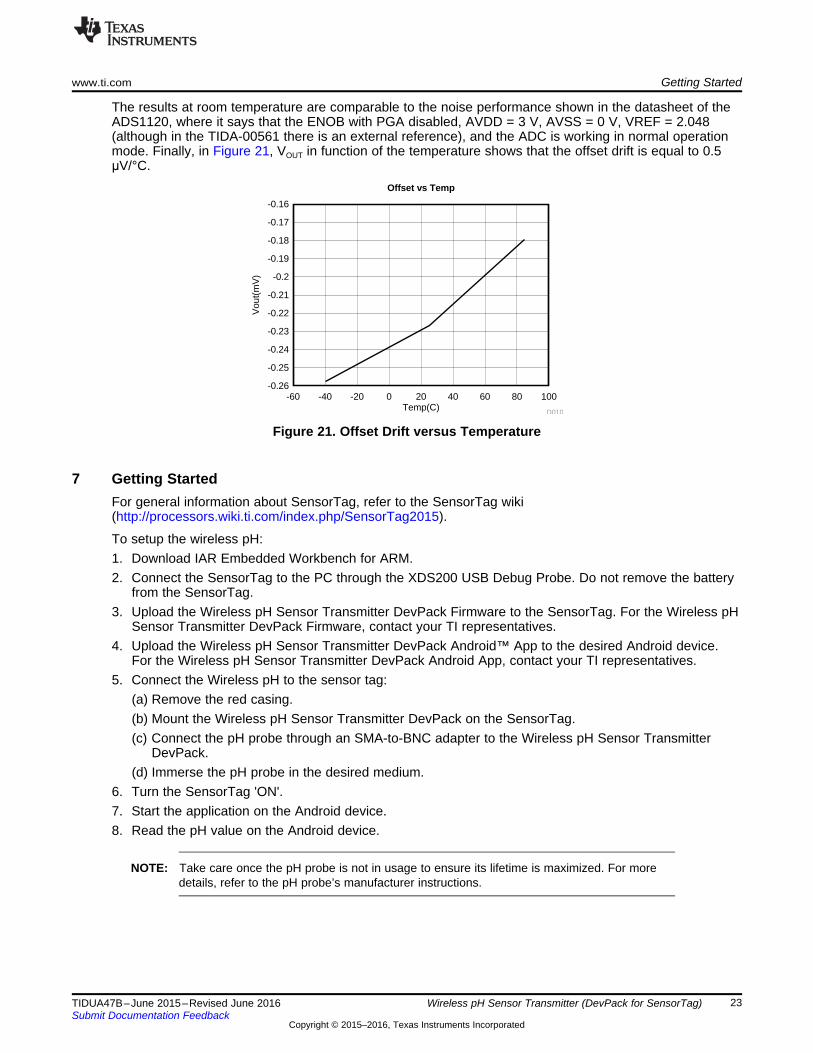
The results at room temperature are comparable to the noise performance shown in the datasheet of theADS1120, where it says that the ENOB with PGA disabled, AVDD = 3 V, AVSS = 0 V, VREF = 2.048(although in the TIDA-00561 there is an external reference), and the ADC is working in normal operationmode. Finally, in Figure 21, VOUT in function of the temperature shows that the offset drift is equal to 0.5μV/°C.
Figure 21. Offset Drift versus Temperature
7 Getting StartedFor general information about SensorTag, refer to the SensorTag wiki(http://processors.wiki.ti.com/index.php/SensorTag2015).
To setup the wireless pH:1. Download IAR Embedded Workbench for ARM.2. Connect the SensorTag to the PC through the XDS200 USB Debug Probe. Do not remove the battery
from the SensorTag.3. Upload the Wireless pH Sensor Transmitter DevPack Firmware to the SensorTag. For the Wireless pH
Sensor Transmitter DevPack Firmware, contact your TI representatives.4. Upload the Wireless pH Sensor Transmitter DevPack Android™ App to the desired Android device.
For the Wireless pH Sensor Transmitter DevPack Android App, contact your TI representatives.5. Connect the Wireless pH to the sensor tag:
(a) Remove the red casing.(b) Mount the Wireless pH Sensor Transmitter DevPack on the SensorTag.(c) Connect the pH probe through an SMA-to-BNC adapter to the Wireless pH Sensor Transmitter
DevPack.(d) Immerse the pH probe in the desired medium.
6. Turn the SensorTag 'ON'.7. Start the application on the Android device.8. Read the pH value on the Android device.
NOTE: Take care once the pH probe is not in usage to ensure its lifetime is maximized. For moredetails, refer to the pH probe’s manufacturer instructions.
GND
VREF_2.048V
10µFC9
10µF
C7GND
GND
3V_PWR3V_PWR
100ohm for PT100 change otherwise
GND
VDD_SENSORTAG
SCLKMOSI
MISO
GND
CS_1
DATA_READY
PH_IN_BNC
10µFC12
GND
SENSING BLOCK
POWER SPDT switch
CONN TO THE SENSOG TAG 2.0
47
R9
47
R6
47
R7
47
R8
47
R10
0.1µF C5
0.1µFC6
1.0k
R2
1.0k
R3
1
3
5 6
4
2
7
9 10
8
1211
1413
1615
1817
2019
J1
LSS-110-01-F-DV-A
SCLK
PWR_UP_CHIPDATA_READY
CS_1
CS_2
MOSI
SKIN_ID
GND_F1
GND_S2
ENABLE3
IN4
OUT_S5
OUT_F6
U3
REF3220AIDBVR
3V_PWR
0.47µF
C8
GND GND
VREF_2.048V
NO1
GND2
NC3
IN6
V+5
COM4
U4
TS5A3159DBVR
VDD_SENSORTAG
GND
2.2MR4
GND
3V_PWR
VDD_SENSORTAGPWR_UP_CHIP
CLK3
DGND4
AVSS5
AIN3/REFN16
AIN27
REFN08
REFP09
AIN110
AIN0/REFP111
AVDD12
DVDD13
DRDY14
DOUT/DRDY15
DIN16
SCLK1
CS2
U1
ADS1120IPWR
VDD1
CAL2
RTD3
GUARD14
INP5
GUARD26
VCMHI7
VCM8
VREF9
GND10
VOCM11
VOUT12
SDO_DIAG13
CS14
SCLK15
SDI16
U2
LMP91200MTX/NOPB
GND
0.1µF
C3
10µFC4
VREF_2.048V
CS_2SCLKMOSI
0.1µFC1
10µF
C2
GND
12
t°
TC1
PTS080501B100RP100
GUARD
GUARD1
2 3 4 5
J2
CONSMA001-SMD-G
GND
0.1µF
C10
MISO
VOUT_P
VOUT_N
AIN_PAIN_N
270kR5
5 ohm
L1
100
R1
Design Files www.ti.com
24 TIDUA47B–June 2015–Revised June 2016Submit Documentation Feedback
Copyright © 2015–2016, Texas Instruments Incorporated
Wireless pH Sensor Transmitter (DevPack for SensorTag)
8 Design Files
8.1 SchematicsTo download the schematics, see the design files at TIDA-00561.
Figure 22. Wireless pH Sensor Schematic
www.ti.com Design Files
25TIDUA47B–June 2015–Revised June 2016Submit Documentation Feedback
Copyright © 2015–2016, Texas Instruments Incorporated
Wireless pH Sensor Transmitter (DevPack for SensorTag)
8.2 Bill of MaterialsTo download the bill of materials (BOM), see the design files at TIDA-00561.
8.3 Layer PlotsTo download the layer plots, see the design files at TIDA-00561.
8.4 Altium ProjectTo download the Altium project files, see the design files at TIDA-00561.
8.5 Gerber FilesTo download the Gerber files, see the design files at TIDA-00561.
8.6 Assembly DrawingsTo download the assembly drawings, see the design files at TIDA-00561.
Software Files www.ti.com
26 TIDUA47B–June 2015–Revised June 2016Submit Documentation Feedback
Copyright © 2015–2016, Texas Instruments Incorporated
Wireless pH Sensor Transmitter (DevPack for SensorTag)
9 Software FilesTo download the software files, please contact your TI sales representative.
10 References
1. International Union Of Pure and Applied Chemistry, MEASUREMENT OF pH. DEFINITION,STANDARDS, AND PROCEDURES (IUPAC Recommendations 2002)(http://www.iupac.org/publications/pac/2002/pdf/7411x2169.pdf)
2. International Union Of Pure and Applied Chemistry, DEFINITION OF pH SCALES, STANDARDREFERENCE VALUES, MEASUREMENT OF pH AND RELATED TERMINOLOGY,(http://pac.iupac.org/publications/pac/pdf/1983/pdf/5509x1467.pdf(
3. Chemistry International, A Century of pH Measurement, Vol. 32, No. 2, March-April 2010(http://www.iupac.org/publications/ci/2010/3202/1_mfcamoes.html)
4. Chemical Education Today, Negative pH Does Exist, (http://pubs.acs.org/doi/pdf/10.1021/ed083p1465)5. Ivanov V. V, The present hydrothermal activity of the volcano Ebeko on island of Paramshir,
Geokimiya No 1, p.63–67, 19576. Nikitina, L. P. Presented at Proceedings of the Water-Rock Interaction Symposium, Prague,
Czechoslovakia, 19747. Nordstrom, Darrell Kirk; Alpers, C. N. Proceeding National Academy Science USA, 1999, 96, 34558. Nordstrom, Darrell Kirk; Alpers, C. N.; Ptacek, C. J.; Blowes, D. W. Environ. Sci. Technol. 2000, 34,
2549. Nordstrom, Darrell Kirk. Geological Survey: Negative pH and Extremely Acidic Mine Waters from Iron
Mountain, California, USGS Staff, Published Research US Geological Survey, Jan 1, 2000,Environmental Science & Technology, 34, p.254–258
10. Yokogawa Electric Corporation, PH450G 4-Wire pH/ORP Analyzer, Product Page(http://www.yokogawa.com/an/ph-orp/an-ph450g-001en.htm)
11. Emerson Process Management, The Theory of pH Measurement, Application Datasheet (PDF)
11 About the AuthorMATTHIEU CHEVRIER is a Systems Architect at Texas Instruments, where he is responsible for definingand developing reference design solutions for the industrial segment. Matthieu brings to this role hisextensive experience in embedded system designs in both hardware (power management, mixed signal,and so on) and software (such as low level drivers, RTOS, and compilers). Matthieu earned his Master ofScience in electrical engineering (MSEE) from Supélec, an Ivy League university in France. Matthieuholds patents from IPO, EPO, and USPTO.
GIOVANNI CAMPANELLA is an Industrial Systems Engineer with the Field Transmitter Team in theFactory Automation and Control organization. He earned his bachelor's degree in electronic andtelecommunication engineering at the University of Bologna and his master's degree in electronicengineering at the Polytechnic of Turin in Italy. His design experience covers sensors and analog signalchain (with a focus on Fluxgate and analytics sensing technologies) and mixed-signal control of DCbrushed servo drives.
AMJAD EL HILALI is a Field Application Engineer at Texas Instruments where he is responsible fortechnical support for industrial customers. Amjad brings to this role his experience in both hardwaredesign (sensing and power management) and software design (RTOS, RF protocols, and signalprocessing). Amjad earned his master's degree in electrical engineering from INSA de Lyon University inFrance.
www.ti.com Revision B History
27TIDUA47B–June 2015–Revised June 2016Submit Documentation Feedback
Copyright © 2015–2016, Texas Instruments Incorporated
Revision History
Revision B HistoryNOTE: Page numbers for previous revisions may differ from page numbers in the current version.
Changes from A Revision (August 2015) to B Revision ................................................................................................ Page
• Changed location of software files..................................................................................................... 26
Revision A History
Changes from Original (June 2015) to A Revision ......................................................................................................... Page
• Changed from preview page............................................................................................................. 1

IMPORTANT NOTICE FOR TI REFERENCE DESIGNS
Texas Instruments Incorporated (‘TI”) reference designs are solely intended to assist designers (“Designer(s)”) who are developing systemsthat incorporate TI products. TI has not conducted any testing other than that specifically described in the published documentation for aparticular reference design.TI’s provision of reference designs and any other technical, applications or design advice, quality characterization, reliability data or otherinformation or services does not expand or otherwise alter TI’s applicable published warranties or warranty disclaimers for TI products, andno additional obligations or liabilities arise from TI providing such reference designs or other items.TI reserves the right to make corrections, enhancements, improvements and other changes to its reference designs and other items.Designer understands and agrees that Designer remains responsible for using its independent analysis, evaluation and judgment indesigning Designer’s systems and products, and has full and exclusive responsibility to assure the safety of its products and compliance ofits products (and of all TI products used in or for such Designer’s products) with all applicable regulations, laws and other applicablerequirements. Designer represents that, with respect to its applications, it has all the necessary expertise to create and implementsafeguards that (1) anticipate dangerous consequences of failures, (2) monitor failures and their consequences, and (3) lessen thelikelihood of failures that might cause harm and take appropriate actions. Designer agrees that prior to using or distributing any systemsthat include TI products, Designer will thoroughly test such systems and the functionality of such TI products as used in such systems.Designer may not use any TI products in life-critical medical equipment unless authorized officers of the parties have executed a specialcontract specifically governing such use. Life-critical medical equipment is medical equipment where failure of such equipment would causeserious bodily injury or death (e.g., life support, pacemakers, defibrillators, heart pumps, neurostimulators, and implantables). Suchequipment includes, without limitation, all medical devices identified by the U.S. Food and Drug Administration as Class III devices andequivalent classifications outside the U.S.Designers are authorized to use, copy and modify any individual TI reference design only in connection with the development of endproducts that include the TI product(s) identified in that reference design. HOWEVER, NO OTHER LICENSE, EXPRESS OR IMPLIED, BYESTOPPEL OR OTHERWISE TO ANY OTHER TI INTELLECTUAL PROPERTY RIGHT, AND NO LICENSE TO ANY TECHNOLOGY ORINTELLECTUAL PROPERTY RIGHT OF TI OR ANY THIRD PARTY IS GRANTED HEREIN, including but not limited to any patent right,copyright, mask work right, or other intellectual property right relating to any combination, machine, or process in which TI products orservices are used. Information published by TI regarding third-party products or services does not constitute a license to use such productsor services, or a warranty or endorsement thereof. Use of the reference design or other items described above may require a license from athird party under the patents or other intellectual property of the third party, or a license from TI under the patents or other intellectualproperty of TI.TI REFERENCE DESIGNS AND OTHER ITEMS DESCRIBED ABOVE ARE PROVIDED “AS IS” AND WITH ALL FAULTS. TI DISCLAIMSALL OTHER WARRANTIES OR REPRESENTATIONS, EXPRESS OR IMPLIED, REGARDING THE REFERENCE DESIGNS OR USE OFTHE REFERENCE DESIGNS, INCLUDING BUT NOT LIMITED TO ACCURACY OR COMPLETENESS, TITLE, ANY EPIDEMIC FAILUREWARRANTY AND ANY IMPLIED WARRANTIES OF MERCHANTABILITY, FITNESS FOR A PARTICULAR PURPOSE, AND NON-INFRINGEMENT OF ANY THIRD PARTY INTELLECTUAL PROPERTY RIGHTS.TI SHALL NOT BE LIABLE FOR AND SHALL NOT DEFEND OR INDEMNIFY DESIGNERS AGAINST ANY CLAIM, INCLUDING BUT NOTLIMITED TO ANY INFRINGEMENT CLAIM THAT RELATES TO OR IS BASED ON ANY COMBINATION OF PRODUCTS ASDESCRIBED IN A TI REFERENCE DESIGN OR OTHERWISE. IN NO EVENT SHALL TI BE LIABLE FOR ANY ACTUAL, DIRECT,SPECIAL, COLLATERAL, INDIRECT, PUNITIVE, INCIDENTAL, CONSEQUENTIAL OR EXEMPLARY DAMAGES IN CONNECTION WITHOR ARISING OUT OF THE REFERENCE DESIGNS OR USE OF THE REFERENCE DESIGNS, AND REGARDLESS OF WHETHER TIHAS BEEN ADVISED OF THE POSSIBILITY OF SUCH DAMAGES.TI’s standard terms of sale for semiconductor products (http://www.ti.com/sc/docs/stdterms.htm) apply to the sale of packaged integratedcircuit products. Additional terms may apply to the use or sale of other types of TI products and services.Designer will fully indemnify TI and its representatives against any damages, costs, losses, and/or liabilities arising out of Designer’s non-compliance with the terms and provisions of this Notice.IMPORTANT NOTICE
Mailing Address: Texas Instruments, Post Office Box 655303, Dallas, Texas 75265Copyright © 2016, Texas Instruments Incorporated


![[ devpack IDE ] 개발 실습 - ucloudbiz.kt.com · └실행런타임,웹서버,개발도구 개발을 위한 플랫폼을 구축할 필요 없이, 필요한 개발요소들을 웹에서](https://static.fdocuments.net/doc/165x107/5dd0fe9cd6be591ccb63b4f6/-devpack-ide-eoeeoe-aefoeeeoeeoeee-eoeeoe.jpg)
