DAS Last Update 2012.03.19 1.9.0 Copyright 2000-2012 Kenneth M. Chipps Ph.D. 1.
date post
22-Dec-2015Category
view
219download
1
Wireless Design
Last Update 2013.09.06
3.3.0
1Copyright 2005-2013 Kenneth M. Chipps Ph.D. www.chipps.com

Wireless Design Considerations
• The design of a wireless network is science and art
• Much is known and much is unknown, so guidelines based on experience are commonly used rather than exact formulas at this stage of development
2Copyright 2005-2013 Kenneth M. Chipps Ph.D. www.chipps.com

Wireless Design Considerations
• There is an important consideration to keep in mind when designing a wireless network
• In a wired network the signal is contained in a wire
• When laying out or troubleshooting the network, the confines of the network are readily apparent
Copyright 2005-2013 Kenneth M. Chipps Ph.D. www.chipps.com
3

Wireless Design Considerations
• It is in the wires and the devices that connect to those wires
• Whereas, in a wireless network the actual network is three dimensional and uncontained
• Issues such as beamwidth, interference, atmosphere, and so on have a significant affect on the ability and consistency of the wireless network to do its work
4Copyright 2005-2013 Kenneth M. Chipps Ph.D. www.chipps.com

Wireless Design Considerations
• To successfully design a wireless network you must learn to think and operate multidimensionally in a constantly changing environment
Copyright 2005-2013 Kenneth M. Chipps Ph.D. www.chipps.com
5
Coverage
• In this presentation the majority of the material will focus on wireless LAN design
• The design of a CAN link uses the same basic principles as the wireless LAN design
• The major difference being the types of obstacles encountered outside, such as trees
• Otherwise the approach is the sameCopyright 2005-2013 Kenneth M. Chipps Ph.D.
www.chipps.com6

Coverage
• The design of a wireless MAN is very dependent on the type of network it is
• A licensed cellular MAN is much different from an unlicensed SCADA network
• There is little general design guidance that can be offered for these proprietary systems as the manufacturer of the equipment used will provide the design details
Copyright 2005-2013 Kenneth M. Chipps Ph.D. www.chipps.com
7

Uses of a Wireless LAN
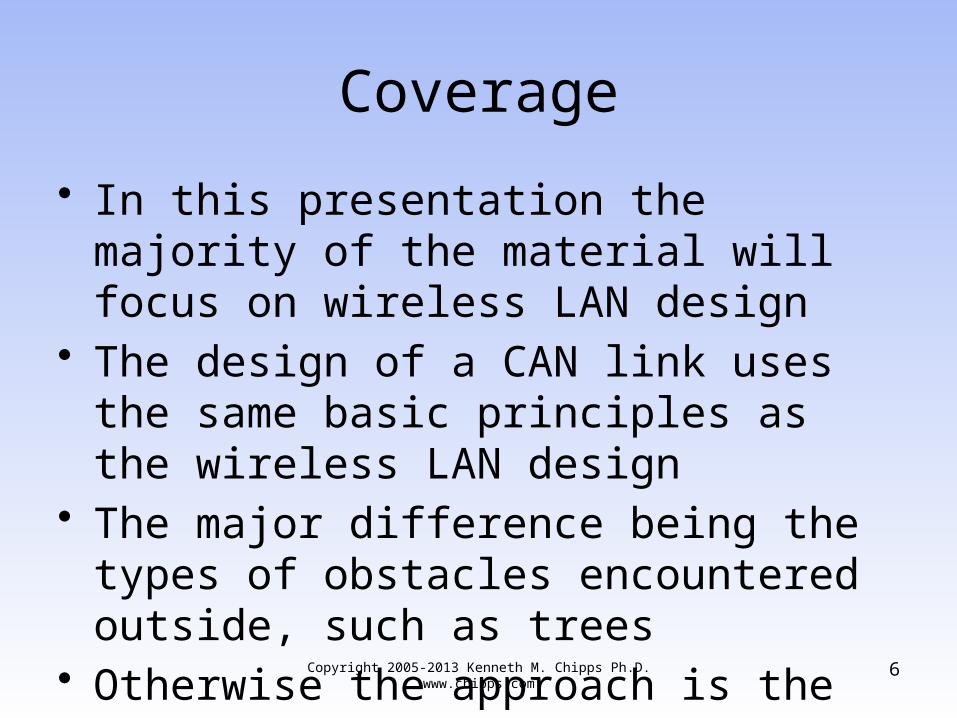
• In addition to the usual uses for wireless local area networks new uses are being suggested as data rates increase
• For example this slide from an Agilent webinar from January 2012 shows some of these new uses
Copyright 2005-2013 Kenneth M. Chipps Ph.D. www.chipps.com
8
Uses of a Wireless LAN
Copyright 2005-2013 Kenneth M. Chipps Ph.D. www.chipps.com
9

Designing a Wireless LAN
• The way to start any network design is to apply a top down approach that relates the business needs of the organization to the technical implementation of the network
• Based on this systematic design approach a physical network is laid out on paper
• The discussion here is the changes to this network design brought about by the use of wireless devices
10Copyright 2005-2013 Kenneth M. Chipps Ph.D. www.chipps.com
Designing a Wireless LAN
• In a network where the parts are connected with wires, in general, one need only decide where to place the parts and what capabilities each of these parts require to create an effective and efficient network
Copyright 2005-2013 Kenneth M. Chipps Ph.D. www.chipps.com
11

Design Methods
• A wireless network can be designed– By hand using experience and guidelines– or– Using an automated design program
Copyright 2005-2013 Kenneth M. Chipps Ph.D. www.chipps.com
12
Wireless LAN Network Design
• To do this by hand acquire or create a drawing of the site of sufficient scale so that– Device locations can be marked– Radio signal coverage areas can be indicated– Notes can be made
13Copyright 2005-2013 Kenneth M. Chipps Ph.D. www.chipps.com

Wireless LAN Network Design
• Next, using experience from actual practice or based on guidelines discussed here, place the access points and their presumed coverage areas on the drawing, such as
Copyright 2005-2013 Kenneth M. Chipps Ph.D. www.chipps.com
14

Wireless LAN Network Design
15
CELL 1
802.11b/g
CHANNEL 1
11 Mbps TO EDGE
CELL 3
802.11b/g
CHANNEL 11
11 Mbps TO EDGE
CELL 2
802.11b/g
CHANNEL 6
11 Mbps TO EDGE
CELL 4
802.11b/g
CHANNEL 6
11 Mbps TO EDGE
CELL 7
802.11b/g
CHANNEL 16
11 Mbps TO EDGE
CELL 5
802.11b/g
CHANNEL 11
11 Mbps TO EDGE
CELL 6
802.11b/g
CHANNEL 1
11 Mbps TO EDGE
Copyright 2005-2013 Kenneth M. Chipps Ph.D. www.chipps.com

Wireless LAN Network Design
• To crosscheck this, in some cases it will be necessary to perform some basic calculations to check for proper signal propagation
• These calculations and the AP placement itself must take into account the physical characteristics of the site as well as the equipment being used, such as the type and directional nature of the antenna
16Copyright 2005-2013 Kenneth M. Chipps Ph.D. www.chipps.com

Wireless LAN Network Design
• For example, an omnidirectional antenna will radiate the signal equally in all directions
• If the AP is placed against the outside wall of the building, the radiation pattern and therefore the ability to intercept the signal may extend into a nearby street
Copyright 2005-2013 Kenneth M. Chipps Ph.D. www.chipps.com
17

Wireless LAN Network Design
• A directional antenna and more access points may be a better choice in this case, if relocation of the omnidirectional antenna is not possible
18Copyright 2005-2013 Kenneth M. Chipps Ph.D. www.chipps.com
The Goal
• The goal of the network design is to propagate a signal that serves the needs of the network’s users
• The two main considerations are– Coverage– Capacity
19Copyright 2005-2013 Kenneth M. Chipps Ph.D. www.chipps.com
Coverage
• Coverage is designed to provide a low density of users with low throughput demands
Copyright 2005-2013 Kenneth M. Chipps Ph.D. www.chipps.com
20

Capacity
• Capacity is designed to support a large number of users using high bandwidth requirement applications such as voice and video
• The focus for this type of design is a high density of access points, which can mean stacking access points physically on top of each other, to serve an area
Copyright 2005-2013 Kenneth M. Chipps Ph.D. www.chipps.com
21
Capacity
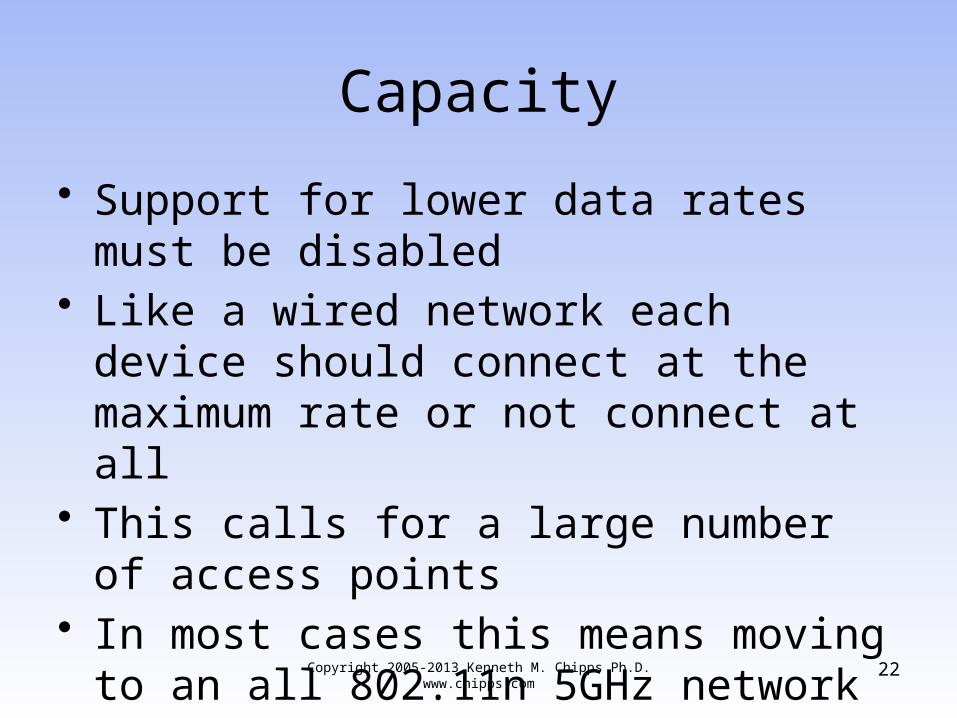
• Support for lower data rates must be disabled
• Like a wired network each device should connect at the maximum rate or not connect at all
• This calls for a large number of access points
• In most cases this means moving to an all 802.11n 5GHz network
Copyright 2005-2013 Kenneth M. Chipps Ph.D. www.chipps.com
22

Capacity
• The 2.4GHz range and 802.11a/b/g devices must be abandoned
• Next, the critical factor in maintaining connectivity for high capacity is the SNR – Signal to Noise Ratio
• The higher the SNR the better the performance
• The actual signal an noise levels are less important
Copyright 2005-2013 Kenneth M. Chipps Ph.D. www.chipps.com
23
Signal to Noise Ratio Guidelines
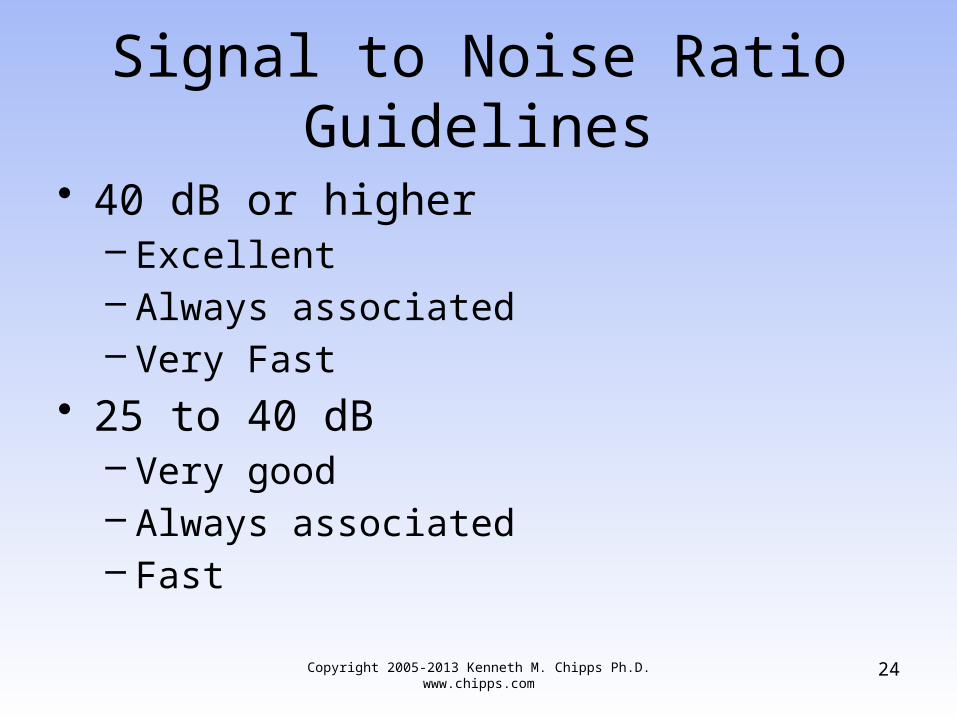
• 40 dB or higher– Excellent– Always associated– Very Fast
• 25 to 40 dB– Very good– Always associated– Fast
24Copyright 2005-2013 Kenneth M. Chipps Ph.D. www.chipps.com
Signal to Noise Ratio Guidelines
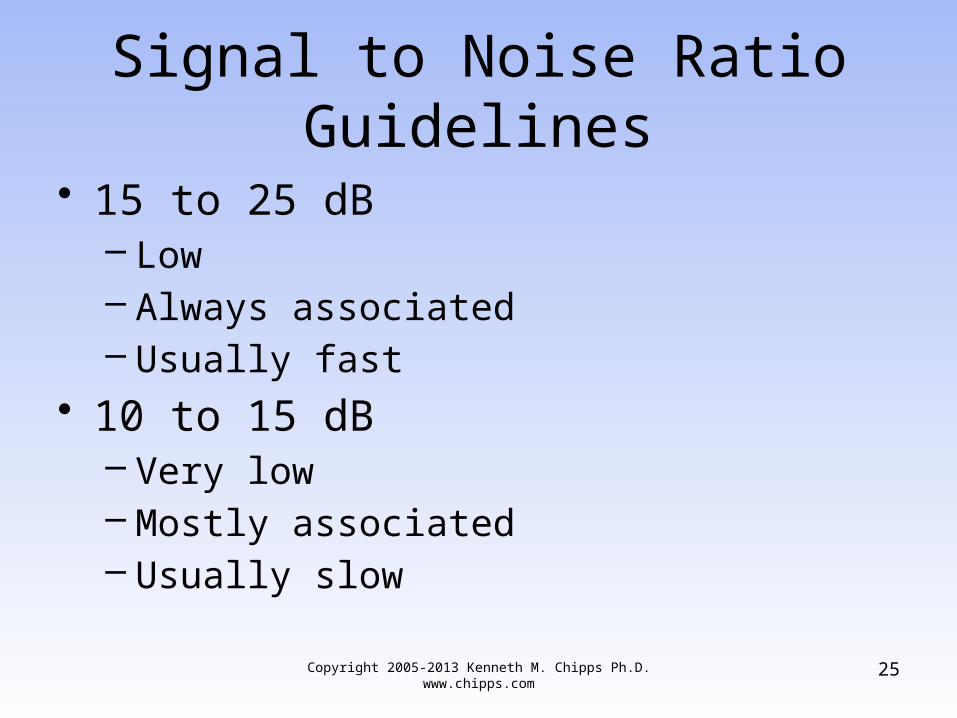
• 15 to 25 dB– Low– Always associated– Usually fast
• 10 to 15 dB– Very low– Mostly associated– Usually slow
Copyright 2005-2013 Kenneth M. Chipps Ph.D. www.chipps.com
25

Signal to Noise Ratio Guidelines
• 5 to 10 dB– No signal– Not associated– Not useable
26Copyright 2005-2013 Kenneth M. Chipps Ph.D. www.chipps.com
Signal Levels
• Some devices are more demanding of a strong signal than others
• A suggested minimum is
Copyright 2005-2013 Kenneth M. Chipps Ph.D. www.chipps.com
27

Signal Levels
Copyright 2005-2013 Kenneth M. Chipps Ph.D. www.chipps.com
28

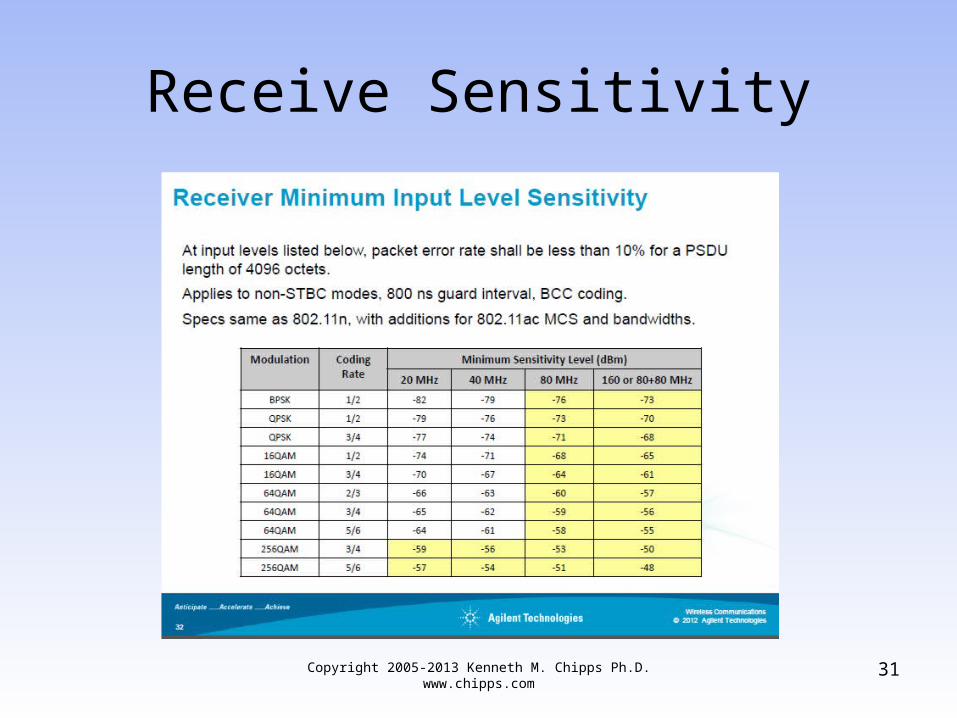
Receive Sensitivity
• Next in importance in maintaining a high data rate connection is the receive sensitivity of the radio
• Here are the sensitivities required for various data rates from a white paper from Juniper Network in 2011 and from Agilent from January 2012
Copyright 2005-2013 Kenneth M. Chipps Ph.D. www.chipps.com
29

Receive Sensitivity
Copyright 2005-2013 Kenneth M. Chipps Ph.D. www.chipps.com
30
Receive Sensitivity
Copyright 2005-2013 Kenneth M. Chipps Ph.D. www.chipps.com
31

Access Point Spacing
• Gast reports in his 802.11ac book that in general a single access point can provide coverage for about 3000 sf regardless of the 802.11 version used
• According to a White Paper by Gigawave provided by Global Knowledge from 2009 access points should be between 40 and 70 feet from each other for good coverage
Copyright 2005-2013 Kenneth M. Chipps Ph.D. www.chipps.com
32

Access Point Spacing
• They should not be any closer to each other than 28 feet
• Antennas should not be higher than 20 feet
Copyright 2005-2013 Kenneth M. Chipps Ph.D. www.chipps.com
33
The Low Data Rate Problem
• An additional problem with allowing the lower data rates on a network designed for high capacity is pointed out by Juniper in the same white paper
• As they say
Copyright 2005-2013 Kenneth M. Chipps Ph.D. www.chipps.com
34

The Low Data Rate Problem
– The shared media nature of 802.11n means that the problems related to a highly variable association rate are aggravated by Head-of-Line Blocking, because there is nothing to stop the transmission of larger, low priority packets ahead of smaller, high priority packets on ingress
Copyright 2005-2013 Kenneth M. Chipps Ph.D. www.chipps.com
35
The Low Data Rate Problem
– Because more clients might be connected at the lower link rates, an access point’s aggregate throughput can plummet when it needs to allocate more airtime to those users transferring data at low rates
Copyright 2005-2013 Kenneth M. Chipps Ph.D. www.chipps.com
36

The Low Data Rate Problem
– To make matters worse, the low rate users on the edge of the network also tie up a disproportionate amount of airtime—50% of all users might be consuming more than 70% of airtime, for example—degrading performance for everyone else sharing the same radio
– Transmission of a 1 MB file at the MCS0 rate takes 20 times longer than transmission at MCS15
Copyright 2005-2013 Kenneth M. Chipps Ph.D. www.chipps.com
37

The Low Data Rate Problem
– Because 802.11n uses a shared media paradigm, only one client can transmit data at a time, which means that all other clients must wait their turn to transmit
Copyright 2005-2013 Kenneth M. Chipps Ph.D. www.chipps.com
38
Reduce Power
• The next point Juniper makes is the gains achieved by reducing the transmit power of the access points– While turning down transmit power may seem
counterintuitive, a reduction in transmit power levels is a valuable technique for maximizing throughput for both an access point and its neighbors
Copyright 2005-2013 Kenneth M. Chipps Ph.D. www.chipps.com
39
Reduce Power
– Turning down the power slightly reduces the radius of the service area, but it also reduces interference by a much greater factor
– Turning down transmit power is a prudent and proven technique for maximizing throughput for an access point and its neighbors in a high-density deployment
– This makes it a best practice for a WLAN designer to streamline a wireless cell for optimal performance
Copyright 2005-2013 Kenneth M. Chipps Ph.D. www.chipps.com
40

High Capacity Summary
Copyright 2005-2013 Kenneth M. Chipps Ph.D. www.chipps.com
41

Next Steps to Higher Capacity
• In the future as client devices are produced with better MIMO support this will increase throughput for these high capacity networks
Copyright 2005-2013 Kenneth M. Chipps Ph.D. www.chipps.com
42
Other Considerations
• In addition to the above the following needs to be considered in wireless network design
Copyright 2005-2013 Kenneth M. Chipps Ph.D. www.chipps.com
43

Site Considerations
• Things to consider when designing a network that will use wireless devices include– Materials the site is made of– Size of the network– Existing networks– Mounting points– Electrical power for the access points– Purpose of the network
44Copyright 2005-2013 Kenneth M. Chipps Ph.D. www.chipps.com

Site Considerations
– Bandwidth required– Roaming required– Security requirements
Copyright 2005-2013 Kenneth M. Chipps Ph.D. www.chipps.com
45

Materials Effect on Signal Loss
• The materials in the site have a major impact on the received signal strength and therefore on the coverage area
• Different materials have different effects on the radio waves in order of most to least– Metal in walls– Tinted or coated windows– Metal in ceilings or floors
46Copyright 2005-2013 Kenneth M. Chipps Ph.D. www.chipps.com

Materials Effect on Signal Loss
– Wood– Glass– Brick and concrete
• The building’s construction has a major impact
• Radio signal obstructions commonly found in buildings include– Steel studs in walls– Steel doors
Copyright 2005-2013 Kenneth M. Chipps Ph.D. www.chipps.com
47

Materials Effect on Signal Loss
– Large structures inside the building• These large structures, such as elevator
shafts and stairwells, have considerable metal in their structure
• These areas will cast a radio signal shadow or area where the signal is entirely blocked
• Steel reinforced floors have the same effect
48Copyright 2005-2013 Kenneth M. Chipps Ph.D. www.chipps.com

Materials Effect on Signal Loss
• In an office environment the furniture itself may also have an effect, for example– Metal filing cabinets– Metal mesh furniture
• In a warehouse environment other elements may come into play, such as– Metal racks– The products themselves as
49Copyright 2005-2013 Kenneth M. Chipps Ph.D. www.chipps.com

Materials Effect on Signal Loss
• Anything with a high water content will block the signal
• This is true of both the product and the packaging• Paper and cardboard can have a high water
content
Copyright 2005-2013 Kenneth M. Chipps Ph.D. www.chipps.com
50

Materials Effect on Signal LossObstruction Additional Loss
dBEffective Range
Feet
Open Space 0 Up to 100
Window – Glass 3 70
Window – Metal Tint 5-8 50
Drywall 5-8 50
Woodwall 10 30
6” Wall 15-20 15
12” Wall 20-25 10
Floor/Ceiling 15-20 15
Floor/Ceiling – Thick 20-25 10
51Source: CWNA Study Guide Page 336 Copyright 2005-2013 Kenneth M. Chipps Ph.D. www.chipps.com

Materials Effect on Signal LossType of Building Loss in dBs Frequency in MHz
Grocery Store 5.2 914
Retail Store 8.7 914
Open Plan Factory 7.9 1300
Open Plan Factory 3.7 1300
Open Plan Factory 4.0 1300
Open Plan Factory 9.2 1300
Open Plan Factory 9.7 1300
Open Plan Office Building 9.6 915
Open Plan Office Building 14.1 1900
Open Plan Office Building wit Partitions 14.2 915
Open Plan Office Building with Partitions 12.7 1900
52
These figures are from a study on cellular phone frequency penetration with frequencies in the 910 to 1900 MHz range. It is unclear from the text, but these appear to be average loss figures for the building as a whole.
Sarkar and others from IEEE Antennas and Propagation Magazine Vol.45 No.3 June 2003
Copyright 2005-2013 Kenneth M. Chipps Ph.D. www.chipps.com

Materials Effect on Signal LossLocation Loss in dBs
Building 1 1 Floor 12.9
2 Floors 18.7
3 Floors 24.4
4 Floors 27.0
Building 2 1 Floor 16.2
2 Floors 27.5
3 Floors 31.6
53
These figures are from a study on cellular phone frequency penetration with frequencies in the 910 to 1900 MHz range. Sarkar and others from IEEE Antennas and Propagation Magazine Vol.45 No.3 June 2003
Copyright 2005-2013 Kenneth M. Chipps Ph.D. www.chipps.com

802.11bb/g Coverage
• In general when using 802.11b/g equipment in a typical office environment it is safe to assume a 30 dB loss for every 100 feet
• This translates into– In a closed office
• 50 to 60 feet
– In an office setup with cubicles• 90 feet
54Copyright 2005-2013 Kenneth M. Chipps Ph.D. www.chipps.com

802.11b/g Coverage
– In hallways and large rooms• 150 feet
• For the number of walls that can be penetrated– Solid concrete
• One or two
– Concrete blocks• Three to four
– Wood and drywall• Five to six
55Copyright 2005-2013 Kenneth M. Chipps Ph.D. www.chipps.com

802.11a Coverage
• The coverage area for 802.11a is less than 802.11b/g
• This is due to the use of a higher frequency
• The same area can be covered as 802.11b/g, but the number of access points will have to be increased
56Copyright 2005-2013 Kenneth M. Chipps Ph.D. www.chipps.com
Attaching to the Wired Network
• As part of the wireless design the attachment or attachments to the wired network must be considered as well
• There are two ways to attach the AP to the wired network– Use a separate switch for the wired network
and another one for the wireless network– Use one switch with VLANs used to divide
ports between wired and wireless networks
57Copyright 2005-2013 Kenneth M. Chipps Ph.D. www.chipps.com
Isolation of the Network
• In addition to using a separate switch or VLAN for the wireless network, further isolation of the wireless from the wired network can be provided by placing the wireless equipment in a DMZ area
• This is an area that is isolated from the wired network by a firewall
58Copyright 2005-2013 Kenneth M. Chipps Ph.D. www.chipps.com

Isolation of the Network
• Regardless of the method used to attach to the wired network and no matter how large the wireless network is, all access points should be in a single IP address subnet to provide isolation for the wireless network
• A separate DHCP server should be used for the wireless clients
Copyright 2005-2013 Kenneth M. Chipps Ph.D. www.chipps.com
59

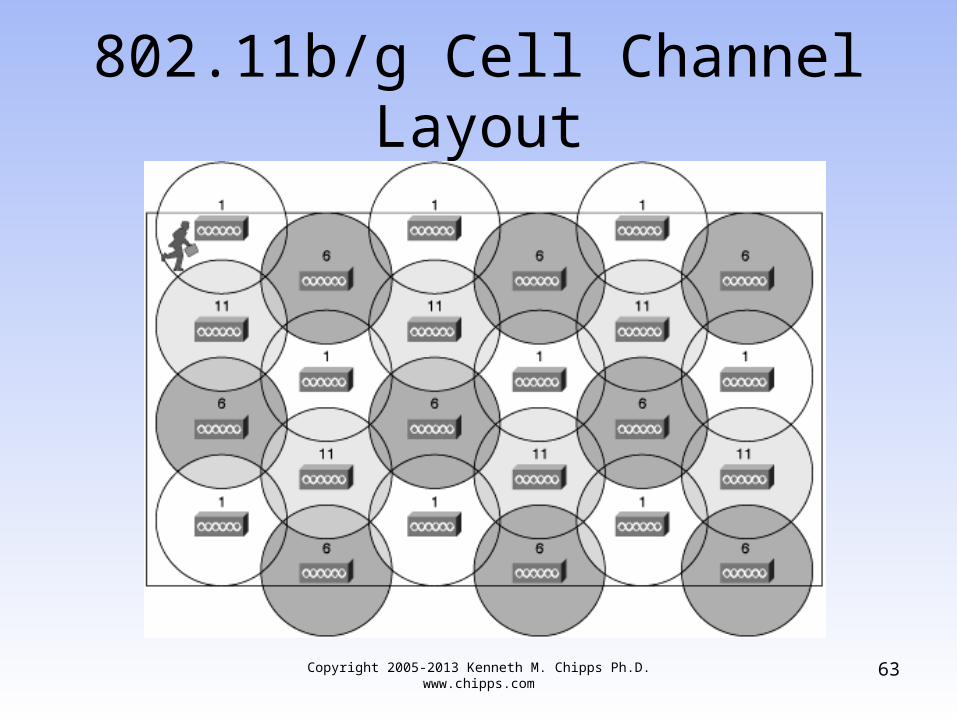
802.11b/g Channel Layout
• One problem with increasing the coverage area of an 802.11b/g network is the limited number of channels
• Although there are 11 channels, any channel used must be separated by at least 5 channels
60Copyright 2005-2013 Kenneth M. Chipps Ph.D. www.chipps.com

802.11b/g Channel Layout
• These then are the three channels that can be used– 1– 6– 11
• These channels can be used to increase the coverage area
• Three APs can also be used to serve a single area, thereby increasing throughput
Copyright 2005-2013 Kenneth M. Chipps Ph.D. www.chipps.com
61

802.11b/g Cell Channel Layout
1CHANNEL 11CHANNEL 11 1CHANNEL 6
1CHANNEL 61CHANNEL 1 1CHANNEL 11
1CHANNEL 111CHANNEL 6 1CHANNEL 1 1CHANNEL 1 1CHANNEL 11
1CHANNEL 1
1CHANNEL 61CHANNEL 1 1CHANNEL 11 1CHANNEL 1
1CHANNEL 11CHANNEL 11 1CHANNEL 6
62Copyright 2005-2013 Kenneth M. Chipps Ph.D. www.chipps.com
802.11b/g Cell Channel Layout
63Copyright 2005-2013 Kenneth M. Chipps Ph.D. www.chipps.com

802.11b/g Cell Channel Layout
64Copyright 2005-2013 Kenneth M. Chipps Ph.D. www.chipps.com

802.11b/g Channel Layout
• As a general rule the useable transmission radius of an access point should not overlap more than two other access points
• In other words no single point anywhere on the plan should be touched by more than three circles
• In practice it is often possible to use channels 1, 4, 8, and 11 in the same area at the same time
65Copyright 2005-2013 Kenneth M. Chipps Ph.D. www.chipps.com

802.11b/g Channel Layout
• There is minimal overlap among this set of channels
Copyright 2005-2013 Kenneth M. Chipps Ph.D. www.chipps.com
66
Transmitting Power
• As the amount of power that can be used by a transmitting device is regulated in most countries, this is not a variable that can be adjusted for the most part
• Many people want to immediately amplify a signal to allow more devices to receive it
• But as a wireless network must talk back and forth, amplification at one end is going to call for amplification at the other end as well
67Copyright 2005-2013 Kenneth M. Chipps Ph.D. www.chipps.com

Transmitting Power
• The second problem with amplifying the desired signal is that it also amplifies the noise
• Usually amplification is not as useful as it would seem at first
• Higher gain antennas are a better choice
Copyright 2005-2013 Kenneth M. Chipps Ph.D. www.chipps.com
68
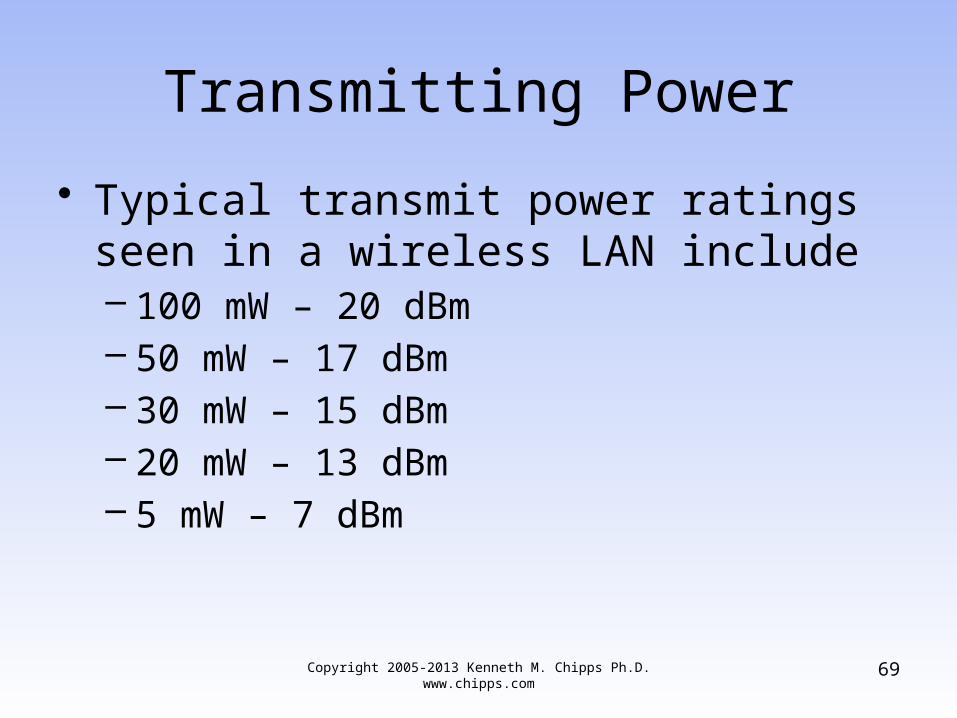
Transmitting Power
• Typical transmit power ratings seen in a wireless LAN include– 100 mW – 20 dBm– 50 mW – 17 dBm– 30 mW – 15 dBm– 20 mW – 13 dBm– 5 mW – 7 dBm
69Copyright 2005-2013 Kenneth M. Chipps Ph.D. www.chipps.com
Errors
• Even though a readable signal at an acceptable data rate may be present, if too many errors occur, then the network will be unusable due to excessive traffic from retransmissions
• Both the CRC error count and the packet retry count indicate the presence of bad packets on the wireless network
70Copyright 2005-2013 Kenneth M. Chipps Ph.D. www.chipps.com
An Error Metric
• An error metric to use is the percentage of bad packets to good packets at the data rate of interest
• Recall that on a wireless network the data rate can vary
• The problem is finding a tool to provide this information
71Copyright 2005-2013 Kenneth M. Chipps Ph.D. www.chipps.com
Errors
• If the network has less than 10 percent bad packets at the desired speed, it is operating properly
• If the network has more than 30 percent bad packets at the desired speed, it needs attention
• Keep the operating speed in mind• A network that has less than 10 percent
bad frames, but is only working at 2 Mbps is not what is desired
72Copyright 2005-2013 Kenneth M. Chipps Ph.D. www.chipps.com

CRC Errors
• Now for some details on the two types of errors mentioned above
• Every frame ends with a FCS – Frame Check Sequence, more commonly called the CRC – Cyclic Redundancy Check
• Whenever the bits in the frame have been corrupted the CRC calculated by the receiver will not match the CRC that was stored in the frame by the sender
73Copyright 2005-2013 Kenneth M. Chipps Ph.D. www.chipps.com

CRC Errors
• In such a case the frame is discarded by the receiver
Copyright 2005-2013 Kenneth M. Chipps Ph.D. www.chipps.com
74
Retry Packet Count
• The second type of error occurs when a frame is not acknowledged, it is assumed to have not arrived and is resent
• In this case the retry packet count will go up
• This is seen in the Retry field of the 802.11 MAC Header
• For a normal frame the bit is set to 0, on a retry it is set to 1
75Copyright 2005-2013 Kenneth M. Chipps Ph.D. www.chipps.com
Path Loss
• What produces the variation in all of this, data rate and signal strength and error count, is the path loss that is always present in a wireless as opposed to a wired network
• In some cases calculations based on the actual environment in which the network will be installed are called for, rather than just using estimates and guidelines
76Copyright 2005-2013 Kenneth M. Chipps Ph.D. www.chipps.com

Real World Path Loss
• Formulas tend to reflect a lab environment• They must be adjusted for the much dirtier
and RF obstructed real world• For example in a typical office, just the
structure, such as wallboard, that makes the offices themselves will increase signal loss
77Copyright 2005-2013 Kenneth M. Chipps Ph.D. www.chipps.com
Real World Path Loss
• If the environment has an unusual amount of metal objects, such as metal wall studs, shelving and so forth, or the environment has a high water content, such as plants, then the signal loss will be greater
• This is especially if we are talking about an 802.11b/g network at 2.4 GHz
Copyright 2005-2013 Kenneth M. Chipps Ph.D. www.chipps.com
78

Calculating Path Loss
• Let’s do a calculation for a typical real world office environment
• Assume– 100 mW access point transmitting at 20 dBm
• Most 802.11b/g APs have transmitter output power of 15 to 20 dBm’s
– Receiver 75 feet from the access point– 8 walls in between the AP and the receiver at
6 dB per wall
79Copyright 2005-2013 Kenneth M. Chipps Ph.D. www.chipps.com
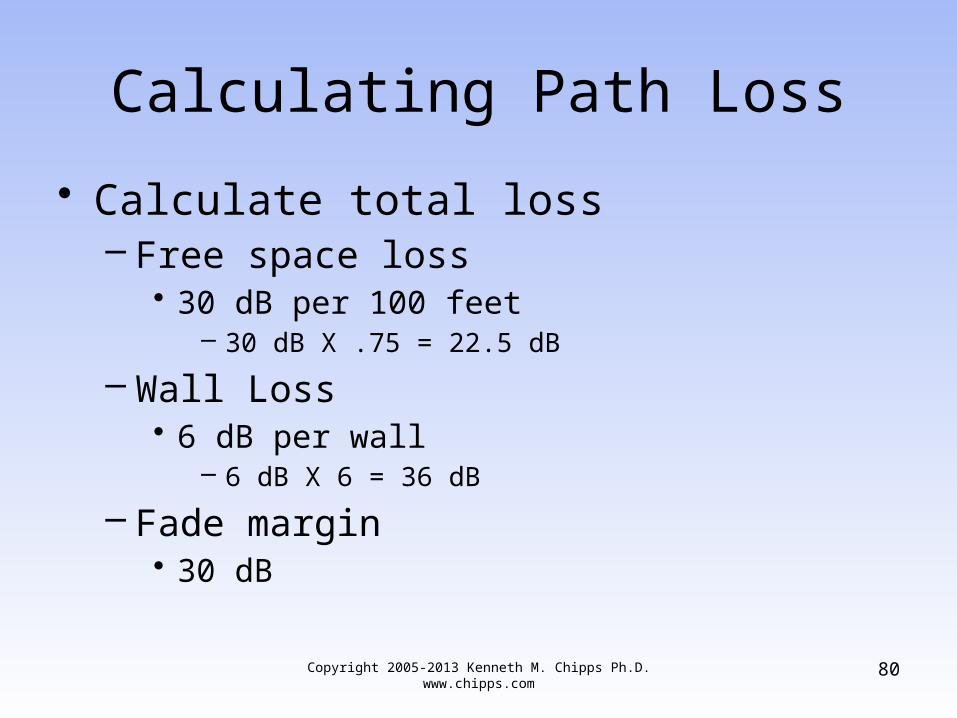
Calculating Path Loss
• Calculate total loss– Free space loss
• 30 dB per 100 feet– 30 dB X .75 = 22.5 dB
– Wall Loss• 6 dB per wall
– 6 dB X 6 = 36 dB
– Fade margin• 30 dB
80Copyright 2005-2013 Kenneth M. Chipps Ph.D. www.chipps.com

Calculating Path Loss
– Total Loss• 22.5 dB + 36 dB + 30 dB = 88.5 dB
• Free Space Loss– Free space loss is the loss that would be
experienced in a vacuum– It is the natural spreading out of the signal
much as water spreads out as it leaves the end of a hose
– As frequency increases, so does free space loss
81Copyright 2005-2013 Kenneth M. Chipps Ph.D. www.chipps.com
Calculating Path Loss
– As stated above it can be estimated as 30 dB per 100 feet for an 802.11b/g network
• Wall Loss– This is the added loss that occurs when the
signal not only has to traverse free space, but also penetrate a wall
– Here six walls
82Copyright 2005-2013 Kenneth M. Chipps Ph.D. www.chipps.com

Calculating Path Loss
• Fade Margin– This is the way engineers try to account for
the known but unmeasurable effects of things encountered in the environment, such as reflection, absorption, refraction, and diffraction of the RF signal
– This is basically a fudge factor– 20 to 30 dB is a common value for this in a
wireless LAN
Copyright 2005-2013 Kenneth M. Chipps Ph.D. www.chipps.com
83

Calculating Path Loss
• For the industrious there is also the Barnett-Vignant reliability equation
• F = 30LOG10(D) + 10LOG10(6ABf) – 10LOG10(1 – R) – 70
• F = fade margin in dB• D = distance in kilometers• A = terrain roughness factor, where 4 is used for a
smooth surface, 1 for average, and .25 for rough• B = weather factor, where 1 is for the worst
case, .5 for hot humid areas, .25 for inland areas, and .125 for dry or mountainous areas
84Copyright 2005-2013 Kenneth M. Chipps Ph.D. www.chipps.com

Calculating Path Loss
• f = frequency in GHz• R = reliability expressed as a decimal, such
as .9999
Copyright 2005-2013 Kenneth M. Chipps Ph.D. www.chipps.com
85
Calculating Path Loss
• The result would be at the receiver 75 feet from the AP with the eight walls in between– 20 dBm – 88.5 dB = -68.5 dBm
• Based on the guideline given above of at least -65 dBm being required at the receiver, this location is too far away
86Copyright 2005-2013 Kenneth M. Chipps Ph.D. www.chipps.com
Calculating Path Loss
• But a signal would still be receivable as the -68.5 figure is within the minimum range called for by the standard
Copyright 2005-2013 Kenneth M. Chipps Ph.D. www.chipps.com
87

Calculating Path Loss
• Either the– Access point will have to be relocated– The receiver will have to be relocated– A directional antenna aimed toward the
receiver will have to be installed– Some of the obstructions to the RF signal will
have to be removed, such as busting a large hole in a couple of the walls
– Well not really, but you get the idea
88Copyright 2005-2013 Kenneth M. Chipps Ph.D. www.chipps.com

Wiring for Access Points
• The introduction of 802.11n will bring changes to the way cabling is provided to access points
• Even though the theoretical 600 Mbps speeds discussed are unlikely, speeds of 75 to 150 Mbps are likely in a pure 802.11n environments
89Copyright 2005-2013 Kenneth M. Chipps Ph.D. www.chipps.com

Wiring for Access Points
• This means each of these access points will need at least a 100 Mbps wired connection back to the MDF
• In a large environment where multiple access points connect to an IDF with a single backbone cable to the MDF a Gigabit wired connection may be needed as the aggregate from the multiple access points will surely exceed 100 Mbps
Copyright 2005-2013 Kenneth M. Chipps Ph.D. www.chipps.com
90

Wiring for Access Points
• In an ideal 802.11n environment, you might even consider a 10G backbone
Copyright 2005-2013 Kenneth M. Chipps Ph.D. www.chipps.com
91

Alternative to Rewiring
• Motorola has an interesting access point that can be installed in place of an existing RJ-45 jack in a room
• The existing wallplate is removed• A short cable connects the existing RJ-45
jack to the AP• The AP is mounted to the existing hole in
the wall
Copyright 2005-2013 Kenneth M. Chipps Ph.D. www.chipps.com
92

Alternative to Rewiring
• This provides a tight signal for just one room, such as in a dormitory, classroom, patient room, or hotel
• This can be standalone or centrally managed
• Here is what it looks like
Copyright 2005-2013 Kenneth M. Chipps Ph.D. www.chipps.com
93

Alternative to Rewiring
Copyright 2005-2013 Kenneth M. Chipps Ph.D. www.chipps.com
94

Bandwidth Requirements
• What type of bandwidth do you really need for common wireless network uses
• A BICSI newsletter from June 2008 suggested these numbers
95Copyright 2005-2013 Kenneth M. Chipps Ph.D. www.chipps.com

Bandwidth Requirements
96Copyright 2005-2013 Kenneth M. Chipps Ph.D. www.chipps.com

Over Subscription
• Of course you do not need to provide the maximum data rate to each user at every moment in time
• Just like in a retail establishment queuing theory tells you that not everyone will do the same thing at the same time
• The same BICSI newsletter suggested these over subscription rates
97Copyright 2005-2013 Kenneth M. Chipps Ph.D. www.chipps.com

Over Subscription
98Copyright 2005-2013 Kenneth M. Chipps Ph.D. www.chipps.com

Tools Used
• At present there is no single, low cost tool that can be used to do a site survey for a LAN
• To work around this most people do one or both of the following– They rely on the guidelines discussed above– They just use the tools that are supplied with
the hardware they are installing
99Copyright 2005-2013 Kenneth M. Chipps Ph.D. www.chipps.com

Spectrum Analyzer
• Let’s discuss some of these common tools– Spectrum Analyzer– Site Survey Tool– Network Analyzer
• A spectrum analyzer is used to look for and measure the strength of radio frequency signals within the band to be used
100Copyright 2005-2013 Kenneth M. Chipps Ph.D. www.chipps.com

Spectrum Analyzer
• This device is expensive, from $2,000 to $10,000 depending on the features and frequencies included
• It looks like this
Copyright 2005-2013 Kenneth M. Chipps Ph.D. www.chipps.com
101

Spectrum Analyzer
102Copyright 2005-2013 Kenneth M. Chipps Ph.D. www.chipps.com
Spectrum Analyzer
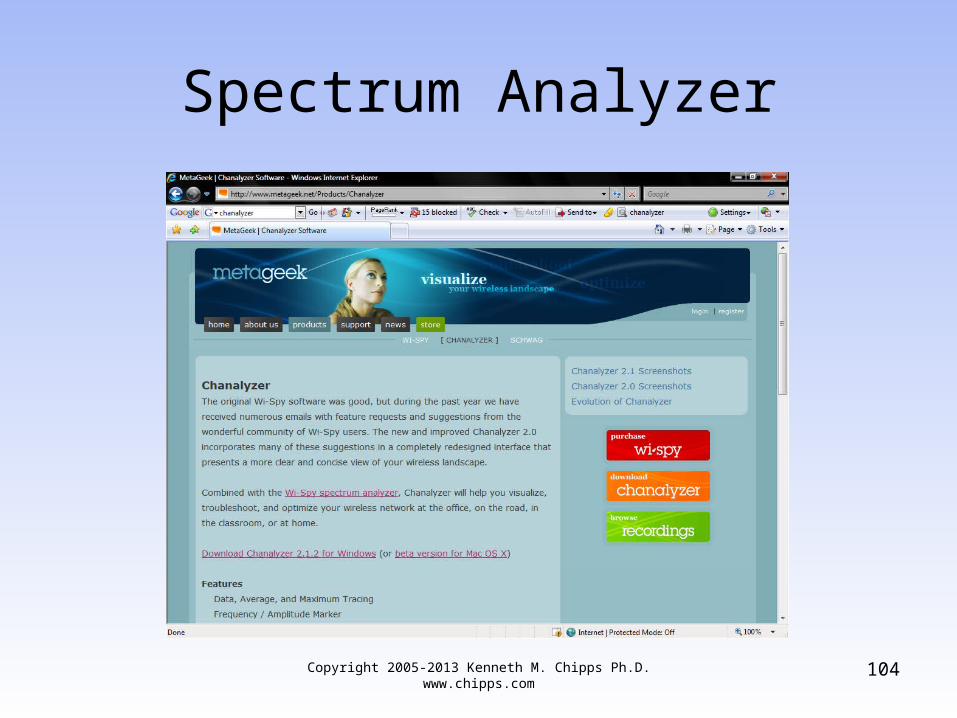
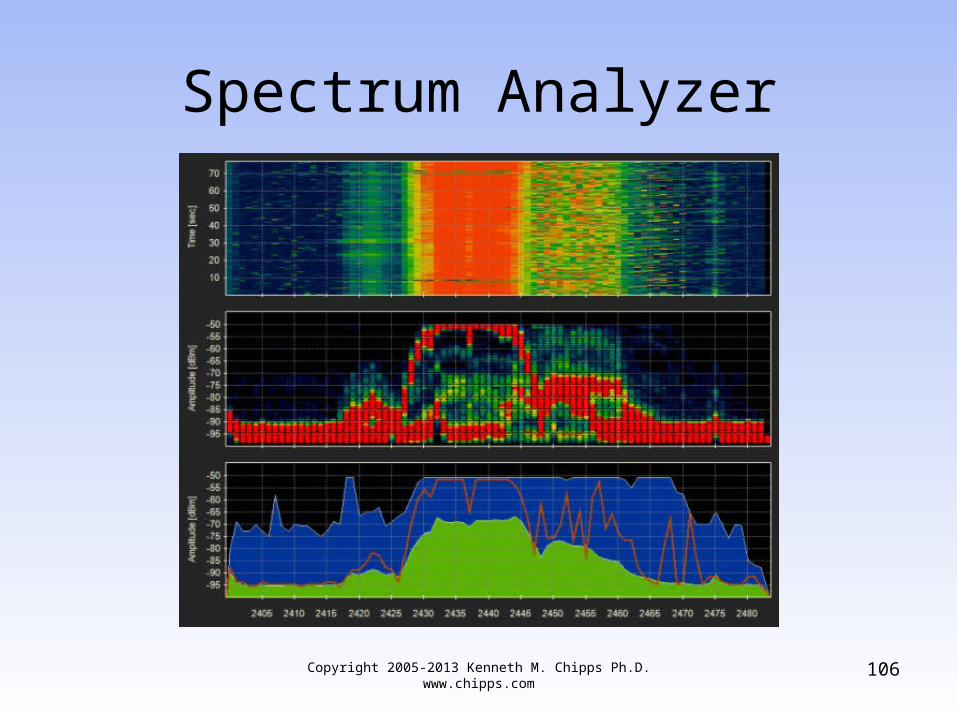
• Be sure to buy one with a peak hold function
• There are low cost very basic spectrum analyzers that can be used for 802.11 networks
• One of these is by Metageek• The hardware is a USB receiver
103Copyright 2005-2013 Kenneth M. Chipps Ph.D. www.chipps.com
Spectrum Analyzer
Copyright 2005-2013 Kenneth M. Chipps Ph.D. www.chipps.com
104

Spectrum Analyzer
Copyright 2005-2013 Kenneth M. Chipps Ph.D. www.chipps.com
105
Spectrum Analyzer
Copyright 2005-2013 Kenneth M. Chipps Ph.D. www.chipps.com
106
Site Survey Tool
• Once it has been determined that the site is free of any interference that might cause a problem for the frequencies to be used, measurements can be taken to determine if the placement of the devices is suitable
• The tool for this is one that will measure at least– Signal strength– Noise level
107Copyright 2005-2013 Kenneth M. Chipps Ph.D. www.chipps.com

Site Survey Tool
• As discussed above the best way to use these two measurements is to display a signal to noise ratio
Copyright 2005-2013 Kenneth M. Chipps Ph.D. www.chipps.com
108

Site Survey Tool
109Copyright 2005-2013 Kenneth M. Chipps Ph.D. www.chipps.com

Site Survey Tool
• As seen on this tool from Cisco’s the most important parameters– Signal Strength– Noise Level– Signal to Noise Ratio
• The screenshot above is from the tool running in passive mode
• In active mode it gives an indication of the errors being seen on the network
110Copyright 2005-2013 Kenneth M. Chipps Ph.D. www.chipps.com

Site Survey Tool
111Copyright 2005-2013 Kenneth M. Chipps Ph.D. www.chipps.com
Site Survey Tool
• In this case things look pretty good as no errors are showing right now
• The way to use this tool is to set it up on a laptop
• Then walk around the site to check the effect on signal and noise levels
• By doing this the suitability of the original plan can be determined and devices rearranged as required
112Copyright 2005-2013 Kenneth M. Chipps Ph.D. www.chipps.com

Network Analyzer
• A network analyzer, such as Sniffer Wireless from Network Associates or AiroPeek from Wild Packets, will show some information useful for a site survey
• Sniffer Wireless will be used to illustrate this
113Copyright 2005-2013 Kenneth M. Chipps Ph.D. www.chipps.com

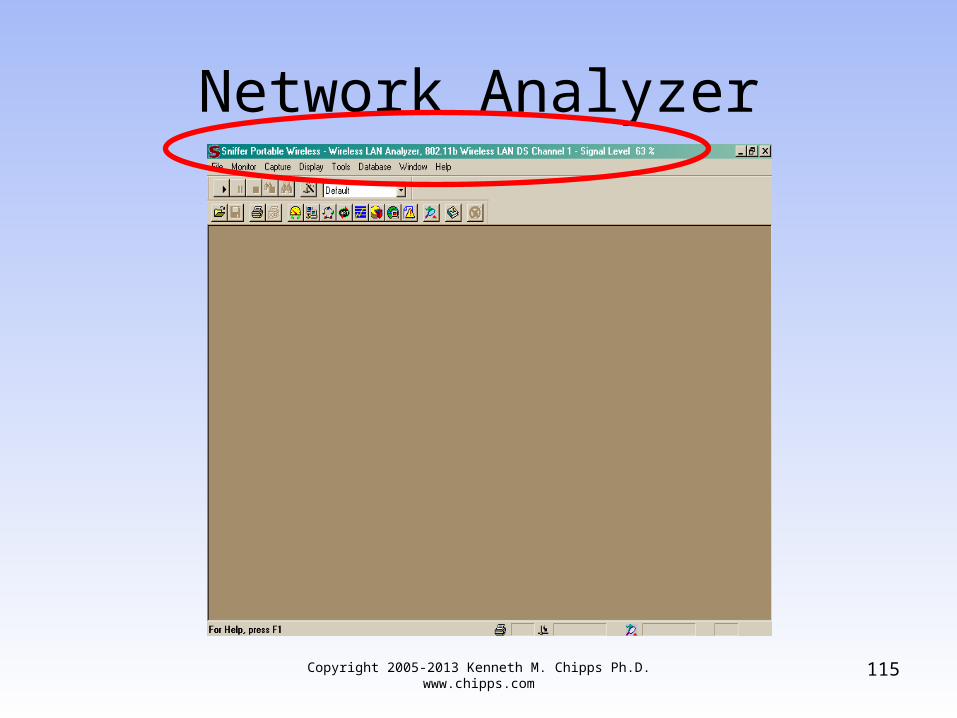
Network Analyzer
• The opening display is the same as Sniffer has been for quite a while
• The only apparent difference for a wireless network is in the title bar
114Copyright 2005-2013 Kenneth M. Chipps Ph.D. www.chipps.com
Network Analyzer
115Copyright 2005-2013 Kenneth M. Chipps Ph.D. www.chipps.com

Network Analyzer
116Copyright 2005-2013 Kenneth M. Chipps Ph.D. www.chipps.com

Network Analyzer
• In the title bar we can see that– This is a wireless network– It is using 802.11b/g– The modulation scheme is DSSS– The current channel is 1– The signal strength on channel 1 is 63%
117Copyright 2005-2013 Kenneth M. Chipps Ph.D. www.chipps.com

Gauge Dashboard View
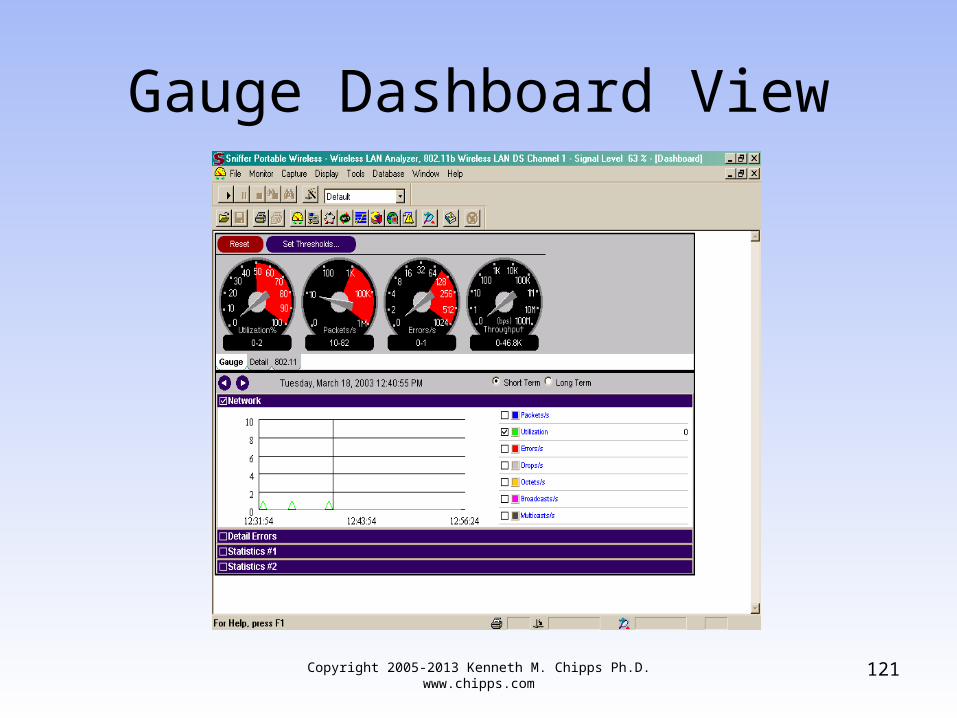
• To make the dashboard appear, click on the dashboard button on the toolbar
118Copyright 2005-2013 Kenneth M. Chipps Ph.D. www.chipps.com

Gauge Dashboard View
119Copyright 2005-2013 Kenneth M. Chipps Ph.D. www.chipps.com

Gauge Dashboard View
• The dashboard is a set of gauges showing– Utilization– Packets per Second– Errors per Second– Throughput
• Below this is a line chart– Utilization is selected by default– Other lines can be added by checking the
boxes120Copyright 2005-2013 Kenneth M. Chipps Ph.D.
www.chipps.com
Gauge Dashboard View
121Copyright 2005-2013 Kenneth M. Chipps Ph.D. www.chipps.com

Detail Dashboard View
• The information seen in the gauges can be expanded to show more detail by clicking the Detail tab
122Copyright 2005-2013 Kenneth M. Chipps Ph.D. www.chipps.com

Detail Dashboard View
123Copyright 2005-2013 Kenneth M. Chipps Ph.D. www.chipps.com

Detail Dashboard View
124Copyright 2005-2013 Kenneth M. Chipps Ph.D. www.chipps.com

Detail Dashboard View
• Two items in this view relate specifically to wireless networks
125Copyright 2005-2013 Kenneth M. Chipps Ph.D. www.chipps.com

Detail Dashboard View
126Copyright 2005-2013 Kenneth M. Chipps Ph.D. www.chipps.com

Detail Dashboard View
127Copyright 2005-2013 Kenneth M. Chipps Ph.D. www.chipps.com

Detail Dashboard View
• PLCP and WEP ICV are peculiar to a wireless network
• PLCP is a physical layer sublayer– What is shown here are the number of PLCP
errors seen on the network– PLCP errors occur when a wireless station
receives a Physical Layer Convergence Protocol header with an invalid checksum
128Copyright 2005-2013 Kenneth M. Chipps Ph.D. www.chipps.com

Detail Dashboard View
• WEP ICV refers to the security on a wireless network– This is the number of packets sent indicating
an invalid WEP ICV
Copyright 2005-2013 Kenneth M. Chipps Ph.D. www.chipps.com
129
The Problem With the Tools
• We will stop here as there is much more that a network analyzer can do that relates to a wireless network, but this is covered in detail in the How to use Sniffer Wireless presentation
• As can be seen there is no single, low cost tool that gives us all of the parameters we need
130Copyright 2005-2013 Kenneth M. Chipps Ph.D. www.chipps.com

The Problem With the Tools
• Specialized tools can be purchased for this purpose, but they can be expensive
• AirMagnet is an example of this type of tool
Copyright 2005-2013 Kenneth M. Chipps Ph.D. www.chipps.com
131

Automatic Design
• Some companies are attempting automate more and more of the installation and management of wireless networks
• For example Aruba Wireless Networks has a product called RF Director
• When using the Aruba APs with this tool an AutoCAD drawing of a building can be imported
132Copyright 2005-2013 Kenneth M. Chipps Ph.D. www.chipps.com

Automatic Design
• Based on this and standard parameters the Aruba tool places the APs on this diagram, as well as selecting the channels to use and the power settings
• Once the APs are installed the tool is run again
• It then adjusts the settings based on the actual affects of the building on the wireless signal
Copyright 2005-2013 Kenneth M. Chipps Ph.D. www.chipps.com
133
Testing
• If the calculations are not definitive or if the network is so critical that it must work right out of the box, then a test network may be called for
• To check the data rate and the other factors, lay out a typical network, including workstations, in the actual environment
134Copyright 2005-2013 Kenneth M. Chipps Ph.D. www.chipps.com

Testing
• Then transfer data between devices using some sort of automated operation, such as a batch file, a NIC utility program, or a program designed for this
• Examples of this type of program include– FTP transfers, although the requirement of
FTP to read and write to disks may affect the result
Copyright 2005-2013 Kenneth M. Chipps Ph.D. www.chipps.com
135

Testing
– Netperf, a free tool from www.netperf.org– Two products from NetIQ, the free QCheck
and the more powerful Chariot• Once the data is flowing, measure the
data rate, signal strength, and errors at various parts of the network
136Copyright 2005-2013 Kenneth M. Chipps Ph.D. www.chipps.com