Winter 2017 Investor Presentation
23
©2015 First American Financial Corporation and/or its affiliates. All rights reserved. q NYSE: FAF First American Financial Winter 2017 Investor Presentation
-
Upload
firstamericaninvestors -
Category
Investor Relations
-
view
2.259 -
download
3
Transcript of Winter 2017 Investor Presentation

©2015 First American Financial Corporation and/or its affiliates. All rights reserved. q NYSE: FAF
FirstAmericanFinancialWinter2017InvestorPresentation

SafeHarborStatement
2
CERTAINSTATEMENTSMADEINTHISPRESSRELEASEANDTHERELATEDMANAGEMENTCOMMENTARYCONTAIN,ANDRESPONSESTOINVESTORQUESTIONSMAYCONTAIN,FORWARD-LOOKINGSTATEMENTSWITHINTHEMEANINGOFSECTION27AOFTHESECURITIESACTOF1933,ASAMENDED,ANDSECTION21EOFTHESECURITIESEXCHANGEACTOF1934,ASAMENDED.THESEFORWARD-LOOKINGSTATEMENTSCANBEIDENTIFIEDBYTHEFACTTHATTHEYDONOTRELATESTRICTLYTOHISTORICALORCURRENTFACTSANDMAYCONTAINTHEWORDS“BELIEVE,”“ANTICIPATE,”“EXPECT,”“INTEND,”“PLAN,”“PREDICT,”“ESTIMATE,”“PROJECT,”“WILLBE,”“WILLCONTINUE,”“WILLLIKELYRESULT,” OR OTHERSIMILARWORDSANDPHRASESORFUTUREORCONDITIONALVERBSSUCHAS“WILL,”“MAY,”“MIGHT,”“SHOULD,”“WOULD,”OR“COULD.”THESEFORWARD-LOOKINGSTATEMENTSINCLUDE,WITHOUTLIMITATION,STATEMENTSREGARDINGFUTUREOPERATIONS,PERFORMANCE,FINANCIALCONDITION,PROSPECTS,PLANSANDSTRATEGIES.THESEFORWARD-LOOKINGSTATEMENTSAREBASEDONCURRENTEXPECTATIONSANDASSUMPTIONSTHATMAYPROVETOBEINCORRECT.
RISKSANDUNCERTAINTIESEXISTTHATMAYCAUSERESULTSTODIFFERMATERIALLYFROMTHOSESETFORTHINTHESEFORWARD-LOOKINGSTATEMENTS.FACTORSTHATCOULDCAUSETHEANTICIPATEDRESULTSTODIFFERFROMTHOSEDESCRIBEDINTHEFORWARD-LOOKINGSTATEMENTSINCLUDE,WITHOUTLIMITATION:INTERESTRATEFLUCTUATIONS;CHANGESINTHEPERFORMANCEOFTHEREALESTATEMARKETS;VOLATILITYINTHECAPITALMARKETS;UNFAVORABLEECONOMICCONDITIONS;IMPAIRMENTSINTHECOMPANY’SGOODWILLOROTHERINTANGIBLEASSETS;FAILURESATFINANCIALINSTITUTIONSWHERETHECOMPANYDEPOSITSFUNDS;CHANGESINAPPLICABLEGOVERNMENTREGULATIONS;HEIGHTENEDSCRUTINYBYLEGISLATORSANDREGULATORSOFTHECOMPANY’STITLEINSURANCEANDSERVICESSEGMENTANDCERTAINOTHEROFTHECOMPANY’SBUSINESSES;THECONSUMERFINANCIALPROTECTIONBUREAU’SEXERCISEOFITSBROADRULEMAKINGANDSUPERVISORYPOWERS;REGULATIONOFTITLEINSURANCERATES;REFORMOFGOVERNMENT-SPONSOREDMORTGAGEENTERPRISES;LIMITATIONSONACCESSTOPUBLICRECORDSANDOTHERDATA;CHANGESINRELATIONSHIPSWITHLARGEMORTGAGELENDERSANDGOVERNMENT-SPONSOREDENTERPRISES;CHANGESINMEASURESOFTHESTRENGTHOFTHECOMPANY’STITLEINSURANCEUNDERWRITERS,INCLUDINGRATINGSANDSTATUTORYCAPITALANDSURPLUS;LOSSESINTHECOMPANY’SINVESTMENTPORTFOLIO;MATERIALVARIANCEBETWEENACTUALANDEXPECTEDCLAIMSEXPERIENCE;DEFALCATIONS,INCREASEDCLAIMSOROTHERCOSTSANDEXPENSESATTRIBUTABLETOTHECOMPANY’SUSEOFTITLEAGENTS;ANYINADEQUACYINTHECOMPANY’SRISKMITIGATIONEFFORTS;SYSTEMSDAMAGE,FAILURES,INTERRUPTIONSANDINTRUSIONSORUNAUTHORIZEDDATADISCLOSURES;ERRORSANDFRAUDINVOLVINGTHETRANSFEROFFUNDS;INABILITYTOREALIZETHEBENEFITSOFTHECOMPANY’SOFFSHOREOPERATIONS;INABILITYOFTHECOMPANY’SSUBSIDIARIESTOPAYDIVIDENDSORREPAYFUNDS;INABILITYTOREALIZETHEBENEFITSOF,ANDCHALLENGESARISINGFROM,THECOMPANY’SACQUISITIONSTRATEGY;ANDOTHERFACTORSDESCRIBEDINTHECOMPANY’SQUARTERLYREPORTONFORM10-KFORTHEYEARENDEDDECEMBER31,2016,ASFILEDWITHTHESECURITIESANDEXCHANGECOMMISSION.THEFORWARD-LOOKINGSTATEMENTSSPEAKONLYASOFTHEDATETHEYAREMADE.THECOMPANYDOESNOTUNDERTAKETOUPDATEFORWARD-LOOKINGSTATEMENTSTOREFLECTCIRCUMSTANCESOREVENTSTHATOCCURAFTERTHEDATETHEFORWARD-LOOKINGSTATEMENTSAREMADE.

Useofnon-GAAPFinancialMeasures
3
Thisslidepresentationcontains,andrelatedcommentaryandanswerstoquestionsmaycontaincertainfinancialmeasuresthatarenotpresentedinaccordancewithgenerallyacceptedaccountingprinciples(GAAP),including netoperatingrevenueandsuccessratios.Althoughtheseexclusionsrepresentactualgains,lossesorexpensestotheCompany,theymaymasktheperiodicincomeandfinancialandoperatingtrendsassociatedwiththeCompany’sbusiness.
TheCompanyispresentingthesenon-GAAPfinancialmeasuresbecausetheyprovidetheCompany’smanagementandinvestorswithadditionalinsightintotheoperationalperformanceoftheCompanyrelativetoearlierperiodsandrelativetotheCompany’scompetitors.TheCompanydoesnotintendforthesenon-GAAPfinancialmeasurestobeasubstituteforanyGAAPfinancialinformation.Intheslidepresentationthesenon-GAAPfinancialmeasureshavebeenpresentedwith,andreconciledto,themostdirectlycomparableGAAPfinancialmeasures.Investorsshouldusethesenon-GAAPfinancialmeasuresonlyinconjunctionwiththecomparableGAAPfinancialmeasures.

OrganizationalStructure
4
2016Revenue:$5.6B TotalRevenueTrend
Specialty8%
Mortgage&Data
Solutions9%
International5%
U.S.Title78%
3.3 3.7 3.5 4.0 4.3
0.60.6
0.40.5
0.50.3
0.30.4
0.40.5
0.30.3
0.30.3
0.3
-
1.0
2.0
3.0
4.0
5.0
6.0
2012 2013 2014 2015 2016
U.S.Title Mortgage&DataSolutions Specialty International

StrategyEvolution
55
2010-20132013-2016
2016- 2020
PositionFApost-spin&managecrisisfallout
Becomemoreefficient&strengthenbalancesheet
Growprofitably&innovateforproductivity
Keybusinessactions
• Standardizedandcentralizedback-officeoperations
• Increasedleverageofoffshoreassets
• Simplifiedoperatingstructure
• Moderatemarketsharegrowth
• Enhanceddatacapabilities
• Achievedcostleadership
• Continuetodrivecostadvantage
• Emphasizegrowth,primarilyindirectandcomplementarybusinesses
• Leveragedataforproductivity
Keycapitalactions
• Simplifiedlegalentitystructure
• Strengthenedbalancesheet
• Increaseddividend
• Deploycapitaltowardsgrowth
• Distributemorecashtoshareholders
Common themesFocusonefficiencyValueourpeople
Prudentlymanageourcapital

FirstAmerican’sStrategy
6
Vision:Tobethepremiertitleinsuranceandsettlementservicescompany
Innovation
Complianceandriskmanagement
FocusM&Aonenhancingthecore
Optimizecapitalmanagementstrategy
Peopleandculture
Profitablygrowour
coretitleandsettlementbusiness
Strengthentheenterprisethroughdataandprocessadvantage
Manageandactivelyinvestin
complementarybusinessesthat
supportorexpandthecore
Deployourcapitaltomaximizelong-termshareholderreturns

RefinanceMarket
7
CurrentTrend
Outlook
• Openordershavestabilizedat~1200perdayin1Q
• Significantlyreducingresourcecommitmentsinourrefinancefocusedbusinesses
• Closelymonitoringorderlevelsasalways
• Risinginterestrateswilllikelycontinuetoweighonrefinancetransactionsin2017
• Longerterm,expectrefinancevolumestoremainlow
500
1,000
1,500
2,000
2,500
3,000
Jan Feb Mar Apr May Jun Jul Aug Sep Oct Nov Dec
OpenOrders/Day
2015 2016 2017
500
700
900
1,100
1,300
1,500
1,700
1,900
2,100
Jan Feb Mar Apr May Jun Jul Aug Sep Oct Nov Dec
ClosedOrders/Day
2015 2016 2017

PurchaseMarket
8
CurrentTrend
Outlook
• 6%revenuegrowthin2016• Feesperfilegrew6%• Closedorderswereflat
• Homepriceappreciationrobust• Strongbuyerdemand• Lackofforsaleinventoryin
existinghomesakeyfactor
• Expectcontinuedgrowthin2017andbeyond
1,000
1,200
1,400
1,600
1,800
2,000
2,200
2,400
2,600
Jan Feb Mar Apr May Jun Jul Aug Sep Oct Nov Dec
OpenOrders/Day
2015 2016 2017
1,000
1,200
1,400
1,600
1,800
2,000
Jan Feb Mar Apr May Jun Jul Aug Sep Oct Nov Dec
ClosedOrders/Day
2015 2016 2017

9
CurrentTrend
Outlook
• Expectstrengthincommercialoverthenext1-3years,albeitbelow2015recordlevels
• Wellpositionednationalplatform
• Seeingcontinuedstrengthacrossmostmarketsandassetclasses
• Overallqualityandsizeofdealsremainhigh,althoughlargepremiumdealshaveslowed
• Capitalavailabilityandforeignflowscontinuetosupportmarket
$inm
illions
AverageRe
venu
epe
rOrder
Closed
Ordersp
erDay
CommercialMarket
465 506598 559
8189
98102
$0
$200
$400
$600
$800
2013 2014 2015 2016
Local NCS661
546595
696
6,9897,652
8,583 8,245
310 309322 318
200
250
300
350
400
$5,000
$6,000
$7,000
$8,000
$9,000
$10,000
2013 2014 2015 2016
ARPO ClosedOrdersperDay

Objective
-4%
-2%
0%
2%
4%
6%
8%
10%
12%
14%
$-
$700
$1,400
$2,100
$2,800
$3,500
$4,2002000
2001
2002
2003
2004
2005
2006
2007
2008
2009
2010
2011
2012
2013
2014
2015
2016
MortgageOriginations PretaxMargin
($in
Billion
s)
(1)
(1) Source:MortgageBankersAssociation
TitleInsuranceSegmentMargins
10

CapitalManagementStrategy
11
• CapitalManagementPriorities:
• Makevalue-creating investmentsinourcorebusiness
• Acquirebusinessesthatfitwithinourcorestrategy
• Returnexcesscapitaltoshareholdersthroughdividendsandsharerepurchases
• Maintainadequate capitallevels
• Manageourcapitalstructureprudently
• Maintainamplefinancialflexibilityandholdingcompanyliquidity
Objective:CreateLong-TermShareholderValue

32%
15%
28%
39% 38% 38%46%
0%
20%
40%
60%
2011 2012 2013 2014 2015 2016 2017E
PayoutRatio
Dividends
12
DividendConsiderations:
• FirstAmericanexpectstopayameaningfuldividendgiventhecompany’scashflowgenerationandinvestmentopportunities
• Dividendincreasesshouldbesustainable
• Dividendsarereviewedbytheboardregularly,withastrongeremphasisinthefirstquartertodeterminewhethertoadjustthedividend
• Dividendincreaseswillbedependentuponexpectedholdingcompanycashflows,marketconditionsandalternativeusesofcapital,amongotherfactors
• Thecompanyisnotcommittedtoincreasingthedividendeveryyear
1)CalculatedusingConsensusEPSestimatefor2017.TheConsensusEPSexcludesthepensionterminationimpact
$0.24$0.36
$0.48
$0.84$1.00
$1.20$1.36
$0.00
$0.25
$0.50
$0.75
$1.00
$1.25
$1.50
$1.75
2011 2012 2013 2014 2015 2016E 2017E
Dividendspershare
(1)

LegalEntityRe-alignmentIncreasedDividendCapacity
2015
FirstAmericanTitle
InsuranceCompany
FirstAmericanFinancialCorp
RepublicTitle(Agent)
FirstAmericanPropertyandCasualty
FirstAmericanData
Company
FirstAmericanTrust
FirstAmericanHomeBuyersProtection
FirstAmericanTitleCompany
– Hawaii(Agent)
FirstAmericanProfessionalRealEstateServices
FirstAmericanTitleCompany
– Texas(Agent)
FirstAmericanTitleCompany
(Agent)
Note:LegalstructureasofJune30,2012;notacompletelistoflegalentities
2012ActualdividendstoHoldingCompanyexcludingFATICO
OtherSubsidiaries $12M
2012
FirstAmericanPropertyandCasualty
OtherSubsidiaries
FirstAmericanData
Company
50%
FirstAmericanFinancialCorp
FirstAmericanTitle
InsuranceCompany
50%
2015ActualdividendstoHoldingCompanyexcludingFATICO
OtherSubsidiaries $83M
13

US$inmillions 2011 2012 2013 2014 2015 2016
BeginningSurplus 868 849 956 996 979 1,104
NetIncome 92 301 199 393 192 150
DividendtoParent (47) (219) (139) (263) (60) -
Other (65) 26 (20) (148) (7) (67)
EndingSurplus 849 956 996 979 1,104 1,187
DividendtoParent:
Cash 45 - 40 - 60 -
Non-cash 2 219 99 263 - -
Total 47 219 139 263 60 -
TotalNon-cashdividendtoParentfortheprior6years 582
1,050 1,013 1,015949
936912
58%
86%
107%121%
147%165%
0%
50%
100%
150%
200%
0
200
400
600
800
1,000
1,200
1,400
2011 2012 2013 2014 2015 2016Reserves MktSecurities%ofReserves
US$inmillions
849
956 996 9791,104
1,187
105% 73%
54%
28%15% 13%
0%
50%
100%
150%
200%
0
200
400
600
800
1,000
1,200
1,400
2011 2012 2013 2014 2015 2016Surplus Affiliates%ofSurplus
US$inmillions
EnhancedStatutoryCapital
14
• Recentlycompletedamulti-yearefforttoenhancethefinancialstrengthandflexibilityofthecompany
• ~50%offreecashflowbetween2011-2016wasusedtogrowtheinvestmentportfolio,primarilytostrengthenthesurplusqualityofourprimaryunderwriter- FATICO
• FuturecashflowsatFATICOwillprimarilybeup-streamedtotheholdingcompanyforcapitaldeployment(dividend,M&A,etc.)

12.8%
8.9%11.2%
18.6%
17.4%
19.6%
5%
10%
15%
20%
25%
30%
35%
2011 2012 2013 2014 2015 2016
Debt-to
-Capita
lratio
FinancialCovenant
Debt-to-CapitalRatio
CapitalStructure
• Management’stargetdebt-to-capitalratiois18-20%
– Supportstarget financialstrengthratings
• Nosignificantmaturitiesuntil2023
• Majorityofcurrentdebthasafixedinterestrate
– ThecreditfacilityratefloatsatLIBOR+175basispoints
• FAFhassignificantfinancialflexibilitytoseizestrategicopportunities
AsofDecember31, 2016($inmillions)
4.3%seniornotesdue2023 $248
4.6%seniornotesdue2024 298
Trustdeednotes 27
Othernotes 4
Revolvingcreditfacility 160
Totaldebt $737
Totalequity $3,014
Debt-to-Capitalratio 19.6%
15

ImpactofHigherInterestRates
Insuranceportfolioinvestmentincome
• Yieldonnewinvestmentswillbegreaterthancurrentbookyield
BankingProfitability
• ~40%ofbankingportfolioinfloating-ratesecurities
• Spreadtodepositcostswideninhigherinterestrateenvironment
Reduceddefinedbenefitplanobligations
• Definedbenefitplanshighlysensitivetointerestrates
Greaterinvestmentincomeonescrowbalances
• Depositsatthirdpartybanks
GreaterearningsatFAExchange
Benefits
Decreasedvalueoffixedincomeportfolio
Impacttorefinancevolumes
• Refinancerepresented17%ofdirectrevenuepremiumsin2016
• 2016averagerevenueperorder:
– Refinance:$884
– Resale:$2,146
– Commercial:$8,229
Reducedhousingaffordability
Higherinterestexpenseoncreditfacility
Risks
16

InvestmentConsiderations
• “Pureplay”intitleandmortgagemarkets
• Strongcompetitivepositionintitleandsettlementservices
‒ Continuetopursueprofitablemarketsharegains‒ Strengtheningtheenterprisethroughdatacapabilities
• Recordtitlesegmentmarginswithlonger-termupsideremaining
‒ Expectearningsandmargingrowthaspurchasemarketimproves‒ Anticipatecashflowtoincreasefrombothhigherearningsandlowerpaidclaims
• Strongbalancesheetandfinancialflexibility
‒ Recentlycompletedlegalentityre-alignmentincreasesdividendcapacityandcapitaldeploymentopportunity
• Commitmenttoreturncapitaltoshareholders
‒ Raiseddividend36%in2016
17

TotalShareholderReturn
18Source:Annualizedreturnthrough12/31/2016
FAFTotalShareholderReturn
0.0% 5.0% 10.0% 15.0% 20.0% 25.0% 30.0%
5year
3year
1year 5.2%
12.3%
26.8%

©2015 First American Financial Corporation and/or its affiliates. All rights reserved. q NYSE: FAF
Appendix

BalanceSheet
20
AsofDecember,312016($millions)
Assets
Cash&equivalents $1,006
Investments 5,141
Otherassets 1,589
Goodwill&intangibles 1,096
Totalassets $8,832
Liabilities&Equity
DemandDeposits $2,779
OtherLiabilities 1,275
Reserves 1,026
Debt 737
Equity 3,014
Totalliabilities&equity $8,832
ReturnonEquity
TTMNetincome $343
AverageEquity $2,884
ROE 11.9%
Debt-to-capital 19.6%
Bookvaluepershare $27.42
Tangibleequity $1,918
Statutorysurplus $1,187

InvestmentPortfolio
ConsolidatedPortfolio$5.0Billion
InsurancePortfolio$2.2Billion
BankPortfolio$2.8Billion
21Note:DebtandequitysecuritiesasofSeptember30,2016
USTreasury3%
Gov'tAgency4% Municipal
20%
Corporate18%
Gov'tAgencyMBS44%
Foreign3%
Equity8%
Avg.Rating: AADuration: 3.5BookYield: 2.1%
USTreasury
7%
Gov'tAgency3% Municipal
20%
Corporate35%
Gov'tAgencyMBS11%Foreign
6%
Equity18%
Avg.Rating: AADuration: 3.5BookYield: 2.7%
Gov'tAgency5%
Municipal20%
Corporate5%
Gov'tAgencyMBS70%
Avg.Rating: AADuration:2.9BookYield:1.5%

0
50
100
150
200
250
300
350
400
0
0.02
0.04
0.06
0.08
0.1
0.12
0.14
0.16
2003 2004 2005 2006 2007 2008 2009 2010 2011 2012 2013 2014 2015 2016 2017 2018 2019
PaidtoDate UltimateLossRatio- PolicyYear PaidLosses- CalendarYear(2)
93%
91% 92% 89%
87%
86%
82%
79%73%
63%52%
44%17%
5.2%
7.6%
9.8%
10.7%
13.5%
6.3%
5.2% 5.1%
3.4% 3.7%
4.8%4.1%
UltimateLossRatiosbyPolicyYear
PaidLossesb
yCalend
arYear($inM
illions)
UltimateLossRatiosb
yPo
licyYear
22
(1) UltimatelossratiosareestimatesandcalculatedasapercentageoftitlepremiumsandescrowfeesforagivenpolicyyearasofDecember31,2016(2)Paidclaimsforecastassumes5%ultimatelossratioand~1%premiumgrowthratefor2017-2018
(2)
(1)
4.4%
7%
Forecast
9.8%
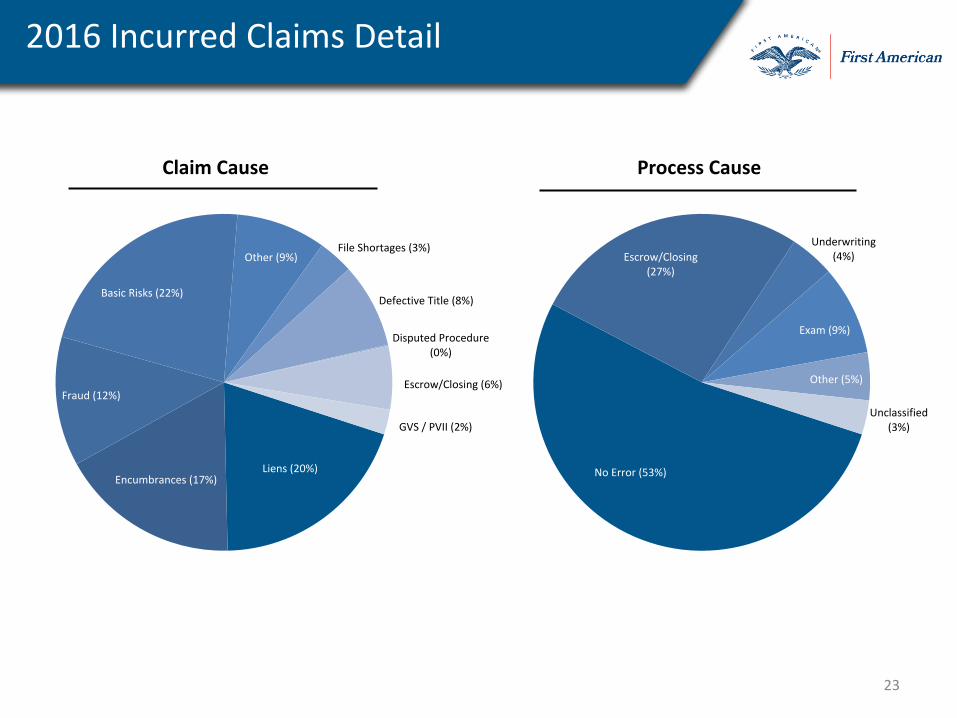
2016IncurredClaimsDetail
ClaimCause ProcessCause
23
Liens(20%)Encumbrances(17%)
Fraud(12%)
BasicRisks(22%)
Other(9%)FileShortages(3%)
DefectiveTitle(8%)
DisputedProcedure(0%)
Escrow/Closing(2%)
GVS/PVII(4%)
Escrow/Closing(6%)
NoError(53%)
Escrow/Closing(27%)
Underwriting(4%)
Exam(9%)
Other(5%)
Unclassified(3%)GVS/PVII(2%)