
WINNERS AND LOSERS OF MARKETPLACE LENDING: EVIDENCE … · WINNERS AND LOSERS OF MARKETPLACE...
73
WINNERS AND LOSERS OF MARKETPLACE LENDING: EVIDENCE FROM BORROWER CREDIT DYNAMICS * Sudheer Chava Nikhil Paradkar Georgia Institute of Technology Abstract Does marketplace lending (MPL) benefit its borrowers? Using comprehen- sive monthly credit bureau data for approximately one million borrowers on a major MPL platform, we find that, consistent with the stated purpose for the loan, borrowers consolidate expensive credit card debt with card balances declining by 47% relative to the quarter before origination. As a result, their credit card utilization ratio declines and credit scores increase by 19 points in the quarter after loan origination, on average. Compared to non-MPL borrow- ers in the same ZIP code (or ZIP+4) with identical ex ante credit dynamics, the MPL loan-induced debt consolidation increases the transition probability of subprime (near-prime) borrowers to the near-prime (prime) category by 35% (33%). Subsequently, they receive additional credit from their existing bank relationships, resulting in higher aggregate indebtedness three quarters post-origination. Consequently, in the post-loan origination period, there is a significant increase in credit card defaults for MPL borrowers. In particular, following MPL loan origination, subprime MPL borrowers are up to 1.5 times more likely to default on their credit card debt than their subprime non-MPL neighbors. Our results highlight how credit card debt consolidation through MPL platforms and the resulting information cascade to traditional banks through credit scores can leave some borrowers worse off. Keywords: FinTech, Marketplace Lending, Consumer Credit, Credit Cards, Defaults, Subprime Borrowers JEL Classification Codes: D12, D14, G21, G23, O30, O33 * Sudheer Chava can be reached at [email protected]. Nikhil Paradkar can be reached at [email protected]. We thank Rohan Ganduri, Elena Loutskina, Alex Oettl, Manju Puri, Amiyatosh Purnanandam, Manpreet Singh, Kelly Shue, Linghang Zeng, Yafei Zhang, seminar participants at Georgia State University, and conference participants at the 2017/2018 Think Forward Initiative Summit, and the 2018 Boulder Summer Conference on Consumer Financial Decision Making for helpful comments and suggestions. This work was awarded the 2017 Think Forward Initiative Research Challenge grant sponsored by The ING Group. The views expressed in the paper are our own and do not represent the views of the credit bureau and other data providers.
Transcript of WINNERS AND LOSERS OF MARKETPLACE LENDING: EVIDENCE … · WINNERS AND LOSERS OF MARKETPLACE...
WINNERS AND LOSERS OF MARKETPLACE LENDING:
EVIDENCE FROM BORROWER CREDIT DYNAMICS∗
Sudheer Chava Nikhil Paradkar
Georgia Institute of Technology
Abstract
Does marketplace lending (MPL) benefit its borrowers? Using comprehen-sive monthly credit bureau data for approximately one million borrowers ona major MPL platform, we find that, consistent with the stated purpose forthe loan, borrowers consolidate expensive credit card debt with card balancesdeclining by 47% relative to the quarter before origination. As a result, theircredit card utilization ratio declines and credit scores increase by 19 points inthe quarter after loan origination, on average. Compared to non-MPL borrow-ers in the same ZIP code (or ZIP+4) with identical ex ante credit dynamics,the MPL loan-induced debt consolidation increases the transition probabilityof subprime (near-prime) borrowers to the near-prime (prime) category by35% (33%). Subsequently, they receive additional credit from their existingbank relationships, resulting in higher aggregate indebtedness three quarterspost-origination. Consequently, in the post-loan origination period, there is asignificant increase in credit card defaults for MPL borrowers. In particular,following MPL loan origination, subprime MPL borrowers are up to 1.5 timesmore likely to default on their credit card debt than their subprime non-MPLneighbors. Our results highlight how credit card debt consolidation throughMPL platforms and the resulting information cascade to traditional banksthrough credit scores can leave some borrowers worse off.
Keywords: FinTech, Marketplace Lending, Consumer Credit, Credit Cards, Defaults,
Subprime Borrowers
JEL Classification Codes: D12, D14, G21, G23, O30, O33
∗Sudheer Chava can be reached at [email protected]. Nikhil Paradkar can be reachedat [email protected]. We thank Rohan Ganduri, Elena Loutskina, Alex Oettl, ManjuPuri, Amiyatosh Purnanandam, Manpreet Singh, Kelly Shue, Linghang Zeng, Yafei Zhang, seminarparticipants at Georgia State University, and conference participants at the 2017/2018 Think ForwardInitiative Summit, and the 2018 Boulder Summer Conference on Consumer Financial Decision Making forhelpful comments and suggestions. This work was awarded the 2017 Think Forward Initiative ResearchChallenge grant sponsored by The ING Group. The views expressed in the paper are our own and donot represent the views of the credit bureau and other data providers.
I. Introduction
Consumer lending accounts for a significant share of the U.S. economy, accounting for
$3.6 trillion as of 2017. Banks are the primary providers of credit to most consumers. As
financial intermediaries, banks specialize in the screening and monitoring of borrowers
and enjoy economies of scale in reducing information asymmetries in the credit market.
However, significant frictions remain in the credit market1, especially for applicants who
are more reliant on soft information. In addition, despite ultra-low short-term interest
rates over the last several years, the interest rates charged on credit cards and personal
loans are high, even for applicants of high credit quality (Stango and Zinman, 2009).
As a result of these imperfections in the credit market, several financial technology
innovators have entered the credit markets in the last decade, including marketplace
lending (MPL) platforms that specialize in peer-to-peer (P2P) lending.2 These MPLs
facilitate lending by directly connecting small businesses and individual borrowers with
investors through online platforms. MPLs attempt to differentiate themselves from tra-
ditional banks through the use of non-traditional data and alternative algorithms and
they engage in different interest rate pricing schemes. These FinTech players, while still
a very small segment of the market, have grown rapidly in terms of lending volume.3
In this paper, we analyze whether borrowers on these MPL platforms benefit from their
unsecured consumer lending.
Specifically, we aim to address the following issues in this paper. First, given that
MPLs typically do not have mechanisms in place to monitor the actual usage of borrowed
funds, we analyze whether the stated aim of debt consolidation is misreported on loan
applications. Second, using comprehensive credit bureau data, we create cohorts of
MPL borrowers matched to non-MPL borrowers in the same ZIP code (or ZIP+4) who
have identical credit dynamics. We then analyze whether MPL borrowing impacts the
borrower’s credit scores, subsequent credit availability from traditional lenders, and their
credit utilization. Third, we conduct a cross-sectional analysis of the subsequent credit
dynamics and default experiences of borrowers. This analysis is an attempt to identify
the underlying mechanisms that drive some of the potential benefits or costs for MPL
borrowers.
1For example, information asymmetry results in imperfect pooling of borrowers of varying credit risk(Leland and Pyle, 1977) or even credit rationing (Stiglitz and Weiss, 1981).
2Other contributors may be changes in consumer attitudes and technology (such as easier availabilityof alternative consumer data, improvements in machine learning, and cheaper cloud processing). Also,over time, in contrast to the original focus on retail peer lenders, MPL platforms seem to increasinglyrely on institutional capital.
3Lending Club, a major marketplace lender has disbursed around $31 billion in loans over the lastdecade, with a sixfold increase in MPL loan origination from 2013 to 2015. See https://bit.ly/2E6hsuN
1
As a first step, we study the characteristics of individuals who borrow on a major MPL
platform. We use anonymized individual-level data, complete with rich dynamics at the
year-month level and with narrow geographic information, which are made available to
us by a credit bureau. Using this data, we identify approximately one million borrowers
on the platform in the month immediately before MPL loan origination, and we compare
these borrowers to a nationally representative 5% random sample of the U.S. population.
Our findings suggest that MPL borrowers are more financially constrained relative to the
average adult in the U.S. These borrowers have twice as many credit cards and over twice
the average credit card debt relative to the national average. Most tellingly, their credit
utilization ratio is 69%, which is over twice the national average of 30%. Additionally,
MPL borrowers have average credit scores that are more than 20 points below the national
average and a striking 80 points below the U.S. homeowners’ average.
Among the loan applicants on MPL platforms in the U.S., more than 70% state that
their primary reason for requesting funds is “expensive debt consolidation” to pay off
more expensive debt and replace it with monthly amortized payments. This is consistent
with MPL users being more financially constrained. However, MPL platforms have no
mechanism in place to ensure that borrowed funds are used consistently with the reasons
stated on applications. Despite their non-verifiability, however, Michels (2012) documents
that the reasons stated on MPL loan applications affect both the probability of receiving
funding as well as the rates charged on disbursed funds. Moreover, given the unsecured
nature of P2P lending, investors face the risks of both falsification on loan applications
as well as potential borrower defaults. Thus, the prevalence of strategic misreporting on
MPL loan applications is an important unanswered question that our rich credit dynamics
allow us to answer.
Our results suggest that misreporting on MPL loan applications is rare: Borrowers
seem to use MPL funds for debt consolidation purposes as evidenced by the significant
decrease in their credit utilization ratios immediately after receiving the MPL loans. More
importantly, these borrowers consolidate only their most expensive debt: credit cards.
We do not observe a significant incidence of inefficient consolidation of auto, mortgage,
or student loans. We observe that credit card balances drop by approximately 47% in
the quarter of MPL loan origination relative to pre-origination levels. This consolidation
activity is also reflected in utilization ratios, which drop by approximately 12% in the
quarter of MPL loan origination. The average credit score rises by nearly 3% in the
quarter of MPL loan origination.
How long do these credit profile improvements last? Our evidence suggests that it
depends on the actions of borrowers following MPL-induced debt consolidation. We find
2
that in the quarter after MPL loan origination, borrowers revert to racking up their credit
card debt. Three quarters after loan origination, MPL borrowers carry as much credit
card debt as they did before origination. First, this indicates that MPL loans provide
only temporary debt relief. These loans do not change the fundamental credit behavior of
borrowers who are deeply indebted and financially constrained. Second, these borrowers
do not actually reduce their aggregate indebtedness through MPL-induced credit card
debt consolidation; rather, expensive credit card debt is simply transferred to a separate
installment account, which is charged a relatively lower rate. Thus, when these borrowers
resume their accumulation of credit card debt after consolidation, they in fact become
more indebted (in an aggregate sense), since they are now faced with paying down both
borrowed MPL funds and their newly accrued credit card debt.
More strikingly, increased credit card consumption after MPL loan origination is aided
by an increase in credit card limits from traditional banking intermediaries. It appears
that, influenced by the temporary consolidation-induced drop in utilization ratios, some
banks extend additional credit to these borrowers at a greater rate in the months following
MPL loan origination.4 This allows MPL borrowers to consume on credit cards at pre-
origination levels, while still maintaining utilization ratios below pre-origination levels.
We find that the probability of credit card default is 10 to 13 times higher one year
after MPL loan origination relative to pre-origination levels. This is consistent with the
idea that increased levels of debt positively correlate with the risk of default. Taken
together, our findings suggest that the cascading of information from an MPL platform
to a banking intermediary results in potentially inefficient extension of credit and higher
defaults among borrowers who are already financially weaker. It is also important to
note that while default probabilities on credit cards rise sharply following MPL loan
origination, defaults on the MPL loan itself are not common. It appears that when these
borrowers encounter financial distress after origination, they focus on repaying MPL loans
at the expense of loans made by traditional banks.
A potential concern with our approach is that our results may be driven by certain
omitted variables that are specific to the MPL borrower and independent of the origi-
nation of the MPL loan. However, our results show that MPL borrowers do consolidate
credit after MPL loan origination, but they default at a higher rate later. So, an omit-
ted borrower-specific variable is unlikely to explain both our ex ante and our ex post
results. Moreover, our findings show that MPL borrower credit scores are stable in the
year leading up to MPL loan origination, and these scores only begin to fluctuate in the
4Broadly, our results indicate that increases in credit card limits are associated with increased creditcard indebtedness, consistent with the findings of Gross and Souleles (2002).
3
quarter of origination. This indicates that any possible unaccounted factor that could
explain our findings does not relate to information in the credit files of these borrowers.
Some non-credit file factors, such as monthly income or changes in occupation, might
explain one facet of our results. However, we confirm that our results are not driven by
changes in job or income. Moreover, we control for both these factors in our empirical
specifications to reduce concerns that omitted variables may be driving our results.
We also verify that our observed results are not simply a manifestation of economic
conditions local to the MPL borrower but instead are completely exogenous to the orig-
ination of the MPL loan itself. It is certainly possible that bank profitability estimates
at the local regional level and time-varying trends may be driving some of our results.
The higher credit card default rates can be driven entirely by negative regional economic
shocks. However, we include (5-digit) ZIP code × year-quarter fixed effects to capture
any regional time-varying trends. Hence, it is unlikely that any omitted borrower-specific
variables that change at the time of the MPL loan are responsible for our results.
Finally, we address the issue that borrowing from MPL platforms is endogenous. We
implement a modified k-nearest neighbors (kNN) algorithm to create cohorts of MPL
borrowers matched to their geographically and socioeconomically proximate non-MPL
borrowing neighbors. In our baseline matching approach, we match MPL borrowers to
non-borrowers residing in the same (5-digit) ZIP code in calendar time. The average
5-digit ZIP code population in the U.S. is approximately 7,500 people5, which enables
the identification of such “neighbors” at a narrow geographic level.
Within each cohort, we ensure that MPL borrowers and their non-borrowing neighbors
display identical credit dynamics during the time leading up to MPL loan origination by
the borrowers. Thus, within each cohort, the only factor that differentiates an MPL
borrower from her neighbor is the origination of the MPL loan itself. In additional
robustness tests, we implement the kNN algorithm at the 9-digit ZIP code (ZIP+4)
level, which limits our analysis to a smaller number of cohorts.6 The origination of
an MPL loan drastically alters the credit dynamics of the borrower when compared to
her neighbors within the same cohort. This finding holds regardless of the matching
approach used, and it holds despite the fact that the borrower and her cohort neighbor
share identical trends in their credit profile characteristics in the year leading up to the
MPL loan origination.
We also perform cross-sectional tests, and we study the credit behavior of subprime,
5Statistics on ZIP codes can be found at https://www.zip-codes.com/zip-code-statistics.asp.6Summary statistics generated using the U.S. credit file suggest that the average and median popu-
lation of 9-digit ZIP codes in the United States is under 10 people.
4
near-prime, and prime MPL borrowers. The subprime, near-prime, and prime segments
account for 23%, 50%, and 27% of the MPL borrower base, respectively. We find that
credit card debt consolidation activity is weakest (strongest) for the subprime (prime)
segment.7 Moreover, we find that the increase in traditional credit limits is concentrated
among borrowers who were subprime or near-prime before MPL loan origination. Finally,
our analysis of defaults reveals that the increase in default probabilities following MPL
loan origination is largest (smallest) in the subprime (prime) segment. Moreover, even
in the subprime segment, we find that financially distressed MPL borrowers choose to
default on credit cards rather than defaulting on the MPL loan itself.
Next, we examine the factors driving the strong growth in credit limits on existing
credit cards for subprime and near-prime MPL borrowers in the post-MPL loan origina-
tion period. Through cohort-level analysis, we document that, relative to their subprime
neighbors, subprime MPL borrowers experience a 5.55% increase in their credit score
in the quarter of MPL loan origination. This means that, relative to non-MPL bor-
rowers, the credit score of a subprime MPL borrower is 34% more likely to exceed 620,
which is the threshold between subprime and near-prime credit scores. Consequently,
subprime MPL borrowers experience significantly stronger credit limit growth relative to
their non-borrowing subprime neighbors. Similarly, relative to their near-prime non-MPL
neighbors, the credit score of a near-prime MPL borrower is 30% more likely to exceed
680, which is the threshold between near-prime and prime credit scores. Subsequently,
they also enjoy higher credit limit growth relative to their neighbors.
Taken together, our findings regarding credit limit extensions suggest that bank de-
cisions are heavily influenced by the temporary increase in credit scores that MPL bor-
rowers enjoy due to the debt consolidation activity induced by MPL loans. While we
cannot altogether rule out the possibility that banks infer MPL borrower quality through
information spillovers generated by MPL platforms (as described in the context of in-
formation cascades studied in Banerjee (1992) and Bikhchandani, Hirshleifer, and Welch
(1992)), we document that such spillovers – if they occur at all – operate through the
borrower’s credit score. MPL loans also allow borrowers to transition across the thresh-
olds between subprime and near-prime credit scores and between near-prime and prime
credit scores. In this context, our findings are more consistent with Rajan, Seru, and
Vig (2015), who document that bank lending decisions have become increasingly credit
score-centric over the years. These findings are also in line with Agarwal, Chomsiseng-
7Our findings suggest that the subprime segment consolidates the least amount of credit card debt,and is the quickest to revert to consuming on credit cards. Broadly, this highlights the role of liquidityconstraints, consistent with arguments posed in Gross and Souleles (2002) and Agarwal, Liu, and Souleles(2007).
5
phet, Mahoney, and Stroebel (2018), who find that banks’ marginal propensity to lend
is increasing in borrowers’ credit scores.
Our paper relates to several strands of literature. First, it adds to the extant MPL
literature on consumer credit, which has focused primarily on two areas. The first broad
area deals with lending decisions within online lending platforms. Freedman and Jin
(2011) and Lin, Prabhala, and Viswanathan (2013) show that online lenders utilize social
networks and verifiable community relationships to overcome adverse selection. In a more
recent paper, Hildebrand, Puri, and Rocholl (2016) document that group leader bids in
the presence of origination fees alter the market’s perception of the credit quality of the
borrower. Moreover, Iyer et al. (2015) document that, relative to using credit scores alone,
peer lenders are more accurate when predicting the borrowers’ likelihood of defaulting
on loans.8 Finally, utilizing a panel of MPL platform investors, Paravisini, Rappoport,
and Ravina (2016) document negative investor-specific wealth elasticities, and a positive
relationship between relative risk aversion and investor wealth in the cross-section.9
A second strand of literature focuses on borrower-specific determinants of (a) the
probability of funding success and (b) the interest rates charged on peer-financed loans in
the consumer credit space, such as beauty (Ravina, 2012), age and race (Pope and Sydnor,
2011), appearance of trustworthiness (Duarte, Siegel, and Young, 2012), non-verifiable
reasons on online MPL loan applications (Michels, 2012), and stereotypes (Hasan, He,
and Lu, 2018).10 In contrast, our paper focuses on the utilization of MPL funds and on
some of the potential benefits or costs generated for MPL borrowers.
Our paper also contributes to the growing literature on the interaction between bank-
ing intermediaries and FinTech lenders. In the consumer credit space, Jagtiani and
Lemieux (2017) show that MPL platforms have penetrated areas where bank branches
have closed and areas that have highly concentrated banking markets. They argue in
favor of credit expansion through financial technology to creditworthy borrowers who
are not served by banks. On the opposite side, Wolfe and Yoo (2017) document that
small, rural commercial banks lose lending volume to MPL platforms, which suggests
8Berg et al. (2018) also highlight the benefits of alternative data by documenting that customercreditworthiness, as judged through their “digital footprint” on a German E-Commerce website, producesinformation content which is superior to that of credit bureau scores.
9Hertzberg, Liberman, and Paravisini (2018) analyze MPL decisions from the perspective of borrow-ers, and document that MPL borrowers self-select into loans of differing maturities depending on theirfuture ability to repay, i.e., on the basis of private information unavailable to lenders, and that thisself-selection influences future default rates.
10In the mortgage setting, Bartlett et al. (2018) document that ethnicity plays a statistically andeconomically significant role in loan rejection rates. The authors note, however, that FinTech lendersare less likely to discriminate than traditional lenders.
6
nontrivial credit substitution. Buchak et al. (2017) document that shadow banks in the
mortgage space gained a larger market share among less creditworthy borrowers, and
these banks filled the gap left behind by credit contraction among traditional banks in
areas where traditional lenders face more regulatory and capital constraints. Within
this subset of shadow banks, FinTech lenders account for approximately 25% of shadow
bank originations, serving more creditworthy borrowers. We contribute to this literature
by documenting that traditional banks appear to utilize information generated by MPL
platforms, albeit through borrowers’ credit scores.
Two contemporary papers that closely relate to ours are Demyanyk, Loutskina, and
Kolliner (2017) and Balyuk (2018). In contrast to one of our results, Demyanyk et al.
(2017) suggest that MPL funds are not used for debt consolidation purposes. However,
due to data constraints, their analysis is conducted at the individual-year level. On the
other hand, access to rich credit bureau data allows us to track MPL borrowers in the
months surrounding MPL loan origination. Our results show that most MPL-induced
credit profile changes occur in the months immediately following MPL loan origination,
and traditional lenders react to the MPL-induced credit card debt consolidation by pro-
viding more credit to these borrowers. The high granularity of our data also allows us
to implement stringent specifications that track credit dynamics more accurately. More-
over, our cross-sectional results help us identify the subprime MPL borrower segment as
being most susceptible to ex post credit card defaults.
Similar to one of our results, Balyuk (2018) also finds that credit limits on existing
credit cards increase post-MPL loan origination, but finds no evidence that increased
access to credit results in higher delinquencies. However, our results suggest that MPL
loan-induced credit limit extensions are ex post inefficient for one-quarter of the bor-
rowers, leading to overborrowing for subprime borrowers. Contrary to Balyuk (2018),
but consistent with Demyanyk et al. (2017), we find a higher incidence of credit card
defaults among MPL borrowers. In addition, our results strongly suggest that credit
limit extension decisions are heavily influenced by the short-term improvements in credit
scores induced by MPL activity, in line with the arguments made in Rajan, Seru, and
Vig (2015). Moreover, due to data constraints, the analysis in Balyuk (2018) is limited
to individuals who apply multiple times on MPL platforms, a small portion of the MPL
borrowers; also, such individuals are only tracked at the time of MPL loan application.
On the other hand, our analysis focuses on one-time MPL borrowers, who account for
over 80% of all MPL borrowers. In addition, our data allow us to track these borrowers
over time and compare them to their neighbors in the same ZIP (or ZIP+4) code with
identical credit dynamics before the origination of the MPL loan.
7
The rest of the paper is organized as follows. In Section II, we provide institutional
details on marketplace lending, and discuss our data sources. In Section III, we dis-
cuss our empirical methodology and describe identification challenges. In Section IV, we
present our main findings and robustness tests. In Section V, we provide a discussion of
our results and identify the winners and losers from MPL borrowing through examina-
tion of cross-sectional cuts. In Section V, we also discuss whether MPL loans alter the
perceived creditworthiness of borrowers. We conclude in Section VI.
II. Institutional Background And Data Sources
A. Institutional Background Of Marketplace Lending
The mid-2000s witnessed the advent of peer-to-peer lending (P2P lending) or marketplace
lending (MPL) as an alternative investment with the goal of revolutionizing the centuries-
old traditional banking model. Marketplace lenders promote themselves as cutting out
the “middle man” (intermediary banking institutions) and directly connecting individual
borrowers and lenders. Banks and other credit agencies have historically been the primary
source for personal loans, owing to their advantages over individual lenders in terms of
information and diversification. Although banks have greater information generation
capacity relative to individual lenders, individual borrowers are still more knowledgeable
about their risk profiles than banks. This information asymmetry results in average
pricing on credit instruments (similar to the pooling equilibrium considered in Akerlof
(1970) and Leland and Pyle (1977)) as well as rationing of certain categories of borrowers
(Stiglitz and Weiss, 1981). Average pricing is especially an issue, since high-credit-quality
borrowers subsidize low-quality borrowers. In addition, marginal-quality borrowers are
unable to differentiate themselves from low-quality borrowers, and end up being rationed
out of the market.
MPLs have attempted to incorporate some of the advantages of banks while also
overcoming some of their shortcomings. Individual investors are provided the option to
partially fund loan listings, thus enabling them to diversify their peer-to-peer lending
portfolios by co-investing in one loan with multiple other lenders. To assist investors,
MPLs also provide borrower credit profile information that was previously available exclu-
sively to banks, thus reducing information asymmetry between borrowers and lenders on
such platforms.11 Moreover, MPLs function completely online; thus, unlike banks, they
do not incur the fixed investment costs of setting up and maintaining brick-and-mortar
branches. Phillippon (2015) shows that the cost of traditional financial intermediaries in
11Such information includes FICO credit scores, past delinquencies, revolving credit balances, utiliza-tion ratios, monthly income, and the debt-to-income ratio of the loan applicant.
8
the United States has remained between 1.5–2% of intermediated assets over the last 30
years. However, a recent Lending Club (one of the largest MPL platforms in the United
States) report shows that Lending Club carries a 60% lower operational cost than banks
due to its electronic services.12
A.1. The Peer-to-Peer Loan Application Process
Prospective MPL borrwers are required to submit an online application, and this service
is only available to individuals with a bank account. Thus, the unbanked population
is not eligible for MPL loans. The borrower submits the requested loan amount, her
annual income, and employment status. In addition, prospective borrowers also provide
the intended purpose of the requested funds. Once the application is complete, the
MPL platform makes a soft credit check into the borrower’s credit history and pulls
the borrower’s credit score, debt, credit utilization ratios, the number of accounts under
the borrower’s name, and the outstanding balances on these accounts. Using both the
self-reported data and the credit report, the lending platform develops an interest rate
quote, which becomes the preset interest rate at which the loan will be provided if it is
originated.
MPLs provide unsecured loans for successful loan applications. As mentioned earlier,
prospective borrowers are required to provide the intended purpose of the borrowed funds.
Reasons provided in the loan applications range from debt consolidation to medical bills
to financing various kinds of conspicuous consumption. It is important to note, however,
that MPLs do not have any mechanism in place to ensure that borrowed funds are used
for the purpose stated in the loan application. Thus, it is unclear whether borrowers
actually use loan funds for their stated purpose or they simply “game the system” to
increase the probability of loan origination.13
B. Data And Descriptive Statistics
In this section, we discuss the sources used to construct our data, and we describe
the data cleaning process. All the data sources described below are used purely for
academic purposes and contain completely anonymized information made available to us
through a credit bureau. In addition, we also provide summary statistics that compare
the credit characteristics of MPL platform borrowers to a 5% random sample of the
12http://lendingmemo.com/wp-content/uploads/2013/08/1.pdf13In the older model of MPL, investors were required to bid against one another on the basis of interest
rates charged on MPL loans to prospective borrowers. In this older regime, Michels (2012) finds thatproviding a reason on the loan application significantly increases the probability of the loan being funded.
9
national population, and to a 33% random sample of homeowners in the United States.
B.1. Data Sources: Trades File
Through the credit bureau’s trade line-level data, we have access to comprehensive records
of the various lines of credit opened by every U.S. resident. These reported lines of
credit span many domains such, as mortgage, auto, student loans, credit cards, per-
sonal/business loans, and utilities. Each credit line is associated with a bureau-generated
individual key to identify the borrower. The MPL platform we consider for our analysis
is one of the largest in the U.S. We first identify all individuals who have opened an
installment trade on the MPL platform from 2011–2016.
In order to ensure the validity of the records, we consider only those MPL trade
lines associated with non-missing start dates and positive balances at the time of loan
origination. In addition, we require that MPL accounts with balances equal to zero
are associated with non-missing closing dates. For our analysis, we focus only on one-
time MPL platform borrowers from 2011–2016. Thus, we exclude individuals who have
borrowed multiple times from the MPL, which reduces concerns of strategic borrower
behavior and eliminates contamination from our analysis of post-loan origination credit
behavior. Following our data cleaning process, we are left with approximately one million
individuals who opened a single MPL-funded credit line from 2011–2016.
B.2. Data Sources: Attributes File
We use the credit bureau’s attributes file to study the credit profile evolution of MPL
platform borrowers in the months leading up to and following the origination of the MPL
loan. The attributes files contains information on inquiries, balances, utilization ratios,
and credit limits in the domains of mortgages, auto loans, student loans, and revolving
credit (i.e., credit cards). This information is available in the form of monthly snapshots
at the individual level.
We merge the attributes file with the MPL borrower data gathered from the trades
file. We merge these data based on the individual identifier. For every MPL borrower,
we merge in the inquiries, balances, utilization ratio, and credit limit information from
the attributes file for the 25-month window centered on the month in which the MPL
platform borrower originates the MPL loan. Next, we remove any individuals who have
invalid information for any variables relevant to our analysis at any point in the 25-month
window under consideration. For the subset of individuals with valid credit attributes,
we winsorize the numerical variables at the 1% and 99% levels.
10
B.3. Data Sources: Scores File
The scores file provides us with data on individual credit scores at a monthly frequency.
The MPL platform we study generates its interest rate quotes using FICO scores. How-
ever, FICO scores are owned by the Fair Issac Corporation and not by any of the credit
reporting agencies (CRAs), so CRAs can incur significant fees by using FICO scores.
Therefore, we use the Vantage 3.0 score, which is highly positively correlated with all
three FICO scores.14 We map every MPL borrower from the trades file to the scores file
for the 25-month window centered on the month in which the MPL loan is originated.
We exclude individuals with invalid Vantage 3.0 scores (i.e., below 300 or above 850) at
any point from our analyses.
B.4. Data Sources: Demographics File
The Demographics file contains information on individual monthly income, occupation,
education level, homeownership status, location, and various other socioeconomic mea-
sures. The data in this file are matched to MPL borrowers from the merged Trades-
Attributes-Scores file on the basis of the individual key.15
The variables gathered from the Demographics file serve as control variables in our
empirical analysis. Demographics data are only available starting from June, 2013. Thus,
when conducting multivariate analysis, our sample is restricted to studying individuals
who opened MPL trades between June 2013 and December 2016.
B.5. Data Sources: Performance File
The Performance file keeps detailed records of the financial health of all individuals
along broad trade lines, and these records are available at the monthly frequency. For
our analysis, we define default as being 90 days past due on a required payment on an
open credit line. We set an indicator variable equal to 1 starting from the month in which
the individual is considered to be officially in default, and 0 otherwise. This measure is
14According to a Fall 2012 report, the Consumer Financial Protection Bureau (CFPB) foundthat for a large majority of consumers in the United States, the scores produced by differ-ent scoring models provided similar information about the relative creditworthiness of the con-sumers. That is, if a consumer had a good score from one scoring model, the same con-sumer was likely to receive a good score using an alternative scoring criteria. In fact, cor-relations across the results of scoring models were high, and generally over 90%. Source:http://files.consumerfinance.gov/f/201209 Analysis Differences Consumer Credit.pdf
15Unlike the Attributes and Scores files, demographic information is available at the individual levelevery six weeks. Thus, for months in which we do not find a direct match between the Demographics fileand the merged Trades-Attributes-Scores file, we impute the relevant variables using the most recentlyavailable Demographics archive.
11
then aggregated at the individual level across all open credit lines in four broad credit
domains: auto, mortgage, student debt, and credit cards.
B.6. Descriptive Statistics
In this section, we compare the profile characteristics of all MPL borrowers at the time
of MPL loan origination to a 5% random sample of the total U.S. population and to a
33% random sample of homeowners as identified in the credit file. The results presented
in Table I help us identify whether the credit, income, and default risk profiles of MPL
borrowers differ significantly from the average consumer in the U.S.
The results presented in Panel A highlight that MPL borrowers have more open trades
compared to the national average and compared to the homeowners sample average.
This difference is stark for open credit card trades; MPL borrowers have more than
twice as many open trades in this domain relative to both the national average and
the homeowners sample average. Moreover, MPL borrowers owe more than twice the
national average in credit card debt, and they have credit utilization ratios over twice
the national average and over twice the U.S. homeowners average. We find that MPL
borrowers have significantly lower credit scores than both control samples, and this is
consistent with higher indebtedness being positively linked to a higher probability of
default. Finally, MPL borrowers have debt-to-income (DTI) ratios that are comparable
to the U.S. homeowners sample despite having an average mortgage balance that is
approximately $85,000 lower. This indicates that their high DTI ratios can be attributed
to lower income and higher non-mortgage debt.
III. Empirical Methodology And Threats To Identification
In this section, we describe the basic empirical approach we undertake to examine MPL
loan-induced changes in the credit profiles of MPL borrowers. We also discuss some po-
tential threats to our identification and how we address the self-selection and endogeneity
concerns inherent in any analysis of MPL borrowing.
A. Base Specification
We examine how the origination of MPL loans changes the credit profiles of MPL bor-
rowers along two broad domains: credit balances and default risk. In addition, we also
examine whether these individual-level responses are complemented by credit expansion-
ary or contractionary activities on the part of traditional banking intermediaries. Similar
to Agarwal, Pan, and Qian (2016) and Agarwal, Qian, and Zou (2017), our empirical
12
strategy utilizes individual-level data available at a monthly frequency and also studies
the 25-month period centered on the month in which the MPL loan is originated.
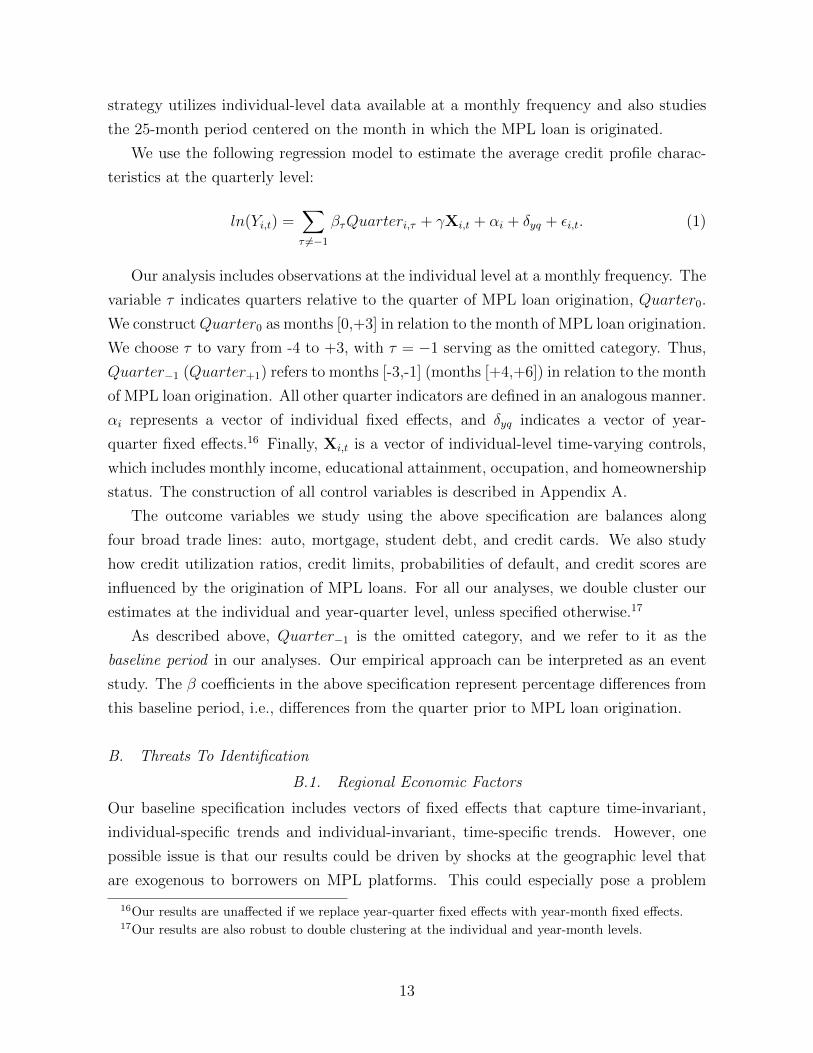
We use the following regression model to estimate the average credit profile charac-
teristics at the quarterly level:
ln(Yi,t) =∑τ 6=−1
βτQuarteri,τ + γXi,t + αi + δyq + εi,t. (1)
Our analysis includes observations at the individual level at a monthly frequency. The
variable τ indicates quarters relative to the quarter of MPL loan origination, Quarter0.
We constructQuarter0 as months [0,+3] in relation to the month of MPL loan origination.
We choose τ to vary from -4 to +3, with τ = −1 serving as the omitted category. Thus,
Quarter−1 (Quarter+1) refers to months [-3,-1] (months [+4,+6]) in relation to the month
of MPL loan origination. All other quarter indicators are defined in an analogous manner.
αi represents a vector of individual fixed effects, and δyq indicates a vector of year-
quarter fixed effects.16 Finally, Xi,t is a vector of individual-level time-varying controls,
which includes monthly income, educational attainment, occupation, and homeownership
status. The construction of all control variables is described in Appendix A.
The outcome variables we study using the above specification are balances along
four broad trade lines: auto, mortgage, student debt, and credit cards. We also study
how credit utilization ratios, credit limits, probabilities of default, and credit scores are
influenced by the origination of MPL loans. For all our analyses, we double cluster our
estimates at the individual and year-quarter level, unless specified otherwise.17
As described above, Quarter−1 is the omitted category, and we refer to it as the
baseline period in our analyses. Our empirical approach can be interpreted as an event
study. The β coefficients in the above specification represent percentage differences from
this baseline period, i.e., differences from the quarter prior to MPL loan origination.
B. Threats To Identification
B.1. Regional Economic Factors
Our baseline specification includes vectors of fixed effects that capture time-invariant,
individual-specific trends and individual-invariant, time-specific trends. However, one
possible issue is that our results could be driven by shocks at the geographic level that
are exogenous to borrowers on MPL platforms. This could especially pose a problem
16Our results are unaffected if we replace year-quarter fixed effects with year-month fixed effects.17Our results are also robust to double clustering at the individual and year-month levels.
13
for our results regarding credit expansion or credit contraction, since these practices are
heavily dependent on the profitability estimates of bank branches at the state or county
level. Moreover, negative region-specific economic shocks could explain default patterns
unrelated to MPL borrowing activity. Thus, we re-estimate Equation (1) by replacing
the vector of year-quarter fixed effects with a vector of (5-digit) ZIP code × year-quarter
fixed effects, which allows us to capture time-varying trends within 5-digit ZIP codes.
B.2. Endogeneity Concerns Of Engaging On MPL Platforms
Our regression specification relies on identifying MPL borrowers as reported to the credit
bureau by the MPL platform. However, this raises questions about individuals of certain
specific characteristics self-selecting into borrowing from such online platforms. Thus,
with our baseline specification, it is difficult to completely attribute our findings to the
origination of the MPL loan, since our findings could be partially or fully driven by
the above-mentioned selection bias. In order to mitigate these concerns, we attempt to
create a matched sample of non-MPL borrowers that are similar on all dimensions to MPL
borrowers with the only differentiating factor between the groups being the origination
of MPL loans by MPL borrowers.
We utilize a modified k-nearest neighbors (k-NN) algorithm in order to construct
our control sample of non-MPL borrowers. As a first step, for every MPL borrower, we
identify all geographically proximate neighbors from the same 5-digit ZIP code during
the month of MPL loan origination. Given that the average population of a 5-digit
ZIP in the United States is approximately 7,500 people, this first step allows us to
select non-borrowing neighbors from a relatively narrow geographical space. We ensure
that individuals who fall in this neighbor sample belong to households other than the
MPL borrower’s household. Moreover, by identifying non-borrowing neighbors from the
same 5-digit ZIP code in the month of MPL loan origination, we implicitly account
for region-time-specific shocks. Our approach thus facilitates a cohort-level analysis, in
which a cohort refers to each matched pair of an MPL borrower and her geographically
proximate neighbors. Moreover, since cohorts are created in calendar time, the pre- and
post-MPL loan origination time periods are the same for both MPL borrowers and their
non-borrowing neighbors.
One shortcoming of this approach so far is that in our large set of identified neighbors,
we also identify people who do not require additional credit. In this case, it is possible that
a substantial segment of our identified neighbor population differs from MPL borrowers,
who engage in MPL platforms because of additional credit requirements. Thus, within
each cohort, we subset our large neighbor pool to include only those neighbors who have
14
hard credit checks performed against them by banks in the three months before the month
of MPL loan origination by the MPL borrower. In addition, we add filters to identify
specifically those neighbors who do not receive additional credit through the extensive
margin (new credit cards) or intensive margin (increased credit limits on existing credit
cards). Hard credit checks or “hard pulls” are helpful in identifying individuals who
“need” credit, since they are only performed by creditors following consumer-initiated
actions. Moreover, hard pulls negatively impact consumer credit scores, and remain on
consumers’ credit reports for an extended period of time.18 Thus, inquiries of this kind
help identify individuals who have a “serious interest” in obtaining additional credit. The
application of these filters within each cohort help identify non-MPL borrowing neighbors
whose “need” for bank credit remains unfulfilled.19
In order to ease the computation associated with the k-NN algorithm, we subset the
data to account only for neighbors whose credit card utilization ratios, credit card bal-
ances, and credit scores are within 10% of the MPL borrowing individual in their cohort
in each of the three months before the month of MPL loan origination. Finally, we run
the k-NN algorithm to identify the nearest single neighbor to every MPL borrower. The
matching dimensions we use are credit score, credit card utilization ratio, the total num-
ber of open trade accounts, the number of credit card accounts, total credit card balance,
monthly income, and the debt-to-income ratio. We choose these matching criteria be-
cause the descriptive statistics presented in Table I suggest that MPL borrowers differ
most from the average U.S. population along these dimensions. In effect, we identify
separate cohorts of MPL borrowers and their closest geographically and socioeconomi-
cally proximate neighbors. We refer to this matching approach as our baseline matching
approach, and provide a detailed explanation of the matched-sample generation process
in Appendix B.
As further robustness checks, we create additional matched samples of MPL bor-
rowers and their non-borrowing neighbors using two variants of the “baseline” approach
described above. The first variant relies on identifying MPL borrowers who are un-
successful in acquiring bank credit in the three months before the month of MPL loan
origination. Each of these borrowers is then matched with the nearest non-MPL bor-
18Hard credit checks can lower credit scores by 5–10 points. More information on creditchecks, and their effect on credit scores can be found here: https://www.myfico.com/credit-education/questions/how-do-inquiries-impact-credit-scores/
19Our approach allows us to identify neighbors who require additional bank credit, but our approachdoes not allow us to further differentiate between people who were outright denied credit by the bank frompeople who, through a revealed preference argument, rejected credit that was provided at unfavorableterms. In this sense, our approach is similar to that in Jimenez et al. (2012, 2014).
15
rowing neighbor from the same 5-digit ZIP code, with neighbors limited to include only
individuals who have not received additional bank credit. Thus, this approach relies on
creating cohorts of MPL borrowers and their closest non-MPL borrowing neighbors in
which both groups have been unsuccessful in obtaining bank credit. After rejection by a
bank, MPL borrowers use MPL platforms for credit, whereas their neighbors do not.
In the second variant, we identify neighbors who reside in the same 9-digit ZIP code
as the MPL borrower. According to descriptive statistics generated using the credit
file, the average population of a 9-digit ZIP code in the United States is fewer than 10
people. Moreover, individuals of similar socioeconomic characteristics tend to co-locate
in the United States. Thus, this process identifies a much more homogeneous set of
MPL borrowers and matched neighbors. The remaining steps in the matching process
are similar to the baseline approach. Detailed descriptions of all matching approaches
are provided in Appendix B.
In order to study how MPL borrowers differ from non-MPL borrowing neighbors, we
make use of the following fixed-effects cross-sectional regression specification:
ln(
Yi,c,tYi,c,t−1
)= MPL Borroweri,c + γXi,c,t + αc + εi,c,t. (2)
In the above regression specification, MPL Borrower is an indicator variable that
equals 1 for individuals borrowing on the MPL platform, and 0 otherwise. The subscripts
i, t, and c identify individuals, year-months, and separate cohorts of matched MPL
borrowers and their closest non-MPL borrowing neighbors. The specification includes a
vector of cohort fixed effects; thus, this specification induces within-cohort variation by
comparing outcomes for MPL borrowers relative to their neighbors. Standard errors are
clustered at the 5-digit ZIP code level.
We run this specification separately for the quarters following MPL loan origination
by MPL borrowers. The dependent variables of interest are average credit card balance
growth, average credit utilization growth, average credit card limit growth, credit card
defaults, and average credit score growth (these averages are computed separately for
each quarter following MPL loan origination).
IV. Main Results
In this section, we present our main empirical results, which examine whether the origina-
tion of MPL loans induces the consolidation of expensive debt. In addition, we study the
effect on credit utilization ratios, credit scores, and ex post delinquencies and defaults.
As part of this process, we also gather insights into whether these borrower responses are
16
complemented by credit activities from banking intermediaries.
A. Do Borrowers Consolidate Debt Using MPL Loans? If So, What Kind Of Debt?
In this section, we use Equation (1) to study whether MPL borrowers consolidate debt in
the aftermath of MPL loan origination. And, if borrowers do consolidate debt, we analyze
the type of debt that is consolidated. The broad categories of trade lines we consider are
auto loans, mortgages, student debt, and credit card debt. The results of this analysis
are presented in the form of event study plots in Figure I. The x-axis in Figure I displays
time, in quarters, relative to the quarter of MPL loan origination. The y-axis expresses
percentage differences relative to balance levels in the quarter immediately preceding
MPL loan origination, Quarter−1, which serves as the absorbed or baseline period for
the event study analysis.
The plot for auto debt indicates that auto balances are not affected by the origination
of MPL loans. Indeed, auto balances appear to remain constant over the 25-month
window centered on the month in which the MPL loan is originated. Similarly, the plots
indicate that mortgage and student debt levels are also not influenced by MPL loan
originations.
On the other hand, credit card balances appear to follow a very different pattern. MPL
borrowers accrue credit card debt in the months leading up to MPL loan origination. In
our event study plot, we document an upward trend in credit card balances in the pre-
origination period. However, in the quarter of MPL loan origination, we find that credit
card balance levels are significantly lower relative to that in the quarter immediately
before MPL loan origination. However, we document an increasing trend in credit card
balances in subsequent quarters. Three quarters after origination, we note that credit
card balances are insignificantly different relative to the baseline period.
We also display our results in tabular form in Table II. In columns (I), (II), and (III),
we show that auto, mortgage, and student loan balances, respectively, are not affected
in an economically significant manner by MPL loan origination. In column (IV), we
present results for credit card balances. We find that MPL borrowers tend to accrue
credit card debt in the months leading up to MPL loan origination. We find that in the
quarter of MPL loan origination, credit card balances are more than 47% lower relative
to the quarter before origination, which is consistent with the consolidation of credit card
debt.20 However, we also note that this consolidation phase appears to be short lived. In
20The estimate on Quarter0 is -0.639, or -63.9%. However, the dependent variable is the loggedmonthly credit card balance. Thus, the percentage change equivalent is given by 100×[exp(−0.639)−1] =−47.22%.
17
subsequent quarters, these borrowers begin re-accumulating additional credit card debt,
so that three quarters after origination, credit card balance levels are not significantly
different from pre-origination levels.
Taken together, our findings suggest that borrowers utilize MPL funds in a manner
consistent with the vast majority of stated reasons on MPL platform loan applications.
Given how marketplace lending platforms have no mechanism in place to enforce the
appropriate use of borrowed funds, this finding suggests that the commonly stated aim of
debt consolidation is rarely misreported on loan applications. Moreover, these borrowers
only focus on consolidating their most expensive debt. The average interest rates on
auto, mortgage, and student debt are significantly lower than the 15–20% rates charged
on unsecured credit cards, which is the focus of MPL loan-induced consolidation activity.
However, our results also highlight the transience of this debt consolidation and debt
reduction activity. MPL borrowers are quick to accumulate credit card debt following
a short period of consolidation, which suggests that MPL platforms fail to change the
fundamental underlying consumption behavior of such borrowers. Moreover, in terms of
credit card debt, these borrowers are just as indebted three quarters after origination as
they were in the quarter before origination. This finding is rather problematic, since it
is important to note that MPL-induced credit card debt consolidation does not reduce
the aggregate debt exposure of the borrowing individual: Expensive credit card debt
is simply replaced with relatively less expensive MPL debt. Thus, these borrowers are
already burdened with the monthly payments associated with amortized MPL loans when
they begin consuming credit card debt again. This sort of “double dipping” activity leaves
such borrowers significantly more indebted in the months following MPL loan origination
relative to pre-origination levels.
B. How Are Credit Card Utilization Ratios Affected?
In this section, we study how the consolidation of credit card debt in the immediate
aftermath of MPL loan origination, followed by a sustained period of debt accumulation,
affects the credit card utilization ratios of these borrowers. The results of this analysis
are presented in the form of an event study plot in Figure II. The associated tabular
form results are presented in column (I) of Table III.
An analysis of the pre-trends reveals that the credit card utilization ratio of MPL
borrowers increases in the quarters leading up to MPL loan origination. However, in the
quarter of origination, these borrowers have utilization ratios that are 12% lower relative
to the baseline period. As these borrowers begin accumulating credit card debt again in
the quarters following consolidation, we note a corresponding steady rise in utilization
18
ratios. Finally, we note that three quarters after origination, utilization ratios are, on
average, approximately 4% lower relative to the baseline period.
This plot highlights two important and interesting findings. First, in the quarter of
MPL loan origination, when credit consolidation activity is strongest, utilization ratios
are only 12% lower relative to pre-consolidation levels. Table I documents that, on
average, MPL borrowers have utilization ratios of 69%. A drop of 12% in this value still
yields a utilization ratio of 60.7%. Thus, even in their “healthiest” financial situation,
these borrowers have utilization ratios that are nearly double the national average. This
further serves to highlight the difficult financial situation of people engaging in such
online platforms.
Second, from Table II, we note that three quarters after origination, these borrowers
are just as indebted in terms of credit card debt as they were before origination. However,
our analysis here reveals that three quarters following origination, these borrowers have
credit card utilization ratios that are significantly lower relative to pre-origination levels.
Given that the utilization ratio is calculated as:
Utilization =Credit Balance
Credit Limit,
these findings suggest that MPL borrowers experience an increase in their credit card
limits. Holding credit card balances constant, as is the case three quarters after MPL
loan origination, the only way that utilization ratios can decline is if credit card limits
have been extended in the interim period. We examine this channel formally in the next
section.
C. Do MPL Loans Alter The Level Of Credit Supply On Credit Cards?
We study whether credit card limits are affected by the consolidation activity fueled by
MPL loan origination. The results of this analysis are plotted in Figure III, and presented
in column (II) of Table III.
Our results indicate that in the pre-origination period, monthly credit card limit
growth is steady and not significantly different from the growth in the quarter before
MPL loan origination. However, our estimates on Quarter0 and Quarter+1 indicate
that monthly credit limit growth is approximately 0.59% (significant at the 5% level)
and 0.83% (significant at the 5% level) in the quarter of MPL loan origination and
the quarter immediately after loan origination, respectively. This finding suggests that
after origination, the increase in credit card limits outpaces the increase in credit card
balances. Therefore, the utilization ratio of these borrowers remains lower approximately
19
three quarters after origination, even though they have the same credit card debt as they
had before MPL loan origination.
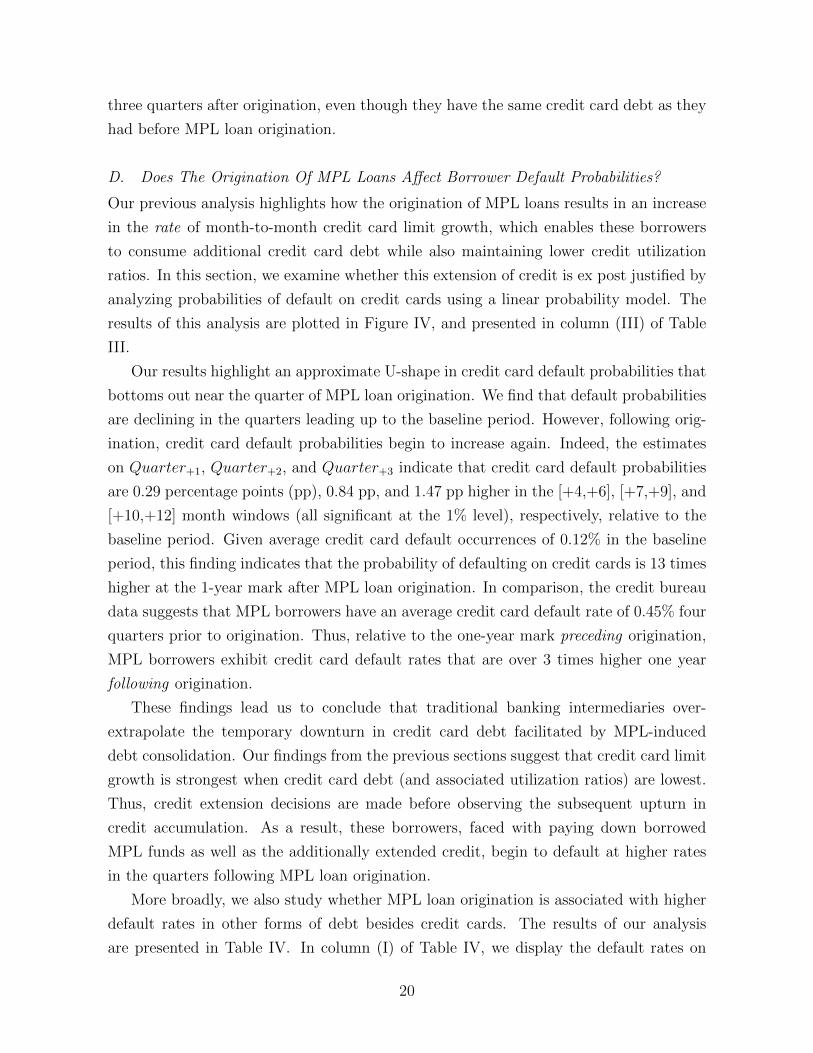
D. Does The Origination Of MPL Loans Affect Borrower Default Probabilities?
Our previous analysis highlights how the origination of MPL loans results in an increase
in the rate of month-to-month credit card limit growth, which enables these borrowers
to consume additional credit card debt while also maintaining lower credit utilization
ratios. In this section, we examine whether this extension of credit is ex post justified by
analyzing probabilities of default on credit cards using a linear probability model. The
results of this analysis are plotted in Figure IV, and presented in column (III) of Table
III.
Our results highlight an approximate U-shape in credit card default probabilities that
bottoms out near the quarter of MPL loan origination. We find that default probabilities
are declining in the quarters leading up to the baseline period. However, following orig-
ination, credit card default probabilities begin to increase again. Indeed, the estimates
on Quarter+1, Quarter+2, and Quarter+3 indicate that credit card default probabilities
are 0.29 percentage points (pp), 0.84 pp, and 1.47 pp higher in the [+4,+6], [+7,+9], and
[+10,+12] month windows (all significant at the 1% level), respectively, relative to the
baseline period. Given average credit card default occurrences of 0.12% in the baseline
period, this finding indicates that the probability of defaulting on credit cards is 13 times
higher at the 1-year mark after MPL loan origination. In comparison, the credit bureau
data suggests that MPL borrowers have an average credit card default rate of 0.45% four
quarters prior to origination. Thus, relative to the one-year mark preceding origination,
MPL borrowers exhibit credit card default rates that are over 3 times higher one year
following origination.
These findings lead us to conclude that traditional banking intermediaries over-
extrapolate the temporary downturn in credit card debt facilitated by MPL-induced
debt consolidation. Our findings from the previous sections suggest that credit card limit
growth is strongest when credit card debt (and associated utilization ratios) are lowest.
Thus, credit extension decisions are made before observing the subsequent upturn in
credit accumulation. As a result, these borrowers, faced with paying down borrowed
MPL funds as well as the additionally extended credit, begin to default at higher rates
in the quarters following MPL loan origination.
More broadly, we also study whether MPL loan origination is associated with higher
default rates in other forms of debt besides credit cards. The results of our analysis
are presented in Table IV. In column (I) of Table IV, we display the default rates on
20
credit cards, as shown in column (III) of Table III. As before, we note that credit card
default rates are 1.47 pp higher three quarters after MPL loan origination relative to
pre-origination levels. On the other hand, our estimates in columns (II), (III), and (IV)
suggest that default rates in auto loans, mortgage loans, and student loans, respectively,
are not significantly higher (in an economic sense). In column (V), we report results
for default rates on installment loans, and we note that, here too, the origination of
MPL loans is not associated with an economically significant rise in default rates three
quarters after origination. The findings reported in column (V) are interesting because
MPL loans, given their amortized repayment schedule, are recorded as installment loans.
Thus, taken together, our findings in columns (I) and (V) of Table IV suggest that, after
MPL loan origination, default rates spike for credit cards, but not for the MPL loan
itself.
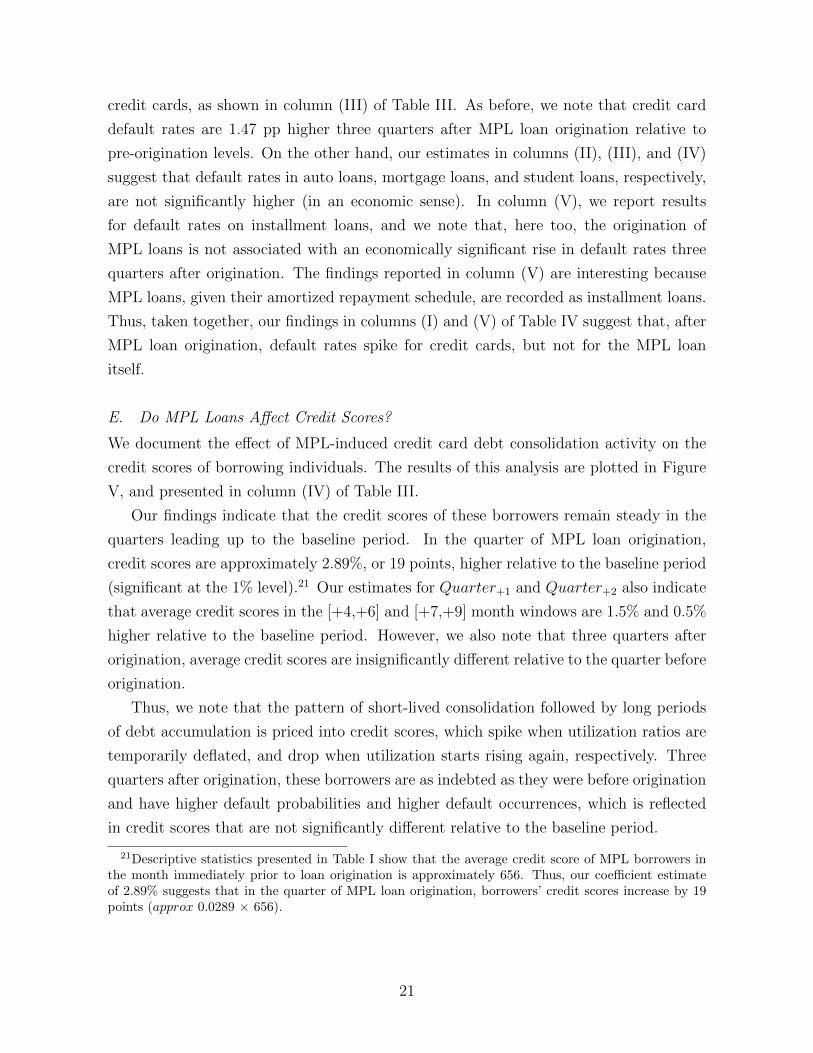
E. Do MPL Loans Affect Credit Scores?
We document the effect of MPL-induced credit card debt consolidation activity on the
credit scores of borrowing individuals. The results of this analysis are plotted in Figure
V, and presented in column (IV) of Table III.
Our findings indicate that the credit scores of these borrowers remain steady in the
quarters leading up to the baseline period. In the quarter of MPL loan origination,
credit scores are approximately 2.89%, or 19 points, higher relative to the baseline period
(significant at the 1% level).21 Our estimates for Quarter+1 and Quarter+2 also indicate
that average credit scores in the [+4,+6] and [+7,+9] month windows are 1.5% and 0.5%
higher relative to the baseline period. However, we also note that three quarters after
origination, average credit scores are insignificantly different relative to the quarter before
origination.
Thus, we note that the pattern of short-lived consolidation followed by long periods
of debt accumulation is priced into credit scores, which spike when utilization ratios are
temporarily deflated, and drop when utilization starts rising again, respectively. Three
quarters after origination, these borrowers are as indebted as they were before origination
and have higher default probabilities and higher default occurrences, which is reflected
in credit scores that are not significantly different relative to the baseline period.
21Descriptive statistics presented in Table I show that the average credit score of MPL borrowers inthe month immediately prior to loan origination is approximately 656. Thus, our coefficient estimateof 2.89% suggests that in the quarter of MPL loan origination, borrowers’ credit scores increase by 19points (approx 0.0289 × 656).
21
F. Robustness: Does Change In Employment Or Income Explain These Findings?
In this section, we study whether our results regarding increased credit limits on credit
cards and spikes in credit card default rates in the post-MPL loan origination period can
be explained through a change in the employment or income of the MPL borrower. It is
important to note, however, that MPL loans differ from traditional loans only in means
of origination, and thus, it is unlikely that they can impact the job profiles of individuals
engaging in MPL platforms. Moreover, our findings also suggest that defaults on credit
cards spike in the post-origination period; default rates on amortized MPL loans are
economically negligible. Therefore, the job or income loss argument cannot explain both
the higher rates of default on credit cards and the negligible rates of default on MPL
loans.
In order to formally test this “job/income loss” hypothesis, we make use of Equation
(1), and replace the dependent variable with a dependent variable that equals 1 if the
individual’s income in a given month differs from their income in the previous month,
and 0 otherwise. The results of this analysis are presented in column (I) of Table V. We
find that in the 12-month period before, and the 12-month period after the origination
of MPL loans, the probability of income change remains stable. In fact, the estimate
on Quarter0 is -0.15% (significant at the 5% level), which suggests that the probability
of monthly income changing is lower in the quarter of MPL loan origination relative to
the quarter immediately preceding MPL loan origination. This effect is economically
insignificant, however.
We also study Equation (1), with job change as the dependent variable. This variable
accounts for changes in an individual’s occupation, and takes the value of 1 when the job
code in a given month differs from the job code in the previous month, and 0 otherwise.
This variable also accounts for job loss, since unemployment is provided its own job
code. The results of our analysis are presented in column (II) of Table V. Here again,
we find that occurrences of job changes remain negligible in the months following MPL
loan origination.
Taken together, our findings in this section suggest that MPL loan origination does
not alter the job or income profiles of borrowers. Both monthly income and occupation
remain stable in the year before and the year after MPL loan origination. Thus, our
findings regarding increased credit card default rates cannot be attributed to loss of
employment or loss of income on the part of borrowers.
22
G. Robustness: Do Region-Specific Economic Shocks Drive These Findings?
In this section, we document the robustness of our findings to region-specific factors. A
key concern with our documented results is that our findings are driven by some regional
economic characteristics that are exogenous to the decision of borrowing funds from an
MPL platform. This is especially relevant for our results regarding credit limit extensions
and borrower credit card defaults. Profitability estimates at the state or county level can
affect bank decisions to expand or contract credit in different regions. Moreover, negative
region-specific economic shocks could also explain borrower defaults that are independent
of the decision to borrow on MPL platforms.
In order to account for these factors, we replace the year-quarter fixed effects in
our base specification with (5-digit) ZIP code × year-quarter fixed effects in order to
capture time-varying trends within 5-digit ZIP codes. Moreover, we double cluster our
standard errors at the 5-digit ZIP and year-quarter levels. The results of this analysis
are presented in Table VI. We note that our results regarding credit card balances,
utilization ratios, credit limits, defaults, and credit scores are unaffected by this more
stringent specification.
H. Accounting For Endogeneity Of Engaging On MPL Platforms
In this section, we compare the effects of MPL loan origination specific to MPL borrowers
relative to a matched control sample of non-MPL borrowing neighbors residing in the
same 5-digit ZIP code as the borrowing individual. The “baseline” matching approach
used to create cohorts of MPL borrowers (treated) and their non-borrowing neighbors
(control) is described in detail in Appendix B.
In Table VII, we present descriptive statistics highlighting the success of the “baseline”
matching process. We note that in the three months leading up to MPL loan origination,
MPL borrowers and their neighbors have similar amounts of credit card debt, identical
credit card utilization ratios, and identical credit scores. Moreover, both groups show
similar trends in the quarter leading up to the month of MPL loan origination for MPL
borrowers. In addition, these similarities remain consistent within the subprime, near-
prime, and prime segments. Finally, we note that both MPL borrowers and neighbors
appear to have similar monthly incomes and debt-to-income ratios, with only minor
differences in total credit balances.
The results of our fixed effects cross-sectional regression (Equation (2)) are presented
in Table VIII. In Panel A, the dependent variable is the average monthly change in
credit card balances. In column (I), we analyze average monthly credit card balance
changes in the quarter of MPL loan origination (months [0,+3]). The coefficient on the
23
MPL borrower indicator is negative, suggesting that, relative to their neighbors, MPL
borrowers display a 13.20% stronger declining trend in credit card balances in the quarter
of MPL origination. In column (II), we analyze average monthly credit card balance
changes in the quarter immediately following MPL loan origination (months [+4,+6]).
Here, the indicator of interest is positive, and suggests that one quarter after origination,
MPL borrowers accrue credit card debt at a rate that is 13.37% stronger relative to
their neighbors. Positive and significant coefficients on the dummy of interest in columns
(III)-(VI) suggest that the higher rate of debt accrual on credit cards by MPL borrowers
persists for a relatively long time, but it also suggests that this rate declines over time.
Six to seven quarters after MPL origination, we find no evidence suggesting that MPL
borrowers accrue or pay down credit card debt at a greater rate relative to their nearest
neighbors.
With our empirical specification, it is not possible to attribute our findings to MPL
loan-induced consolidation activities by MPL borrowers. For example, the negative co-
efficient on the MPL borrower dummy in column (I) of Panel A could be driven by
neighbors accruing credit card debt at a greater rate in the quarter of MPL loan origi-
nation, as opposed to our suggested interpretation of credit card debt consolidation on
the part of MPL borrowers. Thus, we run Equation (1) separately for MPL borrowers
and their neighbors, and present the associated event study plots for monthly credit card
balances in Panel A of Figure VI. These plots suggest that MPL borrowers and their
neighbors display similar trends and rates of credit card debt accumulation in the year
leading up to MPL loan origination. However, once an MPL loan is originated, MPL
borrowers display greater debt consolidation than their neighbors. The plot highlights
that one quarter after origination, MPL borrowers revert to consuming on credit cards
at a greater rate than their neighbors and this rate decreases over time. Taken together,
our findings, as shown in Panel A of Table VIII and Panel A of Figure VI, indicate that
MPL loans help MPL borrowers reduce debt in the immediate term. However, they also
point out that this consolidation effect is relatively short lived.
In Panel B of Table VIII, we present results for average monthly changes in credit card
utilization. Our findings suggest that MPL borrowers experience declining utilization
ratios at a rate that is 3.15% stronger relative to neighbors in the quarter of MPL loan
origination. In subsequent quarters, as MPL borrowers begin consuming on credit cards
again, their utilization ratios grow at a faster rate relative to their neighbors. Our findings
are also presented separately for MPL borrowers and neighbors in the form of event study
plots in Panel B of Figure VI.
In Panel C of Table VIII, we analyze average monthly changes in credit card lim-
24
its. In the quarter of MPL loan origination, our estimate suggests that MPL borrowers
experience an increase in credit card limits that is 1.72% stronger relative to their neigh-
bors. In fact, our estimates in columns (I)-(IV) suggest that MPL borrowers experience
stronger credit limit growth rates than their neighbors for over one year following MPL
loan origination. We find evidence suggesting that in subsequent quarters, the credit
card limit growth rates of neighbors predominates. Panel C of Figure VI presents the
associated event study plots for MPL borrowers and their neighbors.
We study credit card default rates using a linear probability model, and we present
the associated findings in Panel D of Table VIII. Our findings suggest that, relative to a
matched sample of neighbors, MPL borrowers initially default on credit cards at a lower
rate. However, in the year following MPL loan origination, MPL borrowers default at
significantly higher rates. Our findings suggest that two years after loan origination, MPL
borrowers exhibit over a 2 pp higher propensity to default relative to their neighbors.
The associated plots are displayed in Panel D of Figure VI.
Finally, in Panels E of Table VIII and Figure VI, we present our findings regarding
credit scores. Our findings suggest that MPL borrowers experience stronger growth in
credit scores in the quarter of MPL loan origination when credit card debt consolida-
tion activity is strongest. Due to the subsequent rise in consumption, MPL borrowers
experience stronger declines in credit scores relative to their neighbors.
In additional robustness tests, we report results for cohorts of borrowers and neighbors
created using the two variants of the “baseline” matching approach. The results of these
analyses are presented in Appendix Tables C.I and C.II, respectively. We document
consistent estimates regardless of the matching approach used. We should discuss our
results regarding the growth of credit card limits when we match MPL borrowers who
were denied credit by banks to their nearest neighbors who were also denied credit by
banks. Here, our findings suggest that the origination of MPL loans results in stronger
credit limit growth for MPL borrowers relative to their neighbors. Thus, even MPL
borrowers who were previously denied bank credit (or denied credit at favorable terms)
experience increases in credit limits as a result of MPL loans.
V. Discussion: Who Wins Or Loses From Borrowing On MPL Platforms?
In this section, we discuss if there are systematics differences among the borrowers who
benefit from borrowing from MPL platforms and those that don’t benefit.
25
A. Winners And Losers Of Marketplace Lending
We analyze how our results vary across different cross-sections of our sample in order to
understand the borrowers that may benefit and those that don’t from borrowing from the
MPL platform. The cross-sectional cuts we consider are (a) the credit status of the MPL
borrower at the time of loan origination, (b) the interest rates charged on peer-funded
MPL loans, and (c) the loan amounts extended through MPL platforms.
A.1. Role Of MPL Borrower Credit Quality
Thus far, our analysis has treated all MPL borrowers as if they were equal in terms
of financial sophistication. In this subsection, we re-conduct the previous analysis in
three separate credit segments: the subprime credit segment (i.e., credit score below 620
before loan origination), the near-prime segment (credit score greater than or equal to
620 and less than 680), and the prime segment (credit score greater than or equal to
680). The subprime, near-prime, and prime segments account for 23%, 50%, and 27%
of all borrowers in our sample, respectively. The results of this analysis are presented in
Table IX, and the event study plots are displayed in Figure VII.
In Panel A of Table IX, we present regression results for our analysis involving credit
card balances. The analysis is run separately for the subprime, near-prime, and prime
segments, and the results are displayed in columns (I), (II), and (III), respectively. Our
estimates indicate that relative to their in-group baseline means, subprime (prime) bor-
rowers consolidate the least (most) amount of credit card debt. Moreover, we find that
starting from two quarters (three quarters) after MPL loan origination, average sub-
prime (near-prime) credit card indebtedness is not significantly different relative to their
in-group baseline mean. On the other hand, three quarters after origination, prime MPL
borrowers appear to be 17.7% less indebted relative to their in-group baseline mean.
Our findings in Panel B suggest that all three segments have lower credit utilization
ratios after MPL loan origination relative to the baseline period. Panel C shows how
monthly credit card limit growth is affected by MPL loan origination. We find that
subprime borrowers experience a 1.33% stronger increase in monthly credit card limit
growth in the quarter of loan origination, and they experience a 1.44% stronger increase
in the quarter immediately after origination. We also find that near-prime borrowers
experience a 0.50% stronger increase in credit growth in the quarter of loan origination,
but this estimate is only marginally significant. Finally, prime borrowers don’t seem to
experience a change in credit limit growth in the 25-month window centered on loan
origination.
Panel D shows our analysis of credit card default rates. The results indicate that
26
three quarters after origination, the subprime segment has a 5.07 pp higher default rate
relative to the baseline period. The subprime MPL borrower segment has an average
credit card default rate of 0.25% in the three months immediately preceding MPL loan
origination. Thus, the coefficient estimate at the one-year mark suggests that credit card
default rates are approximately 20 times higher for the subprime group one year follow-
ing origination relative to the quarter immediately preceding origination. However, it is
important to note from Figure VII (Panel E) that subprime borrowers display a declining
trend in credit card default rates in the months leading up to MPL origination. In fact,
four quarters prior to origination, the credit bureau data suggests that subprime borrow-
ers have credit card default rates of approximately 1%. Thus, relative to the one-year
mark preceding origination, our findings suggest that credit card default rates are ap-
proximately 5 times higher for the subprime group one year following origination.22 The
near-prime and prime segments experience economically and statistically insignificant
changes in default rates, respectively.
Taken together, our above findings suggest that subprime borrowers consolidate a
relatively smaller portion of their credit card debt using MPL funds, but they experience
the strongest increase in monthly credit limit growth. Moreover, our estimates also
suggest that the subprime segment is as indebted two quarters after origination as they
were before origination. This “double dipping” into both MPL and credit card funds
ironically increases the aggregate indebtedness of the subprime segment, thus making
them more susceptible to default.
Finally, Panel E shows our analysis of the evolution of credit scores. We find that
all three segments benefit from credit card debt consolidation, as reflected by higher
credit scores in the quarters immediately following MPL loan origination. However, three
quarters after origination, the subprime and near-prime segments have credit scores that
are not significantly different from pre-origination levels in the baseline period. Moreover,
the prime segment has credit scores that are actually 0.58% lower relative to the baseline
period.
Taken together, our findings suggest that regardless of the borrower’s credit quality at
the time of loan origination, MPL loans are used to consolidate credit card debt. In doing
so, these loans relax financial constraints for all borrowers through lower utilization ratios
22In addition, we also compare subprime MPL borrowers to their closest subprime non-MPL borrowingneighbors using the cohort-level framework described in Section III.B.2. We find that at the two-yearmark post-origination, non-MPL subprime neighbors have average credit card default rates of 4.2%compared to subprime MPL borrowers, who exhibit average credit card default rates of 6.3%. Thissuggests that subprime MPL borrowers are approximately 1.5 times as likely to default on credit cardsas subprime non-MPL neighbors.
27
and higher credit scores. Banks appear to react to this new information as well, since
credit card limits increase significantly when debt is being consolidated. This growth
in credit limits is strongest for the most constrained borrowers – the subprime segment.
However, this segment is also quick to revert to consumption behavior; within six months
of MPL loan origination, subprime borrowers are as indebted in credit card debt as they
were before origination. Given the increased aggregate debt burden, credit card default
rates rise dramatically for subprime borrowers in the post-origination period.23
A.2. Interest Rates On Loans
We next conduct cross-sectional tests based on interest rates charged on MPL platforms.
These loans from MPL are typically installment loans with amortized monthly payments.
From the credit bureau trades file, we know the total principal borrowed (P), the sched-
uled monthly payment (A), and the term of the loan (n) in months. Thus, we make use
of the amortization formula,
A = P × r × (1 + r)n
(1 + r)n − 1,
to back out the interest rate charged on the loan (r). Next, for each calendar year,
we sort this interest rate into terciles, with the lowest (highest) tercile representing the
portfolio of low (high) interest rate loans.
We conduct our analysis of credit card balances, utilization, limit growth, default
rates, and credit scores separately for each of the three terciles. Appendix Table C.IV
shows that the aforementioned negative aspects of MPL borrowing are concentrated in
loans originated at high interest rates. Conversely, borrowers who receive these funds at
low interest rates are better off.
A.3. Loan Amounts
For our next set of tests, we partition our sample of MPL borrowers into terciles on the
basis of extended MPL loan amounts. These terciles are reconstituted for each calendar
year, with the lowest (highest) tercile corresponding to the portfolio of loans with low
(high) origination amounts. Appendix Table C.V shows that the negative (positive)
aspects of MPL funds are concentrated in the portfolio of loans with low (medium- or
high-) origination amounts.
23In additional results, presented in Appendix Table C.III, we document that, even for the subprimesegment of MPL borrowers, defaults occur mostly on credit cards, and not the MPL loan itself.
28
B. Are There Improvements In Perceived Credit Quality Of MPL Borrowers?
Thus far, we have documented that the origination of MPL loans is associated with an
immediate increase in limits on credit cards, and this increase is largest for the subprime
and near-prime segments. We find no evidence of prime MPL borrowers experiencing
abnormal limit growth following MPL loan origination. In this section, we attempt to
identify whether MPL loans improve the perceived credit quality of borrowers, which
could potentially explain the post-MPL loan origination increase in credit card limits.
In order to conduct our analysis, we utilize the baseline matching approach described
earlier, and identify cohorts that were subprime in the month immediately before the
month of MPL loan origination. On this set of subprime cohorts, we implement the
following fixed effects cross-sectional regression:
Yi,c = MPL Borroweri,c + γXi,c + αc + εi,c. (3)
As before, MPL Borrower is an indicator that equals 1 if the individual is an MPL
borrower, and 0 otherwise. Yi is the outcome variable, represented in the form of logged
changes. For our analysis, we study changes in average outcomes in the three months
following MPL loan origination to the three months immediately preceding MPL loan
origination. Xi,c represents control variables, and αc is a vector of cohort fixed effects.
Standard errors are clustered at the 5-digit ZIP code level.
The results of our analysis are presented in Panel A of Table X. In column (I), the
dependent variable is the average credit score growth, defined as the logged average credit
score of the individual in months [+1,+3] less her logged average score in months [-3,-
1], where month 0 refers to the month of MPL loan origination by the MPL borrower.
The use of cohort-level fixed effects induces within-cohort comparisons between the MPL
borrower and her neighbor. The estimate on the MPL borrower dummy indicates that,
relative to their neighbors, MPL borrowers experience a 5.43% increase (significant at the
1% level) in average credit scores in the [+1,+3] window after MPL loan origination.24
Next, we study the impact of impact of increased credit scores on credit card limit
growth in a 2SLS setting, where the change in credit scores is instrumented by a dummy
variable indicating MPL borrower status. Thus, our regression results discussed in col-
24From descriptive statistics presented in Table VII, the average credit score of subprime MPL bor-rowers in the three months immediately preceding the month of MPL loan origination is approximately600. Thus, in the [+1,+3] month window, previously subprime MPL borrowers experience average creditscores of approximately 633 (≈ 1.0543 × 600). Note that this back-of-the-envelope calculation implic-itly assumes that non-borrowing subprime neighbors do not experience any change in their credit scorefollowing MPL loan origination by the MPL borrower.
29
umn (I) above serve as the first stage of this instrumented regression. We use the same
control variables and vector of fixed effects as in Equation 3. The results of this analysis
are presented in column (II) of Panel A. The outcome variable is average credit card
limit growth, defined as the logged average aggregate credit card limits for the individual
in months [+1,+3] less her logged average aggregate credit card limits in months [-3,-1],
where month 0 refers to the month of MPL loan origination. Here, our IV results sug-
gest that MPL-loan induced 1% increases in credit scores results in 0.89% stronger credit
limit growth (significant at 1% level) for the MPL borrower relative to her non-borrowing
neighbor within the same subprime cohort. The F-statistic for the excluded instrument
is well above 10, suggesting that it is a strong instrument. Finally, in column (III), we
study the impact of credit score growth on credit limit growth in a fixed effects setting
without the instrument, and note that within subprime cohorts, a 1% increase in credit
scores results in 0.32% stronger credit limit growth.
In Panel B, we repeat the analysis for near-prime cohorts. In column (I) of Panel B,
we note that near-prime MPL borrowers experience an average credit score increase of
4.25% relative to their near-prime neighbors within the same cohort.25 In column (II),
we study the impact of credit score changes on credit card limits in an instrumented
setting, and note that within a near-prime cohort, an MPL-loan induced 1% increase
in credit scores results in 0.11% stronger credit limit growth (significant at 1% level)
for the MPL borrower relative to her non-borrowing neighbor. The non-instrumented
counterpart, presented in column (III), suggests that within near-prime cohorts, a 1%
increase in credit scores is associated with a 0.05% stronger growth in credit card limits.
Column (I) in both panels suggest large increases in credit scores for MPL borrowers
in the quarter immediately following MPL loan origination. Thus, we study whether
MPL loans results in MPL borrowers crossing industry-standard credit score thresholds
in the aftermath of origination.26 We empirically test this statement for the subprime
cohort by making use of Equation (3), and replace the dependent variable with a dummy
that takes the value of 1 if the individual’s credit score crosses the 620 threshold in months
[+1,+3], and 0 otherwise. The results of this analysis are presented in column (IV) of
Panel A. The coefficient estimate suggests that subprime MPL borrowers are nearly 35%
25From descriptive statistics presented in Table VII, the average credit score of near-prime MPL bor-rowers in the three months immediately preceding the month of MPL loan origination is approximately649. Thus, our estimate suggests that near-prime MPL borrowers enjoy an average credit score of 677(≈ 1.0425 × 649) in the three months immediately following MPL loan origination. Again, we assumethat non-borrowing near-prime neighbors do not experience any change in their credit scores in thepost-MPL loan origination period.
26See Keys et al. (2010), Rajan, Seru, and Vig (2015), and Agarwal et al. (2018) for the importanceof credit scores in bank lending decisions.
30
more likely (significant at the 1% level) to cross the subprime/near-prime threshold in
the quarter following MPL loan origination than a matched sample of geographically
proximate subprime neighbors. Similar analysis conducted for near-prime segments sug-
gests that near-prime MPL borrowers are nearly 33% more likely (significant at the 1%
level) to cross the near-prime/prime credit score threshold of 680 in the quarter after
MPL loan origination than their near-prime neighbors.
The results in this section suggest that MPL platforms may not be generating any
new soft information about borrowers on their platforms that are unavailable to their
banks. Moreover, our findings also do not necessarily indicate that MPL platforms
are better than banks at screening, as argued in Balyuk (2018). While MPL loans
assist in reducing financial constraints on borrowers through lower credit card balances,
lower utilization, and higher credit scores, they also trigger actions from traditional bank
creditors. It appears that banks possibly overweight the short-lived credit score increase
induced through loans from MPL, even though the associated consolidation activity is
both short-lived and at odds with their (very recent) historical consumption patterns.
Taken together, our results in Tables IX and X suggest that this extension of limits is
inefficient ex post, especially for subprime MPL borrowers. Our results strongly suggest
that bank credit extension decisions are strongly influenced by credit scores, consistent
with the arguments posed in Rajan, Seru, and Vig (2015) and Agarwal, Chomsisengphet,
Mahoney, and Stroebel (2018).
VI. Conclusion
In this paper, we document some of the benefits and drawbacks of the emergence of MPLs
for consumer loans. Incidences of misreporting appear to be rare, despite the fact that
MPLs have no mechanism in place to ensure loans made on such platforms are used for
credit card debt consolidation, which is frequently stated by applicants as the purpose of
the loan. However, it appears that these loans fail to change the fundamental behavior of
the relatively undisciplined and financially troubled MPL borrowers. More importantly,
the temporary financial relief bought on by such loans is incorrectly interpreted by some
traditional lenders, who subsequently extend additional credit to these borrowers. These
borrowers, in turn, consume the newly extended credit and are thus more indebted after
origination, in aggregate. Due to this increased overall indebtedness, MPL borrowers
have higher probabilities of default in the months after MPL loan inception. Finally,
cross-sectional analysis reveals that subprime borrowers, who account for nearly 1 in 4
people borrowing on such platforms, are most negatively affected.
Our results suggest that MPLs can be attractive sources of funding for deeply indebted
31
people who seek to alleviate financial constraints. Indeed, our results indicate that MPL
funds help reduce credit card debt by approximately 47%, on average, in the quarter
of loan origination. While the absolute level of debt payment is lower for the subprime
segment, subprime borrowers still enjoy a credit score increase of approximately 3.5%
relative to their pre-origination levels. MPL borrowers also enjoy lower utilization ratios
post-MPL origination. Thus, at least in the short run, MPL borrowers benefit through
lower interest payments, improvement in credit scores, and increases in credit limit.
In the longer horizon following debt consolidation, the benefits to MPL borrowers
depend on their subsequent credit utilization. The borrowers who benefit from MPLs
are those who have the financial discipline to avoid drawing down on their subsequently
higher credit limits. However, borrowers who lack this financial discipline, or who are too
financially stressed to avoid drawing down on their higher credit limits, end up in a worse
financial condition after obtaining an MPL loans. These MPL borrowers, many of them
subprime, default at a significantly higher rate, even when compared to their non-MPL
borrowing neighbors with similar ex ante credit dynamics. Thus, there are winners and
losers among MPL borrowers.
In line with the arguments posed in Rajan, Seru, and Vig (2015) and Agarwal, Chom-
sisengphet, Mahoney, and Stroebel (2018), our results suggest that bank credit extension
decisions are strongly influenced by credit scores. To the extent that credit card debt
consolidation through MPL loans influence credit scores and thereby bank credit exten-
sion decisions, our results have broader implications for credit extension decisions by
traditional banks.
32
References
Agarwal, S., S. Chomsisengphet, N. Mahoney, and J. Stroebel. 2018. Do banks passthrough credit expansions? The marginal profitability of consumer lending during thegreat recession. The Quarterly Journal of Economics 133:129–190.
Agarwal, S., C. Liu, and N. S. Souleles. 2007. The reaction of consumer spending anddebt to tax rebatesevidence from consumer credit data. Journal of Political Economy115:986–1019.
Agarwal, S., J. Pan, and W. Qian. 2016. Age of decision: Pension savings withdrawaland consumption and debt response. Working Paper .
Agarwal, S., W. Qian, and X. Zou. 2017. Thy neighbor’s misfortune: Peer effect onconsumption. Working Paper .
Akerlof, G. A. 1970. The market for” lemons”: Quality uncertainty and the marketmechanism. Quarterly Journal of Economics pp. 488–500.
Balyuk, T. 2018. Financial innovation and borrowers: Evidence from peer-to-peer lend-ing. Working Paper .
Banerjee, A. V. 1992. A simple model of herd behavior. The Quarterly Journal ofEconomics 107:797–817.
Bartlett, R., A. Morse, R. Stanton, and N. Wallace. 2018. Consumer-lending discrimina-tion in the FinTech era. Working Paper .
Berg, T., V. Burg, M. Puri, and A. Vanjak. 2018. On the rise of FinTechs – Creditscoring using digital footprints. Working Paper .
Bikhchandani, S., D. Hirshleifer, and I. Welch. 1992. A theory of fads, fashion, custom,and cultural change as informational cascades. Journal of Political Economy 100:992–1026.
Buchak, G., G. Matvos, T. Piskorski, and A. Seru. 2017. Fintech, regulatory arbitrage,and the rise of shadow banks. Tech. rep., National Bureau of Economic Research.
Demyanyk, Y., E. Loutskina, and D. Kolliner. 2017. The taste of peer-to-peer loans.Working Paper .
Duarte, J., S. Siegel, and L. Young. 2012. Trust and credit: The role of appearance inpeer-to-peer lending. Review of Financial Studies 25:2455–2484.
Freedman, S. M., and G. Z. Jin. 2011. Learning by doing with asymmetric information:Evidence from Prosper.com. Tech. rep., National Bureau of Economic Research.
Gross, D. B., and N. S. Souleles. 2002. Do liquidity constraints and interest rates matterfor consumer behavior? Evidence from credit card data. The Quarterly Journal ofEconomics 117:149–185.
33
Hasan, I., Q. He, and H. Lu. 2018. Stereotypes and lending: Evidence from person-to-person transactions. Working Paper .
Hertzberg, A., A. Liberman, and D. Paravisini. 2018. Screening on Loan Terms: Evidencefrom Maturity Choice in Consumer Credit. Review of Financial Studies .
Hildebrand, T., M. Puri, and J. Rocholl. 2016. Adverse incentives in crowdfunding.Management Science 63:587–608.
Iyer, R., A. I. Khwaja, E. F. Luttmer, and K. Shue. 2015. Screening peers softly: Inferringthe quality of small borrowers. Management Science 62:1554–1577.
Jagtiani, J., and C. Lemieux. 2017. FinTech lending: Financial inclusion, risk pricing,and alternative information. Working Paper .
Jimenez, G., S. Ongena, J.-L. Peydro, and J. Saurina. 2012. Credit supply and monetarypolicy: Identifying the bank balance-sheet channel with loan applications. AmericanEconomic Review 102:2301–26.
Jimenez, G., S. Ongena, J.-L. Peydro, and J. Saurina. 2014. Hazardous Times for Mon-etary Policy: What Do Twenty-Three Million Bank Loans Say About the Effects ofMonetary Policy on Credit Risk-Taking? Econometrica 82:463–505.
Keys, B. J., T. Mukherjee, A. Seru, and V. Vig. 2010. Did securitization lead to lax screen-ing? Evidence from subprime loans. The Quarterly Journal of Economics 125:307–362.
Leland, H. E., and D. H. Pyle. 1977. Informational asymmetries, financial structure, andfinancial intermediation. Journal of Finance 32:371–387.
Lin, M., N. R. Prabhala, and S. Viswanathan. 2013. Judging borrowers by the companythey keep: Friendship networks and information asymmetry in online peer-to-peerlending. Management Science 59:17–35.
Michels, J. 2012. Do unverifiable disclosures matter? Evidence from peer-to-peer lending.The Accounting Review 87:1385–1413.
Paravisini, D., V. Rappoport, and E. Ravina. 2016. Risk aversion and wealth: Evidencefrom person-to-person lending portfolios. Management Science 63:279–297.
Phillippon, T. 2015. Has the US finance industry become less efficient? On the theory andmeasurement of financial intermediation. American Economic Review 105:1408–1438.
Pope, D. G., and J. R. Sydnor. 2011. Whats in a picture? Evidence of discriminationfrom Prosper.com. Journal of Human Resources 46:53–92.
Rajan, U., A. Seru, and V. Vig. 2015. The failure of models that predict failure: Distance,incentives, and defaults. Journal of Financial Economics 115:237–260.
Ravina, E. 2012. Love & loans: The effect of beauty and personal characteristics in creditmarkets. Working Paper .
34

Stango, V., and J. Zinman. 2009. What do consumers really pay on their checking andcredit card accounts? Explicit, implicit, and avoidable costs. American EconomicReview 99:424–429.
Stiglitz, J. E., and A. Weiss. 1981. Credit rationing in markets with imperfect informa-tion. American Economic Review 71:393–410.
Wolfe, B., and W. Yoo. 2017. Crowding out banks: Credit substitution by peer-to-peerlending. Working Paper .
35
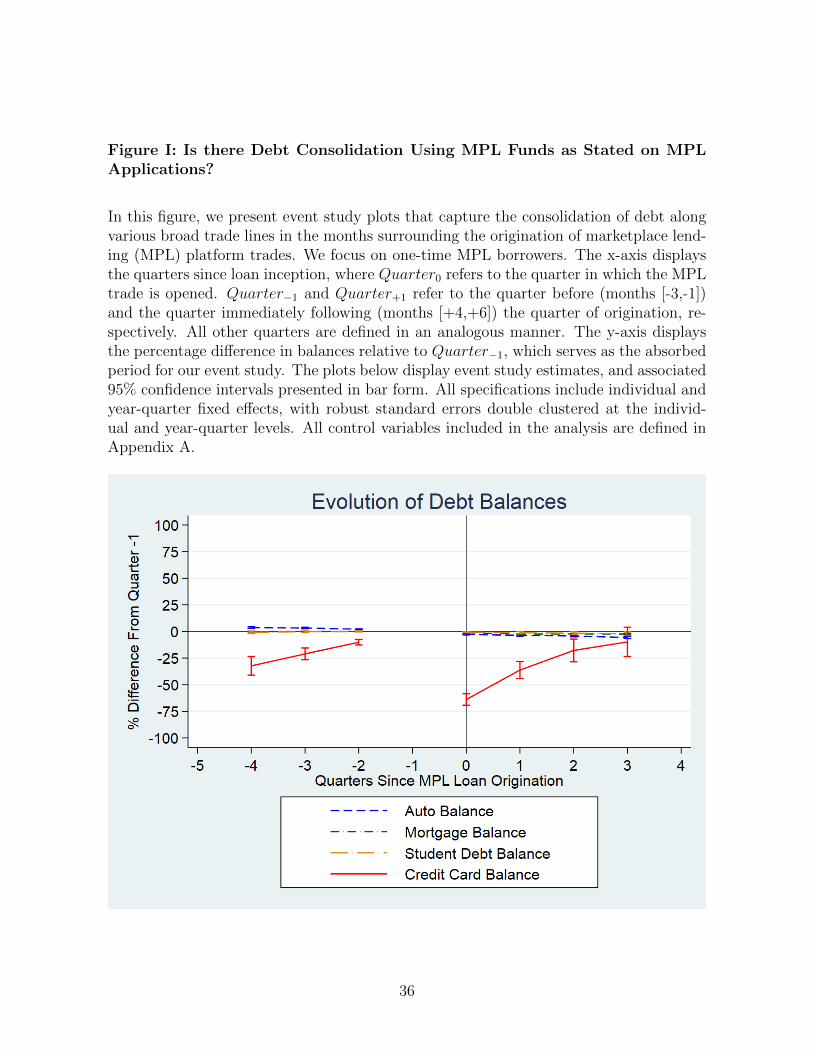
Figure I: Is there Debt Consolidation Using MPL Funds as Stated on MPLApplications?
In this figure, we present event study plots that capture the consolidation of debt alongvarious broad trade lines in the months surrounding the origination of marketplace lend-ing (MPL) platform trades. We focus on one-time MPL borrowers. The x-axis displaysthe quarters since loan inception, where Quarter0 refers to the quarter in which the MPLtrade is opened. Quarter−1 and Quarter+1 refer to the quarter before (months [-3,-1])and the quarter immediately following (months [+4,+6]) the quarter of origination, re-spectively. All other quarters are defined in an analogous manner. The y-axis displaysthe percentage difference in balances relative to Quarter−1, which serves as the absorbedperiod for our event study. The plots below display event study estimates, and associated95% confidence intervals presented in bar form. All specifications include individual andyear-quarter fixed effects, with robust standard errors double clustered at the individ-ual and year-quarter levels. All control variables included in the analysis are defined inAppendix A.
36
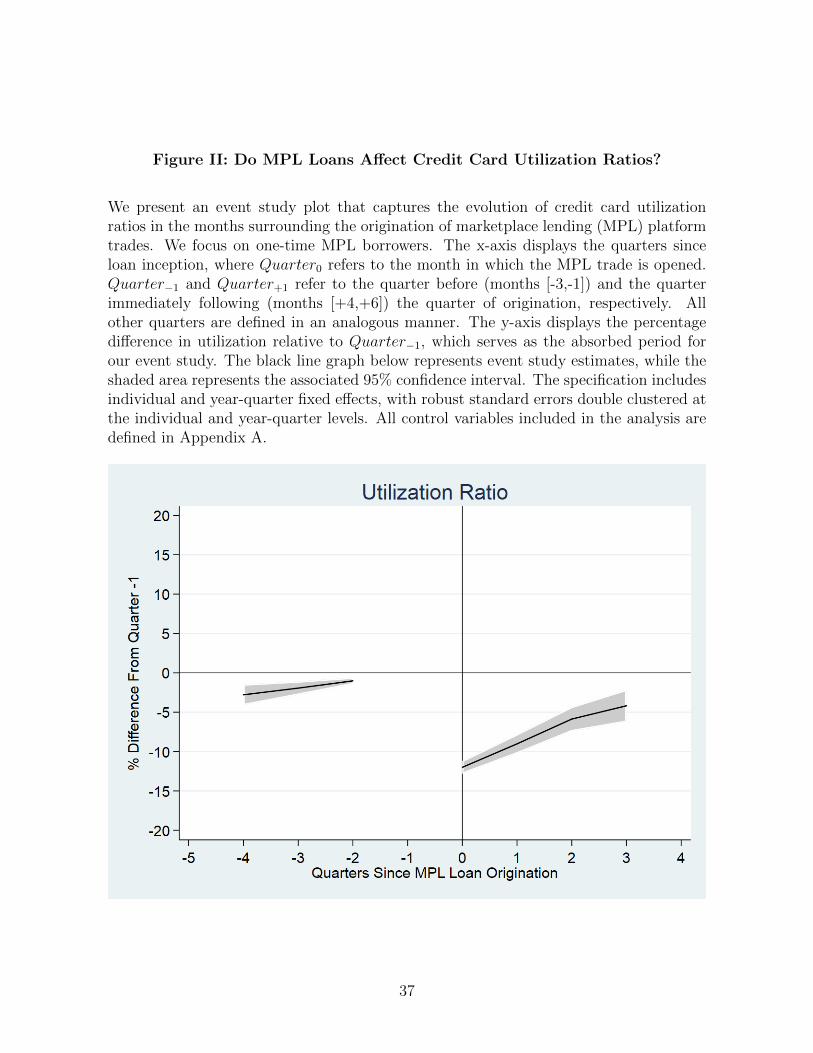
Figure II: Do MPL Loans Affect Credit Card Utilization Ratios?
We present an event study plot that captures the evolution of credit card utilizationratios in the months surrounding the origination of marketplace lending (MPL) platformtrades. We focus on one-time MPL borrowers. The x-axis displays the quarters sinceloan inception, where Quarter0 refers to the month in which the MPL trade is opened.Quarter−1 and Quarter+1 refer to the quarter before (months [-3,-1]) and the quarterimmediately following (months [+4,+6]) the quarter of origination, respectively. Allother quarters are defined in an analogous manner. The y-axis displays the percentagedifference in utilization relative to Quarter−1, which serves as the absorbed period forour event study. The black line graph below represents event study estimates, while theshaded area represents the associated 95% confidence interval. The specification includesindividual and year-quarter fixed effects, with robust standard errors double clustered atthe individual and year-quarter levels. All control variables included in the analysis aredefined in Appendix A.
37
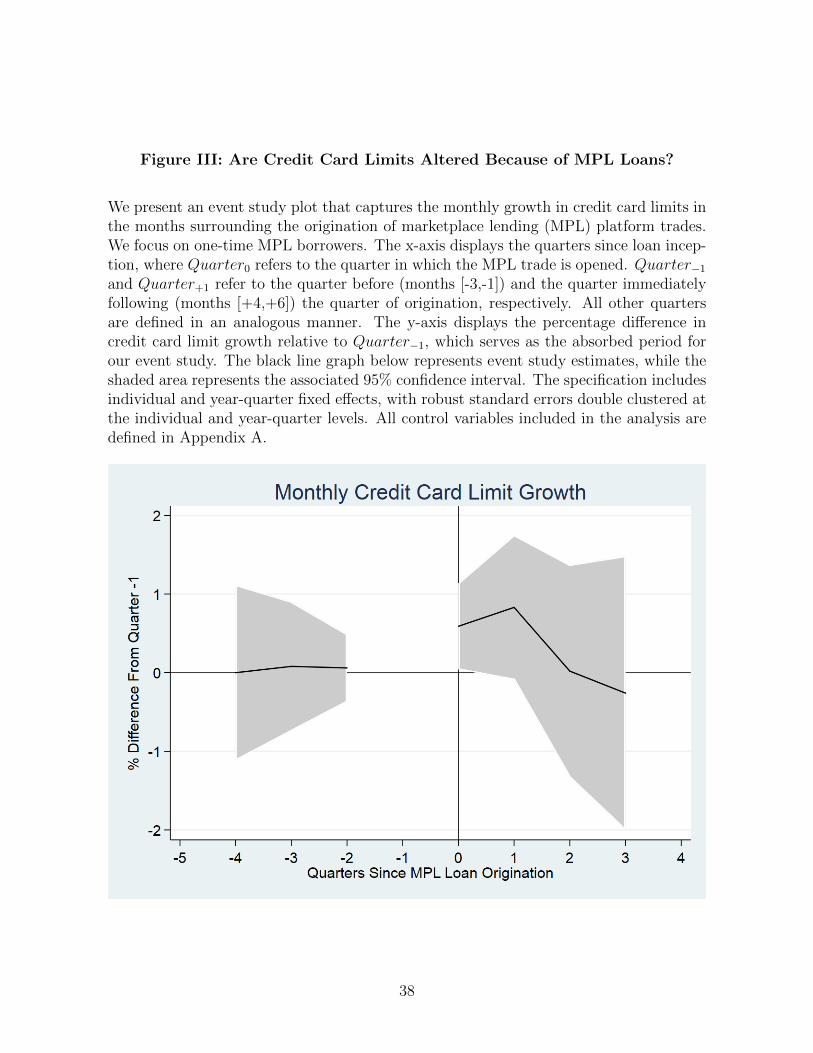
Figure III: Are Credit Card Limits Altered Because of MPL Loans?
We present an event study plot that captures the monthly growth in credit card limits inthe months surrounding the origination of marketplace lending (MPL) platform trades.We focus on one-time MPL borrowers. The x-axis displays the quarters since loan incep-tion, where Quarter0 refers to the quarter in which the MPL trade is opened. Quarter−1and Quarter+1 refer to the quarter before (months [-3,-1]) and the quarter immediatelyfollowing (months [+4,+6]) the quarter of origination, respectively. All other quartersare defined in an analogous manner. The y-axis displays the percentage difference incredit card limit growth relative to Quarter−1, which serves as the absorbed period forour event study. The black line graph below represents event study estimates, while theshaded area represents the associated 95% confidence interval. The specification includesindividual and year-quarter fixed effects, with robust standard errors double clustered atthe individual and year-quarter levels. All control variables included in the analysis aredefined in Appendix A.
38
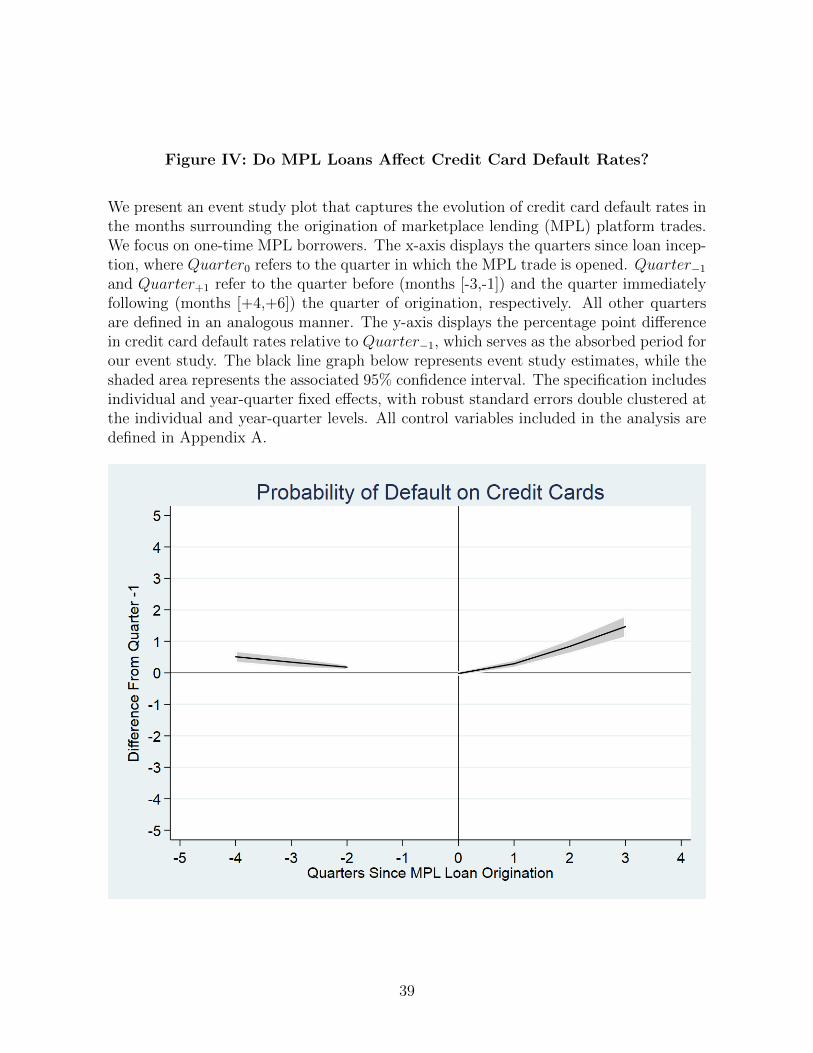
Figure IV: Do MPL Loans Affect Credit Card Default Rates?
We present an event study plot that captures the evolution of credit card default rates inthe months surrounding the origination of marketplace lending (MPL) platform trades.We focus on one-time MPL borrowers. The x-axis displays the quarters since loan incep-tion, where Quarter0 refers to the quarter in which the MPL trade is opened. Quarter−1and Quarter+1 refer to the quarter before (months [-3,-1]) and the quarter immediatelyfollowing (months [+4,+6]) the quarter of origination, respectively. All other quartersare defined in an analogous manner. The y-axis displays the percentage point differencein credit card default rates relative to Quarter−1, which serves as the absorbed period forour event study. The black line graph below represents event study estimates, while theshaded area represents the associated 95% confidence interval. The specification includesindividual and year-quarter fixed effects, with robust standard errors double clustered atthe individual and year-quarter levels. All control variables included in the analysis aredefined in Appendix A.
39
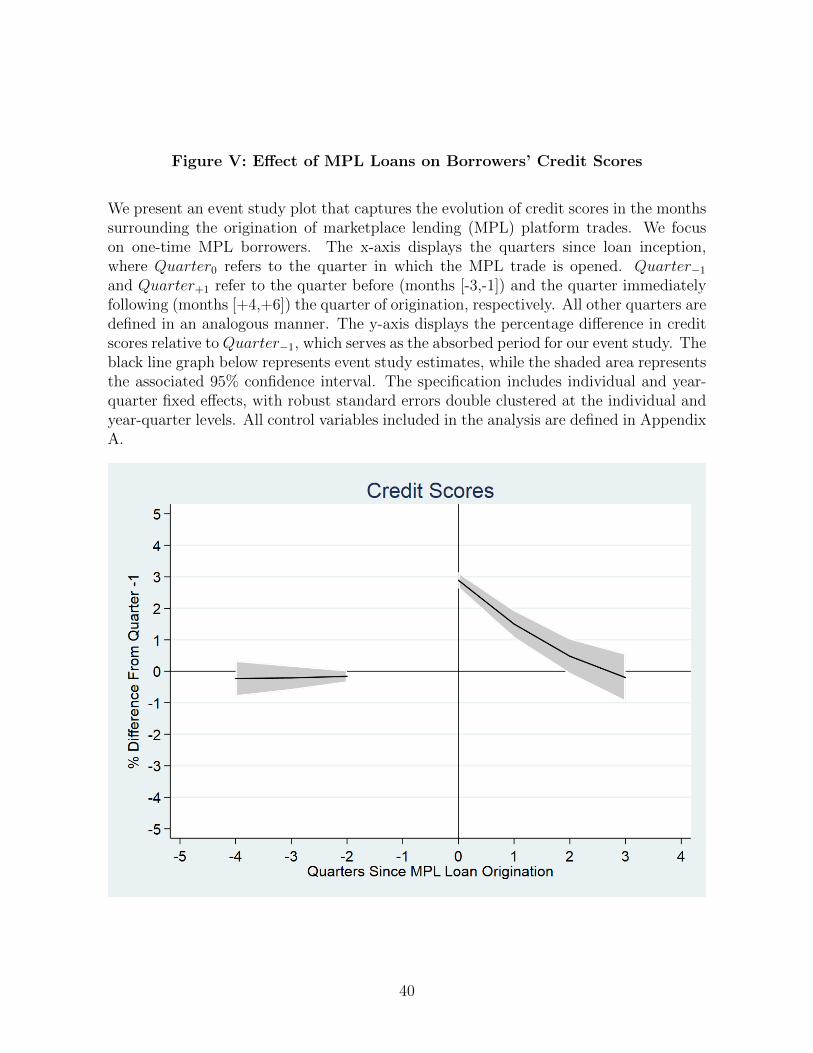
Figure V: Effect of MPL Loans on Borrowers’ Credit Scores
We present an event study plot that captures the evolution of credit scores in the monthssurrounding the origination of marketplace lending (MPL) platform trades. We focuson one-time MPL borrowers. The x-axis displays the quarters since loan inception,where Quarter0 refers to the quarter in which the MPL trade is opened. Quarter−1and Quarter+1 refer to the quarter before (months [-3,-1]) and the quarter immediatelyfollowing (months [+4,+6]) the quarter of origination, respectively. All other quarters aredefined in an analogous manner. The y-axis displays the percentage difference in creditscores relative to Quarter−1, which serves as the absorbed period for our event study. Theblack line graph below represents event study estimates, while the shaded area representsthe associated 95% confidence interval. The specification includes individual and year-quarter fixed effects, with robust standard errors double clustered at the individual andyear-quarter levels. All control variables included in the analysis are defined in AppendixA.
40
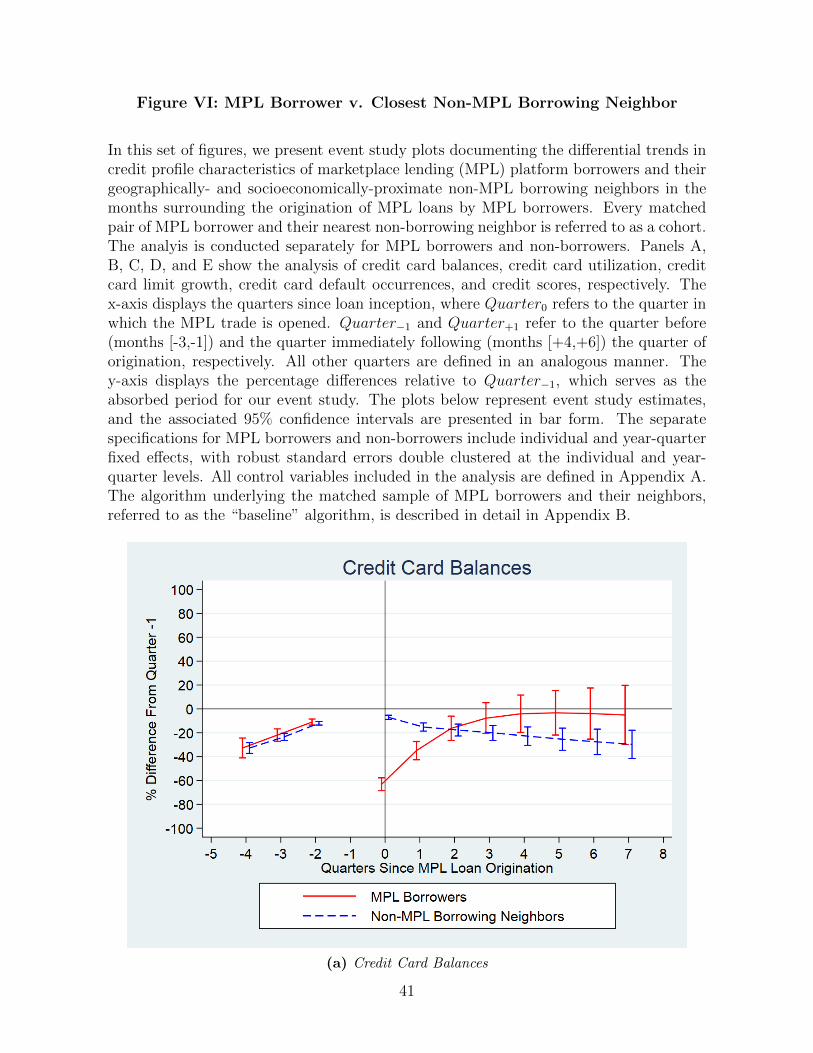
Figure VI: MPL Borrower v. Closest Non-MPL Borrowing Neighbor
In this set of figures, we present event study plots documenting the differential trends incredit profile characteristics of marketplace lending (MPL) platform borrowers and theirgeographically- and socioeconomically-proximate non-MPL borrowing neighbors in themonths surrounding the origination of MPL loans by MPL borrowers. Every matchedpair of MPL borrower and their nearest non-borrowing neighbor is referred to as a cohort.The analyis is conducted separately for MPL borrowers and non-borrowers. Panels A,B, C, D, and E show the analysis of credit card balances, credit card utilization, creditcard limit growth, credit card default occurrences, and credit scores, respectively. Thex-axis displays the quarters since loan inception, where Quarter0 refers to the quarter inwhich the MPL trade is opened. Quarter−1 and Quarter+1 refer to the quarter before(months [-3,-1]) and the quarter immediately following (months [+4,+6]) the quarter oforigination, respectively. All other quarters are defined in an analogous manner. They-axis displays the percentage differences relative to Quarter−1, which serves as theabsorbed period for our event study. The plots below represent event study estimates,and the associated 95% confidence intervals are presented in bar form. The separatespecifications for MPL borrowers and non-borrowers include individual and year-quarterfixed effects, with robust standard errors double clustered at the individual and year-quarter levels. All control variables included in the analysis are defined in Appendix A.The algorithm underlying the matched sample of MPL borrowers and their neighbors,referred to as the “baseline” algorithm, is described in detail in Appendix B.
(a) Credit Card Balances
41
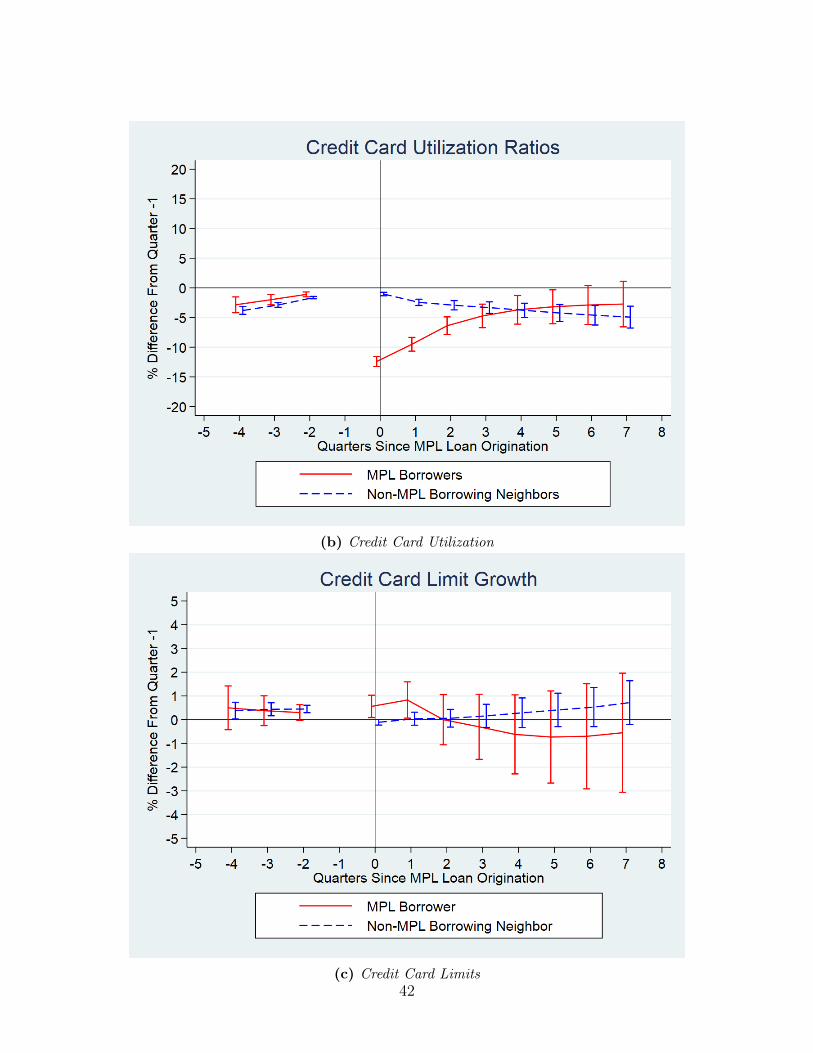
(b) Credit Card Utilization
(c) Credit Card Limits42
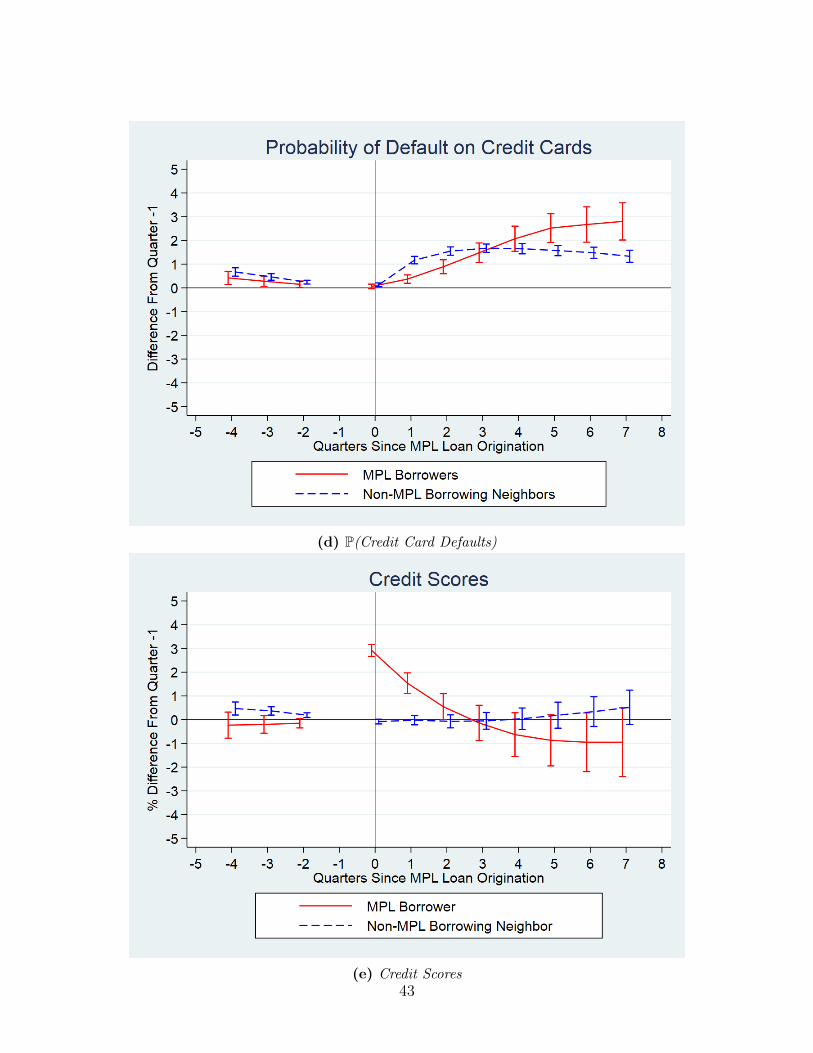
(d) P(Credit Card Defaults)
(e) Credit Scores43
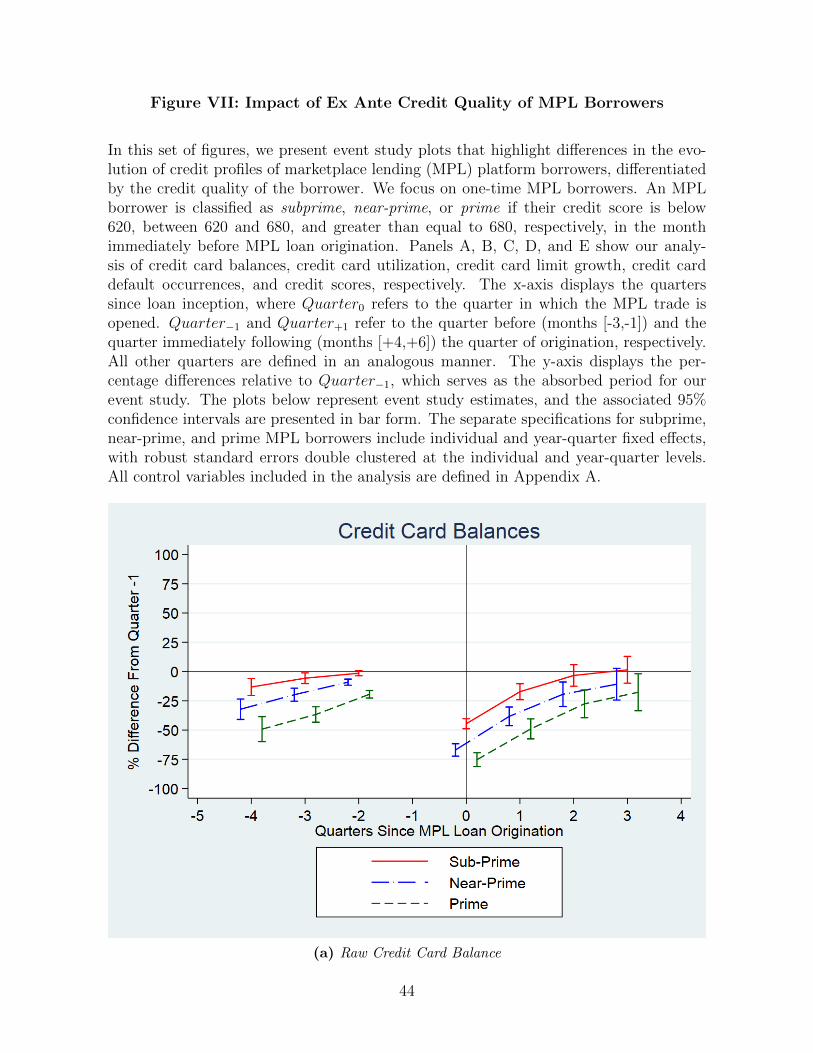
Figure VII: Impact of Ex Ante Credit Quality of MPL Borrowers
In this set of figures, we present event study plots that highlight differences in the evo-lution of credit profiles of marketplace lending (MPL) platform borrowers, differentiatedby the credit quality of the borrower. We focus on one-time MPL borrowers. An MPLborrower is classified as subprime, near-prime, or prime if their credit score is below620, between 620 and 680, and greater than equal to 680, respectively, in the monthimmediately before MPL loan origination. Panels A, B, C, D, and E show our analy-sis of credit card balances, credit card utilization, credit card limit growth, credit carddefault occurrences, and credit scores, respectively. The x-axis displays the quarterssince loan inception, where Quarter0 refers to the quarter in which the MPL trade isopened. Quarter−1 and Quarter+1 refer to the quarter before (months [-3,-1]) and thequarter immediately following (months [+4,+6]) the quarter of origination, respectively.All other quarters are defined in an analogous manner. The y-axis displays the per-centage differences relative to Quarter−1, which serves as the absorbed period for ourevent study. The plots below represent event study estimates, and the associated 95%confidence intervals are presented in bar form. The separate specifications for subprime,near-prime, and prime MPL borrowers include individual and year-quarter fixed effects,with robust standard errors double clustered at the individual and year-quarter levels.All control variables included in the analysis are defined in Appendix A.
(a) Raw Credit Card Balance
44
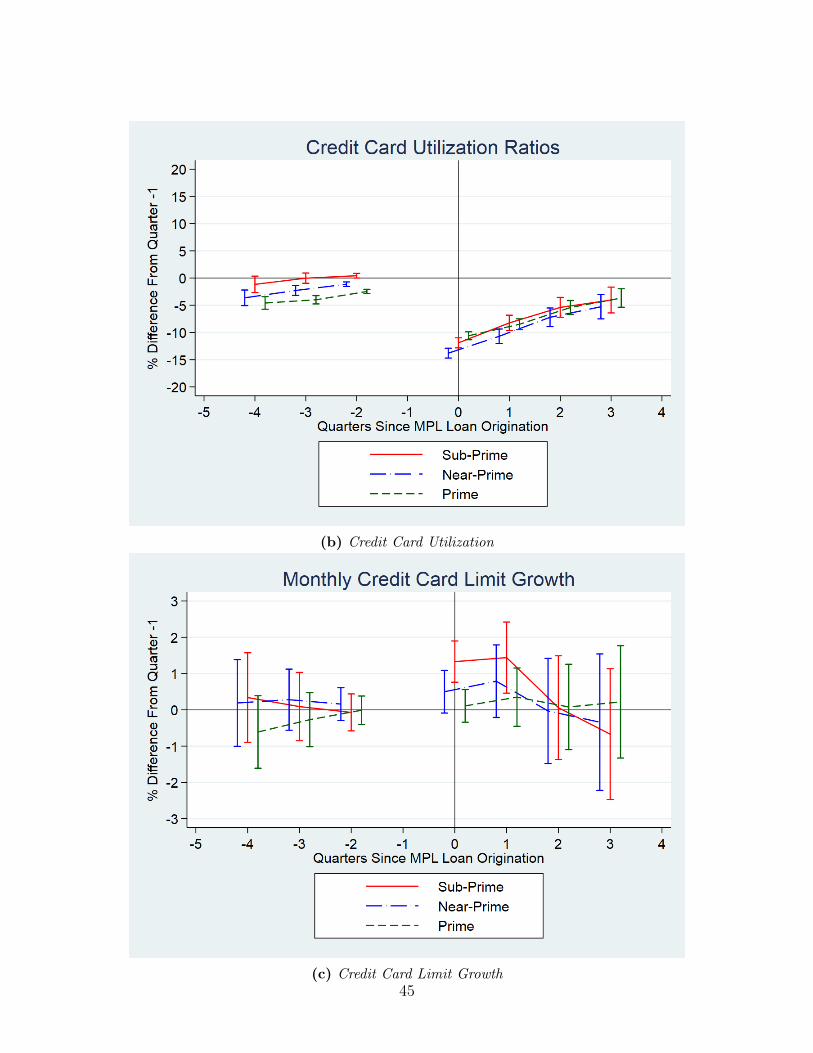
(b) Credit Card Utilization
(c) Credit Card Limit Growth45
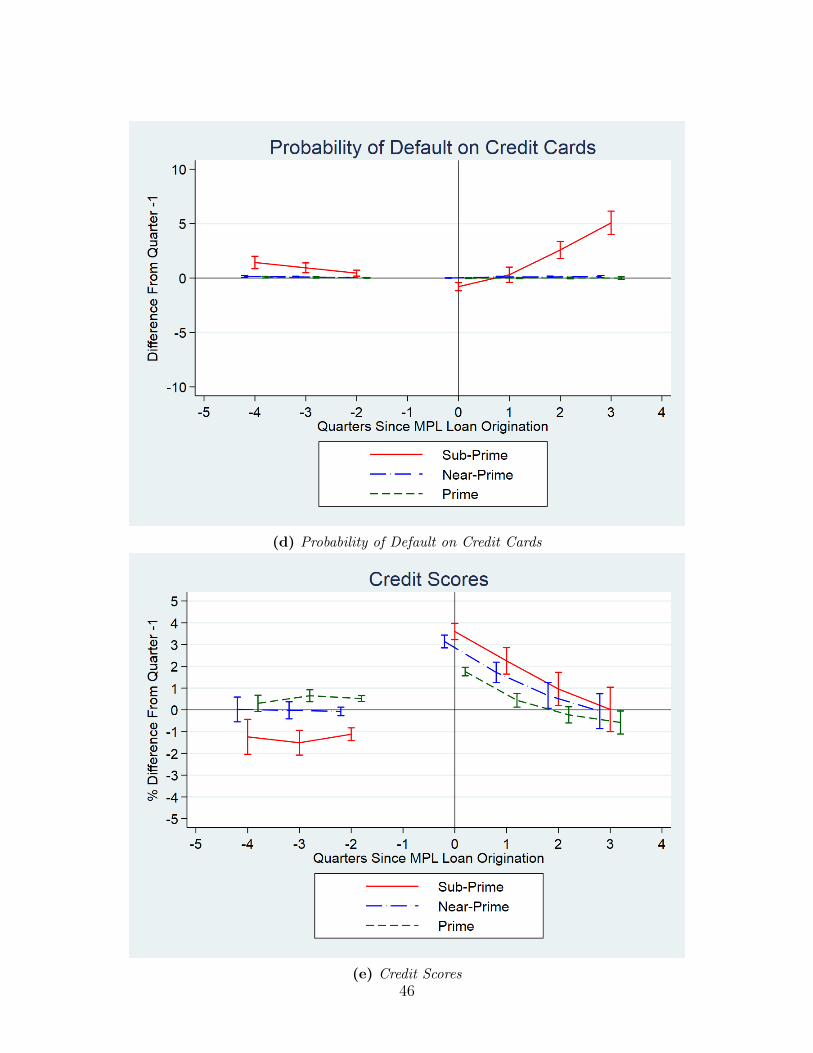
(d) Probability of Default on Credit Cards
(e) Credit Scores46
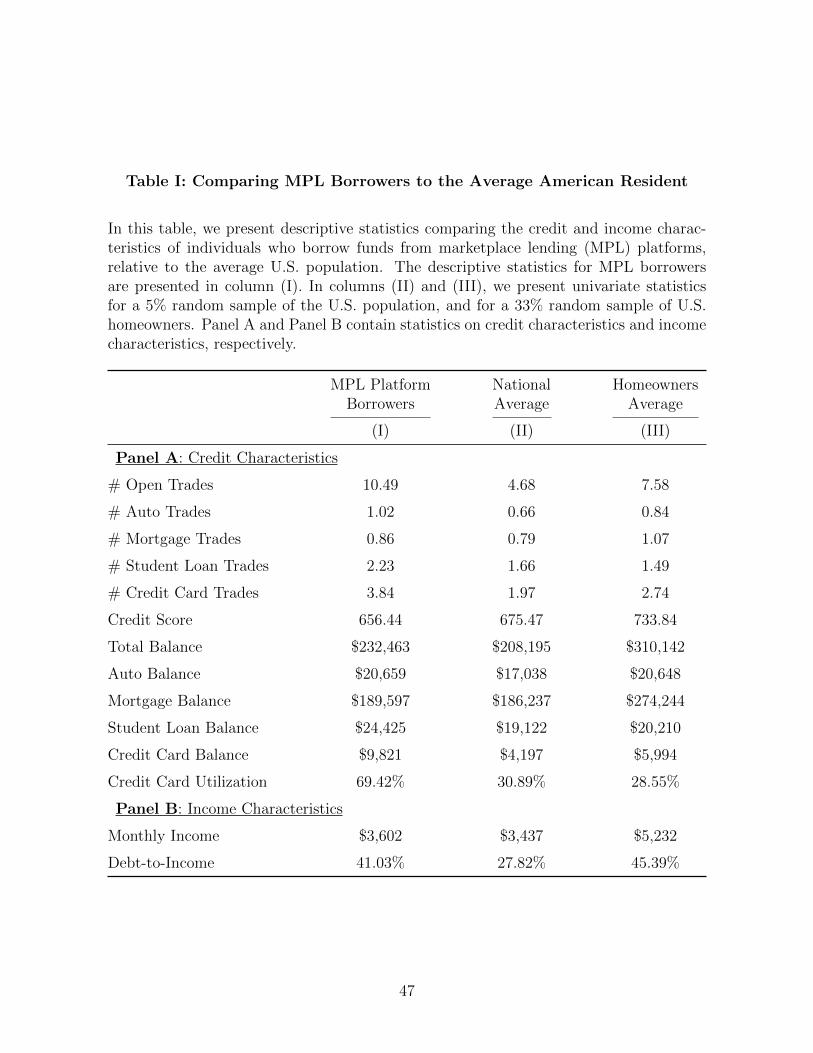
Table I: Comparing MPL Borrowers to the Average American Resident
In this table, we present descriptive statistics comparing the credit and income charac-teristics of individuals who borrow funds from marketplace lending (MPL) platforms,relative to the average U.S. population. The descriptive statistics for MPL borrowersare presented in column (I). In columns (II) and (III), we present univariate statisticsfor a 5% random sample of the U.S. population, and for a 33% random sample of U.S.homeowners. Panel A and Panel B contain statistics on credit characteristics and incomecharacteristics, respectively.
MPL Platform National HomeownersBorrowers Average Average
(I) (II) (III)
Panel A: Credit Characteristics
# Open Trades 10.49 4.68 7.58
# Auto Trades 1.02 0.66 0.84
# Mortgage Trades 0.86 0.79 1.07
# Student Loan Trades 2.23 1.66 1.49
# Credit Card Trades 3.84 1.97 2.74
Credit Score 656.44 675.47 733.84
Total Balance $232,463 $208,195 $310,142
Auto Balance $20,659 $17,038 $20,648
Mortgage Balance $189,597 $186,237 $274,244
Student Loan Balance $24,425 $19,122 $20,210
Credit Card Balance $9,821 $4,197 $5,994
Credit Card Utilization 69.42% 30.89% 28.55%
Panel B: Income Characteristics
Monthly Income $3,602 $3,437 $5,232
Debt-to-Income 41.03% 27.82% 45.39%
47
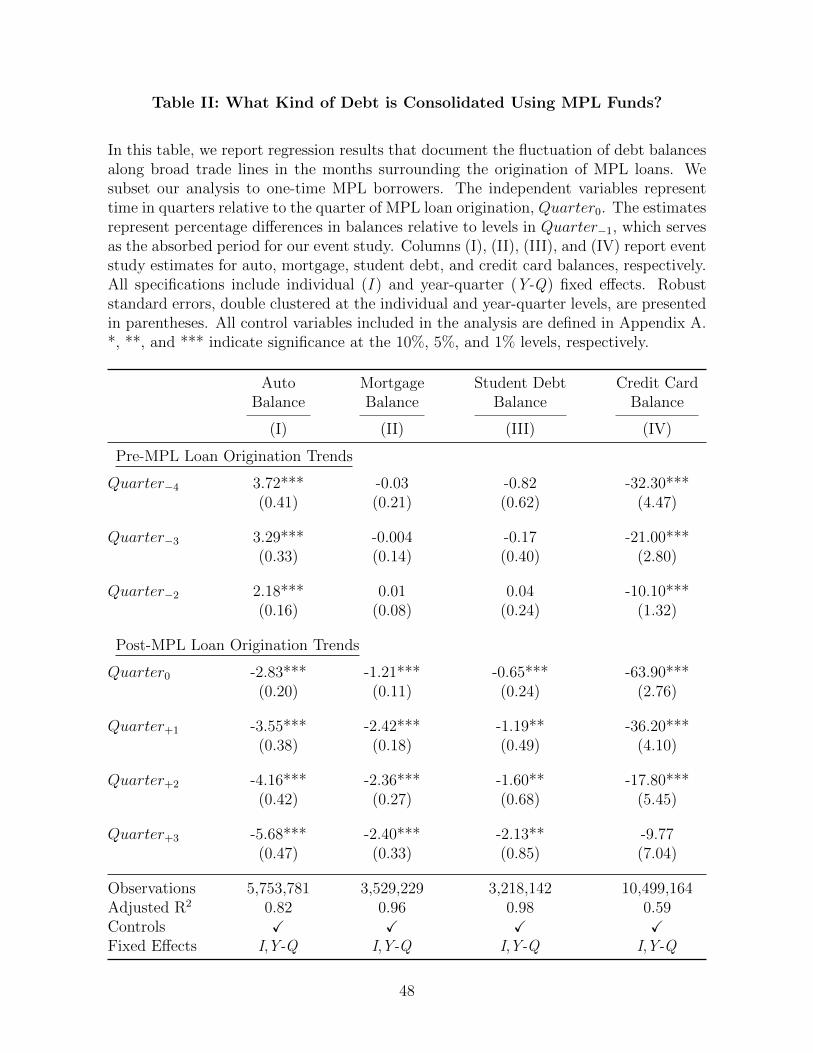
Table II: What Kind of Debt is Consolidated Using MPL Funds?
In this table, we report regression results that document the fluctuation of debt balancesalong broad trade lines in the months surrounding the origination of MPL loans. Wesubset our analysis to one-time MPL borrowers. The independent variables representtime in quarters relative to the quarter of MPL loan origination, Quarter0. The estimatesrepresent percentage differences in balances relative to levels in Quarter−1, which servesas the absorbed period for our event study. Columns (I), (II), (III), and (IV) report eventstudy estimates for auto, mortgage, student debt, and credit card balances, respectively.All specifications include individual (I ) and year-quarter (Y-Q) fixed effects. Robuststandard errors, double clustered at the individual and year-quarter levels, are presentedin parentheses. All control variables included in the analysis are defined in Appendix A.*, **, and *** indicate significance at the 10%, 5%, and 1% levels, respectively.
Auto Mortgage Student Debt Credit CardBalance Balance Balance Balance
(I) (II) (III) (IV)
Pre-MPL Loan Origination Trends
Quarter−4 3.72*** -0.03 -0.82 -32.30***(0.41) (0.21) (0.62) (4.47)
Quarter−3 3.29*** -0.004 -0.17 -21.00***(0.33) (0.14) (0.40) (2.80)
Quarter−2 2.18*** 0.01 0.04 -10.10***(0.16) (0.08) (0.24) (1.32)
Post-MPL Loan Origination Trends
Quarter0 -2.83*** -1.21*** -0.65*** -63.90***(0.20) (0.11) (0.24) (2.76)
Quarter+1 -3.55*** -2.42*** -1.19** -36.20***(0.38) (0.18) (0.49) (4.10)
Quarter+2 -4.16*** -2.36*** -1.60** -17.80***(0.42) (0.27) (0.68) (5.45)
Quarter+3 -5.68*** -2.40*** -2.13** -9.77(0.47) (0.33) (0.85) (7.04)
Observations 5,753,781 3,529,229 3,218,142 10,499,164Adjusted R2 0.82 0.96 0.98 0.59Controls X X X XFixed Effects I,Y-Q I,Y-Q I,Y-Q I,Y-Q
48
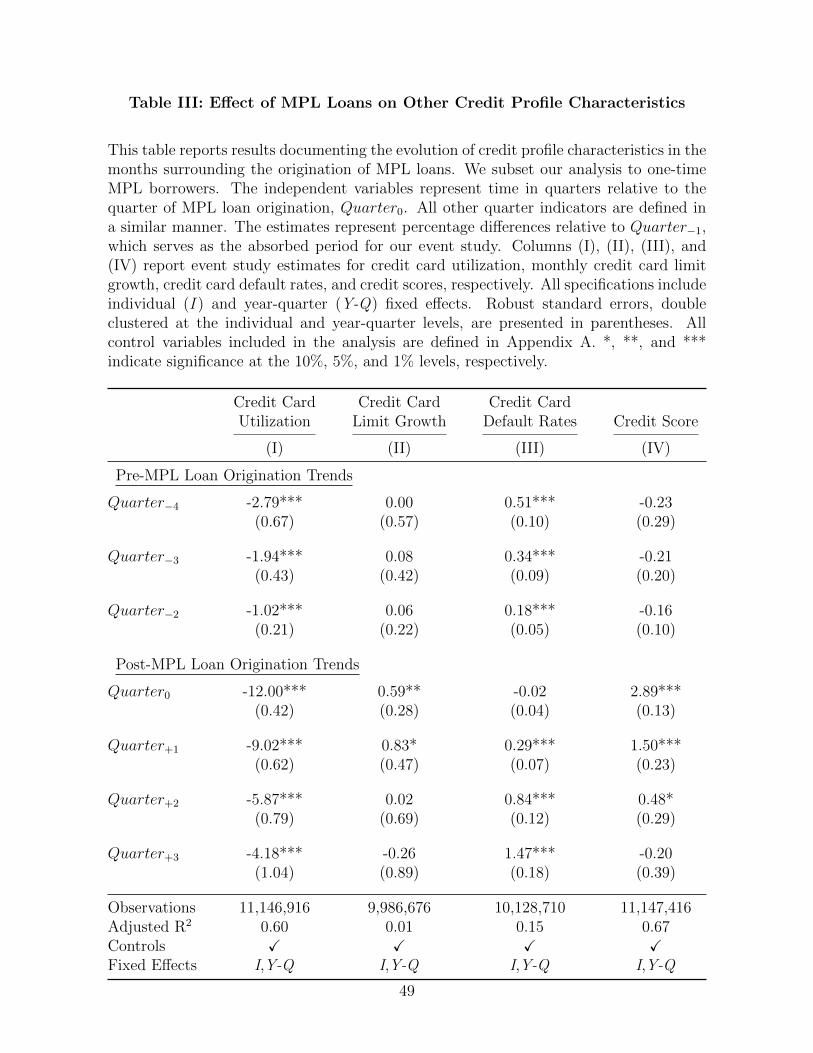
Table III: Effect of MPL Loans on Other Credit Profile Characteristics
This table reports results documenting the evolution of credit profile characteristics in themonths surrounding the origination of MPL loans. We subset our analysis to one-timeMPL borrowers. The independent variables represent time in quarters relative to thequarter of MPL loan origination, Quarter0. All other quarter indicators are defined ina similar manner. The estimates represent percentage differences relative to Quarter−1,which serves as the absorbed period for our event study. Columns (I), (II), (III), and(IV) report event study estimates for credit card utilization, monthly credit card limitgrowth, credit card default rates, and credit scores, respectively. All specifications includeindividual (I ) and year-quarter (Y-Q) fixed effects. Robust standard errors, doubleclustered at the individual and year-quarter levels, are presented in parentheses. Allcontrol variables included in the analysis are defined in Appendix A. *, **, and ***indicate significance at the 10%, 5%, and 1% levels, respectively.
Credit Card Credit Card Credit CardUtilization Limit Growth Default Rates Credit Score
(I) (II) (III) (IV)
Pre-MPL Loan Origination Trends
Quarter−4 -2.79*** 0.00 0.51*** -0.23(0.67) (0.57) (0.10) (0.29)
Quarter−3 -1.94*** 0.08 0.34*** -0.21(0.43) (0.42) (0.09) (0.20)
Quarter−2 -1.02*** 0.06 0.18*** -0.16(0.21) (0.22) (0.05) (0.10)
Post-MPL Loan Origination Trends
Quarter0 -12.00*** 0.59** -0.02 2.89***(0.42) (0.28) (0.04) (0.13)
Quarter+1 -9.02*** 0.83* 0.29*** 1.50***(0.62) (0.47) (0.07) (0.23)
Quarter+2 -5.87*** 0.02 0.84*** 0.48*(0.79) (0.69) (0.12) (0.29)
Quarter+3 -4.18*** -0.26 1.47*** -0.20(1.04) (0.89) (0.18) (0.39)
Observations 11,146,916 9,986,676 10,128,710 11,147,416Adjusted R2 0.60 0.01 0.15 0.67Controls X X X XFixed Effects I,Y-Q I,Y-Q I,Y-Q I,Y-Q
49
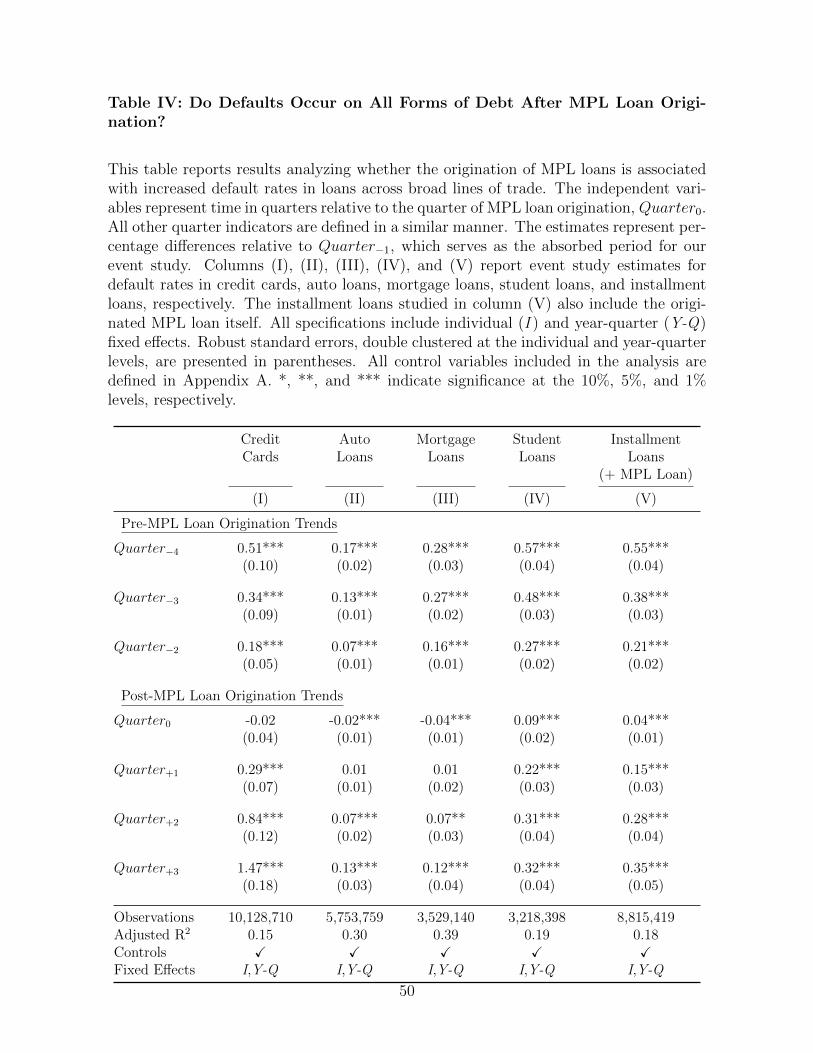
Table IV: Do Defaults Occur on All Forms of Debt After MPL Loan Origi-nation?
This table reports results analyzing whether the origination of MPL loans is associatedwith increased default rates in loans across broad lines of trade. The independent vari-ables represent time in quarters relative to the quarter of MPL loan origination, Quarter0.All other quarter indicators are defined in a similar manner. The estimates represent per-centage differences relative to Quarter−1, which serves as the absorbed period for ourevent study. Columns (I), (II), (III), (IV), and (V) report event study estimates fordefault rates in credit cards, auto loans, mortgage loans, student loans, and installmentloans, respectively. The installment loans studied in column (V) also include the origi-nated MPL loan itself. All specifications include individual (I ) and year-quarter (Y-Q)fixed effects. Robust standard errors, double clustered at the individual and year-quarterlevels, are presented in parentheses. All control variables included in the analysis aredefined in Appendix A. *, **, and *** indicate significance at the 10%, 5%, and 1%levels, respectively.
Credit Auto Mortgage Student InstallmentCards Loans Loans Loans Loans
(+ MPL Loan)
(I) (II) (III) (IV) (V)
Pre-MPL Loan Origination Trends
Quarter−4 0.51*** 0.17*** 0.28*** 0.57*** 0.55***(0.10) (0.02) (0.03) (0.04) (0.04)
Quarter−3 0.34*** 0.13*** 0.27*** 0.48*** 0.38***(0.09) (0.01) (0.02) (0.03) (0.03)
Quarter−2 0.18*** 0.07*** 0.16*** 0.27*** 0.21***(0.05) (0.01) (0.01) (0.02) (0.02)
Post-MPL Loan Origination Trends
Quarter0 -0.02 -0.02*** -0.04*** 0.09*** 0.04***(0.04) (0.01) (0.01) (0.02) (0.01)
Quarter+1 0.29*** 0.01 0.01 0.22*** 0.15***(0.07) (0.01) (0.02) (0.03) (0.03)
Quarter+2 0.84*** 0.07*** 0.07** 0.31*** 0.28***(0.12) (0.02) (0.03) (0.04) (0.04)
Quarter+3 1.47*** 0.13*** 0.12*** 0.32*** 0.35***(0.18) (0.03) (0.04) (0.04) (0.05)
Observations 10,128,710 5,753,759 3,529,140 3,218,398 8,815,419Adjusted R2 0.15 0.30 0.39 0.19 0.18Controls X X X X XFixed Effects I,Y-Q I,Y-Q I,Y-Q I,Y-Q I,Y-Q
50
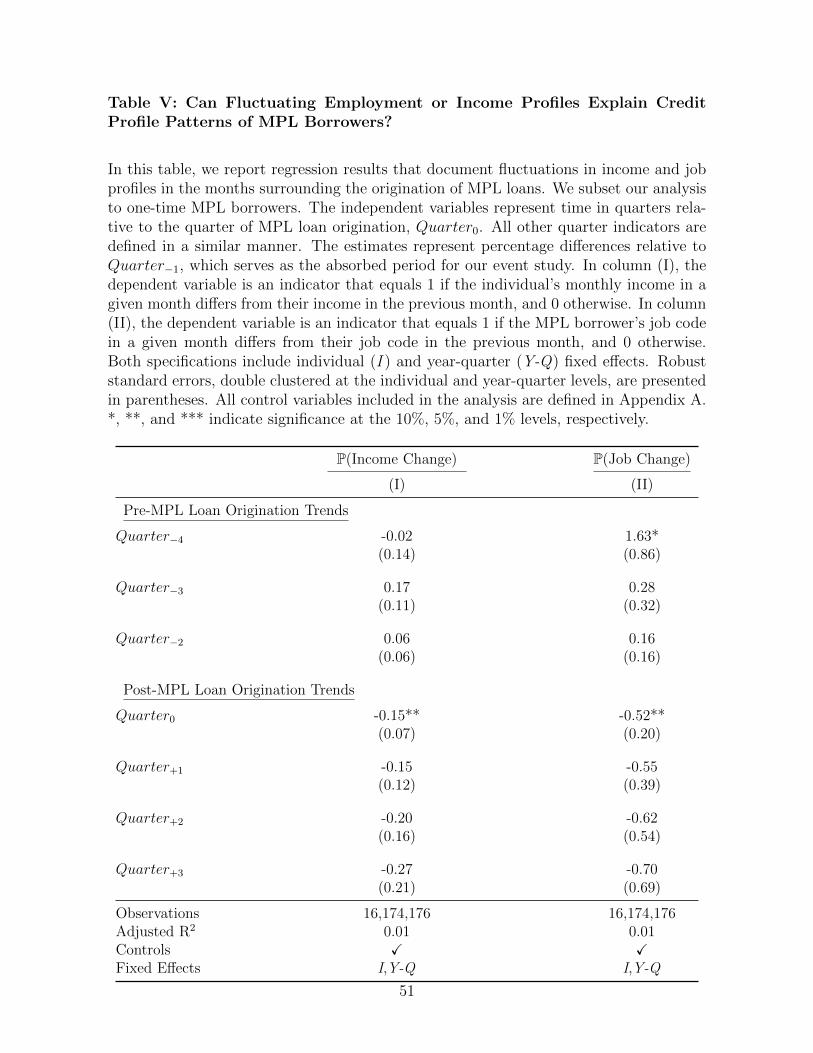
Table V: Can Fluctuating Employment or Income Profiles Explain CreditProfile Patterns of MPL Borrowers?
In this table, we report regression results that document fluctuations in income and jobprofiles in the months surrounding the origination of MPL loans. We subset our analysisto one-time MPL borrowers. The independent variables represent time in quarters rela-tive to the quarter of MPL loan origination, Quarter0. All other quarter indicators aredefined in a similar manner. The estimates represent percentage differences relative toQuarter−1, which serves as the absorbed period for our event study. In column (I), thedependent variable is an indicator that equals 1 if the individual’s monthly income in agiven month differs from their income in the previous month, and 0 otherwise. In column(II), the dependent variable is an indicator that equals 1 if the MPL borrower’s job codein a given month differs from their job code in the previous month, and 0 otherwise.Both specifications include individual (I ) and year-quarter (Y-Q) fixed effects. Robuststandard errors, double clustered at the individual and year-quarter levels, are presentedin parentheses. All control variables included in the analysis are defined in Appendix A.*, **, and *** indicate significance at the 10%, 5%, and 1% levels, respectively.
P(Income Change) P(Job Change)
(I) (II)
Pre-MPL Loan Origination Trends
Quarter−4 -0.02 1.63*(0.14) (0.86)
Quarter−3 0.17 0.28(0.11) (0.32)
Quarter−2 0.06 0.16(0.06) (0.16)
Post-MPL Loan Origination Trends
Quarter0 -0.15** -0.52**(0.07) (0.20)
Quarter+1 -0.15 -0.55(0.12) (0.39)
Quarter+2 -0.20 -0.62(0.16) (0.54)
Quarter+3 -0.27 -0.70(0.21) (0.69)
Observations 16,174,176 16,174,176Adjusted R2 0.01 0.01Controls X XFixed Effects I,Y-Q I,Y-Q
51
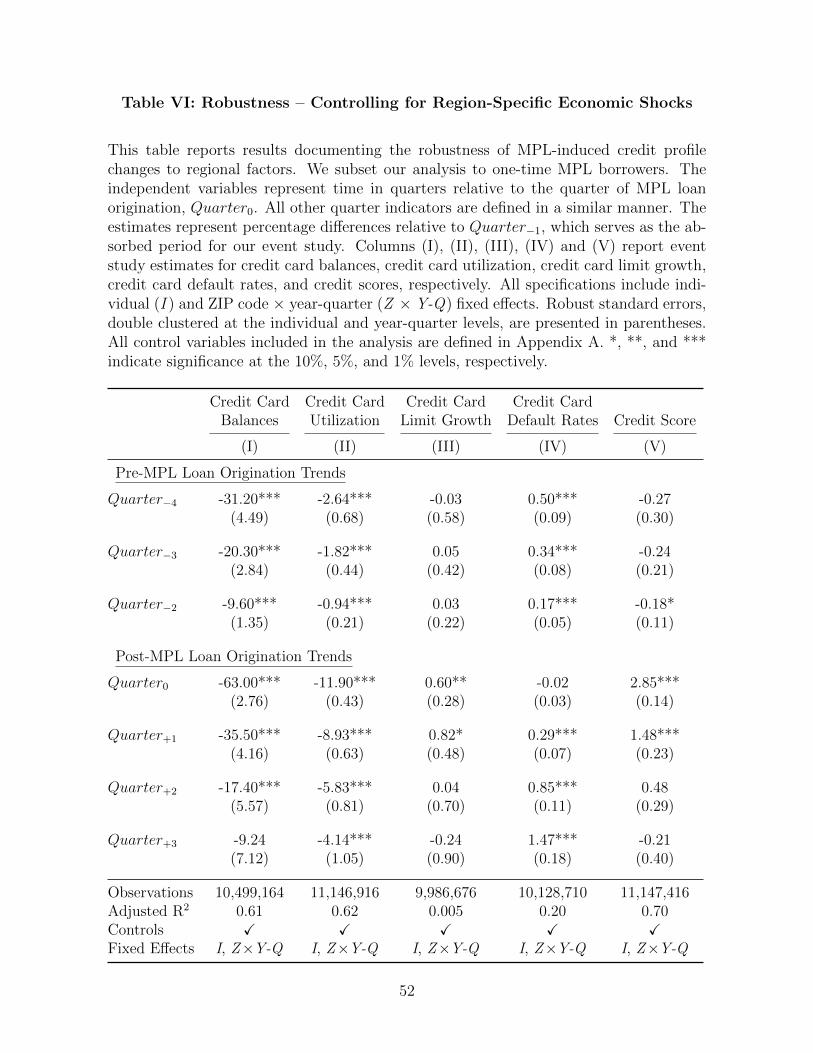
Table VI: Robustness – Controlling for Region-Specific Economic Shocks
This table reports results documenting the robustness of MPL-induced credit profilechanges to regional factors. We subset our analysis to one-time MPL borrowers. Theindependent variables represent time in quarters relative to the quarter of MPL loanorigination, Quarter0. All other quarter indicators are defined in a similar manner. Theestimates represent percentage differences relative to Quarter−1, which serves as the ab-sorbed period for our event study. Columns (I), (II), (III), (IV) and (V) report eventstudy estimates for credit card balances, credit card utilization, credit card limit growth,credit card default rates, and credit scores, respectively. All specifications include indi-vidual (I ) and ZIP code × year-quarter (Z × Y-Q) fixed effects. Robust standard errors,double clustered at the individual and year-quarter levels, are presented in parentheses.All control variables included in the analysis are defined in Appendix A. *, **, and ***indicate significance at the 10%, 5%, and 1% levels, respectively.
Credit Card Credit Card Credit Card Credit CardBalances Utilization Limit Growth Default Rates Credit Score
(I) (II) (III) (IV) (V)
Pre-MPL Loan Origination Trends
Quarter−4 -31.20*** -2.64*** -0.03 0.50*** -0.27(4.49) (0.68) (0.58) (0.09) (0.30)
Quarter−3 -20.30*** -1.82*** 0.05 0.34*** -0.24(2.84) (0.44) (0.42) (0.08) (0.21)
Quarter−2 -9.60*** -0.94*** 0.03 0.17*** -0.18*(1.35) (0.21) (0.22) (0.05) (0.11)
Post-MPL Loan Origination Trends
Quarter0 -63.00*** -11.90*** 0.60** -0.02 2.85***(2.76) (0.43) (0.28) (0.03) (0.14)
Quarter+1 -35.50*** -8.93*** 0.82* 0.29*** 1.48***(4.16) (0.63) (0.48) (0.07) (0.23)
Quarter+2 -17.40*** -5.83*** 0.04 0.85*** 0.48(5.57) (0.81) (0.70) (0.11) (0.29)
Quarter+3 -9.24 -4.14*** -0.24 1.47*** -0.21(7.12) (1.05) (0.90) (0.18) (0.40)
Observations 10,499,164 11,146,916 9,986,676 10,128,710 11,147,416Adjusted R2 0.61 0.62 0.005 0.20 0.70Controls X X X X XFixed Effects I, Z×Y-Q I, Z×Y-Q I, Z×Y-Q I, Z×Y-Q I, Z×Y-Q
52
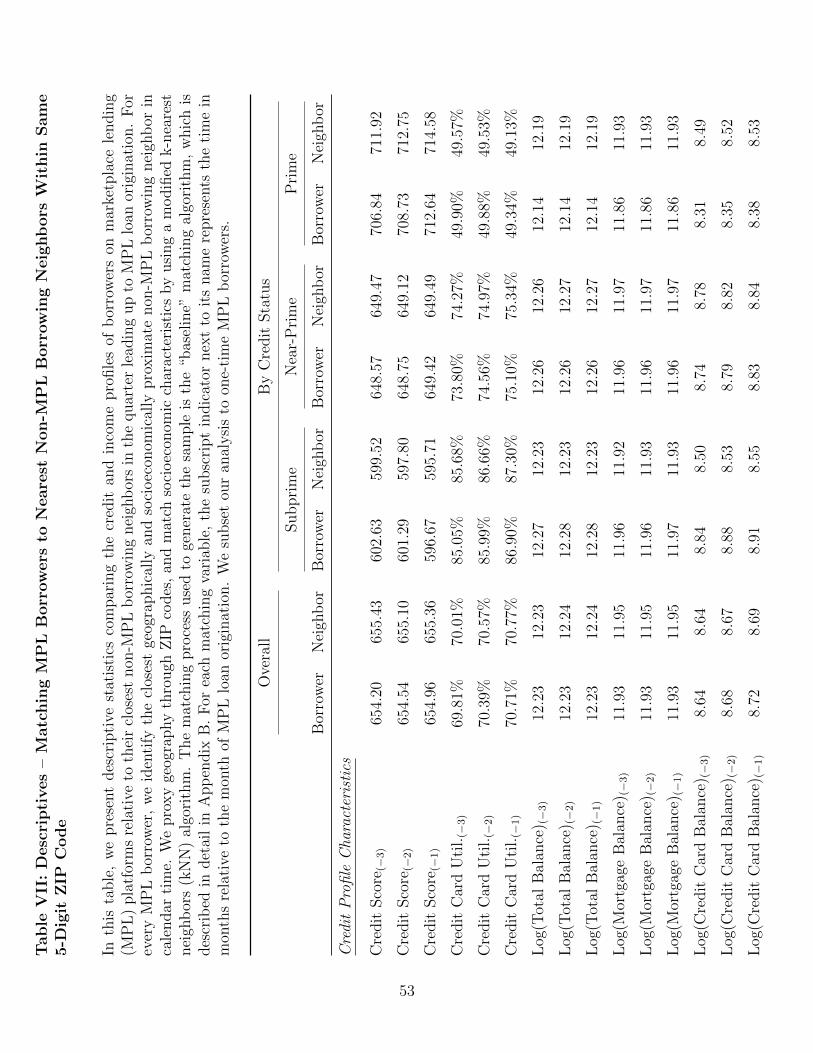
Tab
leV
II:
Desc
ripti
ves
–M
atc
hin
gM
PL
Borr
ow
ers
toN
eare
stN
on-M
PL
Borr
ow
ing
Neig
hb
ors
Wit
hin
Sam
e5-D
igit
ZIP
Cod
e
Inth
ista
ble
,w
epre
sent
des
crip
tive
stat
isti
csco
mpar
ing
the
cred
itan
din
com
epro
file
sof
bor
row
ers
onm
arke
tpla
cele
ndin
g(M
PL
)pla
tfor
ms
rela
tive
toth
eir
clos
est
non
-MP
Lb
orro
win
gnei
ghb
ors
inth
equar
ter
lead
ing
up
toM
PL
loan
orig
inat
ion.
For
ever
yM
PL
bor
row
er,
we
iden
tify
the
clos
est
geog
raphic
ally
and
soci
oec
onom
ical
lypro
xim
ate
non
-MP
Lb
orro
win
gnei
ghb
orin
cale
ndar
tim
e.W
epro
xy
geog
raphy
thro
ugh
ZIP
codes
,an
dm
atch
soci
oec
onom
icch
arac
teri
stic
sby
usi
ng
am
odifi
edk-n
eare
stnei
ghb
ors
(kN
N)
algo
rith
m.
The
mat
chin
gpro
cess
use
dto
gener
ate
the
sam
ple
isth
e“b
asel
ine”
mat
chin
gal
gori
thm
,w
hic
his
des
crib
edin
det
ail
inA
pp
endix
B.
For
each
mat
chin
gva
riab
le,
the
subsc
ript
indic
ator
nex
tto
its
nam
ere
pre
sents
the
tim
ein
mon
ths
rela
tive
toth
em
onth
ofM
PL
loan
orig
inat
ion.
We
subse
tou
ran
alysi
sto
one-
tim
eM
PL
bor
row
ers.
Ove
rall
By
Cre
dit
Sta
tus
Subpri
me
Nea
r-P
rim
eP
rim
e
Bor
row
erN
eigh
bor
Bor
row
erN
eigh
bor
Bor
row
erN
eigh
bor
Bor
row
erN
eigh
bor
Cre
dit
Pro
file
Cha
ract
eris
tics
Cre
dit
Sco
re(−
3)
654.
2065
5.43
602.
6359
9.52
648.
5764
9.47
706.
8471
1.92
Cre
dit
Sco
re(−
2)
654.
5465
5.10
601.
2959
7.80
648.
7564
9.12
708.
7371
2.75
Cre
dit
Sco
re(−
1)
654.
9665
5.36
596.
6759
5.71
649.
4264
9.49
712.
6471
4.58
Cre
dit
Car
dU
til.(−
3)
69.8
1%70
.01%
85.0
5%85
.68%
73.8
0%74
.27%
49.9
0%49
.57%
Cre
dit
Car
dU
til.(−
2)
70.3
9%70
.57%
85.9
9%86
.66%
74.5
6%74
.97%
49.8
8%49
.53%
Cre
dit
Car
dU
til.(−
1)
70.7
1%70
.77%
86.9
0%87
.30%
75.1
0%75
.34%
49.3
4%49
.13%
Log
(Tot
alB
alan
ce) (−3)
12.2
312
.23
12.2
712
.23
12.2
612
.26
12.1
412
.19
Log
(Tot
alB
alan
ce) (−2)
12.2
312
.24
12.2
812
.23
12.2
612
.27
12.1
412
.19
Log
(Tot
alB
alan
ce) (−1)
12.2
312
.24
12.2
812
.23
12.2
612
.27
12.1
412
.19
Log
(Mor
tgag
eB
alan
ce) (−3)
11.9
311
.95
11.9
611
.92
11.9
611
.97
11.8
611
.93
Log
(Mor
tgag
eB
alan
ce) (−2)
11.9
311
.95
11.9
611
.93
11.9
611
.97
11.8
611
.93
Log
(Mor
tgag
eB
alan
ce) (−1)
11.9
311
.95
11.9
711
.93
11.9
611
.97
11.8
611
.93
Log
(Cre
dit
Car
dB
alan
ce) (−3)
8.64
8.64
8.84
8.50
8.74
8.78
8.31
8.49
Log
(Cre
dit
Car
dB
alan
ce) (−2)
8.68
8.67
8.88
8.53
8.79
8.82
8.35
8.52
Log
(Cre
dit
Car
dB
alan
ce) (−1)
8.72
8.69
8.91
8.55
8.83
8.84
8.38
8.53
53
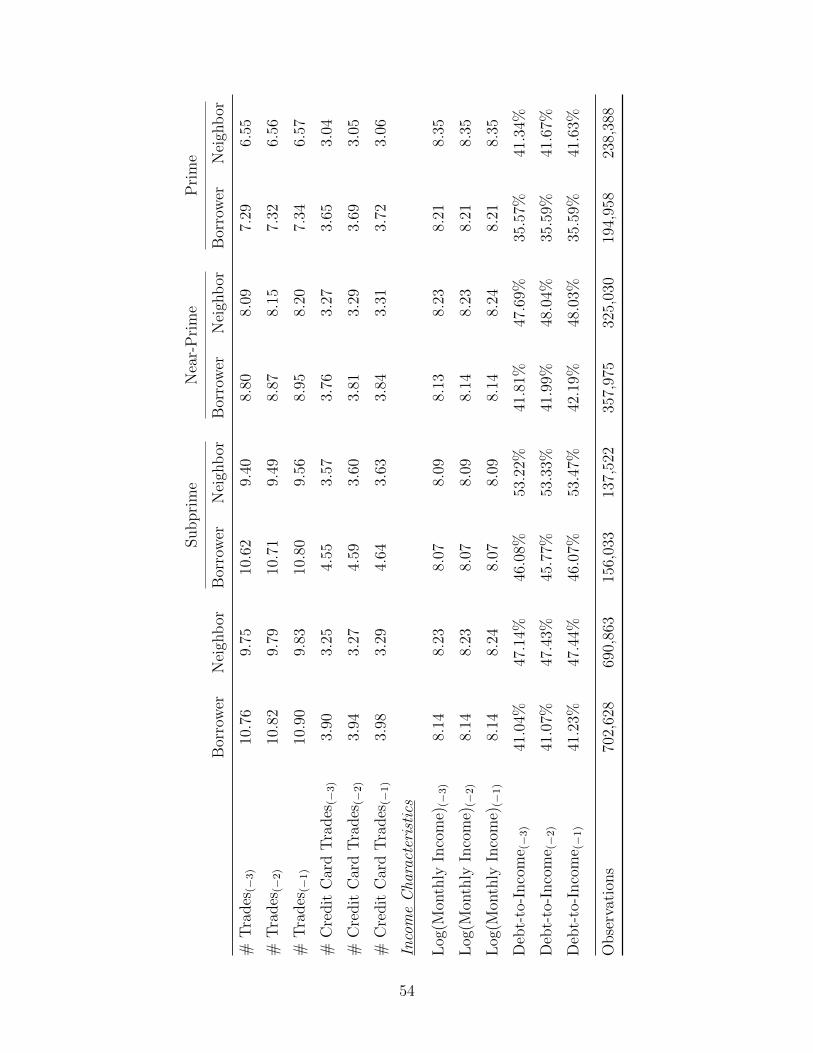
Subpri
me
Nea
r-P
rim
eP
rim
e
Bor
row
erN
eigh
bor
Bor
row
erN
eigh
bor
Bor
row
erN
eigh
bor
Bor
row
erN
eigh
bor
#T
rades
(−3)
10.7
69.
7510
.62
9.40
8.80
8.09
7.29
6.55
#T
rades
(−2)
10.8
29.
7910
.71
9.49
8.87
8.15
7.32
6.56
#T
rades
(−1)
10.9
09.
8310
.80
9.56
8.95
8.20
7.34
6.57
#C
redit
Car
dT
rades
(−3)
3.90
3.25
4.55
3.57
3.76
3.27
3.65
3.04
#C
redit
Car
dT
rades
(−2)
3.94
3.27
4.59
3.60
3.81
3.29
3.69
3.05
#C
redit
Car
dT
rades
(−1)
3.98
3.29
4.64
3.63
3.84
3.31
3.72
3.06
Inco
me
Cha
ract
eris
tics
Log
(Mon
thly
Inco
me)
(−3)
8.14
8.23
8.07
8.09
8.13
8.23
8.21
8.35
Log
(Mon
thly
Inco
me)
(−2)
8.14
8.23
8.07
8.09
8.14
8.23
8.21
8.35
Log
(Mon
thly
Inco
me)
(−1)
8.14
8.24
8.07
8.09
8.14
8.24
8.21
8.35
Deb
t-to
-Inco
me (−3)
41.0
4%47
.14%
46.0
8%53
.22%
41.8
1%47
.69%
35.5
7%41
.34%
Deb
t-to
-Inco
me (−2)
41.0
7%47
.43%
45.7
7%53
.33%
41.9
9%48
.04%
35.5
9%41
.67%
Deb
t-to
-Inco
me (−1)
41.2
3%47
.44%
46.0
7%53
.47%
42.1
9%48
.03%
35.5
9%41
.63%
Obse
rvat
ions
702,
628
690,
863
156,
033
137,
522
357,
975
325,
030
194,
958
238,
388
54
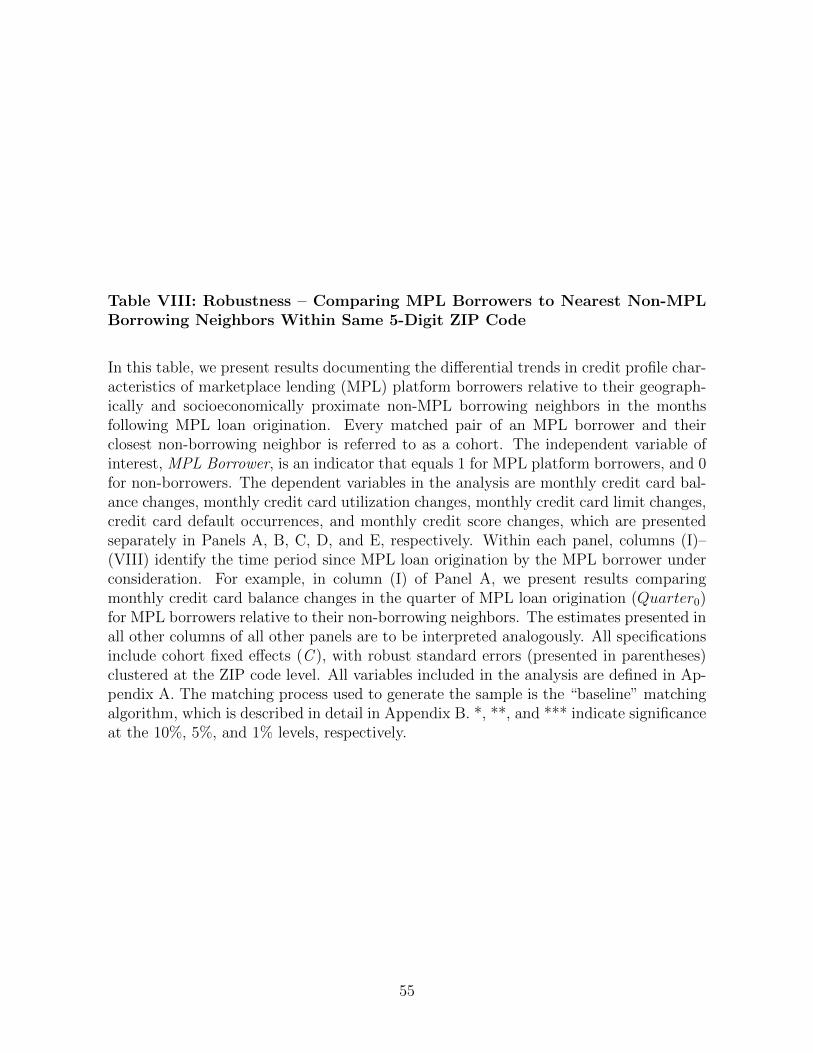
Table VIII: Robustness – Comparing MPL Borrowers to Nearest Non-MPLBorrowing Neighbors Within Same 5-Digit ZIP Code
In this table, we present results documenting the differential trends in credit profile char-acteristics of marketplace lending (MPL) platform borrowers relative to their geograph-ically and socioeconomically proximate non-MPL borrowing neighbors in the monthsfollowing MPL loan origination. Every matched pair of an MPL borrower and theirclosest non-borrowing neighbor is referred to as a cohort. The independent variable ofinterest, MPL Borrower, is an indicator that equals 1 for MPL platform borrowers, and 0for non-borrowers. The dependent variables in the analysis are monthly credit card bal-ance changes, monthly credit card utilization changes, monthly credit card limit changes,credit card default occurrences, and monthly credit score changes, which are presentedseparately in Panels A, B, C, D, and E, respectively. Within each panel, columns (I)–(VIII) identify the time period since MPL loan origination by the MPL borrower underconsideration. For example, in column (I) of Panel A, we present results comparingmonthly credit card balance changes in the quarter of MPL loan origination (Quarter0)for MPL borrowers relative to their non-borrowing neighbors. The estimates presented inall other columns of all other panels are to be interpreted analogously. All specificationsinclude cohort fixed effects (C ), with robust standard errors (presented in parentheses)clustered at the ZIP code level. All variables included in the analysis are defined in Ap-pendix A. The matching process used to generate the sample is the “baseline” matchingalgorithm, which is described in detail in Appendix B. *, **, and *** indicate significanceat the 10%, 5%, and 1% levels, respectively.
55
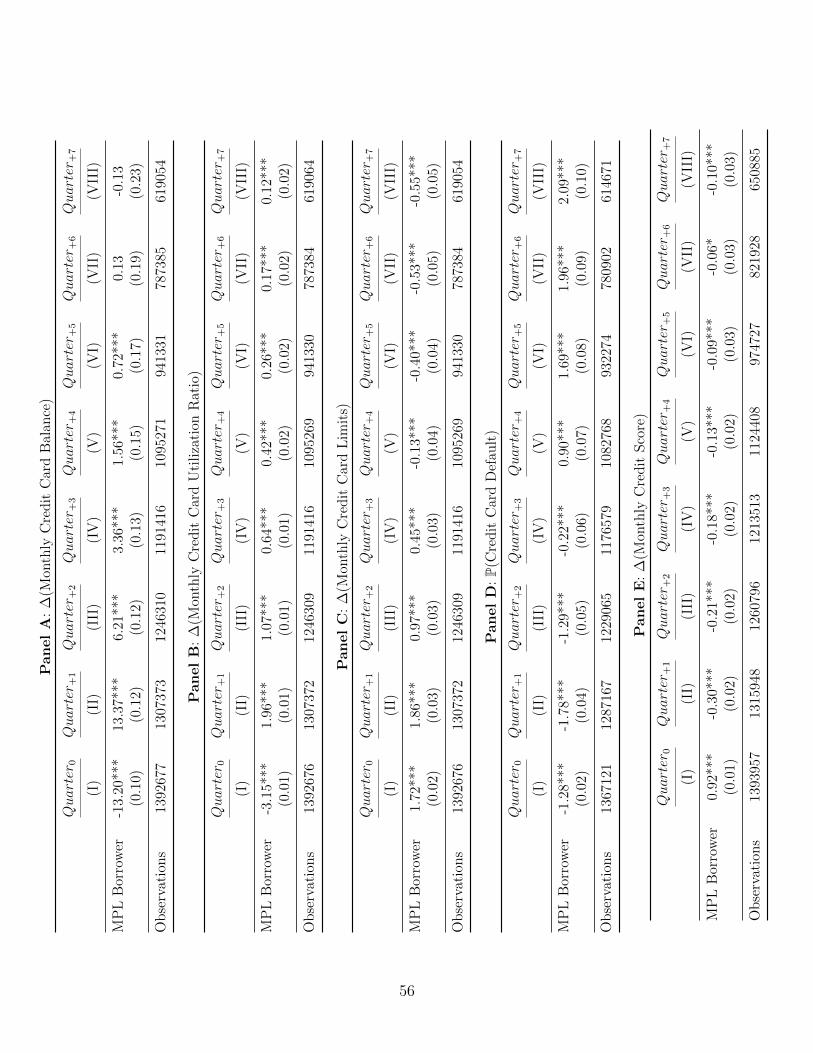
Panel
A:
∆(M
onth
lyC
redit
Car
dB
alan
ce)
Quarter
0Quarter
+1
Quarter
+2
Quarter
+3
Quarter
+4
Quarter
+5
Quarter
+6
Quarter
+7
(I)
(II)
(III
)(I
V)
(V)
(VI)
(VII
)(V
III)
MP
LB
orro
wer
-13.
20**
*13
.37*
**6.
21**
*3.
36**
*1.
56**
*0.
72**
*0.
13-0
.13
(0.1
0)(0
.12)
(0.1
2)(0
.13)
(0.1
5)(0
.17)
(0.1
9)(0
.23)
Obse
rvat
ions
1392
677
1307
373
1246
310
1191
416
1095
271
9413
3178
7385
6190
54
Panel
B:
∆(M
onth
lyC
redit
Car
dU
tiliza
tion
Rat
io)
Quarter
0Quarter
+1
Quarter
+2
Quarter
+3
Quarter
+4
Quarter
+5
Quarter
+6
Quarter
+7
(I)
(II)
(III
)(I
V)
(V)
(VI)
(VII
)(V
III)
MP
LB
orro
wer
-3.1
5***
1.96
***
1.07
***
0.64
***
0.42
***
0.26
***
0.17
***
0.12
***
(0.0
1)(0
.01)
(0.0
1)(0
.01)
(0.0
2)(0
.02)
(0.0
2)(0
.02)
Obse
rvat
ions
1392
676
1307
372
1246
309
1191
416
1095
269
9413
3078
7384
6190
64
Panel
C:
∆(M
onth
lyC
redit
Car
dL
imit
s)
Quarter
0Quarter
+1
Quarter
+2
Quarter
+3
Quarter
+4
Quarter
+5
Quarter
+6
Quarter
+7
(I)
(II)
(III
)(I
V)
(V)
(VI)
(VII
)(V
III)
MP
LB
orro
wer
1.72
***
1.86
***
0.97
***
0.45
***
-0.1
3***
-0.4
0***
-0.5
3***
-0.5
5***
(0.0
2)(0
.03)
(0.0
3)(0
.03)
(0.0
4)(0
.04)
(0.0
5)(0
.05)
Obse
rvat
ions
1392
676
1307
372
1246
309
1191
416
1095
269
9413
3078
7384
6190
54
Panel
D:P(
Cre
dit
Car
dD
efau
lt)
Quarter
0Quarter
+1
Quarter
+2
Quarter
+3
Quarter
+4
Quarter
+5
Quarter
+6
Quarter
+7
(I)
(II)
(III
)(I
V)
(V)
(VI)
(VII
)(V
III)
MP
LB
orro
wer
-1.2
8***
-1.7
8***
-1.2
9***
-0.2
2***
0.90
***
1.69
***
1.96
***
2.09
***
(0.0
2)(0
.04)
(0.0
5)(0
.06)
(0.0
7)(0
.08)
(0.0
9)(0
.10)
Obse
rvat
ions
1367
121
1287
167
1229
065
1176
579
1082
768
9322
7478
0902
6146
71
Panel
E:
∆(M
onth
lyC
redit
Sco
re)
Quarter
0Quarter
+1
Quarter
+2
Quarter
+3
Quarter
+4
Quarter
+5
Quarter
+6
Quarter
+7
(I)
(II)
(III
)(I
V)
(V)
(VI)
(VII
)(V
III)
MP
LB
orro
wer
0.92
***
-0.3
0***
-0.2
1***
-0.1
8***
-0.1
3***
-0.0
9***
-0.0
6*-0
.10*
**(0
.01)
(0.0
2)(0
.02)
(0.0
2)(0
.02)
(0.0
3)(0
.03)
(0.0
3)
Obse
rvat
ions
1393
957
1315
948
1260
796
1213
513
1124
408
9747
2782
1928
6508
85
56
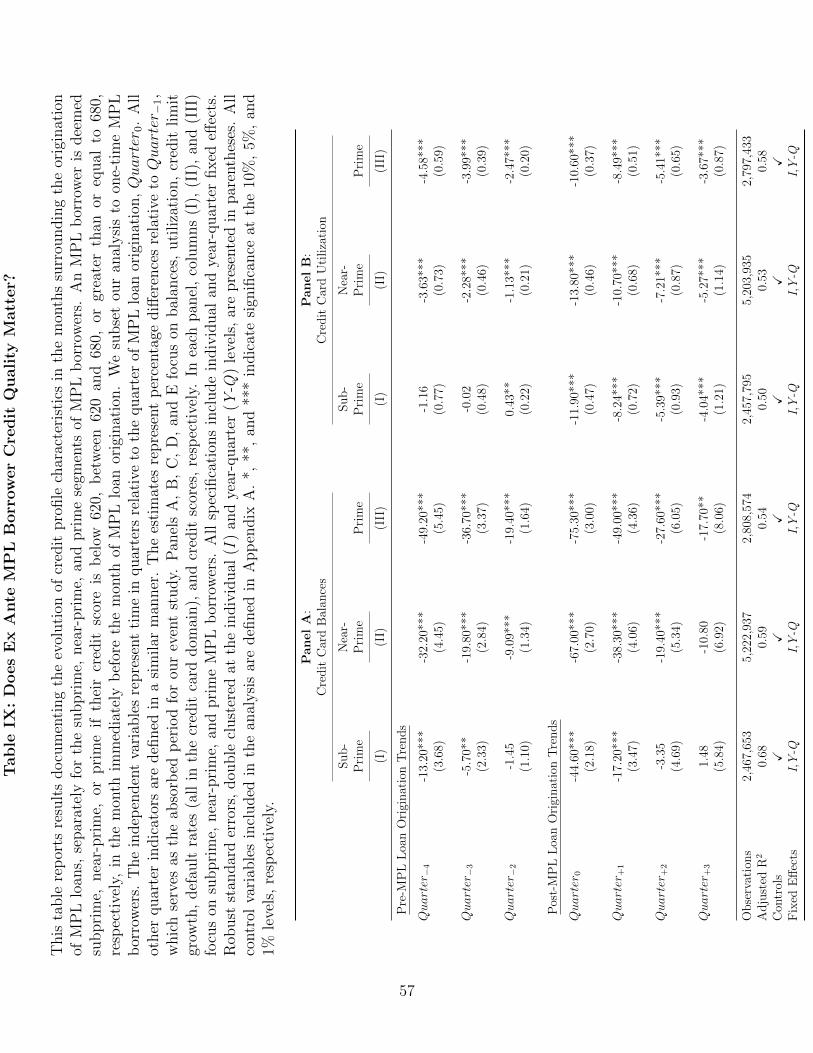
Table
IX:
Does
Ex
Ante
MP
LB
orr
ow
er
Cre
dit
Quali
tyM
att
er?
This
table
rep
orts
resu
lts
docu
men
ting
the
evol
uti
onof
cred
itpro
file
char
acte
rist
ics
inth
em
onth
ssu
rrou
ndin
gth
eor
igin
atio
nof
MP
Llo
ans,
separ
atel
yfo
rth
esu
bpri
me,
nea
r-pri
me,
and
pri
me
segm
ents
ofM
PL
bor
row
ers.
An
MP
Lb
orro
wer
isdee
med
subpri
me,
nea
r-pri
me,
orpri
me
ifth
eir
cred
itsc
ore
isb
elow
620,
bet
wee
n62
0an
d68
0,or
grea
ter
than
oreq
ual
to68
0,re
spec
tive
ly,
inth
em
onth
imm
edia
tely
bef
ore
the
mon
thof
MP
Llo
anor
igin
atio
n.
We
subse
tou
ran
alysi
sto
one-
tim
eM
PL
bor
row
ers.
The
indep
enden
tva
riab
les
repre
sent
tim
ein
quar
ters
rela
tive
toth
equar
ter
ofM
PL
loan
orig
inat
ion,Quarter
0.
All
other
quar
ter
indic
ator
sar
edefi
ned
ina
sim
ilar
man
ner
.T
he
esti
mat
esre
pre
sent
per
centa
gediff
eren
ces
rela
tive
toQuarter−1,
whic
hse
rves
asth
eab
sorb
edp
erio
dfo
rou
rev
ent
study.
Pan
els
A,
B,
C,
D,
and
Efo
cus
onbal
ance
s,uti
liza
tion
,cr
edit
lim
itgr
owth
,def
ault
rate
s(a
llin
the
cred
itca
rddom
ain),
and
cred
itsc
ores
,re
spec
tive
ly.
Inea
chpan
el,
colu
mns
(I),
(II)
,an
d(I
II)
focu
son
subpri
me,
nea
r-pri
me,
and
pri
me
MP
Lb
orro
wer
s.A
llsp
ecifi
cati
ons
incl
ude
indiv
idual
and
year
-quar
ter
fixed
effec
ts.
Rob
ust
stan
dar
der
rors
,dou
ble
clust
ered
atth
ein
div
idual
(I)
and
year
-quar
ter
(Y-Q
)le
vels
,ar
epre
sente
din
par
enth
eses
.A
llco
ntr
olva
riab
les
incl
uded
inth
ean
alysi
sar
edefi
ned
inA
pp
endix
A.
*,**
,an
d**
*in
dic
ate
sign
ifica
nce
atth
e10
%,
5%,
and
1%le
vels
,re
spec
tive
ly.
Pan
el
A:
Pan
el
B:
Cre
dit
Car
dB
alan
ces
Cre
dit
Car
dU
tiliza
tion
Sub-
Nea
r-Sub-
Nea
r-P
rim
eP
rim
eP
rim
eP
rim
eP
rim
eP
rim
e
(I)
(II)
(III
)(I
)(I
I)(I
II)
Pre
-MP
LL
oan
Ori
ginat
ion
Tre
nds
Quarter−4
-13.
20**
*-3
2.20
***
-49.
20**
*-1
.16
-3.6
3***
-4.5
8***
(3.6
8)(4
.45)
(5.4
5)(0
.77)
(0.7
3)(0
.59)
Quarter−3
-5.7
0**
-19.
80**
*-3
6.70
***
-0.0
2-2
.28*
**-3
.99*
**(2
.33)
(2.8
4)(3
.37)
(0.4
8)(0
.46)
(0.3
9)
Quarter−2
-1.4
5-9
.09*
**-1
9.40
***
0.43
**-1
.13*
**-2
.47*
**(1
.10)
(1.3
4)(1
.64)
(0.2
2)(0
.21)
(0.2
0)
Pos
t-M
PL
Loa
nO
rigi
nat
ion
Tre
nds
Quarter
0-4
4.60
***
-67.
00**
*-7
5.30
***
-11.
90**
*-1
3.80
***
-10.
60**
*(2
.18)
(2.7
0)(3
.00)
(0.4
7)(0
.46)
(0.3
7)
Quarter
+1
-17.
20**
*-3
8.30
***
-49.
00**
*-8
.24*
**-1
0.70
***
-8.4
9***
(3.4
7)(4
.06)
(4.3
6)(0
.72)
(0.6
8)(0
.51)
Quarter
+2
-3.3
5-1
9.40
***
-27.
60**
*-5
.39*
**-7
.21*
**-5
.41*
**(4
.69)
(5.3
4)(6
.05)
(0.9
3)(0
.87)
(0.6
5)
Quarter
+3
1.48
-10.
80-1
7.70
**-4
.04*
**-5
.27*
**-3
.67*
**(5
.84)
(6.9
2)(8
.06)
(1.2
1)(1
.14)
(0.8
7)
Obse
rvat
ions
2,46
7,65
35,
222,
937
2,80
8,57
42,
457,
795
5,20
3,93
52,
797,
433
Adju
sted
R2
0.68
0.59
0.54
0.50
0.53
0.58
Con
trol
sX
XX
XX
XF
ixed
Eff
ects
I,Y
-QI,
Y-Q
I,Y
-QI,
Y-Q
I,Y
-QI,
Y-Q
57
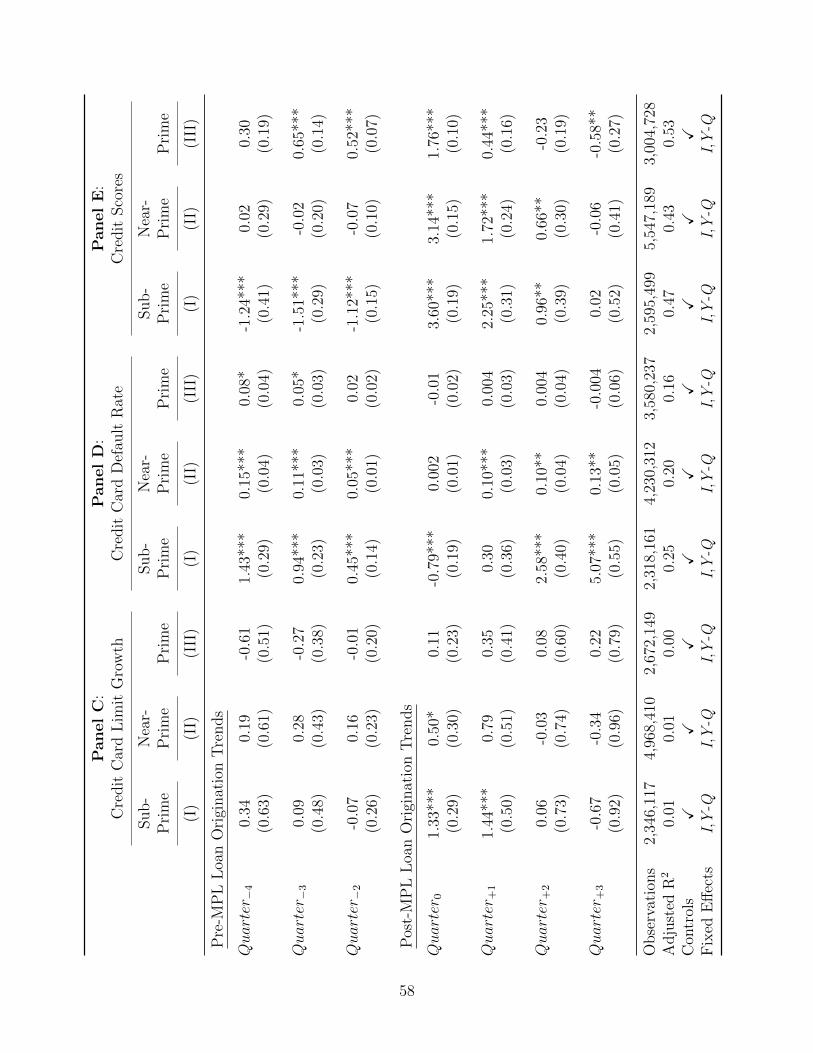
Pan
el
C:
Panel
D:
Panel
E:
Cre
dit
Car
dL
imit
Gro
wth
Cre
dit
Car
dD
efau
ltR
ate
Cre
dit
Sco
res
Sub-
Nea
r-Sub-
Nea
r-Sub-
Nea
r-P
rim
eP
rim
eP
rim
eP
rim
eP
rim
eP
rim
eP
rim
eP
rim
eP
rim
e
(I)
(II)
(III
)(I
)(I
I)(I
II)
(I)
(II)
(III
)
Pre
-MP
LL
oan
Ori
ginat
ion
Tre
nds
Quarter−4
0.34
0.19
-0.6
11.
43**
*0.
15**
*0.
08*
-1.2
4***
0.02
0.30
(0.6
3)(0
.61)
(0.5
1)(0
.29)
(0.0
4)(0
.04)
(0.4
1)(0
.29)
(0.1
9)
Quarter−3
0.09
0.28
-0.2
70.
94**
*0.
11**
*0.
05*
-1.5
1***
-0.0
20.
65**
*(0
.48)
(0.4
3)(0
.38)
(0.2
3)(0
.03)
(0.0
3)(0
.29)
(0.2
0)(0
.14)
Quarter−2
-0.0
70.
16-0
.01
0.45
***
0.05
***
0.02
-1.1
2***
-0.0
70.
52**
*(0
.26)
(0.2
3)(0
.20)
(0.1
4)(0
.01)
(0.0
2)(0
.15)
(0.1
0)(0
.07)
Pos
t-M
PL
Loa
nO
rigi
nat
ion
Tre
nds
Quarter
01.
33**
*0.
50*
0.11
-0.7
9***
0.00
2-0
.01
3.60
***
3.14
***
1.76
***
(0.2
9)(0
.30)
(0.2
3)(0
.19)
(0.0
1)(0
.02)
(0.1
9)(0
.15)
(0.1
0)
Quarter
+1
1.44
***
0.79
0.35
0.30
0.10
***
0.00
42.
25**
*1.
72**
*0.
44**
*(0
.50)
(0.5
1)(0
.41)
(0.3
6)(0
.03)
(0.0
3)(0
.31)
(0.2
4)(0
.16)
Quarter
+2
0.06
-0.0
30.
082.
58**
*0.
10**
0.00
40.
96**
0.66
**-0
.23
(0.7
3)(0
.74)
(0.6
0)(0
.40)
(0.0
4)(0
.04)
(0.3
9)(0
.30)
(0.1
9)
Quarter
+3
-0.6
7-0
.34
0.22
5.07
***
0.13
**-0
.004
0.02
-0.0
6-0
.58*
*(0
.92)
(0.9
6)(0
.79)
(0.5
5)(0
.05)
(0.0
6)(0
.52)
(0.4
1)(0
.27)
Obse
rvat
ions
2,34
6,11
74,
968,
410
2,67
2,14
92,
318,
161
4,23
0,31
23,
580,
237
2,59
5,49
95,
547,
189
3,00
4,72
8A
dju
sted
R2
0.01
0.01
0.00
0.25
0.20
0.16
0.47
0.43
0.53
Con
trol
sX
XX
XX
XX
XX
Fix
edE
ffec
tsI,
Y-Q
I,Y
-QI,
Y-Q
I,Y
-QI,
Y-Q
I,Y
-QI,
Y-Q
I,Y
-QI,
Y-Q
58
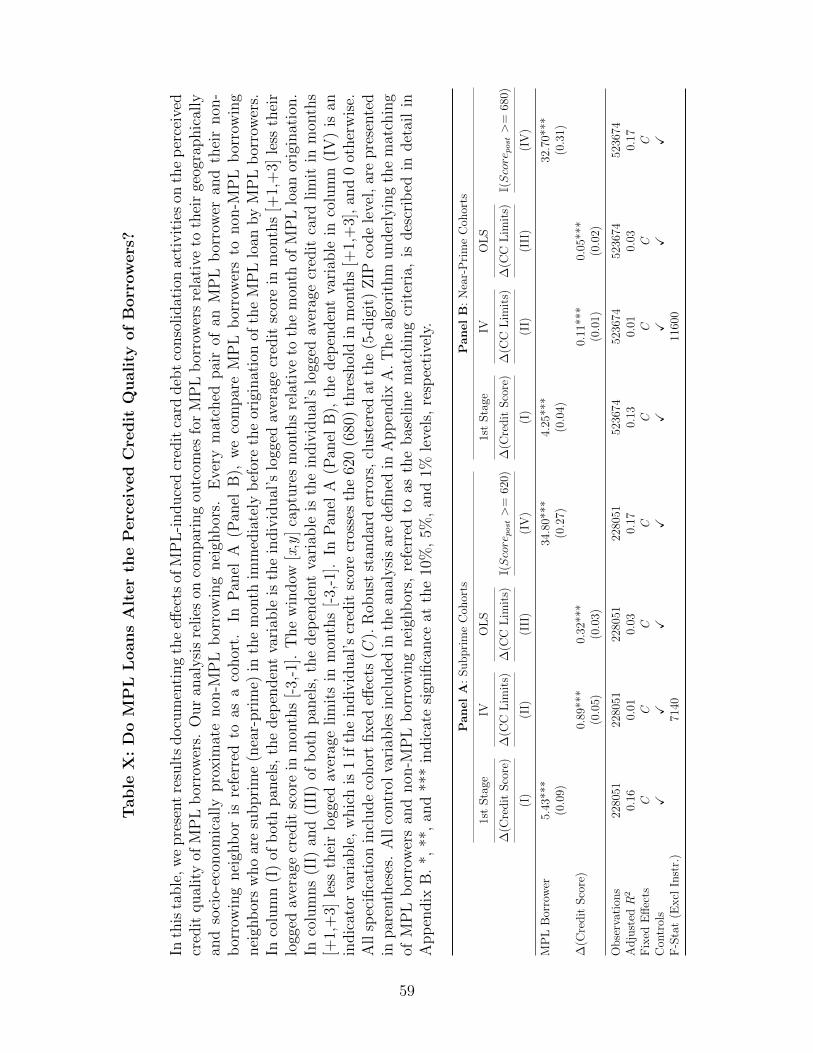
Table
X:
Do
MP
LL
oans
Alt
er
the
Perc
eiv
ed
Cre
dit
Quali
tyof
Borr
ow
ers
?
Inth
ista
ble
,w
epre
sent
resu
lts
docu
men
ting
the
effec
tsof
MP
L-i
nduce
dcr
edit
card
deb
tco
nso
lidat
ion
acti
vit
ies
onth
ep
erce
ived
cred
itqual
ity
ofM
PL
bor
row
ers.
Our
anal
ysi
sre
lies
onco
mpar
ing
outc
omes
for
MP
Lb
orro
wer
sre
lati
veto
thei
rge
ogra
phic
ally
and
soci
o-ec
onom
ical
lypro
xim
ate
non
-MP
Lb
orro
win
gnei
ghb
ors.
Eve
rym
atch
edpai
rof
anM
PL
bor
row
eran
dth
eir
non
-b
orro
win
gnei
ghb
oris
refe
rred
toas
aco
hor
t.In
Pan
elA
(Pan
elB
),w
eco
mpar
eM
PL
bor
row
ers
tonon
-MP
Lb
orro
win
gnei
ghb
ors
who
are
subpri
me
(nea
r-pri
me)
inth
em
onth
imm
edia
tely
bef
ore
the
orig
inat
ion
ofth
eM
PL
loan
by
MP
Lb
orro
wer
s.In
colu
mn
(I)
ofb
oth
pan
els,
the
dep
enden
tva
riab
leis
the
indiv
idual
’slo
gged
aver
age
cred
itsc
ore
inm
onth
s[+
1,+
3]le
ssth
eir
logg
edav
erag
ecr
edit
scor
ein
mon
ths
[-3,
-1].
The
win
dow
[x,y
]ca
ptu
res
mon
ths
rela
tive
toth
em
onth
ofM
PL
loan
orig
inat
ion.
Inco
lum
ns
(II)
and
(III
)of
bot
hpan
els,
the
dep
enden
tva
riab
leis
the
indiv
idual
’slo
gged
aver
age
cred
itca
rdlim
itin
mon
ths
[+1,
+3]
less
thei
rlo
gged
aver
age
lim
its
inm
onth
s[-
3,-1
].In
Pan
elA
(Pan
elB
),th
edep
enden
tva
riab
lein
colu
mn
(IV
)is
anin
dic
ator
vari
able
,w
hic
his
1if
the
indiv
idual
’scr
edit
scor
ecr
osse
sth
e62
0(6
80)
thre
shol
din
mon
ths
[+1,
+3]
,an
d0
other
wis
e.A
llsp
ecifi
cati
onin
clude
cohor
tfixed
effec
ts(C
).R
obust
stan
dar
der
rors
,cl
ust
ered
atth
e(5
-dig
it)
ZIP
code
leve
l,ar
epre
sente
din
par
enth
eses
.A
llco
ntr
olva
riab
les
incl
uded
inth
ean
alysi
sar
edefi
ned
inA
pp
endix
A.
The
algo
rith
munder
lyin
gth
em
atch
ing
ofM
PL
bor
row
ers
and
non
-MP
Lb
orro
win
gnei
ghb
ors,
refe
rred
toas
the
bas
elin
em
atch
ing
crit
eria
,is
des
crib
edin
det
ail
inA
pp
endix
B.
*,**
,an
d**
*in
dic
ate
sign
ifica
nce
atth
e10
%,
5%,
and
1%le
vels
,re
spec
tive
ly.
Pan
el
A:
Su
bp
rim
eC
ohor
tsP
an
el
B:
Nea
r-P
rim
eC
ohor
ts
1st
Sta
geIV
OL
S1s
tS
tage
IVO
LS
∆(C
red
itS
core
)∆
(CC
Lim
its)
∆(C
CL
imit
s)I(Scorepost>
=62
0)∆
(Cre
dit
Sco
re)
∆(C
CL
imit
s)∆
(CC
Lim
its)
I(Scorepost>
=68
0)
(I)
(II)
(III
)(I
V)
(I)
(II)
(III
)(I
V)
MP
LB
orro
wer
5.43
***
34.8
0***
4.25
***
32.7
0***
(0.0
9)(0
.27)
(0.0
4)(0
.31)
∆(C
red
itS
core
)0.
89**
*0.
32**
*0.
11**
*0.
05**
*(0
.05)
(0.0
3)(0
.01)
(0.0
2)
Ob
serv
atio
ns
2280
5122
8051
2280
5122
8051
5236
7452
3674
5236
7452
3674
Ad
just
edR
20.
160.
010.
030.
170.
130.
010.
030.
17F
ixed
Eff
ects
CC
CC
CC
CC
Con
trol
sX
XX
XX
XX
XF
-Sta
t(E
xcl
Inst
r.)
7140
1160
0
59

Appendix A - Variable Definitions
• Standardized Income – Monthly income standardized using the average and stan-dard deviation of monthly income for every year-month included in the analysis.
• Homeowner – Indicator variable that equals 1 if the individual is identified as ahomeowner by the credit bureau, and 0 otherwise.
• College Educated – Indicator variable that equals 1 if the individual has a collegedegree as identified by the credit bureau, and 0 otherwise.
• Financially Sophisticated Job – Indicator variable that equals 1 if the individual isidentified to work in a field that requires financial sophistication, and 0 otherwise.
60
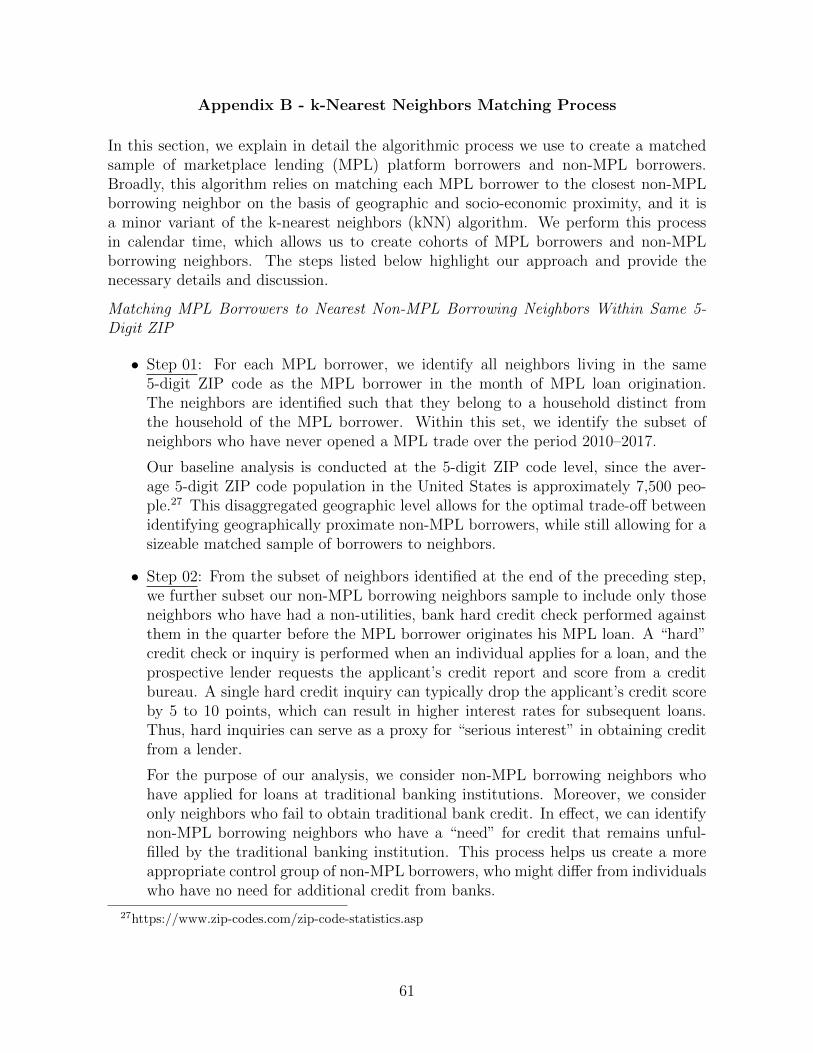
Appendix B - k-Nearest Neighbors Matching Process
In this section, we explain in detail the algorithmic process we use to create a matchedsample of marketplace lending (MPL) platform borrowers and non-MPL borrowers.Broadly, this algorithm relies on matching each MPL borrower to the closest non-MPLborrowing neighbor on the basis of geographic and socio-economic proximity, and it isa minor variant of the k-nearest neighbors (kNN) algorithm. We perform this processin calendar time, which allows us to create cohorts of MPL borrowers and non-MPLborrowing neighbors. The steps listed below highlight our approach and provide thenecessary details and discussion.
Matching MPL Borrowers to Nearest Non-MPL Borrowing Neighbors Within Same 5-Digit ZIP
• Step 01: For each MPL borrower, we identify all neighbors living in the same5-digit ZIP code as the MPL borrower in the month of MPL loan origination.The neighbors are identified such that they belong to a household distinct fromthe household of the MPL borrower. Within this set, we identify the subset ofneighbors who have never opened a MPL trade over the period 2010–2017.
Our baseline analysis is conducted at the 5-digit ZIP code level, since the aver-age 5-digit ZIP code population in the United States is approximately 7,500 peo-ple.27 This disaggregated geographic level allows for the optimal trade-off betweenidentifying geographically proximate non-MPL borrowers, while still allowing for asizeable matched sample of borrowers to neighbors.
• Step 02: From the subset of neighbors identified at the end of the preceding step,we further subset our non-MPL borrowing neighbors sample to include only thoseneighbors who have had a non-utilities, bank hard credit check performed againstthem in the quarter before the MPL borrower originates his MPL loan. A “hard”credit check or inquiry is performed when an individual applies for a loan, and theprospective lender requests the applicant’s credit report and score from a creditbureau. A single hard credit inquiry can typically drop the applicant’s credit scoreby 5 to 10 points, which can result in higher interest rates for subsequent loans.Thus, hard inquiries can serve as a proxy for “serious interest” in obtaining creditfrom a lender.
For the purpose of our analysis, we consider non-MPL borrowing neighbors whohave applied for loans at traditional banking institutions. Moreover, we consideronly neighbors who fail to obtain traditional bank credit. In effect, we can identifynon-MPL borrowing neighbors who have a “need” for credit that remains unful-filled by the traditional banking institution. This process helps us create a moreappropriate control group of non-MPL borrowers, who might differ from individualswho have no need for additional credit from banks.
27https://www.zip-codes.com/zip-code-statistics.asp
61
• Step 03: From the subset of neighbors identified in the above step, we make useof our cohort-level, calendar-time approach to next identify neighbors who havedisplayed credit profile trends that are similar to ones shown by the MPL borrowerin their cohort in the quarter leading up to MPL loan origination. We requirethat certain credit profile characteristics display identical trends for both the non-borrowing neighbor and the MPL borrower. These characteristics are credit cardbalances, credit card utilization ratios, and credit scores.
• Step 04: As a final step, we identify the nearest (top 1) neighbor in month preced-ing MPL loan origination using the k-nearest neighbor algorithm. The dimenionsincluded in the kNN algorithm include credit score, credit card utilization ratio,number of open trade accounts, credit card balance, mortgage balance, total bal-ance, personal monthly income, and the debt-to-income ratio.
In effect, we create a matched sample of MPL borrowers and non-MPL borrowerswho reside in the same geographical space, and display similar credit profile trendsin the calendar months leading up to the MPL borrower originating an MPL loan.The only differentiating characteristic between MPL borrowers and non-MPL bor-rowers is the origination of the MPL loan.
In addition to the baseline matching approach discussed above, we demonstrate therobustness of our results to two additional matching techniques:
Matching Bank Credit-Denied MPL Borrowers to Nearest Non-MPL Borrowing BankCredit-Denied Neighbors Within Same 5-Digit ZIP
• Identical to the baseline matching approach, except that MPL borrowers and theirneighbors are both subsetted such that both groups contain only individuals whohave applied for, and have been denied, credit from traditional banks in the quarterpreceding the origination of the MPL loan by the MPL borrower. In effect, we areidentifying the set of individuals who have unsuccessfully applied for bank credit.The differentiating factor between MPL borrowers and their non-MPL borrowingneighbors is that the former originate MPL loans.
Matching MPL Borrowers to Nearest Non-MPL Borrowing Neighbors Within Same 9-Digit ZIP
• Identical to the baseline approach, with the exception being that we consider neigh-bors from the same 9-digit ZIP code as the MPL borrower. Given that the averagepopulation of a 9-digit ZIP in the United States is fewer than 10 people, and giventhat individuals of similar socioeconomic characteristics tend to co-locate in theUnited States, we can identify a very close match of non-MPL borrowing neighborsusing this approach. Moreover, our findings are re-affirmed in this significantlysmaller matched sample.
62
Appendix C - Additional Tables
In this section, we present additional results that supplement the main findings of thepaper, but were left out of the main text of the paper due to length considerations.
A brief summary of the additional tests is presented below:
• In Appendix Table C.I, we present results that document the robustness of ourfindings to the matching algorithm that relies on pairing bank credit-denied MPLborrowers with socio-economically similar non-MPL borrowing, bank credit-deniedneighbors. The implementation of the algorithm is described in Appendix B.
• In Appendix Table C.II, we show that our results presented in Table VIII holdeven when creating a matched sample of MPL borrowers and socio-economicallysimilar non-MPL borrowing neighbors selected from the MPL borrowers’ 9-digitZIP codes. The baseline analysis in Table VIII creates the matched sample at the5-digit ZIP code level.
• In Appendix Table C.III, we show that, for the subprime segment of the MPLborrower base, defaults in the post-MPL loan origination period are concentratedin credit cards, and not in other forms of debt, including the originated MPL loanitself.
• In Appendix Table C.IV, we present results documenting MPL loan-induced creditprofile changes along cross-sectional cuts based on the interest rates charged onsuch loans. The analysis is conducted separately for different terciles of chargedinterest rates.
• In Appendix Table C.V, we present results documenting MPL loan-induced creditprofile changes along cross-sectional cuts based on MPL loan amounts. The analysisis conducted separately for different terciles of borrowed MPL amounts.
63
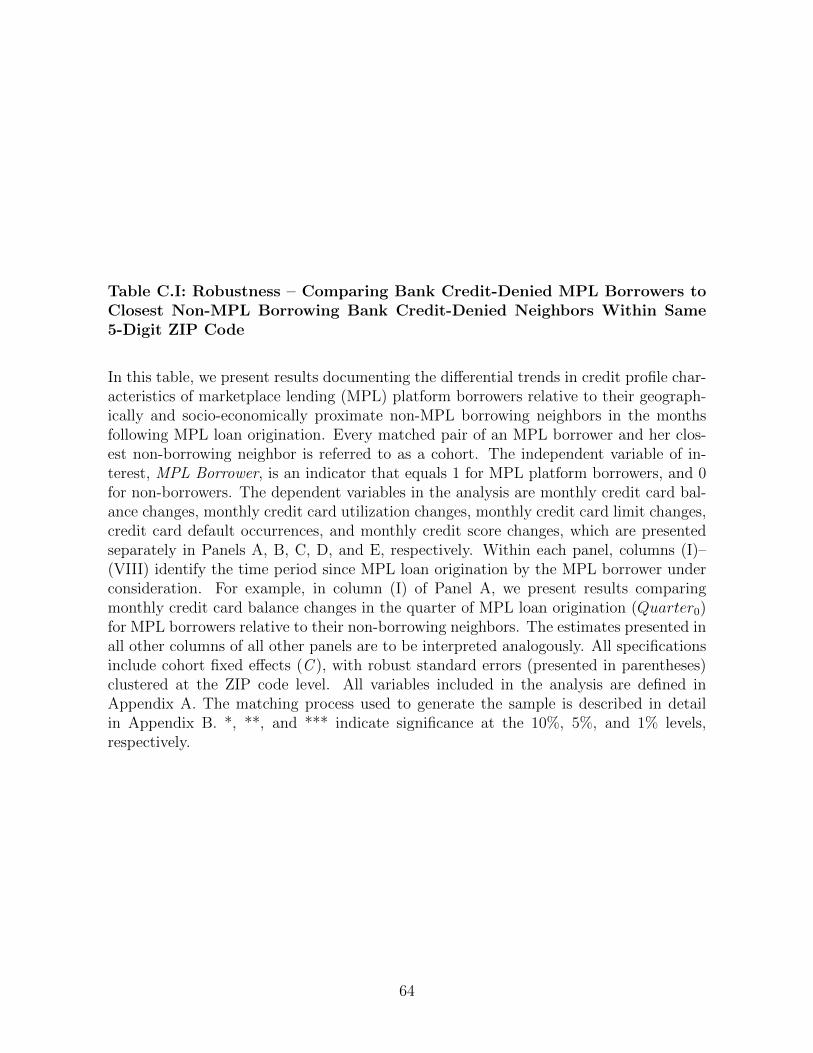
Table C.I: Robustness – Comparing Bank Credit-Denied MPL Borrowers toClosest Non-MPL Borrowing Bank Credit-Denied Neighbors Within Same5-Digit ZIP Code
In this table, we present results documenting the differential trends in credit profile char-acteristics of marketplace lending (MPL) platform borrowers relative to their geograph-ically and socio-economically proximate non-MPL borrowing neighbors in the monthsfollowing MPL loan origination. Every matched pair of an MPL borrower and her clos-est non-borrowing neighbor is referred to as a cohort. The independent variable of in-terest, MPL Borrower, is an indicator that equals 1 for MPL platform borrowers, and 0for non-borrowers. The dependent variables in the analysis are monthly credit card bal-ance changes, monthly credit card utilization changes, monthly credit card limit changes,credit card default occurrences, and monthly credit score changes, which are presentedseparately in Panels A, B, C, D, and E, respectively. Within each panel, columns (I)–(VIII) identify the time period since MPL loan origination by the MPL borrower underconsideration. For example, in column (I) of Panel A, we present results comparingmonthly credit card balance changes in the quarter of MPL loan origination (Quarter0)for MPL borrowers relative to their non-borrowing neighbors. The estimates presented inall other columns of all other panels are to be interpreted analogously. All specificationsinclude cohort fixed effects (C ), with robust standard errors (presented in parentheses)clustered at the ZIP code level. All variables included in the analysis are defined inAppendix A. The matching process used to generate the sample is described in detailin Appendix B. *, **, and *** indicate significance at the 10%, 5%, and 1% levels,respectively.
64
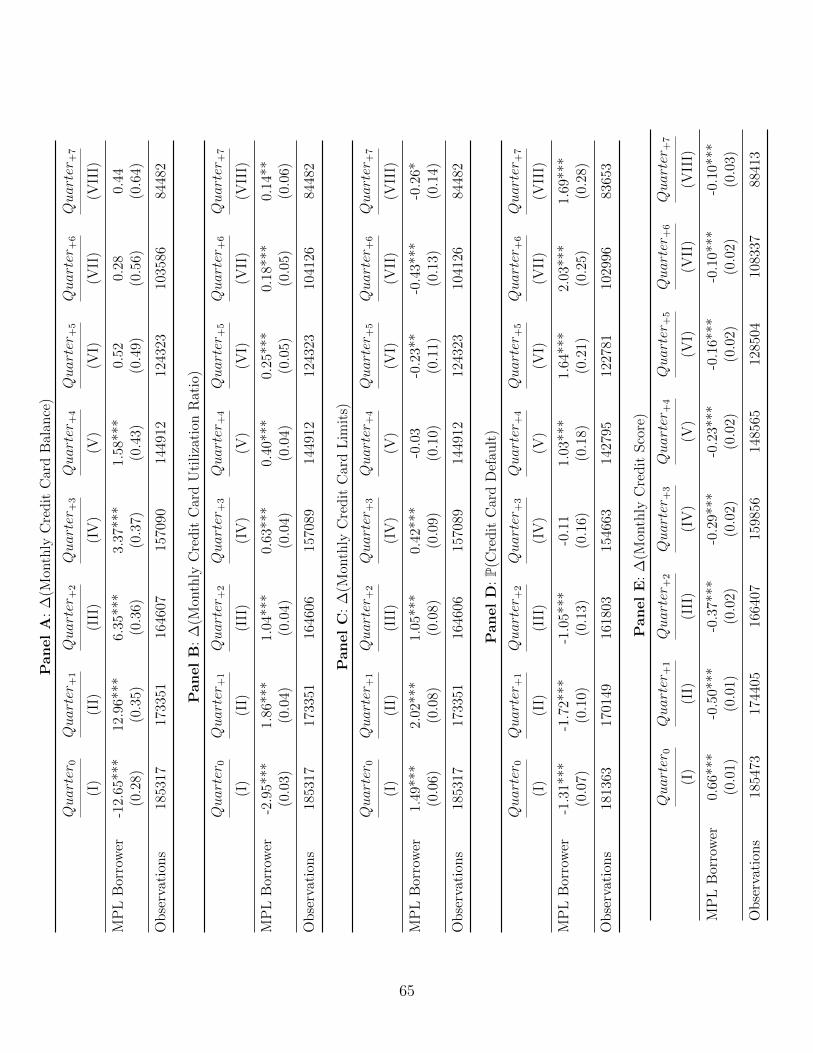
Panel
A:
∆(M
onth
lyC
redit
Car
dB
alan
ce)
Quarter
0Quarter
+1
Quarter
+2
Quarter
+3
Quarter
+4
Quarter
+5
Quarter
+6
Quarter
+7
(I)
(II)
(III
)(I
V)
(V)
(VI)
(VII
)(V
III)
MP
LB
orro
wer
-12.
65**
*12
.96*
**6.
35**
*3.
37**
*1.
58**
*0.
520.
280.
44(0
.28)
(0.3
5)(0
.36)
(0.3
7)(0
.43)
(0.4
9)(0
.56)
(0.6
4)
Obse
rvat
ions
1853
1717
3351
1646
0715
7090
1449
1212
4323
1035
8684
482
Panel
B:
∆(M
onth
lyC
redit
Car
dU
tiliza
tion
Rat
io)
Quarter
0Quarter
+1
Quarter
+2
Quarter
+3
Quarter
+4
Quarter
+5
Quarter
+6
Quarter
+7
(I)
(II)
(III
)(I
V)
(V)
(VI)
(VII
)(V
III)
MP
LB
orro
wer
-2.9
5***
1.86
***
1.04
***
0.63
***
0.40
***
0.25
***
0.18
***
0.14
**(0
.03)
(0.0
4)(0
.04)
(0.0
4)(0
.04)
(0.0
5)(0
.05)
(0.0
6)
Obse
rvat
ions
1853
1717
3351
1646
0615
7089
1449
1212
4323
1041
2684
482
Panel
C:
∆(M
onth
lyC
redit
Car
dL
imit
s)
Quarter
0Quarter
+1
Quarter
+2
Quarter
+3
Quarter
+4
Quarter
+5
Quarter
+6
Quarter
+7
(I)
(II)
(III
)(I
V)
(V)
(VI)
(VII
)(V
III)
MP
LB
orro
wer
1.49
***
2.02
***
1.05
***
0.42
***
-0.0
3-0
.23*
*-0
.43*
**-0
.26*
(0.0
6)(0
.08)
(0.0
8)(0
.09)
(0.1
0)(0
.11)
(0.1
3)(0
.14)
Obse
rvat
ions
1853
1717
3351
1646
0615
7089
1449
1212
4323
1041
2684
482
Panel
D:P(
Cre
dit
Car
dD
efau
lt)
Quarter
0Quarter
+1
Quarter
+2
Quarter
+3
Quarter
+4
Quarter
+5
Quarter
+6
Quarter
+7
(I)
(II)
(III
)(I
V)
(V)
(VI)
(VII
)(V
III)
MP
LB
orro
wer
-1.3
1***
-1.7
2***
-1.0
5***
-0.1
11.
03**
*1.
64**
*2.
03**
*1.
69**
*(0
.07)
(0.1
0)(0
.13)
(0.1
6)(0
.18)
(0.2
1)(0
.25)
(0.2
8)
Obse
rvat
ions
1813
6317
0149
1618
0315
4663
1427
9512
2781
1029
9683
653
Panel
E:
∆(M
onth
lyC
redit
Sco
re)
Quarter
0Quarter
+1
Quarter
+2
Quarter
+3
Quarter
+4
Quarter
+5
Quarter
+6
Quarter
+7
(I)
(II)
(III
)(I
V)
(V)
(VI)
(VII
)(V
III)
MP
LB
orro
wer
0.66
***
-0.5
0***
-0.3
7***
-0.2
9***
-0.2
3***
-0.1
6***
-0.1
0***
-0.1
0***
(0.0
1)(0
.01)
(0.0
2)(0
.02)
(0.0
2)(0
.02)
(0.0
2)(0
.03)
Obse
rvat
ions
1854
7317
4405
1664
0715
9856
1485
6512
8504
1083
3788
413
65
Table C.II: Robustness – Comparing MPL Borrowers to Nearest Non-MPLBorrowing Neighbors Within Same 9-Digit ZIP Code
In this table, we present results documenting the differential trends in credit profile char-acteristics of marketplace lending (MPL) platform borrowers relative to their geograph-ically and socio-economically proximate non-MPL borrowing neighbors in the monthsfollowing MPL loan origination. Every matched pair of an MPL borrower and her clos-est non-borrowing neighbor is referred to as a cohort. The independent variable of in-terest, MPL Borrower, is an indicator that equals 1 for MPL platform borrowers, and 0for non-borrowers. The dependent variables in the analysis are monthly credit card bal-ance changes, monthly credit card utilization changes, monthly credit card limit changes,credit card default occurrences, and monthly credit score changes, which are presentedseparately in Panels A, B, C, D, and E, respectively. Within each panel, columns (I)–(VIII) identify the time period since MPL loan origination by the MPL borrower underconsideration. For example, in column (I) of Panel A, we present results comparingmonthly credit card balance changes in the quarter of MPL loan origination (Quarter0)for MPL borrowers relative to their non-borrowing neighbors. The estimates presented inall other columns of all other panels are to be interpreted analogously. All specificationsinclude cohort fixed effects (C ), with robust standard errors (presented in parentheses)clustered at the ZIP code level. All variables included in the analysis are defined inAppendix A. The matching process used to generate the sample is described in detailin Appendix B. *, **, and *** indicate significance at the 10%, 5%, and 1% levels,respectively.
66
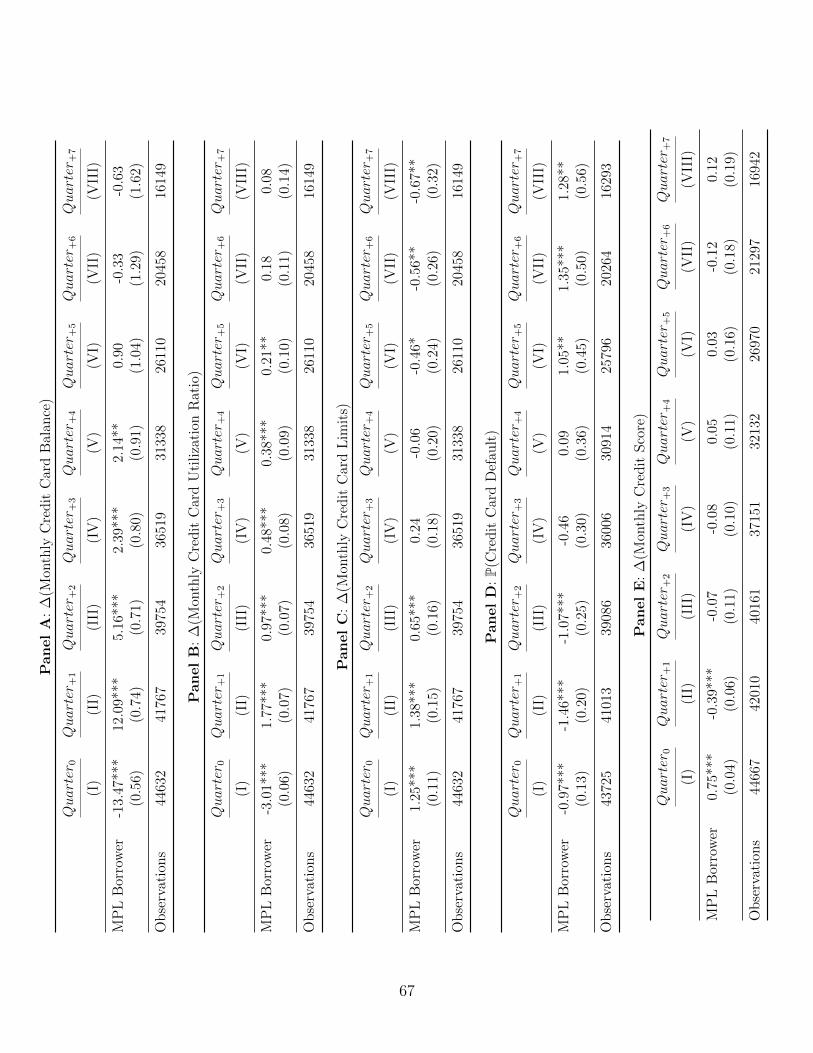
Panel
A:
∆(M
onth
lyC
redit
Car
dB
alan
ce)
Quarter
0Quarter
+1
Quarter
+2
Quarter
+3
Quarter
+4
Quarter
+5
Quarter
+6
Quarter
+7
(I)
(II)
(III
)(I
V)
(V)
(VI)
(VII
)(V
III)
MP
LB
orro
wer
-13.
47**
*12
.09*
**5.
16**
*2.
39**
*2.
14**
0.90
-0.3
3-0
.63
(0.5
6)(0
.74)
(0.7
1)(0
.80)
(0.9
1)(1
.04)
(1.2
9)(1
.62)
Obse
rvat
ions
4463
241
767
3975
436
519
3133
826
110
2045
816
149
Panel
B:
∆(M
onth
lyC
redit
Car
dU
tiliza
tion
Rat
io)
Quarter
0Quarter
+1
Quarter
+2
Quarter
+3
Quarter
+4
Quarter
+5
Quarter
+6
Quarter
+7
(I)
(II)
(III
)(I
V)
(V)
(VI)
(VII
)(V
III)
MP
LB
orro
wer
-3.0
1***
1.77
***
0.97
***
0.48
***
0.38
***
0.21
**0.
180.
08(0
.06)
(0.0
7)(0
.07)
(0.0
8)(0
.09)
(0.1
0)(0
.11)
(0.1
4)
Obse
rvat
ions
4463
241
767
3975
436
519
3133
826
110
2045
816
149
Panel
C:
∆(M
onth
lyC
redit
Car
dL
imit
s)
Quarter
0Quarter
+1
Quarter
+2
Quarter
+3
Quarter
+4
Quarter
+5
Quarter
+6
Quarter
+7
(I)
(II)
(III
)(I
V)
(V)
(VI)
(VII
)(V
III)
MP
LB
orro
wer
1.25
***
1.38
***
0.65
***
0.24
-0.0
6-0
.46*
-0.5
6**
-0.6
7**
(0.1
1)(0
.15)
(0.1
6)(0
.18)
(0.2
0)(0
.24)
(0.2
6)(0
.32)
Obse
rvat
ions
4463
241
767
3975
436
519
3133
826
110
2045
816
149
Panel
D:P(
Cre
dit
Car
dD
efau
lt)
Quarter
0Quarter
+1
Quarter
+2
Quarter
+3
Quarter
+4
Quarter
+5
Quarter
+6
Quarter
+7
(I)
(II)
(III
)(I
V)
(V)
(VI)
(VII
)(V
III)
MP
LB
orro
wer
-0.9
7***
-1.4
6***
-1.0
7***
-0.4
60.
091.
05**
1.35
***
1.28
**(0
.13)
(0.2
0)(0
.25)
(0.3
0)(0
.36)
(0.4
5)(0
.50)
(0.5
6)
Obse
rvat
ions
4372
541
013
3908
636
006
3091
425
796
2026
416
293
Panel
E:
∆(M
onth
lyC
redit
Sco
re)
Quarter
0Quarter
+1
Quarter
+2
Quarter
+3
Quarter
+4
Quarter
+5
Quarter
+6
Quarter
+7
(I)
(II)
(III
)(I
V)
(V)
(VI)
(VII
)(V
III)
MP
LB
orro
wer
0.75
***
-0.3
9***
-0.0
7-0
.08
0.05
0.03
-0.1
20.
12(0
.04)
(0.0
6)(0
.11)
(0.1
0)(0
.11)
(0.1
6)(0
.18)
(0.1
9)
Obse
rvat
ions
4466
742
010
4016
137
151
3213
226
970
2129
716
942
67
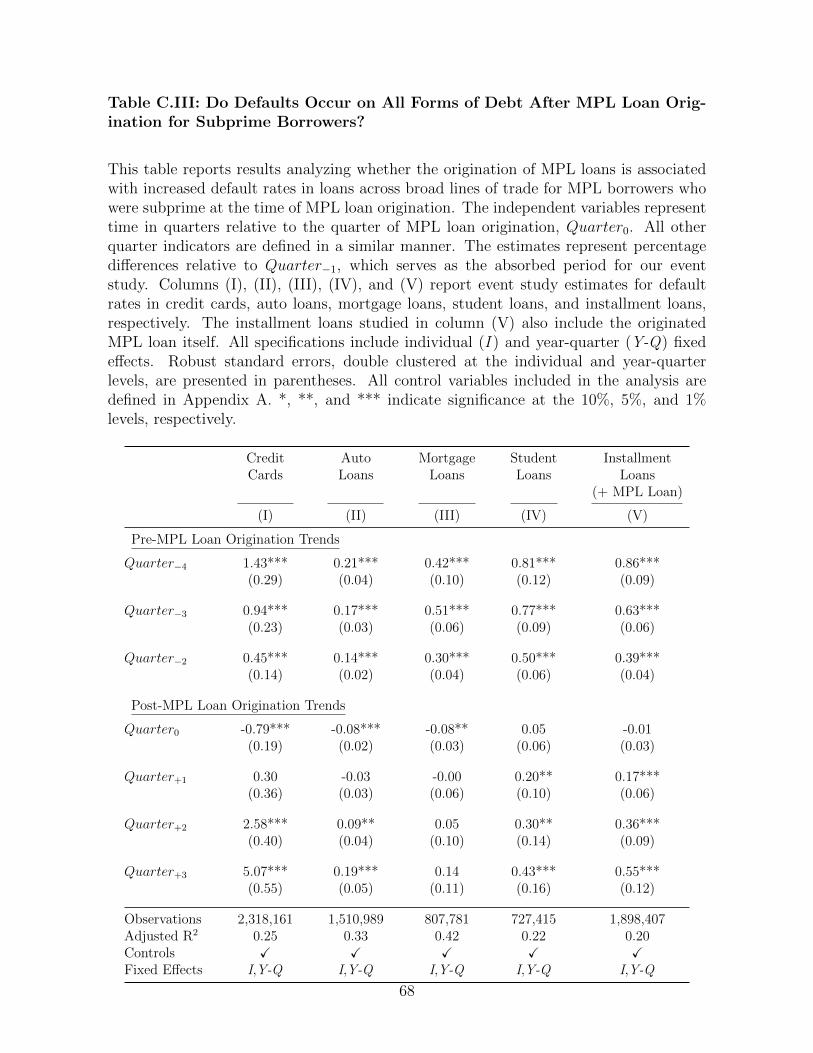
Table C.III: Do Defaults Occur on All Forms of Debt After MPL Loan Orig-ination for Subprime Borrowers?
This table reports results analyzing whether the origination of MPL loans is associatedwith increased default rates in loans across broad lines of trade for MPL borrowers whowere subprime at the time of MPL loan origination. The independent variables representtime in quarters relative to the quarter of MPL loan origination, Quarter0. All otherquarter indicators are defined in a similar manner. The estimates represent percentagedifferences relative to Quarter−1, which serves as the absorbed period for our eventstudy. Columns (I), (II), (III), (IV), and (V) report event study estimates for defaultrates in credit cards, auto loans, mortgage loans, student loans, and installment loans,respectively. The installment loans studied in column (V) also include the originatedMPL loan itself. All specifications include individual (I ) and year-quarter (Y-Q) fixedeffects. Robust standard errors, double clustered at the individual and year-quarterlevels, are presented in parentheses. All control variables included in the analysis aredefined in Appendix A. *, **, and *** indicate significance at the 10%, 5%, and 1%levels, respectively.
Credit Auto Mortgage Student InstallmentCards Loans Loans Loans Loans
(+ MPL Loan)
(I) (II) (III) (IV) (V)
Pre-MPL Loan Origination Trends
Quarter−4 1.43*** 0.21*** 0.42*** 0.81*** 0.86***(0.29) (0.04) (0.10) (0.12) (0.09)
Quarter−3 0.94*** 0.17*** 0.51*** 0.77*** 0.63***(0.23) (0.03) (0.06) (0.09) (0.06)
Quarter−2 0.45*** 0.14*** 0.30*** 0.50*** 0.39***(0.14) (0.02) (0.04) (0.06) (0.04)
Post-MPL Loan Origination Trends
Quarter0 -0.79*** -0.08*** -0.08** 0.05 -0.01(0.19) (0.02) (0.03) (0.06) (0.03)
Quarter+1 0.30 -0.03 -0.00 0.20** 0.17***(0.36) (0.03) (0.06) (0.10) (0.06)
Quarter+2 2.58*** 0.09** 0.05 0.30** 0.36***(0.40) (0.04) (0.10) (0.14) (0.09)
Quarter+3 5.07*** 0.19*** 0.14 0.43*** 0.55***(0.55) (0.05) (0.11) (0.16) (0.12)
Observations 2,318,161 1,510,989 807,781 727,415 1,898,407Adjusted R2 0.25 0.33 0.42 0.22 0.20Controls X X X X XFixed Effects I,Y-Q I,Y-Q I,Y-Q I,Y-Q I,Y-Q
68
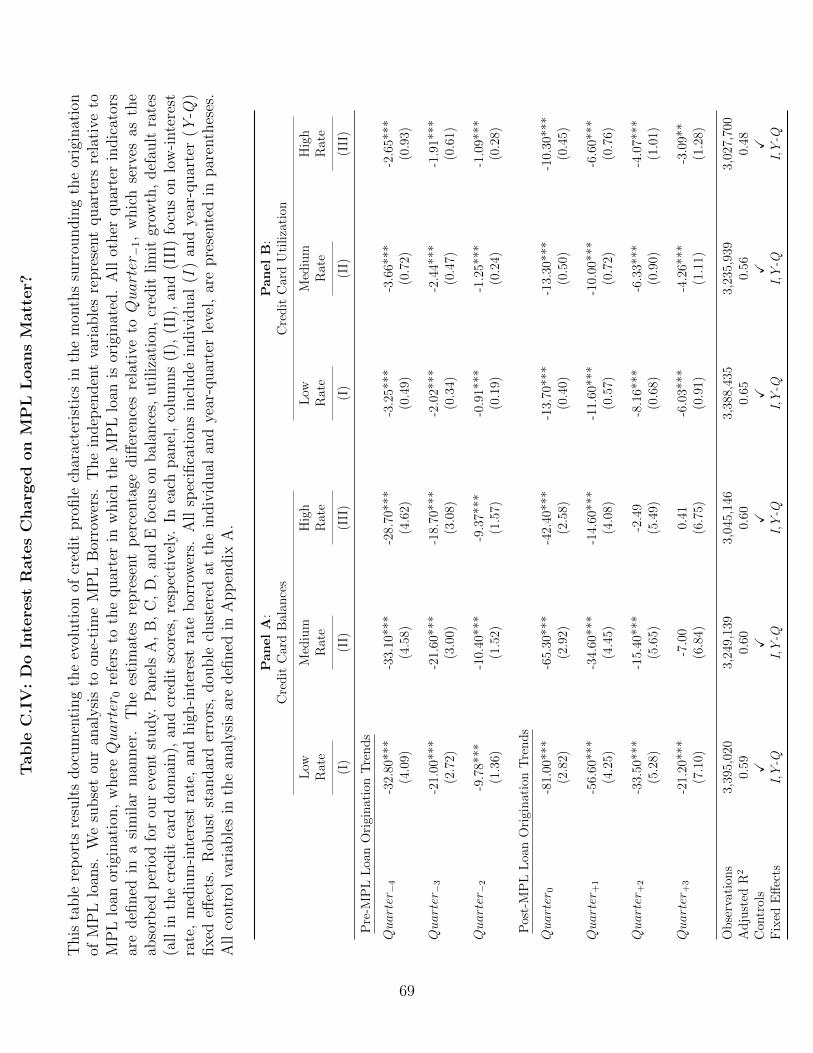
Table
C.I
V:
Do
Inte
rest
Rate
sC
harg
ed
on
MP
LL
oans
Matt
er?
This
table
rep
orts
resu
lts
docu
men
ting
the
evol
uti
onof
cred
itpro
file
char
acte
rist
ics
inth
em
onth
ssu
rrou
ndin
gth
eor
igin
atio
nof
MP
Llo
ans.
We
subse
tou
ran
alysi
sto
one-
tim
eM
PL
Bor
row
ers.
The
indep
enden
tva
riab
les
repre
sent
quar
ters
rela
tive
toM
PL
loan
orig
inat
ion,
wher
eQuarter
0re
fers
toth
equar
ter
inw
hic
hth
eM
PL
loan
isor
igin
ated
.A
llot
her
quar
ter
indic
ator
sar
edefi
ned
ina
sim
ilar
man
ner
.T
he
esti
mat
esre
pre
sent
per
centa
gediff
eren
ces
rela
tive
toQuarter−1,
whic
hse
rves
asth
eab
sorb
edp
erio
dfo
rou
rev
ent
study.
Pan
els
A,
B,
C,
D,
and
Efo
cus
onbal
ance
s,uti
liza
tion
,cr
edit
lim
itgr
owth
,def
ault
rate
s(a
llin
the
cred
itca
rddom
ain),
and
cred
itsc
ores
,re
spec
tive
ly.
Inea
chpan
el,
colu
mns
(I),
(II)
,an
d(I
II)
focu
son
low
-inte
rest
rate
,m
ediu
m-i
nte
rest
rate
,an
dhig
h-i
nte
rest
rate
bor
row
ers.
All
spec
ifica
tion
sin
clude
indiv
idual
(I)
and
year
-quar
ter
(Y-Q
)fixed
effec
ts.
Rob
ust
stan
dar
der
rors
,dou
ble
clust
ered
atth
ein
div
idual
and
year
-quar
ter
leve
l,ar
epre
sente
din
par
enth
eses
.A
llco
ntr
olva
riab
les
inth
ean
alysi
sar
edefi
ned
inA
pp
endix
A.
Pan
el
A:
Pan
el
B:
Cre
dit
Car
dB
alan
ces
Cre
dit
Car
dU
tiliza
tion
Low
Med
ium
Hig
hL
owM
ediu
mH
igh
Rat
eR
ate
Rat
eR
ate
Rat
eR
ate
(I)
(II)
(III
)(I
)(I
I)(I
II)
Pre
-MP
LL
oan
Ori
ginat
ion
Tre
nds
Quarter−4
-32.
80**
*-3
3.10
***
-28.
70**
*-3
.25*
**-3
.66*
**-2
.65*
**(4
.09)
(4.5
8)(4
.62)
(0.4
9)(0
.72)
(0.9
3)
Quarter−3
-21.
00**
*-2
1.60
***
-18.
70**
*-2
.02*
**-2
.44*
**-1
.91*
**(2
.72)
(3.0
0)(3
.08)
(0.3
4)(0
.47)
(0.6
1)
Quarter−2
-9.7
8***
-10.
40**
*-9
.37*
**-0
.91*
**-1
.25*
**-1
.09*
**(1
.36)
(1.5
2)(1
.57)
(0.1
9)(0
.24)
(0.2
8)
Pos
t-M
PL
Loa
nO
rigi
nat
ion
Tre
nds
Quarter
0-8
1.00
***
-65.
30**
*-4
2.40
***
-13.
70**
*-1
3.30
***
-10.
30**
*(2
.82)
(2.9
2)(2
.58)
(0.4
0)(0
.50)
(0.4
5)
Quarter
+1
-56.
60**
*-3
4.60
***
-14.
60**
*-1
1.60
***
-10.
00**
*-6
.60*
**(4
.25)
(4.4
5)(4
.08)
(0.5
7)(0
.72)
(0.7
6)
Quarter
+2
-33.
50**
*-1
5.40
***
-2.4
9-8
.16*
**-6
.33*
**-4
.07*
**(5
.28)
(5.6
5)(5
.49)
(0.6
8)(0
.90)
(1.0
1)
Quarter
+3
-21.
20**
*-7
.00
0.41
-6.0
3***
-4.2
6***
-3.0
9**
(7.1
0)(6
.84)
(6.7
5)(0
.91)
(1.1
1)(1
.28)
Obse
rvat
ions
3,39
5,02
03,
249,
139
3,04
5,14
63,
388,
435
3,23
5,93
93,
027,
700
Adju
sted
R2
0.59
0.60
0.60
0.65
0.56
0.48
Con
trol
sX
XX
XX
XF
ixed
Eff
ects
I,Y
-QI,
Y-Q
I,Y
-QI,
Y-Q
I,Y
-QI,
Y-Q
69
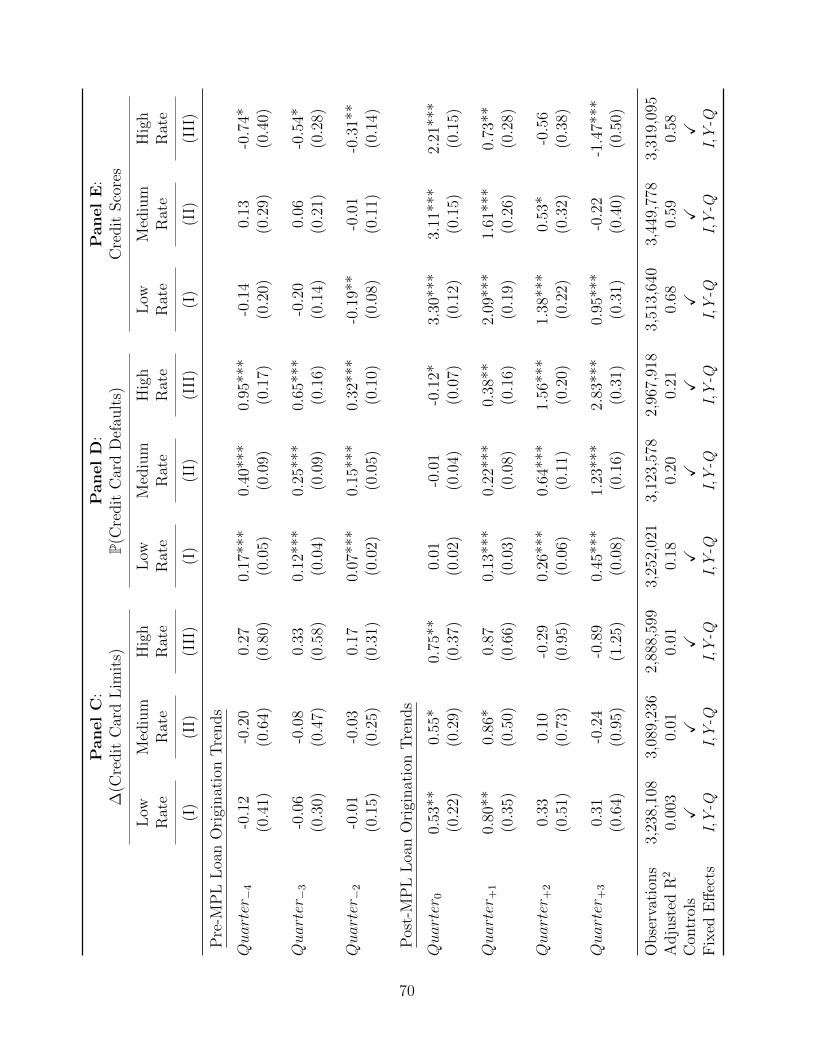
Pan
el
C:
Pan
el
D:
Pan
el
E:
∆(C
redit
Car
dL
imit
s)P(
Cre
dit
Car
dD
efau
lts)
Cre
dit
Sco
res
Low
Med
ium
Hig
hL
owM
ediu
mH
igh
Low
Med
ium
Hig
hR
ate
Rat
eR
ate
Rat
eR
ate
Rat
eR
ate
Rat
eR
ate
(I)
(II)
(III
)(I
)(I
I)(I
II)
(I)
(II)
(III
)
Pre
-MP
LL
oan
Ori
ginat
ion
Tre
nds
Quarter−4
-0.1
2-0
.20
0.27
0.17
***
0.40
***
0.95
***
-0.1
40.
13-0
.74*
(0.4
1)(0
.64)
(0.8
0)(0
.05)
(0.0
9)(0
.17)
(0.2
0)(0
.29)
(0.4
0)
Quarter−3
-0.0
6-0
.08
0.33
0.12
***
0.25
***
0.65
***
-0.2
00.
06-0
.54*
(0.3
0)(0
.47)
(0.5
8)(0
.04)
(0.0
9)(0
.16)
(0.1
4)(0
.21)
(0.2
8)
Quarter−2
-0.0
1-0
.03
0.17
0.07
***
0.15
***
0.32
***
-0.1
9**
-0.0
1-0
.31*
*(0
.15)
(0.2
5)(0
.31)
(0.0
2)(0
.05)
(0.1
0)(0
.08)
(0.1
1)(0
.14)
Pos
t-M
PL
Loa
nO
rigi
nat
ion
Tre
nds
Quarter
00.
53**
0.55
*0.
75**
0.01
-0.0
1-0
.12*
3.30
***
3.11
***
2.21
***
(0.2
2)(0
.29)
(0.3
7)(0
.02)
(0.0
4)(0
.07)
(0.1
2)(0
.15)
(0.1
5)
Quarter
+1
0.80
**0.
86*
0.87
0.13
***
0.22
***
0.38
**2.
09**
*1.
61**
*0.
73**
(0.3
5)(0
.50)
(0.6
6)(0
.03)
(0.0
8)(0
.16)
(0.1
9)(0
.26)
(0.2
8)
Quarter
+2
0.33
0.10
-0.2
90.
26**
*0.
64**
*1.
56**
*1.
38**
*0.
53*
-0.5
6(0
.51)
(0.7
3)(0
.95)
(0.0
6)(0
.11)
(0.2
0)(0
.22)
(0.3
2)(0
.38)
Quarter
+3
0.31
-0.2
4-0
.89
0.45
***
1.23
***
2.83
***
0.95
***
-0.2
2-1
.47*
**(0
.64)
(0.9
5)(1
.25)
(0.0
8)(0
.16)
(0.3
1)(0
.31)
(0.4
0)(0
.50)
Obse
rvat
ions
3,23
8,10
83,
089,
236
2,88
8,59
93,
252,
021
3,12
3,57
82,
967,
918
3,51
3,64
03,
449,
778
3,31
9,09
5A
dju
sted
R2
0.00
30.
010.
010.
180.
200.
210.
680.
590.
58C
ontr
ols
XX
XX
XX
XX
XF
ixed
Eff
ects
I,Y
-QI,
Y-Q
I,Y
-QI,
Y-Q
I,Y
-QI,
Y-Q
I,Y
-QI,
Y-Q
I,Y
-Q
70
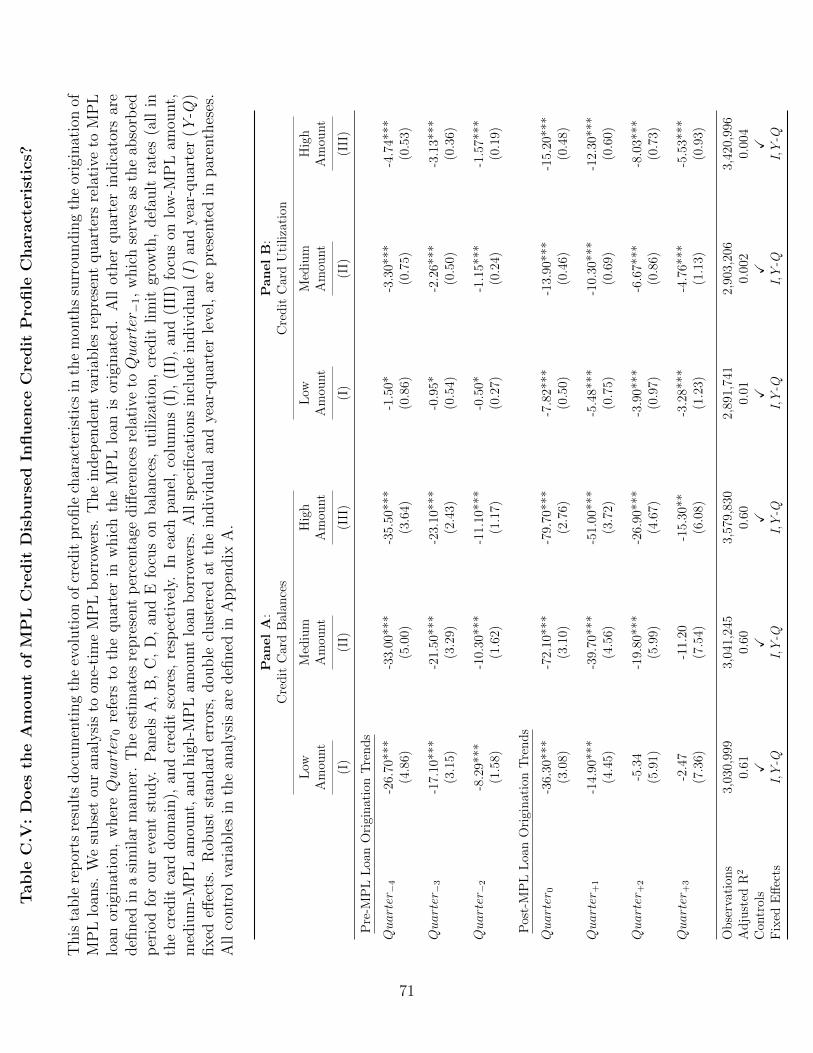
Table
C.V
:D
oes
the
Am
ount
of
MP
LC
redit
Dis
burs
ed
Influence
Cre
dit
Pro
file
Chara
cteri
stic
s?
This
table
rep
orts
resu
lts
docu
men
ting
the
evol
uti
onof
cred
itpro
file
char
acte
rist
ics
inth
em
onth
ssu
rrou
ndin
gth
eor
igin
atio
nof
MP
Llo
ans.
We
subse
tou
ran
alysi
sto
one-
tim
eM
PL
bor
row
ers.
The
indep
enden
tva
riab
les
repre
sent
quar
ters
rela
tive
toM
PL
loan
orig
inat
ion,
wher
eQuarter
0re
fers
toth
equar
ter
inw
hic
hth
eM
PL
loan
isor
igin
ated
.A
llot
her
quar
ter
indic
ator
sar
edefi
ned
ina
sim
ilar
man
ner
.T
he
esti
mat
esre
pre
sent
per
centa
gediff
eren
ces
rela
tive
toQuarter−1,
whic
hse
rves
asth
eab
sorb
edp
erio
dfo
rou
rev
ent
study.
Pan
els
A,
B,
C,
D,
and
Efo
cus
onbal
ance
s,uti
liza
tion
,cr
edit
lim
itgr
owth
,def
ault
rate
s(a
llin
the
cred
itca
rddom
ain),
and
cred
itsc
ores
,re
spec
tive
ly.
Inea
chpan
el,
colu
mns
(I),
(II)
,an
d(I
II)
focu
son
low
-MP
Lam
ount,
med
ium
-MP
Lam
ount,
and
hig
h-M
PL
amou
nt
loan
bor
row
ers.
All
spec
ifica
tion
sin
clude
indiv
idual
(I)
and
year
-quar
ter
(Y-Q
)fixed
effec
ts.
Rob
ust
stan
dar
der
rors
,dou
ble
clust
ered
atth
ein
div
idual
and
year
-quar
ter
leve
l,ar
epre
sente
din
par
enth
eses
.A
llco
ntr
olva
riab
les
inth
ean
alysi
sar
edefi
ned
inA
pp
endix
A.
Pan
el
A:
Pan
el
B:
Cre
dit
Car
dB
alan
ces
Cre
dit
Car
dU
tiliza
tion
Low
Med
ium
Hig
hL
owM
ediu
mH
igh
Am
ount
Am
ount
Am
ount
Am
ount
Am
ount
Am
ount
(I)
(II)
(III
)(I
)(I
I)(I
II)
Pre
-MP
LL
oan
Ori
ginat
ion
Tre
nds
Quarter−4
-26.
70**
*-3
3.00
***
-35.
50**
*-1
.50*
-3.3
0***
-4.7
4***
(4.8
6)(5
.00)
(3.6
4)(0
.86)
(0.7
5)(0
.53)
Quarter−3
-17.
10**
*-2
1.50
***
-23.
10**
*-0
.95*
-2.2
6***
-3.1
3***
(3.1
5)(3
.29)
(2.4
3)(0
.54)
(0.5
0)(0
.36)
Quarter−2
-8.2
9***
-10.
30**
*-1
1.10
***
-0.5
0*-1
.15*
**-1
.57*
**(1
.58)
(1.6
2)(1
.17)
(0.2
7)(0
.24)
(0.1
9)
Pos
t-M
PL
Loa
nO
rigi
nat
ion
Tre
nds
Quarter
0-3
6.30
***
-72.
10**
*-7
9.70
***
-7.8
2***
-13.
90**
*-1
5.20
***
(3.0
8)(3
.10)
(2.7
6)(0
.50)
(0.4
6)(0
.48)
Quarter
+1
-14.
90**
*-3
9.70
***
-51.
00**
*-5
.48*
**-1
0.30
***
-12.
30**
*(4
.45)
(4.5
6)(3
.72)
(0.7
5)(0
.69)
(0.6
0)
Quarter
+2
-5.3
4-1
9.80
***
-26.
90**
*-3
.90*
**-6
.67*
**-8
.03*
**(5
.91)
(5.9
9)(4
.67)
(0.9
7)(0
.86)
(0.7
3)
Quarter
+3
-2.4
7-1
1.20
-15.
30**
-3.2
8***
-4.7
6***
-5.5
3***
(7.3
6)(7
.54)
(6.0
8)(1
.23)
(1.1
3)(0
.93)
Obse
rvat
ions
3,03
0,99
93,
041,
245
3,57
9,83
02,
891,
741
2,90
3,20
63,
420,
996
Adju
sted
R2
0.61
0.60
0.60
0.01
0.00
20.
004
Con
trol
sX
XX
XX
XF
ixed
Eff
ects
I,Y
-QI,
Y-Q
I,Y
-QI,
Y-Q
I,Y
-QI,
Y-Q
71
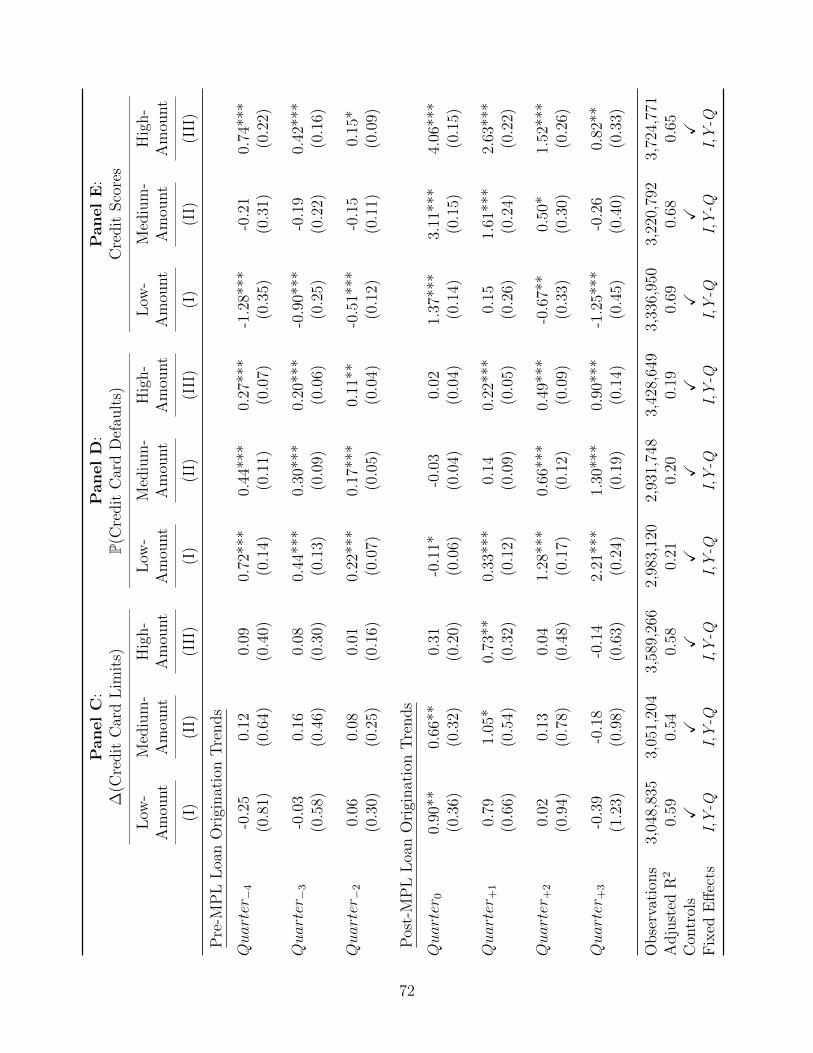
Pan
el
C:
Pan
el
D:
Pan
el
E:
∆(C
redit
Car
dL
imit
s)P(
Cre
dit
Car
dD
efau
lts)
Cre
dit
Sco
res
Low
-M
ediu
m-
Hig
h-
Low
-M
ediu
m-
Hig
h-
Low
-M
ediu
m-
Hig
h-
Am
ount
Am
ount
Am
ount
Am
ount
Am
ount
Am
ount
Am
ount
Am
ount
Am
ount
(I)
(II)
(III
)(I
)(I
I)(I
II)
(I)
(II)
(III
)
Pre
-MP
LL
oan
Ori
ginat
ion
Tre
nds
Quarter−4
-0.2
50.
120.
090.
72**
*0.
44**
*0.
27**
*-1
.28*
**-0
.21
0.74
***
(0.8
1)(0
.64)
(0.4
0)(0
.14)
(0.1
1)(0
.07)
(0.3
5)(0
.31)
(0.2
2)
Quarter−3
-0.0
30.
160.
080.
44**
*0.
30**
*0.
20**
*-0
.90*
**-0
.19
0.42
***
(0.5
8)(0
.46)
(0.3
0)(0
.13)
(0.0
9)(0
.06)
(0.2
5)(0
.22)
(0.1
6)
Quarter−2
0.06
0.08
0.01
0.22
***
0.17
***
0.11
**-0
.51*
**-0
.15
0.15
*(0
.30)
(0.2
5)(0
.16)
(0.0
7)(0
.05)
(0.0
4)(0
.12)
(0.1
1)(0
.09)
Pos
t-M
PL
Loa
nO
rigi
nat
ion
Tre
nds
Quarter
00.
90**
0.66
**0.
31-0
.11*
-0.0
30.
021.
37**
*3.
11**
*4.
06**
*(0
.36)
(0.3
2)(0
.20)
(0.0
6)(0
.04)
(0.0
4)(0
.14)
(0.1
5)(0
.15)
Quarter
+1
0.79
1.05
*0.
73**
0.33
***
0.14
0.22
***
0.15
1.61
***
2.63
***
(0.6
6)(0
.54)
(0.3
2)(0
.12)
(0.0
9)(0
.05)
(0.2
6)(0
.24)
(0.2
2)
Quarter
+2
0.02
0.13
0.04
1.28
***
0.66
***
0.49
***
-0.6
7**
0.50
*1.
52**
*(0
.94)
(0.7
8)(0
.48)
(0.1
7)(0
.12)
(0.0
9)(0
.33)
(0.3
0)(0
.26)
Quarter
+3
-0.3
9-0
.18
-0.1
42.
21**
*1.
30**
*0.
90**
*-1
.25*
**-0
.26
0.82
**(1
.23)
(0.9
8)(0
.63)
(0.2
4)(0
.19)
(0.1
4)(0
.45)
(0.4
0)(0
.33)
Obse
rvat
ions
3,04
8,83
53,
051,
204
3,58
9,26
62,
983,
120
2,93
1,74
83,
428,
649
3,33
6,95
03,
220,
792
3,72
4,77
1A
dju
sted
R2
0.59
0.54
0.58
0.21
0.20
0.19
0.69
0.68
0.65
Con
trol
sX
XX
XX
XX
XX
Fix
edE
ffec
tsI,
Y-Q
I,Y
-QI,
Y-Q
I,Y
-QI,
Y-Q
I,Y
-QI,
Y-Q
I,Y
-QI,
Y-Q
72