Winners and Losers in the Liberalized Energy Retail Sector ... · Winners and Losers in the...
23
Winners and Losers in the Liberalized Energy Retail Sector in Hungary: A Co-evolutionary Approach Felsmann, Balázs Assistant Research Fellow, Head of the research centre of strategic and international management E-mail: [email protected] Corvinus University of Budapest Manuscript was publishe d in journal Theory, Methodology, Practice Vol. 10 Number 2 December 2014. pp. 25-36. Available online: http://tmp.gtk.uni-miskolc.hu/index.php?i=2150 Abstract This paper examines the recent history of the Hungarian energy trading market in a co-evolutionary framework. Hungary is characterized by a mixed ownership structure with mainly multinational incumbents in energy retail and distribution, while the wholesale is dominantly owned by state-owned companies. The legal framework also has dual characteristics, with free-market regulation for industrial consumers and a regulated price regime for households. Our research method follows a longitudinal approach from the period of market liberalization in 2008 until 2013. We identified strong relationship between the individual and sector performance of the trading companies and the current political ideology and institutional regime. JIBS Keywords: Business/Government Interaction and Relations, Institutional trajectories, Market liberalization, Energy, Central and Eastern Europe JEL codes: L98, L220
-
Upload
truongkiet -
Category
Documents
-
view
216 -
download
0
Transcript of Winners and Losers in the Liberalized Energy Retail Sector ... · Winners and Losers in the...

Winners and Losers in the Liberalized Energy Retail Sector in Hungary:
A Co-evolutionary Approach
Felsmann, Balázs
Assistant Research Fellow, Head of the research centre of strategic and international management
E-mail: [email protected]
Corvinus University of Budapest
Manuscript was published in journal Theory, Methodology, Practice Vol. 10 Number 2 December
2014. pp. 25-36. Available online: http://tmp.gtk.uni-miskolc.hu/index.php?i=2150
Abstract
This paper examines the recent history of the Hungarian energy trading market in a co-evolutionary
framework. Hungary is characterized by a mixed ownership structure with mainly multinational
incumbents in energy retail and distribution, while the wholesale is dominantly owned by state-owned
companies. The legal framework also has dual characteristics, with free-market regulation for
industrial consumers and a regulated price regime for households. Our research method follows a
longitudinal approach from the period of market liberalization in 2008 until 2013. We identified strong
relationship between the individual and sector performance of the trading companies and the current
political ideology and institutional regime.
JIBS Keywords: Business/Government Interaction and Relations, Institutional trajectories,
Market liberalization, Energy, Central and Eastern Europe
JEL codes: L98, L220

2
Introduction
Companies are in permanent interaction with their environment on macro, meso (industrial) and micro
levels. The two – possibly most influential – strategic management schools of the last decades,
Michael Porter’s competitive strategy concept (Porter, 1980) and the resource based view (RBV) of
the firm (Barney & Arikan, 2001; Grant, 2008; Lockett et al., 2009; Priem & Butler, 2001), differ in
the attention given to the main determinants of the firm performance. Porter follows the structure-
conduct-performance model of industrial organization theory and identifies the main factors of the
economic performance of the firm ‘outside the gates’, in its industrial structure. The RBV argues that
the differences in performance tend to be explained by the differences in resource endowments. It
emphasizes the importance of unique, difficult-to-imitate resources in sustaining performance (Rumelt
et al., 1991). Volberda & Lewin (2003) draw attention to the different scopes of firm-level and meso-
level theories in relation to strategic adaptation and selection. The first group of theories (RBV,
Behavioral Theory of the Firm, Learning Theories) are concerned with capabilities and strategies for
adaptation and survival on the firm level and pay limited attention to population-level adaptation.
Contrary, the meso-level theories (Transaction Cost Theory, IO, Institutional Theory, Evolutionary
Economics) provide a theoretical foundation for linking firm adaptation to the macro institutional and
competitive environment and ignore the firm-level micro adaptation.
The notion of strategic fit (Grant, 2008) creates a connection between the industrial competitive arena
and the organisational factors. The successful strategy must be consistent with the firm’s external
environment and also with its internal environment (values, goals, resources and capabilities, structure
and systems). Birkinshaw et al. (2004) distinguish the external and internal competitive forces of the
multinational company’s (MNC) subsidiary performance. The MNC subsidiary simultaneously
competes in the external competitive arena, which contains the customers, suppliers and competitors
of the local marketplace and in the internal competitive arena for the customers and with the other
competing entities that are part of the same MNC.
Although a large number of books and articles have examined the interconnection between the internal
and external forces in a competitive market situation, there is a limited focus on the role of active
3
mutual interactions between institutional environment and company performance. However, firms in a
highly institutionalized environment tend to behave more actively in formulating the playing field,
rather than simply passively adapt to the changes in the external institutional environment. Firms
compete not only within the marketplace, but also in the political arena by manipulating the laws,
regulations and governing institutions (Henisz & Zelner, 2005). Governments also tend to move from
the role of passive guardians of the rules to more active participation in the market game (Child et al.,
2012).
The theoretical concept of co-evolution focuses on the mutual influence and impacts of the
organizational and environmental factors on corporate adaptation and selection mechanisms. The
general meaning of the expression reflects the situation when two or more populations can causally
influence each other's evolution (Hannon et al., 2013). Corporate co-evolution is concerned with the
ways in which firms and their environments develop interactively over time (Rodrigues and Child,
2003).
In the current paper we analyze the recent history of the Hungarian energy trading market in a co-
evolutionary framework on the macro, meso and micro level and look for the recipe of business
success over past years of turbulence. The Hungarian energy industry provides an opportune case to
analyze the interactions between firms and governmental and social institutions. Firstly the
privatization of the Hungarian energy sector in the middle of the 1990s radically changed the
ownership structure of the industry. The former state-owned monolithic structure was divided into two
subsystems. The integrated retail companies (including the distribution system operator (DSO) units
and the household and industrial retail units) were privatized and with the exception of one company
(the Budapest based natural gas retailer FŐGÁZ) transferred to major multinational energy companies
like E.ON, EdF, RWE, ENI and GdF. From the time of privatization in the middle of the 1990s these
local retailer and energy distributor firms operated as MNC subsidiaries. In contrast, state control was
maintained over wholesale activity. The state owned company MVM had a privileged position to
distribute power from the contracted state-owned and private power plants, through long term power-
purchase agreements (PPAs). Secondly, Hungarian accession to the EU in 2004 required major
changes in the legal framework. Hungary partially opened its closed electricity and natural gas trading

4
market to medium and large industrial consumers in 2003. The share of the free market segment
achieved more than 35% of the electricity market for 2006 as a result of the increased competition.
The growing rivalry was partly due to the competition between the incumbent MNEs for the industrial
consumers and partly due to new entrants with strong regional industrial background, such as CEZ and
MOL. Following EU legislation, Hungary broke down all legal barriers for free market trading from
2008 (from 2009 in the case of natural gas) and legally opened also the household market segment to
the free-market traders. Hungary also had to terminate the long term power purchase agreements
(PPAs) between MVM and the major power plants, after the European Commission has requested the
Hungarian state to end these contacts because they constituted unlawful and incompatible state aid to
the power generators (EC, 2008). Commission declared that around two third of the electricity
generated in Hungary was sold under PPAs and these contracts could restrict competition because they
close off a significant part of the market from new entrants. The termination of the PPAs and the
changes in the institutional framework gave new opportunities for entry on the trading market for
industrial companies and also from complementary industries, like the telecommunication sector. Last
but not least, the case of the Hungarian energy trading sector also gives a great opportunity to analyze
the impacts of the deteriorating macroeconomic conditions caused by the economic crisis from late
2008 on governmental policies, actions and institutional regime. This case gives a remarkable
research field to illustrate how macroeconomic problems have influenced the political actors to change
the dominant socioeconomic ideology and sector policies.
The theoretical framework of co-evolution
There are several studies on the theory of co-evolution. Volberda and Lewin (2003) introduced the
notion to analyze the process of the firm-level adaptation and population level selection. They explain
that co-evolutionary changes in micro and/or macro level are not simple outcomes of adaptation or
environmental selection but rather the mixed result of managerial intentionality and environmental
effects. Rodrigues and Child (2003) extended the scope of co-evolutionary perspective from the
competitive industries to a highly institutionalized environment. They followed both a deductive and

5
inductive method to formulate a relevant research framework for a public infrastructure organisation.
The main focus of their model is the two-side, mutual impacts of performance, processes, objectives
and structural forms on the macro, meso and micro level. In the authors’ interpretation, co-evolution is
the two-way interaction between the meso (industrial) and micro (firm-level) factors. The performance
of an industry has a strong impact on the performance of the individual firms. However, the company
also can influence the sector conditions, mainly if it has a dominant market position or leading role in
innovation. The sector performance also has impacts on the overall performance of the economy.
There is a strong pressure on political actors to make changes in the political regime by modifying the
dominant socioeconomic ideology and policies for underperforming macroeconomic indicators. The
changes in the institutional regime in combination with exogenous factors like technology and new
entrants have strong effects on sector business models. The modification in the business model has a
feedback on the sector performance through changing objectives and competitive and/or political
sector dynamics. Moving to firm-level impacts, there is an evident two-way causal relationship
between organizational performance and sector performance. The organizational processes and
objectives also interact with sector dynamics. Targets, norms and objectives typifying the sector have
a co-evolutionary interaction with the firm-level objectives, just as the sector dynamics interconnects
with the organizational processes.
Foxon (2011) in his pentagonal model framework combines the socio-technical and techno-economic
transition and the co-evolutionary approaches. The five key co-evolving systems in his framework are
the ecosystems, technologies, institutions, business strategies and user practices. Hannon et al. (2013)
partially modified the original model of Foxon, replacing the dimension of business strategy with the
business model and moving it to the middle of the framework (Figure 1).

6
Figure 1 - The co-evolutionary relationship between business models
and the wider socio-technical system (Hannon et al., 2013)
Hannon et al. (2013) apply the business model canvas of Osterwalder & Pigneur (2010) to represent in
detail the main characteristics of the sector concerned in their empirical study on the co-evolutionary
interactions between the UK energy service companies and the traditional energy utilities. The authors
distinguish the incumbent players’ business models from the newcomers’ models and identify that the
incumbents typically wield more economic and political power compared to the non-incumbent or
niche populations of firms.
The current paper follows the methodology of Hannon et al. (2013) with minor changes in focus.
Because of the limited empirical data on firm-level internal organizational characteristics, we
concentrate on three elements of the business models – the customer segments, the key
suppliers/partners and the cost structure – and give less attention to the other elements of the canvas.
We also give different emphasis to the four external dimensions of the co-evolutionary framework.
Although we present some illustrations on the interactions between the ecosystems, technology, user
practices and business models, this study focuses more on the two-way relationship between the
institutions and business practices. The co-evolutionary framework of Rodrigues and Child (2003) and
Child et al. (2012) promotes deeper reflection on the political perspective of co-evolution.
Methodology and scope of analysis
This paper follows the deductive-inductive approach of numerous articles of co-evolutionary literature
(Rodrigues and Child, 2003; Suhomlinova, 2006; Wilson & Hynes 2009; Child et al., 2012; Hannon et
al., 2013). Our empirical research has a longitudinal focus. The study concentrates on the changes of
the Hungarian energy retail sector from the time of liberalization of the whole market in 2008 until
7
2013. We used secondary sources such as company yearly reports, articles, press releases, legal
documents and industrial surveys. Active personal involvement in several industrial organisations,
industry events and conferences also helped us to collect background information from company
managers, regulators and state officials through informal discussions.
The main purpose of the quantitative analysis was to better understand the differences in performance
influenced by different business models and environmental factors of the focal firms. We collected
company specific information and performance data of 22 major trading firms of the energy sector
from 2008 until 2013. The set of variables includes the industrial activity focus (electricity and/or
natural gas), retail market segments served (universal services and/or free-market trading), ownership
structure (foreign/local incumbent or foreign/local free-market trader), key operational revenue and
cost figures (cost of goods sold, staff costs), and balance sheet items (fixed assets, invested capital,
accounts payables, account receivables). We calculated operational efficiency indicators, companies’
equity, short and long term debt to measure the companies’ leverage and dividend and taxes paid, to
measure the financial transfers between the firm and other key stakeholders, like the state and the
shareholders. Appendix 1 shows the extract of the dataset.
The firm level data were collected from the official website of the Company Information and
Electronic Registration Service Office of the Ministry of Justice, where all companies registered in
Hungary compulsorily have to upload their yearly reports (profit and loss statements, balance sheet
and notes).The financial figures of the 22 companies concerned properly represent the whole sector
with the following minor limitations: (1) There are several international energy trading companies
which manage their Hungarian commercial operation through local representative offices without
establishing affiliates under the Hungarian corporate law. The non-Hungarian registered firms have a
limited licence for energy trading operation without providing any retail services in the country.
These companies do not publish their yearly report on the official Hungarian site. (2) The retail
activity of the power plant companies also was excluded from the analysis. Although legally it is
possible to sell their production directly to consumers without using intermediate traders, this is an
uncommon activity. (3) The total energy trading volume in Hungary achieved 221 terawatt hours for
electricity and 13.2 billion cubic meters in the natural gas sector based on 2013 figures of the
8
Hungarian Energy and Public Utility Regulatory Authority. The total revenue of the electricity and gas
trading sector was approximately 15.5 billion euro, while the revenue of the 22 firms of our dataset
achieved 8.6 billion euro (55% of the total) in the same period. As we included all locally registered
energy trading firms with yearly revenue over 3 million euro in the dataset, the difference can be
explained mostly by the international trading activity of the non-Hungarian registered firms. Taking
into consideration the impacts of the abovementioned limitations, we can state with high confidence
that our dataset represents the overwhelming majority of the Hungarian energy retail market.
We made some corrections of the raw financial data for better comparison. There are different
organizational structures of the firms concerned. The majority of the companies operate the trading
business unit in a legally separated affiliate, while several others combine the commercial activity with
investment activities in an operating holding structure. The typical investment of the former
incumbents is the direct ownership of the DSO’s shares. The vast majority of the incumbent traders
(ELMŰ-ÉMÁSZ, FŐGÁZ, GDF, TIGÁZ, EDF-DÉMÁSZ) also own the shares of their group’s DSO,
except E.ON, which made a full legal separation and organized all of its Hungarian subsidiaries into a
strategic holding form. There are some other examples of a mixed activity profile, when free-market
traders own shares in production units (ALTEO, Greenergy). To ensure the comparability of the
commercial activities of our sample, we corrected the balance sheets and profit and loss (P&L)
statements of the firms by deducting the book value of the non-trading investments from the non-
current assets and deducting the same amount from the capital reserves on the liabilities side. We
deducted the financial income (dividends) from the owned DSOs or production units from the raw
P&L figures. We used the modified fixed assets, equity and financial income figures in our reports.
Appendix 2 demonstrates the statistical relationship between the main variables involved in the
analysis, and presents the bivariate correlations and reliability coefficients.
The results of the quantitative analysis: impacts of the changing environment on the
economic performance of the sector firms
The firms’ economic performance figures reflect the complex interactions between the factors of the
co-evolutionary framework. Table 1 presents the financial indicators of the sector firms for the last

9
four years of operation. The table shows the average equity, earnings, taxes and dividends figures of
the four main clusters of the energy trading firms we have identified: (1) domestic incumbents, (2)
domestic new entrants, (3) foreign incumbents and (4) foreign new entrants. The two companies in the
domestic incumbent group (Group1) were fully or partially under state (MVM) or municipality
(FŐGÁZ) control over the whole research period. Due to the changing political climate there was
significant improvement in the financial performance of the state-controlled firms against that of the
incumbent MNEs in 2012. This was the year when the rules of the game radically changed and the
government began to execute its new policy on household energy price reduction and began to
increase direct ownership in the retail sector. The overall operational earnings of the incumbent MNEs
radically decreased from the level of 2 billion HUF in 2011 to -37 billion in 2012. In contrast, the state
controlled firms, mainly MVM, increased their profit from 21 to 39 billion in the same period.
Table 1 – Key financial figures of the domestic and foreign-owned energy trading companies
all data in million HUF Group*;** 2010 2011 2012 2013
Average level of corrected equity
1 16 927 16 884 25 926 16 874
2 559 1 113 618 1 047
3 7 406 15 770 4 766 -627
4 319 462 317 -1 328
Average level of earnings before interest and taxes
(EBIT)
1 9 524 10 843 19 617 679
2 719 1 132 2 299 431
3 2 432 -226 -5 304 -2 252
4 1 926 1 269 866 -698
Average level of corporate tax
1 3 001 2 070 4 280 1 181
2 235 113 231 251
3 719 275 187 443
4 34 56 28 36
Average level of dividend paid
1 10 172 10 971 14 950 855
2 813 1 394 7 606 252
3 4 755 7 107 3 578 10 490
4 45 177 126 8
* Group1 = domestic incumbents; Group2 = domestic new entrants; Group3 = foreign
incumbents; Group4 = foreign new entrants
** Number of firms in groups: In 2010 Group1 n=2, Group2 n=6; Group3 n=7; Group4 n=2. From 2011 Group1 n=2, Group2 n=8; Group3 n=7; Group4 n=5.
We can observe similar changes in the free-market segment between the local and foreign entities. The
local companies were able to increase their average profit while the foreign-based traders were faced
with decreasing profitability. The changes in the free-market segment are mainly attributable to the
success of a newly founded company, MET. Although officially this company has foreign ultimate
owners, we reclassified it as a locally-controlled firms. The majority of the shares of the MET’s Swiss
based mother-company are owned by several offshore firms, while 40% of the shares are controlled by

10
the Hungarian oil and gas giant MOL. The main factor behind the success of MET can be explained
by an exclusive bilateral contract signed with MVM without public tender about importing natural gas
on the Austrian-Hungarian interconnecting pipeline by transferring the special import capacity right of
MVM to MET. While MET achieved only 44 billion revenue in 2010, the company realized 280
billion in 2012 and paid 60 billion in dividends to its owners, 2.5 times more than the overall
dividends paid by the whole group of foreign incumbents in the same year.
Whereas the governmental ‘restructuring’ of the playing field resulted in positive income for the
‘preferred entities’ and simultaneously served well the changing socio-economic environment, there
are several question marks regarding the long term sustainability of the new system. Figure 2 and
Figure 3 illustrate the dynamic changes in profit and equity position of the sector companies. It is easy
to observe that 2012 was the year of the great successes of the domestic players. The three major local
players (MVM, FŐGÁZ and MET) realized significantly higher profits than in the previous period. In
contrast, all incumbent multinationals – E.ON, EDF, GDF, RWE GROUP (ELMŰ, ÉMÁSZ and
MÁSZ), and TIGÁZ (ENI) – faced decreasing profitability and/or worsening equity positions.
Figure 2 – Changes in profitability and equity position of the Hungarian energy trading companies from 2011 to 2012
We can observe significant changes in profit and equity figures in 2013 compared to 2012. However,
it seems from the figures shown in Figure 3 that after the shocking year of 2012 the incumbent MNEs

11
adapted to the new environmental challenges. E.ON and GDF significantly increased the level of their
operating profit, while EDF and RWE increased the level of dividend paid while maintaining their
profitability.
Figure 3 - Changes in profitability and equity position of the Hungarian energy trading companies from 2012 to 2013
The statistical analysis of various variables (see the detailed correlations in Appendix 2) also supports
our observations of the changes in firm-level performance and strategic behaviour. While there is a
relatively strong significant positive correlation between the after tax profit of the firms and the
domestic control dummy variable in 2011 (r=0.431) and 2012 (r=0.457), the strengths of correlation
weakened for 2013 to a moderate level (r=0.247). In contrast, the negative correlation between the
after tax profit and the dummy variable of universal services weakened from a strong and significant
relationship in 2011 (r=-0.415) and 2012 (r=-0.454) to an insignificant moderate negative level in
2013 (r=-0.247). It is also interesting to observe the relationship between the profits of different years.
Generally there is very strong significant positive correlation between the after tax profits of the
upcoming years (r=0.834 between 2010 and 2009). The strength of this relationship continuously
weakened in the observed period (r=0.702 between 2012 and 2011 and r=0.562 between 2013 and
2012), which indicates that the past period profitability has a relatively low influence on the upcoming
economic performance of the firms. The correlation between the dividends of different years and the
12
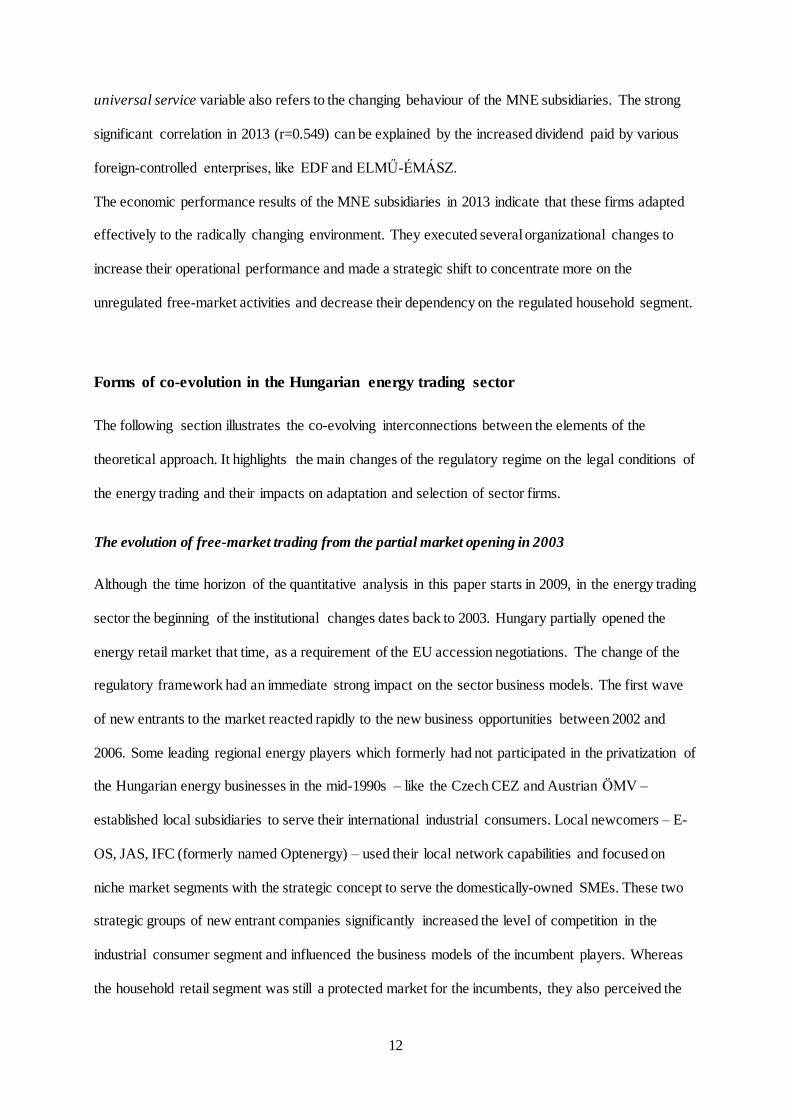
universal service variable also refers to the changing behaviour of the MNE subsidiaries. The strong
significant correlation in 2013 (r=0.549) can be explained by the increased dividend paid by various
foreign-controlled enterprises, like EDF and ELMŰ-ÉMÁSZ.
The economic performance results of the MNE subsidiaries in 2013 indicate that these firms adapted
effectively to the radically changing environment. They executed several organizational changes to
increase their operational performance and made a strategic shift to concentrate more on the
unregulated free-market activities and decrease their dependency on the regulated household segment.
Forms of co-evolution in the Hungarian energy trading sector
The following section illustrates the co-evolving interconnections between the elements of the
theoretical approach. It highlights the main changes of the regulatory regime on the legal conditions of
the energy trading and their impacts on adaptation and selection of sector firms.
The evolution of free-market trading from the partial market opening in 2003
Although the time horizon of the quantitative analysis in this paper starts in 2009, in the energy trading
sector the beginning of the institutional changes dates back to 2003. Hungary partially opened the
energy retail market that time, as a requirement of the EU accession negotiations. The change of the
regulatory framework had an immediate strong impact on the sector business models. The first wave
of new entrants to the market reacted rapidly to the new business opportunities between 2002 and
2006. Some leading regional energy players which formerly had not participated in the privatization of
the Hungarian energy businesses in the mid-1990s – like the Czech CEZ and Austrian ÖMV –
established local subsidiaries to serve their international industrial consumers. Local newcomers – E-
OS, JAS, IFC (formerly named Optenergy) – used their local network capabilities and focused on
niche market segments with the strategic concept to serve the domestically-owned SMEs. These two
strategic groups of new entrant companies significantly increased the level of competition in the
industrial consumer segment and influenced the business models of the incumbent players. Whereas
the household retail segment was still a protected market for the incumbents, they also perceived the
13
need to enhance their capabilities because of the decreasing revenues on the free market. E.ON, GDF,
ELMŰ and ÉMÁSZ reacted to the challenges with organizational transformations. E.ON reorganized
the governing structure of the whole local operations by formulating a strategic holding centre and
separated its retail activities from all other business units. ELMŰ and ÉMÁSZ, both majority-owned
by the German RWE Group, jointly established a new free-market retailer subsidiary company
(MÁSZ) which focused solely on the industrial consumer segment while the two incumbents still
managed the retail services for the non-market entities (households, institutions) through the
traditional way.
Effects of the full market liberalization – years of increasing competition
EU integration abolished the dual market system, as Hungary was obliged to adopt new laws and
regulations for the electricity and natural gas sectors in 2007 and 2008. Whereas theoretically the new
legislative framework broke down the entry barriers on the formerly protected market segments, the
household retail segment of the market remained under strong state pressure. The new model defined
the notion of universal services in harmony with the third energy package of the EU. Generally the
concept of universal service is to ensure eligibility, transparency and non-discriminatory prices to
households and small enterprises and to provide adequate safeguards to protect vulnerable customers
(EC 2009a, 2009b). Despite the fact that the regulated energy prices for households are not necessarily
part of the protection mechanisms of the vulnerable customers, the vast majority of Member States
(including Hungary) still apply regulated price regimes (EC 2014, CEER 2012) for the universal
energy services. The Hungarian model of regulation was relatively soft in the early years of the new
regime, from 2008 until 2011. The ministerial decree on universal services regulated only the
commercial margin of the service providers, while the firms could manage their purchasing portfolio
on their own risks and interests. This type of margin regulation opened a place for new entrants to the
household segment. Magyar Telekom, the local subsidiary of Deutsche Telecom, took advantage of
the opportunity and entered the household and SME energy retail market in 2011. Telekom’s main
motivation behind the diversification was to fortify its leading role in household telecommunication
services. All local mobile operators (Telekom, Telenor and Vodafone) offer bundled services for

14
consumers with packaging of voice and data services in a single offer. It was a logical continuation of
the bundling strategic concept to integrate new non-core services into the ‘bundled services for
households’ model, like retail energy. The pillars of the market-leading telecommunication company’s
entry strategy were the strategic resources and capabilities of the over 4 million customer basis and the
experience in marketing and operations of mass market services. Telekom achieved close to a 5%
market share for 2013, two years after entering the household energy retail sector. However the
growing revenues were not reflected in the operating profit figures. Telekom’s entrance and the
changing legal framework posed a challenge to the incumbents. The RWE Group member companies
ELMŰ and ÉMÁSZ faced the challenges proactively and changed their conservative approaches on
household services. They introduced a new geo-tariff for heat pump users to present their commitment
to the ecological impacts of energy consumption. They also elaborated a free-market trading concept
of an Internet-based commercial service platform for households and implemented this new trading
system in 2013.
From market coordination to centralized bureaucracy
The results of the parliamentary elections in 2010 significantly changed the dominant view of the
political actors on the preferred development paths of the public utility services. The dominant
ideology of liberalization and competition of the former social-liberal majority were replaced with the
ideology of patriotism and centralized control. The new National Energy Strategy (Parliament of
Hungary, 2011) declared the state’s strong commitment to increasing its influence in the electricity
and natural gas sector through increasing direct ownership by taking back various formerly privatized
segments of the sector. MVM, the single state-owned entity on the market, had a key role in execution.
MVM entered the natural gas business by buying the wholesale unit and commercial storage facilities
from E.ON as a first step in early 2013. Simultaneously the Parliament adopted a change in law which
declared that the ownership and operation of security gas storages facilities is an exclusive right of
state-owned entities. MVM continued its acquisition strategy after securing the gas wholesale position
through the modified legal environment. Formerly the company had had no direct interests either in
the electricity or in the natural gas household retail segment. MVM Partner, the group’s retailer,

15
similarly to the non-incumbent newcomers focused only on the more profitable free-market segment
after the 2003 partial sector liberalization. To execute the new strategy influenced by the changing
political environment, MVM bought the 49% minority stake of RWE Group in FŐGÁZ, the Budapest-
based incumbent household gas retailer in 2013. The company also signed a non-binding letter of
intent with E.ON in 2014 on the acquisition of E.ON’s interests in the household retail service field.
The institutional regime supported the expansion of the state-owned market player with several
changes in the legislative framework of household services and through discriminatory application of
the legal rules. The Parliament modified the price regulation rules of the universal services from 2011
by replacing the former margin regulation to a selling price regulation (Vince, 2012). The new full-
price control did not leave an opportunity for the universal service providers to share their
procurement risks with their customers. Although the incumbent retailers suffered great losses on the
universal services, the official communication emphasized that the incumbents would able to balance
their financial income through the profitable operations of the DSOs and the free-market retail units. A
2012 report prepared by the responsible ministry (Index, 2013) stated that the three MNEs (E.ON,
RWE and EDF) involved in electricity universal services had 20 billion forint yearly overall losses in
2011 on universal services, while they achieved 51 billion overall profits on the distribution and free-
market services the same period. The ministry commented that the MNEs are able to achieve a fair
overall profit rate on the corporate level. In fact, the loss reduction of the household services through
cross-financing created significant and growing constraints from the aspect of market competition. The
strong competition on the free-market segment limited the opportunity to mitigate the losses of the
incumbent MNEs on the household retail services through price increases on the free market.
The state authorities also increased the pressure on the MNEs with resolutions, penalties and fines
from various authorities. Although the firms several times won legal proceedings against the
authorities (for example E.ON and FŐGÁZ against the Energy Authority in 2013 in a case on the 2012
energy tariff regulation, ELMŰ and ÉMÁSZ against the Authority of Consumer Protection in 2014 in
a case on the printed form of the energy bills) the political message seemed clear. All of the MNEs
had to realize that only a few rational strategic opportunities were still available for them: (1) to

16
decrease their exposure to the regulated services through selling or offering their investments to the
state entities, (2) optimizing the cash flows of owners (FCFE) by cost reduction, postponement of
investments and increasing the level of dividends, or (3) leaving the Hungarian retail subsidiary in a
permanent underperforming financial situation.
The transactions between E.ON and MVM on the natural gas wholesale unit and storage facilities and
the transaction between RWE and MVM on the minority stake in FŐGÁZ illustrate well the first
potential path of MNE’s adaptation. The second potential way, optimization of the equity holders’
cash flow, is well-characterized in the increased operational efficiency (E.ON, ELMŰ, GDF) and/or
the significantly increased dividends (EDF, ELMŰ, ÉMÁSZ) of MNEs in 2013. The third adaptation
strategy is well characterized by TIGÁZ.
Although the majority of the MNEs’ short-term adaptation strategies seem successful, several issues
still remain open. If they want to decrease their exposure to the state and plan to leave the regulated
market, they need a buyer. The single potential buyer seems to be the state-owned MVM, as there is a
very low probability that any private entities plans to enter the unpredictable regulated retail segment.
However the capital position of MVM seems insufficient to manage more acquisitions. The negative
impacts of the below-cost regulated prices on the recent profitability of the firm can be seen. The 2013
after-tax profit of trading activity decreased close to the zero level from the level of 23 billion HUF in
2012.
Because of the low interest of potential buyers to invest in Hungarian regulated retail businesses, the
MNEs have to look for alternative and more proactive strategies to survive. They can use their
bargaining power more actively, also on the firm and on a state-to-state level. The changes in the
MNEs’ organisational structure with separation of the regulated retail business lines can help to
mitigate the risks of state influence on the remaining part of their activities. Last but not least, they
also can innovate. E.ON and RWE came to the market in 2014 with a new concept of building and
operating small distributed solar panels for households and converting the traditional retailer-
consumer model to a ‘prosumer’ concept. These firms reshape their business models through learning

17
from the industrial technical changes and using their experiences from the German market. It seems
that the permanent changes of the sector will continue also in the upcoming years.
Conclusions
The aim of this paper was much more to explore two-way interactions in a co-evolutionary framework
on micro, sector (meso) and macro levels and to present their impacts on firms’ performance rather
than to formulate hypotheses on the causality of the factors. The Hungarian energy trading sector gives
an excellent research field to apply the theory of co-evolution in a highly institutionalized environment
because of the significant institutional constraints, the strong political influence on the sector and the
mixed ownership structure of the trading firms. We identified various examples of the mutual impacts
of the firms and their institutional environment. We found, following the theoretical statements of
Child et al. (2012), that in a highly institutionalized business system the co-evolution is the outcome of
the relational processes between the relevant actors, including politicians, regulators, firms and other
stakeholders. The last decade of the Hungarian energy retail sector illustrates well the permanent
change in the relationships between the relevant interest groups. The relationship between the MNEs
and the political actors was modified several times during the last decades. The privatization in the
mid-1990’s guaranteed a stable institutional framework for the MNEs. The EU accession had
significant impacts on the institutional environment and the business strategies of the incumbent
market players because of the partial market opening in 2003 and the full liberalization of the market
in 2008. MNEs had to react to the increased level of competition and develop more consumer-oriented
services and business models. They also had to modify their business strategies and their relationships
to other groups of stakeholders after the parliamentary election in 2010, when the dominant ideology
of liberalization and competition has been replaced with the ideology of patriotism and centralized
control.
We can state with high probability that the upcoming years will give an excellent research opportunity
to follow the evolution of the sector and the firm-level adaptation in a longer historical perspective.
There are several opportunities for the further development of our research method and analytical
framework. We gave relatively low attention to the intra-firm level factors of the co-evolutionary

18
framework, such as the processes of development of capabilities and the ways of organizational
transformation. We also applied in a simplified way the suggested method of Hannon et al. on the
identification of the business models. Regardless of the limitations, we hope that our remarks could
make a valuable contribution to the co-evolutionary literature.

19
Appendix 1 – Main characteristics of the firms in dataset
Name of Company Main Ultimate Shareholder Country
of
origin
Main
owner's
stake of
shares
Date of
foundation*
Short Name in
Dataset
Product
focus
DSO
in the
same
group
Universal
services
HU
power
plants
in
group
Revenue
in
2013**
Base
equity
in 2013
Corrected
equity in
2013
EBIT
2013
EBIT/Sales
2013
Corrected
Profit
after Tax
in 2013
PAT/Sales
2013
Alteo Nyrt. Wallis Asset Management Zrt. HUN 94,9% 2008 ALTEO electricity Y 2 256 1 593 -926 -129 -5,72% -103 -4,55%
Budapesti Energiakereskedő Kft. B.E.K. GROUP s.r.o. SVK 100,0% 2003 BEK electricity 1 952 98 98 -114 -5,83% 38 1,92%
CEZ Magyarország Kft. CEZ a.s. CZE 100,0% 2005 CEZ electricity 17 557 106 106 -327 -1,87% -349 -1,99%
CYEB ArtProgram Srl. ROU 100,0% 2010 CYEB combined 5 218 96 96 47 0,90% 38 0,72%
E.ON Energiaszolgáltató Kft. E.on Energie AG. GER 100,0% 1991 (2007) EON combined Y Y Y 485 150 16 609 16 609 -678 -0,14% -1 610 -0,33%
Econgas EconGas GmbH. (ÖMV) AUT 100,0% 2007 ECONGAS gas 23 578 257 257 20 0,08% 5 0,02%
EDF-DÉMÁSZ Zrt. EDF International S.A.S. FRA 100,0% 1991 EDF electricity Y Y Y 123 628 122 016 9 147 2 056 1,66% 1 912 1,55%
ELMŰ Nyrt. RWE Energy Beteiligungs GER 55,3% 1991 ELMU electricity Y Y Y 191 597 201 090 -24 990 -2 309 -1,21% -3 416 -1,78%
ÉMÁSZ Nyrt. RWE Energy Beteiligungs GER 54,3% 1991 EMASZ electricity Y Y Y 74 811 83 930 -3 312 -1 957 -2,62% -2 385 -3,19%
E-OS Zrt. & E-OS Gáz Kft. Közgép Zrt. HUN 100,0% 2006 / 2011 EOS combined 6 794 227 227 29 0,43% 46 0,68%
FŐGÁZ Zrt. Municipality of Budapest*** HUN 50,0% 1993 FOGAZ gas Y Y 218 803 34 885 11 649 -611 -0,28% -905 -0,41%
GDF-SUEZ Energia
Magyarország Zrt.
GDF International S.A.S. FRA 100,0% 1993 (2006) GDF gas Y Y Y 184 260 19 487 19 365 -998 -0,54% -25 -0,01%
Greenergy Trade Kft. Greenergy Holdings LLC USA 100,0% 2009 GREENENERGY electricity Y 1 901 67 67 13 0,71% 3 0,18%
JAS Budapest Zrt. Hungarian private individuals HUN 100,0% 2002 JAS combined 2 256 1 593 1 593 -129 -5,72% 55 2,43%
Magyar Telekom Nyrt. Deutsche Telekom AG GER 59,2% (2011) MTEL combined 48 000 -7 168 -7 168 -4 153 -8,65% -4 244 -8,84%
Magyar Áramszolgáltató Kft. RWE Energy Beteiligungs GER 54,3% 2002 MASZ electricity Y Y 144 841 450 450 4 200 2,90% 1 836 1,27%
MET Magyarország(MOL)
Energiakereskedő Zrt.
offshore companies (CHE) 60,0% 2009 MET gas 232 489 5 873 5 873 3 590 1,54% -1 723 -0,74%
MVM Partner Zrt. & MVM
Trade Zrt.
Hungarian State HUN 99,9% 1991 (2002/2005) MVM combined Y 609 407 22 099 22 099 1 968 0,32% 524 0,09%
Nordest Energy Kft. Hungarian private individuals HUN 100,0% 2010 NORDEST combined 2 169 -2 -2 -40 -1,86% -18 -0,83%
IFC Energy (Optenergy) Kft. Hungarian private individuals HUN 100,0% 2006 IFC combined 27 622 1 325 1 325 269 0,97% 91 0,33%
TIGÁZ Zrt. ENI SPA. ITA 100,0% 1994 TIGAZ gas Y Y 240 413 26 087 -21 658 -16 080 -6,69% -20 774 -8,64%
VPP Erőmű Hungarian private individuals HUN 100,0% 2011 VPP electricity Y 11 865 186 186 -28 -0,23% -42 -0,35%
* Date of foundation generally shows the founding date of the unit concerned. In several cases there were significant organizational changes in the holding structures. The date between brackets reflects the date
of the reorganisation and establishment of independent trading unit. In the case of Magyar Telekom, the date reflects the beginning of its energy trading activities.
** all financial figures are in million Hungarian forints.
*** The Municipality of Budapest sold its stake to Hungarian Asset Management Zrt. in July 2014.

20
Appendix 2 – Correlations and reliability coefficients
DIV_13 DIV_12 DIV_11 DIV_10 DIV_09 SIZE_
13 SIZE_
12 SIZE_
11 SIZE_
10 PAT_
13 PAT_
12 PAT_
11 PAT_
10 PAT_0
9
DOM_CONTROL
UNIV PRODUCTION
DIV_12 Pearson Correlation ,151 Sig. (2-tailed) ,503
N 22
DIV_11 Pearson Correlation ,279 ,402
Sig. (2-tailed) ,221 ,071
N 21 21
DIV_10 Pearson Correlation ,553* ,295 ,435
Sig. (2-tailed) ,014 ,221 ,063
N 19 19 19
DIV_09 Pearson Correlation ,502* ,227 ,416 ,903** Sig. (2-tailed) ,034 ,364 ,086 ,000 N 18 18 18 18
SIZE_13 Pearson Correlation ,309 ,417 ,602** ,533* ,479*
Sig. (2-tailed) ,162 ,054 ,004 ,019 ,044
N 22 22 21 19 18
SIZE_12 Pearson Correlation ,285 ,429* ,623** ,506* ,447 ,984**
Sig. (2-tailed) ,199 ,046 ,003 ,027 ,063 ,000
N 22 22 21 19 18 22
SIZE_11 Pearson Correlation ,333 ,391 ,605** ,524* ,461 ,899** ,943**
Sig. (2-tailed) ,130 ,072 ,004 ,021 ,054 ,000 ,000 N 22 22 21 19 18 22 22
SIZE_10 Pearson Correlation ,249 ,179 ,435 ,420 ,460 ,678** ,745** ,826**
Sig. (2-tailed) ,320 ,478 ,071 ,082 ,063 ,002 ,000 ,000
N 18 18 18 18 17 18 18 18
PAT_13 Pearson Correlation ,016 ,023 ,132 ,129 ,075 -,283 -,282 -,259 -,209 Sig. (2-tailed) ,945 ,919 ,568 ,599 ,767 ,202 ,204 ,244 ,405
N 22 22 21 19 18 22 22 22 18
PAT_12 Pearson Correlation -,049 ,520* ,364 ,398 ,413 ,023 ,025 ,000 -,054 ,562**
Sig. (2-tailed) ,828 ,013 ,104 ,092 ,089 ,919 ,911 ,999 ,832 ,007
N 22 22 21 19 18 22 22 22 18 22
PAT_11 Pearson Correlation -,132 ,418 -,080 ,406 ,369 ,118 ,115 ,081 ,010 ,413 ,702**
Sig. (2-tailed) ,559 ,053 ,730 ,085 ,132 ,601 ,610 ,720 ,968 ,056 ,000
N 22 22 21 19 18 22 22 22 18 22 22
PAT_10 Pearson Correlation -,356 ,267 ,092 ,390 ,372 ,336 ,334 ,298 ,215 ,181 ,554* ,778**
Sig. (2-tailed) ,147 ,284 ,717 ,110 ,141 ,173 ,176 ,229 ,393 ,472 ,017 ,000 N 18 18 18 18 17 18 18 18 18 18 18 18
PAT_09 Pearson Correlation -,110 ,262 ,166 ,549* ,627** ,179 ,169 ,143 ,120 ,231 ,786** ,764** ,834**
Sig. (2-tailed) ,676 ,311 ,525 ,022 ,007 ,492 ,518 ,583 ,645 ,372 ,000 ,000 ,000
N 17 17 17 17 17 17 17 17 17 17 17 17 17
DOM_CONTROL Pearson Correlation -,334 ,262 -,057 ,012 -,065 -,316 -,295 -,316 -,082 ,247 ,457* ,431* ,225 ,305 Sig. (2-tailed) ,128 ,239 ,805 ,960 ,798 ,152 ,183 ,152 ,747 ,267 ,032 ,045 ,369 ,234
N 22 22 21 19 18 22 22 22 18 22 22 22 18 17
UNIV Pearson Correlation ,549** -,044 ,461* ,241 ,163 ,618** ,624** ,651** ,512* -,379 -,454* -,415 -,349 -,436 -,428*
Sig. (2-tailed) ,008 ,845 ,036 ,319 ,517 ,002 ,002 ,001 ,030 ,082 ,034 ,055 ,155 ,080 ,047
N 22 22 21 19 18 22 22 22 18 22 22 22 18 17 22
PRODUCTION Pearson Correlation ,457* ,002 ,076 ,490* ,546* ,219 ,211 ,156 ,334 ,195 ,065 ,248 ,295 ,294 -,203 ,226
Sig. (2-tailed) ,032 ,993 ,743 ,033 ,019 ,328 ,345 ,487 ,176 ,383 ,775 ,267 ,234 ,252 ,366 ,313
N 22 22 21 19 18 22 22 22 18 22 22 22 18 17 22 22
DSO_in_GROUP Pearson Correlation ,514* -,073 ,435* ,413 ,265 ,672** ,669** ,699** ,563* -,298 -,426* -,338 -,119 -,302 -,500* ,904** ,332
Sig. (2-tailed) ,015 ,746 ,049 ,079 ,288 ,001 ,001 ,000 ,015 ,177 ,048 ,124 ,638 ,239 ,018 ,000 ,131
N 22 22 21 19 18 22 22 22 18 22 22 22 18 17 22 22 22
*. Correlation is significant at the 0.05 level (2-tailed). **. Correlation is significant at the 0.01 level (2-tailed).
Comments to the set of variables:
DIV_n means the dividend paid in the year n;
SIZE_n measured as the natural log of revenue of year n;
PAT_n means the profit after tax of year n; DOM_CONTROL (dummy) =1 if the company controlled by
local ultimate owners;
UNIV (dummy) = 1 in case of universal service activities;
PRODUCTION (dummy) = 1 in case of ownership production entities (power plants);
DSO_IN_GROUP (dummy) = 1 if the firm belongs to a group which also has ownership in a DSO.

21
References
Barney, J. B. & Arikan, A. M.,(2001). The Resource-based View: Origins and Implications. In Hitt M.
A., Freeman R. E. & Harrison J. S. (Eds.), The Blackwell Handbook of Strategic Management. (pp. 124-
187). Oxford: Blackwell Publishers.
Birkinshaw, J.M., Young S. & Hood, N. (2004). Subsidiary entrepreneurship, internal and external
competitive forces, and subsidiary performance. International Business Review, 14: 227-248.
CEER (2012). CEER Status Review of Customer and Retail Market Provisions from the 3rd Package as
of 1 January 2012. Council of European Energy Regulators, C12-CEM-55-04. Brussels, 7 November
2012.
Child, J., Rodrigues, S. B. & Tse, K-T. K. (2012) The Dynamics of Influence in Corporate Co-Evolution.
Journal of Management Studies, Volume 49, Issue 7: 1246–1273.
European Commission (2008). Commission requests Hungary to end long-term power purchase
agreements and recover state aid from power generators. Press Release, IP/08/850. European
Commission, Brussels, 4 June 2008.
European Commission (2009a). Directive 2009/72/EC of the European Parliament and of the Council of
13 July 2009 concerning common rules for the internal market in electricity and repealing Directive
2003/54/EC. Official Journal of the European Union, 14.8.2009.
European Commission (2009b). Directive 2009/73/EC of the European Parliament and of the Council of
13 July 2009 concerning common rules for the internal market in natural gas and repealing Directive
2003/55/EC. Official Journal of the European Union, 14.8.2009.
European Commission (2014). Energy prices and costs report. Comission Staff Working Document,
SWD(2014) 20 final/2. European Commission, Brussels, 17 March.
Foxon, T. J. (2011). A coevolutionary framework for analysing a transition to a sustainable low carbon
economy. Ecological Economics, Vol. 70: 2258-2267.

22
Grant, Robert M. (2008). Contemporary Strategy Analysis. Sixth Edition. Oxford: Blackwell Publishing.
Hannon M. J., Foxon T. J. & Gale W. F. (2013). The co-evolutionary relationship between Energy
Service Companies and the UK energy system: Implications for a low-carbon transition, Energy Policy,
Vol. 61:1031-1045.
Henisz, W. J. & Zelner, B. A. (2005). Legitimacy, Interest Group Pressures, and Change in Emergent
Institutions: The Case of Foreign Investors and Host Country Governments. Academy of Management
Review, 30: 361–382.
Index (2013): Nem nyerészkedtek a lakosságon az áramcégek. (The electricity companies did not
profiteer on households.) 2013.02.22. 23:41. Retrieved: December 30. 2014. from:
http://index.hu/gazdasag/2013/02/22/nem_nyereszkedtek_a_lakossagon_az_aramcegek/ (in
Hungarian)
Lockett, A., Thomson, S. & Morgenstern, U. (2009). The development of the resource-based view of the
firm: A critical appraisal. International Journal of Management Reviews, Volume 11 Issue 1: 9-28.
Osterwalder, A. & Pigneur,Y. (2010). Business Model Generation: A Handbook for Visionaries, Game
Changers, and Challengers. Wiley Desktop Editions, Wiley, Hoboken.
Parliament of Hungary (2011). Nemzeti Energiastratégia 2030. (National Energy Strategy 2030). Magyar
Közlöny, 2011/119 pp. 30210-30359. (in Hungarian)
Porter M. E. (1980). Competitive Strategy. New York: The Free Press.
Priem, R. L. & Butler, J. E. (2001). Is the Resource-Based “View” a Useful Perspective for Strategic
Management Research? The Academy of Management Review, 26: 22-40.
Rodrigues, S. B. & Child, J. (2003). Co-evolution in an Institutionalized Environment. Journal of
Management Studies, Vol. 40: 2137-2162.
Rumelt, R. P., Schendel D.& Teece D. J. (1991). Strategic Management and Economics. Strategic
Management Journal, 12 (Special Issue, Winter): 5-29.

23
Suhomlinova, O. (2006). Toward a Model of Organizational Co-Evolution in Transition Economies.
Journal of Management Studies, 43, (7): 1537–1558.
Vince P. (2012). Árszabályozás és versenyhelyzet a magyarországi energiapiaci nyitás után. (Price
regulation and competition after market opening of the Hungarian energy sector.) In.Valentiny P. – Kiss
F. L. & Nagy Cs. I. (eds.): Verseny és szabályozás, 2011. (pp. 303–326). Budapest: MTA KRTK
Közgazdaság-tudományi Intézet, 2012 (in Hungarian).
Volberda, H. W. & Lewin, A. Y. (2003). Co-evolutionary dynamics within and between firms: from
evolution to co-evolution. Journal of Management Studies, 40 (8): 2105-2130.
Wilson J. & Hynes N. (2009). Co-evolution of firms and strategic alliances: theory and empirical
evidence. Technological Forecasting and Social Change, 76 (5): 620-628.