Winkler 95 Porous
15
Acoustic Velocity and Attenuation in Porous Rocks Kenneth W. Winkler and William F. Murphy III 1. INTRODUCTION The acoustic properties of most crustal rocks are dominated by microcracks, pores, and the fluids contained within them. Dry rocks have much lower elastic moduli than do any of the constituent minerals. They are acoustically much more non-linear (s tress-dependent) than other common materials. Fluid-saturated rocks exhibit attenuation and velocity dispersion that is not observed in dry rocks. All of these effects, and others, have been ascribed to the complex nature of the crack/pore structure of rocks, and to the behavior of tluids occupying and tlowing within the pore structure. Our intention here is to provide a concise status report on the present state of knowledge of rock acoustics. Several excellent review volumes have been published [ 12, 19, 59, 80, 84, 88, 921, and should be consulted for additional information. Our approach will be to present experimental results that illustrate specific aspects of rock acoustics, and show how theoretical models help us understand the observations. Several field applications will also be discussed. Since velocities in rock have been studied more extensively than has attenuation, some sections contain little or no reference to attenuation. K. W. Winkler and W. F. Murphy III, Schlumberger-Doll Re- search, Old Quarry Road, Ridgefield, CT 06877-4108 Rock Physics and Phase Relations A Handbook of Physical Constants AGLJ R eference Shelf 3 Copyright 1995 by the American Geophysical Union. 2. POROSITY Acoustic well-logs are frequently used to estimate porosity, especially in clean, water-saturated sandstones. This is based on an observation made by Wyll ie et al. [ 1031 showing that in clay-free, water-satura ted sandstones under high-confining pressure. compressional- wave slowness ( I/velocity) has a strong linear correlation wnth porosity. They proposed the equation- j -Q, 1-Q v,, v, v,,, (1) where V, is the compressional wave velocity in the rock, Vris the velocity in pore fluid, and V, is the velocity in the solid matrix. Equation (1) is known as the ‘time- average’ equation, because the total travel time is the average of the times that a hypothetical linear raypath would spend in the fluid and in the matrix. It is, however, a correlation and not a rigorous theoretical model. Figure I shows an example from G regory [31] where Equation (I) is compared to a suite of sandstone data. Significant amounts of clay in the rock will lower the velocity from the time-average prediction and recent work has attempted to derive correlations to both porosity and clay content (see Section 3). Attempts to derive the porosity of carbonates from the time-average equation often under-estimate the true porosity. The difference between the derived porosity and true porosity is often called ‘secondary porosity’. It is generally believed that secondary porosity is located in rounded, vugular pores whose shape is rather non- compliant and so has a negligible effect on the measured velocity. The ef fect of pore shape is very important. A small amount of porosity can have a large effect on velocities if 20
-
Upload
zulfakhribinzakaria -
Category
Documents
-
view
224 -
download
0
Transcript of Winkler 95 Porous

8/13/2019 Winkler 95 Porous
http://slidepdf.com/reader/full/winkler-95-porous 1/15
Acoustic Velocity and Attenuation in Porous Rocks
Kenneth W. Winkler and William F. Murphy III
1. INTRODUCTION
The acoustic properties of most crustal rocks are
dominated by microcracks, pores, and the fluids containedwithin them. Dry rocks have much lower elastic moduli
than do any of the constituent minerals. They are
acoustically much more non-linear (s tress-dep endent)
than other common materials. Fluid-saturated rocks
exhibit attenuation and velocity dispersion that is not
observed in dry rocks. All of these effects, and others,
have been ascribed to the complex nature of the
crack/pore structure of rocks, and to the behavior of tluids
occupying and tlowing within the pore structure.
Our intention here is to provide a concise status report
on the present state of knowledge of rock acoustics.
Several excellent review volumes have been published
[ 12, 19, 59, 80, 84, 88, 921, and should be consulted foradditional information. Our approach will be to present
experimental results that illustrate specific aspects of rock
acoustics, and show how theoretical models help us
understand the observations. Several field applications
will also be discussed. Since velocities in rock have been
studied more extensively than has attenuation, some
sections contain little or no reference to attenuation.
K. W. Winkler and W. F. Murphy III, Schlumberger-Doll Re-search,Old Quarry Road, R idgefield, CT 06877-4108
Rock Physics and Phase Relations
A Handbook of Physical Constants
AGLJ R eference Shelf 3
Copyright 1995 by the American Geophysical Union.
2. POROSITY
Acoustic well-logs are frequently used to estimate
porosity, especially in clean, water-satura ted sandstones.This is based on an observation made by Wyllie et al.
[ 1031 showing that in clay-free, water-satura ted
sandstones under high-confining pressure. compressional-
wave slowness ( I/velocity) has a strong linear correlation
wnth porosity. They proposed the equation-
j -Q, 1-Q
v,, v, v,,, (1)
where V, is the compressional wave velocity in the rock,
Vris the velocity in pore fluid, and V, is the velocity in
the solid matrix. Equation (1) is known as the ‘time-
average’ equation, because the total travel time is the
average of the times that a hypothetical linear raypath
would spend in the fluid and in the matrix. It is, however,
a correlation and not a rigorous theoretical model. Figure
I shows an example from G regory [31] where Equation
(I) is compared to a suite of sandstone data. Significant
amounts of clay in the rock will lower the velocity from
the time-average prediction and recent work has
attempted to derive correlations to both porosity and clay
content (see Section 3).
Attempts to derive the porosity of carbonates from th e
time-average equation often under-estimate the true
porosity. The difference between the derived porosity and
true porosity is often called ‘secondary porosity’. It is
generally believed that secondary porosity is located in
rounded, vugular pores whose shape is rather non-
compliant and so has a negligible effect on the measured
velocity.
The effect of pore shape is very important. A small
amount of porosity can have a large effect on velocities if
20

8/13/2019 Winkler 95 Porous
http://slidepdf.com/reader/full/winkler-95-porous 2/15
WINKLER AND MURPHY 21
35
30
?- 25
eh 20
C
gs 15
a
10
5
0120 110 100 90 a0 70 60 50
Slowness (pdft)
Fig. I. Compressional wave slowness vs porosity data
for water-saturated sandstones from Gregory [28],compared to time-average relation (Equation (1)) for
quartz-water system.
the porosity is contained in thin, flat cracks [86]. Such
cracks a re very compliant to stresses normal to the crack
face. If the same amount of porosity is contained in
spheroidal pores, it will have a minimal effect on velocity.
Various models of velocities in rocks have been based
upon distributions of pore aspect ratios [3, 18, 431 or upon
generalized crack distribution parameters [60].
3. MINERALOGY
Mineralogy affects rock velocities in two ways. The
most obvious is through the bulk and shear moduli of the
solid matrix of the rock, which are primary inputs to all
velocity models, whether crack-bas ed or mixture models
[4, 901. Indirectly, mineralogy controls the cementation
and pore structure of the rock. Other parameters being
equal, silica and carbona te cements produce higher
velocities than clay cement. Carbonates, being more
soluble, often have extremely complex pore structures
which are not well described by conventional velocity
models.Pickett [65] found a useful correlation between
mineralogy and the ratio of compressional to shear
velocities (V,Ns) based on the data shown in Figure 2.
The values in Table 1 were found to hold over a broad
porosity range in consolidated rocks.
In more poorly consolidated rocks, the data tend to
diverge from the trends show n in Figure 2, and many
empirical attempts have been made to extend the
correlations [14]. Several attempts have been made to
estimate the effect of clay content on acoustic velocities
[ 15, 32, 42, 821. These studies have generally found
linear correlations relating velocity to both porosity and
clay content. However, as with Pickett’s results, great
care must be taken when extrapolating these correlations
beyond the range of sample properties used to derive
them. As clay content increases, sandstones grade into
shaly sands and shales. A transition occurs from a grain-
suppor ted framework with clay in the pore space, to a clay
matrix with embedded, isolated grains. Our knowledge of
the acoustic properties of shales is somewhat limited,
primarily because they are difficult to work with in the
lab. Most studies have emphasized the anisotropic nature
of shales [39, 67, 851, discussed fur ther in Section 4.2.
Velocities in shales are slowest in the direction
perpendicular to bedding.
4. STRESS EFFECTS
The complex microstructures of most rocks cause
velocities and attenuation to be very sensitive to stress.
Increasing confining pressure or decreasing pore pressure
cause velocities to increase and attenuation to decrease .
Two points of view are useful, depending on the
microstructure of a particular rock. Focusing on the pore
I I I I I I
A limestone
n dolomite
0 clean sands
0 very limy sand
60
90 1I I I I I\ -I
90 100 110 120 130 140 150
Shear Slowness (pdft)
Fig. 2. Compressiona l wave and shear wave slowness
data for several rock types from Pickett [61]. Lines are
labeled with VplVs ratios.

8/13/2019 Winkler 95 Porous
http://slidepdf.com/reader/full/winkler-95-porous 3/15
22 ACOUSTIC VELOCITY AND ATTENUATION
TABLE I. VtJV, vs Lithology
lithology vfls
limestone 1.9
dolomite 1.8
clean sandstones 16 I .7
space, we can imagine that very compliant pores (such as
thin cracks) will close under small stresses. Increasing
stress will close more and more pores, thereby stiffening
the overall frame of the rock. Several theoretical models
] IX, 47, 60, 861 have utilized this approach. If instead we
focus on the grain space, we envision isolated gr ains
pressed together at their contacts. As stress increases, the
grain contacts b ecome stiffer, as does the entire frame [X,
9, 24,4 I, 54, 5.5, 831.
4.1 Effective Stress.
When applied to acoustic properties, effective stress is
the difference between confining pressur e and pore
pressure [S7]. Imagine a piece of rock totally enclosed by
an impermeable jacket. If the rock is immersed in fluid
which is pressurized, the fluid pressure will be transmitted
through the jacket to the frame of the rock. This pressure
is referred to as the external confining pressure. Now
imagine that we can independently control the pressur e of
tluid in the connected pore space of the rock. This pore
pressure acts to oppose the confining pressure . The pore
pressur e pushes on the inside surface of the jacket; the
confining pressur e pushes on the outside. Wyllie et al(104] showe d very clearly that, to first order, velocities
are a function of the effective stress on the rock (confining
pressure minus pore pressure). Their data are reproduced
in Figure 3. Note that the velocity is independent of
confining pressur e when the effective stress is held
constant (by increasing pore pressure at the same rate as
confining pressure ). It is generally assumed that
attenuation has a similar dependen ce on effective stress,
though we are not aware of such a clear demonstration.
Winkler and Nur [ 1001 showed that increasing confining
pressure, or decreasing pore pressure, both reduce
attenuation in water-saturated rock (see Section 6.4).
4.2 Anisotropy
Anisotropic stresses cause velocities in rock to vary
with direc tion [IO, 45, 58, 721. An example of this effect
is shown in Figure 4 from Nur and Simmons [58]. In this
experiment, a granite sample w as subjected to uniaxial
stress, and velocities were measured as a function of
azimuth, defined as the angle between the raypath and the
uniaxial stress direction. At zero stress, the velocity is
virtually independent of azimuth. As stress increases, a
strong anisotropy develops. P and SH waves are much
more sensitive to stress when propagating parallel to the
stress direction than when propagating perpendicular to
the stress direction. Nur [56] showed how this data could
be modeled by assuming an initially isotropic distribution
of cracks in the rock, an d allowing cracks to preferentially
close depending on how closely their normals are aligned
with the uniaxial stress axis. It is likely that stress
anisotropy will also create attenuation anisotrop y, but no
experimental data are available to confirm this.
A more extreme example is shown in Figure 5 for
Berea sandstone. These data were taken on a dry cylinder
subjected to uniaxial stress. Compressional wave
velocities were measured both parallel a nd perpendicular
to the stress axis. Shear wave velocities were measured
perpendicular to the stress axis, but with polarizations
both parallel an d perpendicular to the stress axis. Shear-
wave splitting on the order of 20% is observed .
Compressional velocities can differ by 50%. As the rock
approach es failure at 44 MPa, velocities begin to
decrease . This is caused by dilatancy, the opening of
I I I I I
0
I I I I I I
10 20 30 40 50 60
Confining Pressure (MPa)
Fig. 3. Compressional wave velocity vs externalconfining pressure for water-satu rated Ber ea sandstone
from Wyllie et al. [99]. Solid curve has zero pore
pressure, so effective pressure (Pe) equals confining
pressure. On dashed curves, pore pressure increases with
confining pressure to maintain a constant value of
effective pressure.

8/13/2019 Winkler 95 Porous
http://slidepdf.com/reader/full/winkler-95-porous 4/15
WINKLER AND MURPHY 23
microcracks with normals perpendicu lar to the uniaxial
stress direction [I 1, 451.
Many rocks exhibit velocity anisotropy even under
isotropic stress conditions [8, 9, 411. This is generally
caused by preferentia l alignment of minerals or cracks.
Shales in particular are often v ery anisotropic due toalignment of platy clay minerals [39, 44, 67 68, 851. Rai
and Hanson [68) found shear wave anisotropy of -39% in
a shale. In a field study, White et al. [94] observed - 12%
anisotropy in the Pierre shale. Theoretical models of
3.8- o. l . z _ 0
I I I
I I I
3,, stress (MPa) SV-- -
%------ c_\ -1
2.
3.0-3 0* - - . . ; - -
259 - - _ I _ - - - -
E 2.9-20. - . - - _ . ’ - A:Y
, 2.8 - I5
> 10 -
2.7 - 5
2.6 - 0 y
I I I
I I I
3.1 stress (MPa) SH
FE 2.9 - ;; : : :
Y 15.- - -
f
2.8 -
2.7- 5.e - . .
2.6 -
0 30 60 90
Azimuth (degrees)
Fig. 4. Velocities vs azimuth in Barre granite under
uniaxial stress from Nur and Simmons [55 ]. Azimuth is
the angle between the uniaxial stress direction and the
direction of wave propaga tion. P - compressional waves.
SH - shear waves whose polarization direction is always
perpend icular to the uniaxial stress direction. SV - shear
waves polarized perpend icular to the SH polarization
direction.
“PI
11 Isereas; 1 .
0 10 20 30 40 50
Uniaxial Stress (MPa)
Fig. 5. Compressional and shear wave velocities in dry
Berea sandstone as functions of uniaxial stress. V,, -propagates parallel to uniaxial stress direction. VP2 -
propagates perpend icular to uniaxial stress direction. V,,,
- propagates perpendicular to uniaxial stress direction and
polarized parallel to stress direction. V, - propagates
perpend icular to uniaxial stress direction and polarized
perpend icular to stress direction. Very strong stress-
induced velocity anisotropy and shear-w ave splitting is
observed.
velocity anisotropy in rocks are generally based upon
aligned microcracks [23, 34, 561. Thomsen [77] showed
that an assumption of weak anisotropy (appropriate formany rocks) results in significant simplification of the
governing equations.
4.3 Nonlinear Acoust ics
Stress-dependent velocities are part of the more
general field of nonlinear acoustics. ‘Stress-dependent’
refers either to externally applied stress or to the stress-
amplitude of the wave itself. Nonlinear acoustics is a
well-developed field when applied to liquids or simple
solids, such as plastics and metals. In addition to the bulk
and shear moduli used in linear elastic theory , higher-
order terms called third-order elastic constants are used.
Isotropic solids will have three third-order constants;
anisotropic solids will have many more. In addition to
predicting velocity varying with externa l stress, nonlinear
theory also predicts phenomenon such as harmonic
generation and beam-mixing. Only recently have these
later effects been demonstrated in rocks using small-
amplitude propagating waves [36, 371.

8/13/2019 Winkler 95 Porous
http://slidepdf.com/reader/full/winkler-95-porous 5/15
24 ACOUSTIC VELOCITY AND ATTENUATION
7 0.009 -u
9
s‘E(dz 0.008 -
a
2
0.007 -
loa
Fig. 6. Extensional wave velocity and attenuation data
for dry Massilon sandston e vs strain amplitude from
Winkler et al. [97].
Acoustic nonlinearity is readily observed using large-
amplitude s tress waves. Various studies, usually using
resonant b ar techniques, have shown that velocity
decreases and attenuation increases whe n maximum
strains exceed approximately 10m6. Figure 6 shows data
from Winkler et al. [ 1021 hat demonstrates both effects.
This amplitude depende nce of velocities is a dominant
cause of the difference between ‘static’ and ‘dynamic’
moduli. Static moduli are generally derived from direct
measures of stress and strain, with strains exceed ing lO-‘j.
Dynamic moduli are measured from propagating acou stic
waves with strains generally much less than 10e6. At low
effective stresses, it is often observed that dynamicmoduli are larger than static moduli [74]. The words
‘static’ and ‘dynamic’ imply a frequency depende nce
which does not exist in dry ro cks (see Section 6. I). Cook
and Hodgso n [22] showed that static moduli vary with the
size of the stress cycle used to measure them, with smaller
stress cycles yielding larger moduli.
5. FLUID EFFECTS IN LOW-FREQUENCY
LIMIT
As will be discussed below, fluid-solid interactions in
rock can produce significant frequency dependence in
both velocity and attenuation. For water-satu rated rocks,the frequency depende nce appears to be minimal below
about 1000 Hz, but for oil-saturated rocks the frequency
dependence may persist to much lower frequencies,
scaling with the product of frequency times viscosity. In
the low-frequency limit, fluid and solid motions are in
phase.
In this limit, equations derived by Gassmann [28]
allow us to compute elastic moduli of fluid saturated rock
knowing the properties of both the dry frame and the
fluid. Gassmann’s equations are also the low-frequency
limit of Biot theory [5], a more comprehensive theory
discussed below. Gassmann’s equations require the bulk
modulus of the matrix material (Ks), the bulk modulus of
the pore fluid (Kr), the bulk modulus of the dry frame
(Kb), the shear modulus of the dry frame (Nb) and the
porosity (Q). K and N are the bulk and shear moduli of
the saturated rock.
N=N, (3)
Note that the shear modulus of the rock is the same dry
or saturated, so the only effect pore fluids have on shear
velocity is through increasing the density. The bulk
modulus of the rock is increased by the addition of pore
fluid, which essentially stiffens the pores with resp ect to
compression. The bulk modulus of hydrocarbon pore
2.0
11
1.8- -
F
1.6- i
E
g 1.4- L- ... .i
h compressional
c
20 40 60 00 100
Water Saturation (%)
Fig. 7. Compressional wave and shear wave velocities
in Massilon sandstone as a function of water saturation
from Murphy 1481. Data were taken below 700 Hz. Biot-
Gassmann predictlons fit data very well. Data
corresp onds to attenuation dat a in Figure 12.

8/13/2019 Winkler 95 Porous
http://slidepdf.com/reader/full/winkler-95-porous 6/15
WINKLER AND MURPHY 25
r I I I I I
.A
OA
.
q
B
Sioux QtzTennessee Ss
Austin Chalk
Berea ss
@
d
0
0
0
00
Wingate SsIndiana Ls
Boise Ss
Coconino Ss0
I I I I I
0.2 0.4 0.6 0.6 1 .o
Partial Pressure of H,O
I I I I
0.03
t
B
i Frequency (kHz)
lo - L %er saturated
.’
/’
3 4 5 6 7 09 2
1000
0.0 .2 0.4 0.6 0.8
0
q
0=
A
1 .o
Partial Pressure of H,O
Fig. 8. Shear wave velocity (normalized) and
attenuation data as functions of partial pre ssure of water
vapor for seve ral rocks from Clark et al. [ 181. W atervapor decreases velocity and increases attenuation in
nominally ‘dry’ rocks.
Frequency (kHz)
Fig. 9. Phase velocity (A) and attenuation (B) vsluids ca n vary significantly with pressure, temperature,
and composition [20, 891. When the pore fluid is a
mixture of liquid and gas, then an effective fluid bulk
modulus can be input to equation (2). Figure 7 shows
data taken by Murphy [51] at -1 kHz, along with
velocities calculated using Gassmann’s equation. As
saturation increases, V, and Vs decrease up to very high
saturations due to increasing density. As gas is eliminated
at the highest saturations, there is a rapid increase in the
fluid bulk modulus which causes both K and Vr toincrease. Figure 7 shows that the VpNs ratio can be used
as a gas indicator, but it is insensitive to the amount of gas
in the rock. The gas effect on VP sometimes pro duces
‘bright spots’ on reflection seismograms, and has been
used as a direct hydrocarbon indicator (discussed more
fully in Section 7).
frequency in Berea sandsto ne from Winkler [9 11. Dashed
lines - dry rock. Solid lines - water satur ated rock.
Effective stress is indicated on the plots. On B, dotted
reference lines h aving slopes of 2 and 4 are also plotted.
Scattering th eory predicts s lopes of four on a log-log plot
of attenuation (db/cm) vs frequency , and predicts velocity
decreasing with increasing frequency.
One problem with applying Gassmann’s equations is
that the dry fram e moduli, Kb and Nb, are not easily
determined, even in the laboratory. This is because both
moduli are very sensitive to chemical interactions
between the pore fluid and the frame. Rocks dried with
heat and high vacuum ha ve relatively high velocities and

8/13/2019 Winkler 95 Porous
http://slidepdf.com/reader/full/winkler-95-porous 7/15
26 ACOUSTIC VELOCITY AND ATTENUATION
I permeable model/
Stoneley waves
non-perm;able model
300 1
0
, , I I I
20 40 60 80 100
Frequency (kHz)
0.30 I I I I
I 6
0.001 I I I I I
0 20 40 60 80 100
Frequency (kHz)
Fig. IO. Stoneley wave slowness and attenuation vs
frequency in Berea sandstone measured in the laboratoryby Winkler et al. [94]. Solid lines are model predictions
(not fits) which include rock permeability. Dashed line
indicates predicted slowness for non-permeable rock.
Negligible attenuation is predicted in non-permeable rock.
Permeability enhances both slowness and attenuation at
low frequencies.
virtually no attenuation [78]. As monolayers of liquid are
deposited on the internal surface of rock, velocity
decreases and attenuation increases. Representative d ata
from Clark et al. [21] are shown in Figure 8, where
attenuation and normalized velocity are plotted asfunctions of w ater partial pressure. These data have been
modeled [54. 831 as fluid monolayers lowering the surfaceenergy of the grains and thereby reducing the cohesion
and stiffness of the grain contacts. From a practical point
of view, it is necessary to use Kb and Nb for the wetted-
,frame in Gassmann’s equations so that the chemical
effects are incorporated into the frame moduli. This is
often done simply by avoiding extreme efforts to dry the
rock in the lab, assuming tha t ‘room-dry’ rocks have a
water-wet frame. However, care must be taken if precise
theoretical predictions are planned.
A recent application of Gassmann’s equation byMurphy et al. [53] inverts Equation (2) to solve for the
fluid bulk modulus, Kr, in terms of V, a nd Vs measured in
saturated rocks. To do this, they must assume a ratio of
K,,/N,, in dry sandstone, which they take to be 0.9. They
show that in high-porosity sandstones, the calculated
value of Kr has sufficient resolution to distinguish
between gas, oil and water. A field example is discussed
in Section 7.
6. ATTENUATION/DISPERSION MECHANISMS
Several mechanisms have been identified that
contribute to attenuation and velocity dispersion ofacoustic waves (dispersion being the frequency
dependence) . Each mechanism can dominate under
certain experimental conditions of frequency, saturation
and strain amplitude. It appears that under typical
conditions in the earth’s crust, in homogeneous rocks,
attenuation and dispersion are dominated by viscous
tluid/solid interactions. In heterogeneou s rocks, scattering
can cause significant dispersion and loss (not absorption)
of energy, but we will only discuss this mechanism as it
pertains to grain/pore scale heterogeneities. Attenuation
and dispersion are physically related, one implying the
other. Bourbie et al. [ 121provide an extensive discussion
of this relationship. For most mechanisms, attenuationvaries with frequency. Frequencies having high
attenuation also have the greatest dispersion. Attenuation
is generally presented as either Q or a, defined by [80]
l-3-,,Q-M,- xf (4)
where M, and M, refer to the real and imaginary parts of
an elastic modulus, v is the velocity of a wave controlled
by modulus M, and f is frequency.
6.1 FrictionFor many years, frictional sliding between grains was
considered a dominant mechanism of attenuation in rocks.
In addition to its intuitive simplicity, friction predicts
attenuation independent of frequency (constant Q) and no
velocity dispersion. This was consistent with some early
experimental data on dry rocks [64], and with da ta on
8/13/2019 Winkler 95 Porous
http://slidepdf.com/reader/full/winkler-95-porous 8/15
WINKLER AND MURPHY 27
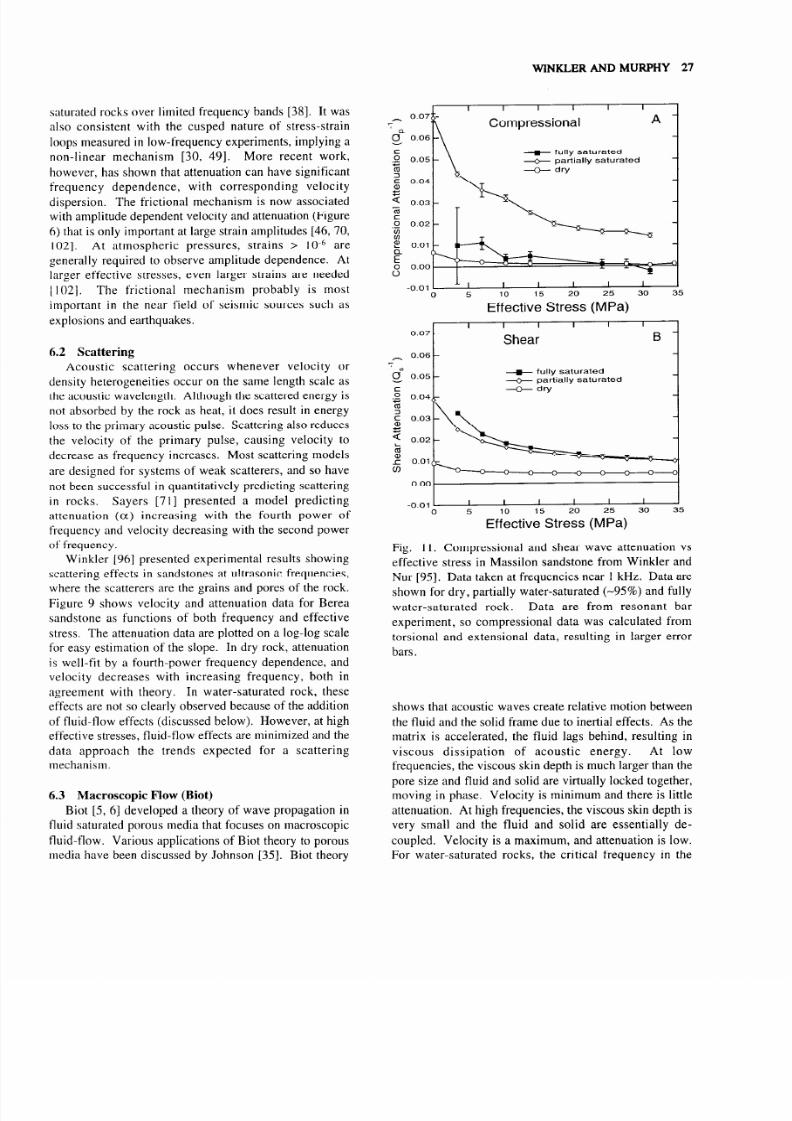
saturated rocks over limited frequency bands [38]. It was
also consistent with the cusped nature of stress-strain
loops measured in low-frequency experiments, implying a
non-linear mechanism [30, 491. More recent work,
however, has shown that attenuation can have significant
frequency dependence, with corresponding velocitydispersion. The frictional mechanism is now associated
with amplitude dependent velocity and attenuation (Figure
6) that is only important at large strain amplitudes [46, 70,
1021. At atmospheric pressures, strains > 10m6 are
generally required to observe amplitude dependence. At
larger effective stresses, even larger strains are needed
] 1021. The frictional mechanism probab ly is most
important in the near field of seismic sources such as
explosions and earthquakes.
6.2 Scattering
Acoustic scattering occurs whenever velocity or
density heterogeneities occur on the same length scale asthe acoustic wavelength. Although the scattered energy is
not absorb ed by the rock as heat, it does result in ene rgy
loss to the primary acoustic pulse. Scattering also reduces
the velocity of the primary pulse, causing velocity to
decrease as frequency increases. Most sca ttering models
are designed for systems of weak scatterers, and so have
not been successful in quantitatively predicting scattering
in rocks. Sayers [7l] presen ted a model predicting
attenuation (a) increasing with the fourth power of
frequency and velocity decreasing with the second power
of frequency.
Winkler 1961 presented experimental results showing
scattering effects in sandstones at ultrasonic frequencies,
where the scatterers are the grains and pores of the rock.
Figure 9 shows velocity and attenuation data for Berea
sandstone as functions of both frequency and effective
stress. The attenuation data are plotted on a log-log scale
for easy estimation of the slope. In dry rock, a ttenuation
is well-fit by a fourth-power frequency de pendence, and
velocity decreas es with increasing frequency, bo th in
agreement with theory. In water-saturated rock, these
effects are not so clearly observed because of the addition
of fluid-flow effects (discussed below). However , at high
effective stresses, fluid-flow effects are minimized and the
data approach the trends expected for a scattering
mechanism.
6.3 Macroscopic Flow (Biot)
Biot [5, 61 developed a theory of wave propagation in
fluid saturated porous media that focuses on macroscopic
fluid-flow. Various applications of Biot theory to porous
media have been discussed by Johnson [35]. Biot theory
- 0.07 -
7
R
Compressional A
g 0 .06
+ fully saturated
- partial ly saturated
U dry
- 0.06
‘;
& 0 .05
s.- 0.04
t
; 0.03
z 0 .02
z5 0.01
+ fully saturated
+ partial ly saturated
U dry
-0.011 1 I I I I I I
0 5
EfLtivZStre2sos (M*ia)
30 35
Fig. I I. Compressional and shear wave attenuation vs
effective stress in Massilon sandstone from Winkler and
Nur [95]. Data taken at frequencies near 1 kHz. Data are
shown for dry, partially water-saturated (-95%) and fully
water-saturated rock. Data are from resonant bar
experiment, so compressional data was calculated from
torsional a nd extensional data, resulting in larger error
bars.
shows that acoustic waves create relative motion between
the fluid and the solid frame due to inertial effects. As the
matrix is accelerated, the fluid lags behind, resulting in
viscous dissipation of acoustic energy . At low
frequencies, the viscous skin depth is much larger than the
pore size and fluid and solid are virtually locked together,
moving in phase. Velocity is minimum and there is little
attenuation . At high frequencies, the viscous skin depth is
very small and the fluid and solid are essentially de-
coupled. Velocity is a maximum, and attenuation is low.
For water-saturated rocks, the critical frequency in the

8/13/2019 Winkler 95 Porous
http://slidepdf.com/reader/full/winkler-95-porous 9/15
28 ACOUSTIC VELOCITY AND A’ITENUATION
0.02 - shear
0.01I I I I
20 40 60 80 100
Water Saturation (%)
Fig. 12. Extensional wave and shear wave attenuation inMassilon sandston e as a function of water saturation from
Murphy [48]. Data were taken below 700 Hz. Data
corresp onds to attenuation data in Figure 7. Extensional
(and compressional) attenuation is maximum in partially
saturated rock. Shear attenuation is maximum in fully
saturated rock.
Biot theory, wh ere attenuation and dispersion are
maximum, is often on the order of 100 kHz. Increasing
viscosity pushes the critical frequency even higher.
Therefore seismic waves and sonic logging are almost
always in the low-frequency range of Biot theory . The
low-frequency limit of Biot theory gives Gassmann’s
equations, discussed above.
For typical sandstones , Biot theory predicts a
maximum of one to two percent velocity dispersion
between its low- and high-frequency limits [97].
Predicted attenuation is also rather small, with minimum
Q’s on the order of 1 00. As Eyill be seen, many rocks
show much more disp ersion a nd attenuation than this. An
interesting prediction of Biot theory is the existence of a
second compressional wave dominated by the properties
of the pore fluid (often called th e Biot slow wave). At
low frequencies this wave is diffusive and at high
frequencies it is propagatory . The propagating wave is
very difficult to observe in rocks, though it has been seen
in synthetic materials [66].
The diffusive mode of the slow wa ve is of practical
importance for permeability estimation using borehole
Stoneley waves. The Stoneley wave is a guided mode
pressu re against the borehole wall. This pressure
generates a diffusive wave in the pore fluid in the rock.
Modeling has shown that this energy conversion from
Stoneley wa ve to diffusive wave causes both attenuation
and increased slowness of the Stoneley wave [ 16, 17, 69,
911. These models were experimentally confirmed byWinkler et al. [99]. Their data for both slowness and
attenuation vs frequency in Berea sandston e are shown in
Figure 10, along with model predictions. In practice, it is
possible to invert Stoneley slowness and/or attenuation
measurements to estimate the permeability of rock
formations [33).
6.4 Local-Flow
The Biot theory (discussed above) is concern ed with
macroscopic fluid-flow controlled by the permeability of
the rock. Another fluid-flow absorption/dispers ion
mechanism, often called ‘local-flow’, is based upon
microscopic fluid motion which is not coherent overmacroscopic length scales. The pore space of a rock is
generally very heterogeneous, some regions being very
compliant while ot hers are very stiff. This can result in
tluid being squeezed out of grain contacts into ne arby
pores, or squeezed between adjacent cracks having
different orientations with respect to a passing stress
wave. This model has been addressed theoretically by
many autho rs [7, 48, 55, 61, 63, 831. While most of these
models can be fit to experimental data, none of them yet
have the predictive power of the Biot th eory. This is
-80.04 - c-attenuation l .
.
h7 . .
g 0.03 - ..*
.“.’
6‘E
i 0z 0.02 - l * 00 000
5 &+&p@ ooo” modulus -
0.01 -
o.oo._4 b3 4 56789 2 3 4 557891 10
Frequency x Dynamic Viscosity (kHz x cp)
Fig. 13. Extensional attenuation and modulus vs product
oi frequency a nd viscosity, from Jones and Nur [37]. For
one centipoise water-satu rated rock, the horizontal axis
becomes a kHz scale. Rock is Berea sandstone with 10
propagating primarily in the borehole fluid and applying MPa confining pressure and 4.5 MPa pore pressure.

8/13/2019 Winkler 95 Porous
http://slidepdf.com/reader/full/winkler-95-porous 10/15
WINKLER AND MURPHY 29
2.9
2.05 -
2.00 -
+ au
1.95 - --t water
-D- crude
I.901
I I I I I I I
0 20 40 60 60 100 120 140
Temperature (“C)
Fig. 14. Compressional and shear velocities in Boise
sandstone as functions of temperature, from Wang and
Nur [82]. Rock is saturated with air (dry), water, or crude
oil. Effective stress is 15 MPa.
because they are all highly dependent on details of the
microstructure that cannot yet be adequately quantified.
Nevertheless, many experimental results have been
interpret ed in terms of the local-flow mechanism [25, 41,
50, 51, 52, 75, 79, 87, 96, 97, 98, 100, IOl]. These
experiments have addres sed effects of saturation, stress,
temperatu re, viscosity an d frequency . Winkler and Nur
[ 1001 showed (Figure 11) that shear wave attenuation
increases monotonically with saturation, while
compressional wave attenuation is greate r in partially
saturated rock than in fully saturated rock. More detailed
data taken by Murphy [50] are shown in Figure 12. These
effects, along with the overall magnitude o f attenuation ,
are consistent with theoretical predictions. At low
pressures, the attenuation is approximately an order of
magnitude greater than that predicted by Biot theory.
The local flow mechanism pred icts that absorption and
dispersion will scale with the produc t of frequency an d
viscosity (cm). By varying viscosity as well as frequenc y,
experimentalists have been able to effectively broaden the
frequency range available to any particular experimental
technique. Many experimental results now exist showing
attenuation varying with 077, with associated velocity
dispersion [25, 40, 50, 75, 79, 1011. Some of these
observations may have been affected by fluid-flow to the
boundaries of the sample, and therefore are not truly
represen tative of a local-flow mechanism [26, 931.
However, some measurements are not affected by
boundary flow. Figure 13 is an example from Jones and
Nur [40 ] in which cylindrical samples were resonat ed intorsion. The samples were jacketed and under confining
pressure. While the complete absorption peak has not
been mapped, the frequency dependence is clear.
When pore fluid viscosity varies strongly with
temperatu re, velocities can be significantly affected. At
low tempera ture the viscosity is high and fluid cannot
flow easily, so the measurement is on the high-frequency,
high-velocity, unrelaxed side of the local-flow
mechanism. As temperatu re increases, viscosity
decreas es, fluid flows more easily and velocity decreas es
as we move to the relaxed side of the absorption/dis-
persion mechanism. This effect is especially strong when
the rock is saturated with viscous hydrocarbons. Figure14 has data from Wang and Nur [87] showing velocities
changing with temperature for air-, water- and oil-
saturated sandstone.
The concept o f relaxed vs unrelax ed velocities was
explored in some detail by Murphy [52] and Winkler [97,
981. Murphy showed that acoustic measurements made
near 1 kHz could be well described using Gassmann’s
equations, but ultrasonic data were better described using
a model with unrelaxed pore fluid [61]. Winkler used
ultrasonic velocity measuremen ts on dry rock as input to
Gassmann’s equations to calculate the low-frequency
velocity limit for saturated rock. He then noted that
ultrasonic velocity measurements on saturated rockalways exceeded this low-frequency limit in a manner
consistent with dispe rsion caused by the local-flow
mechanism. This showed that ultrasonic lab
measurements were being affected by mechanisms
operating at lower frequencies, and so were not entirely
represen tative of velocities at seismic or sonic
frequencies.
7. FIELD APPLICATIONS
Via the techiques of surface seismics, vertical seismic
profiling, well-to-well seismics, and sonic well-logging,
acoustics is the most widely used phenomenon for
exploring and characterizing the earth’s crust. The
acoustic properties o f interest are intrinsic velocities and
attenuation, and impedance contrasts at structural
interfaces.
Velocities are often used for lithology identification
using correlations such as Pickett’s crossplot (Figvre 2).

8/13/2019 Winkler 95 Porous
http://slidepdf.com/reader/full/winkler-95-porous 11/15
30 ACOUSTIC VELOCITY AND ATTENUATION
Gas
KF
0 GPa 16
2340
2350
2360
2370
2380
2390
Fig. 15. Well-log from the Gulf of Mexico showing the
bulk modulus of the pore fluid calculated by Murphy et al.
[41]. Dotted lines are reference values for gas, oil, and
water.
Additional information can be found by correlatingvelocities with other rock properties, such as density
derived from nuclear well logs. When velocities are
measured as continuous functions of depth in wellbores,
the data can be integrated to yield th e total acoustic travel-
time to any depth, thereby providing depth calibration for
surface reflection seismograms. The VP/V, ratio is often
used as a qualitative indicator of the presence of gas, since
gas will reduce the compressional velocity, but not the
shear velocity (Figure 7). Under suitable conditions of
high porosity and small clay content, it is possible to
calculate the pore fluid bulk modulus, thus distinguishing
between gas, oil and water. Figure I5 from Murphy et al.[S3] shows the results of such a calculation for a n oil well
in the Gulf of Mexico. The solid curve indicates the
calculated bulk modulus of the pore fluid. The dashed
reference lines labeled ‘gas’, ‘oil’ and ‘water’ represent
the bulk moduli of those pore fluids. The presence of gas
is indicated from 2343 to 2350 meters, oil from 2 350 to
2365 meters an d from 2368 to 2373 meters, and water
elsewhere.Attenuation data are not routinely used to determine
rock properties because it is very difficult to get accurate
measurements of attenuation, either from seismics or
well-logs. It has long been known that the presence of gas
will reduc e compressional wave amplitudes, resulting in
cycle-skipping on sonic logs. This is consistent with
laboratory attenuation data (Figures I I and 12).
Attenuation is potentially more sensitive than velocity to
the amount of gas in a rock.
Both velocity and attenuation have been used to
estimate formation permeability from borehole Stoneley
waves. High permeability decreases velocity and
increases attenuation, consistent with theoretical models
l-I
0 5 10 15 20 25 30 35
Angle of Incidence (degrees)
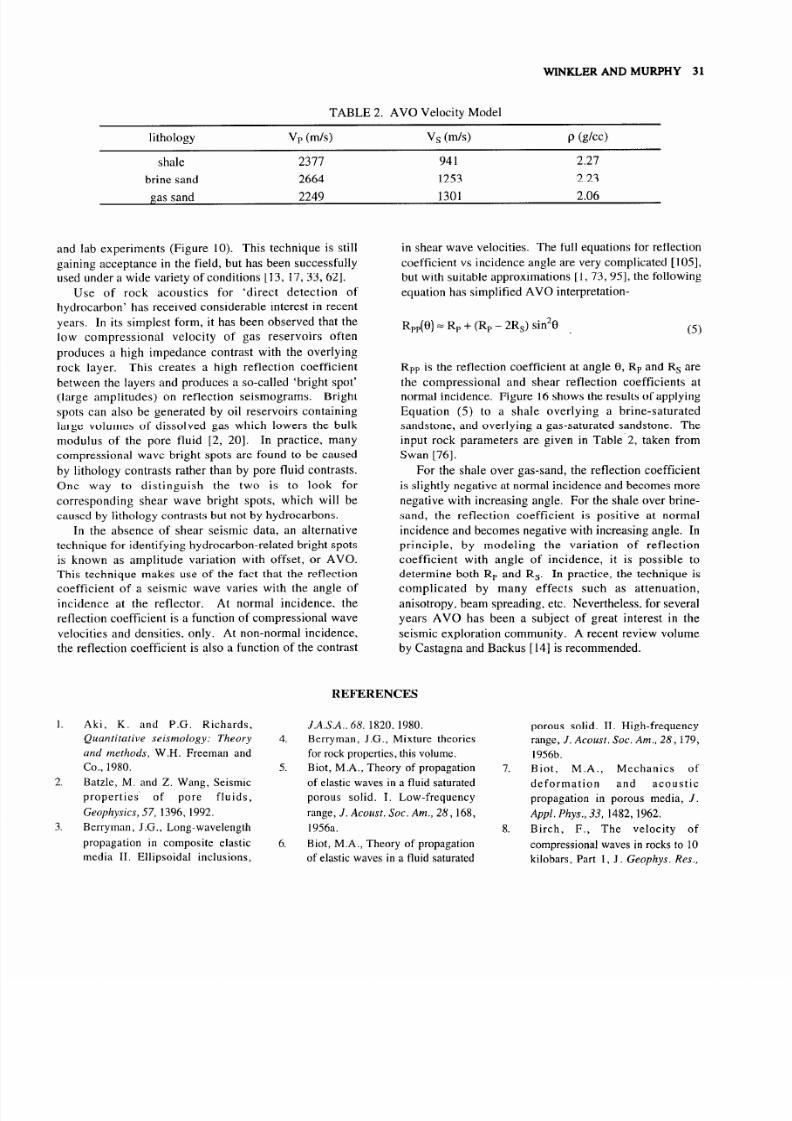
Fig. 16. Reflection coefficient vs angle of incidence for
compressional waves at a shale/brine-sand interface, and a
shale/gas-sand interface. Curves were calculated using
Equation (5) and the rock properties in Table 2. These
curves are the basis of AVO interpretation.
8/13/2019 Winkler 95 Porous
http://slidepdf.com/reader/full/winkler-95-porous 12/15
WINKLER AND MURPHY 31
TABLE 2. AVO Velocity Model
lithology
shale 2377 941 2.27
brine sand 2664 1253 2.23
gas sand 2249 1301 2.06
and lab experiments (Figure 10). This technique is still
gaining acceptance in the field, but has been successfully
used under a wide variety of conditions [ 13, 17, 33, 621.
Use of rock acoustics for ‘direct detection of
hydrocarbon’ has received considerable interest in recent
years. In its simplest form, it has been observed that the
low compressional velocity of gas reservoirs often
produces a high impedance contrast with the overlying
rock layer. This creates a high reflection coefficient
between the layers and produces a so-called ‘bright spot’
(large amplitudes) on reflection seismograms. Bright
spots can also be generated by oil reservoirs containing
large volumes of dissolved gas which lowers the bulk
modulus of the pore fluid [2, 201. In practice, many
compressional wave bright spots are found to be caused
by lithology contrasts rather than by pore fluid contrasts.
One way to distinguish the two is to look for
corresponding shear wave bright spots, which will be
caused by lithology contrasts but not by hydrocarbons.
In the absence of shear seismic data, an alternative
technique for identifying hydrocarbon-related bright spots
is known as amplitude variation with offset, or AVO.
This technique makes use of the fact that the reflection
coefficient of a seismic wave varies with the angle of
incidence at the reflector. At normal incidence, the
reflection coefficient is a function of compressional wave
velocities and densities, only. At non-normal incidence ,
the reflection coefficient is also a function of the contrast
1. Aki, K. and P.G. Richards,
Quantitative seismology: Theory
and methods, W.H. Freeman and
co., 1980.
2. Batzle, M. and Z. Wang, Seismic
properties’ of pore fluids,
Geophysics, 57, 1396,1992.
3. Berryman, J.G., Long-wavelength
propagation in composite elastic
media II. Ellipsoidal inclusions,
in shear wave velocities. The full equations for reflection
coefficient vs incidence angle are very complicated [ 1051,
but with suitable approximations [ 1, 73,951 , the following
equation has simplified AVO interpreta tion-
Rpp(0 ) = R, + (RP - 2R,) sin20
Rpp is the reflection coefficient at angle 8, RP and Rs are
the compressional and shear reflection coefficients atnormal incidence. Figure 16 shows the results of applying
Equation (5) to a shale overlying a brine-saturated
sandstone, and overlying a gas-saturated sandstone. The
input rock parameters are given in Table 2, taken from
Swan [76].
For the shale over gas-sand, the reflection coefficient
is slightly negative a t normal incidence and becomes more
negative with increasing angle. For the shale over brine-
sand, the reflection coefficient is positive at normal
incidence and becomes negative with inc reasing angle. In
principle, by modeling the variation of reflection
coefficient with angle of incidence, it is possible to
determine both R, and R,. In practice, the technique is
complicated by many effects such as attenuation ,
anisotropy, beam spreading, etc. Nevertheless, for several
years AVO has been a subject of great interest in the
seismic exploration community. A recent review volume
by Castagna and Backus [ 141 s recommended.
REFERENCES
J.A.S.A., 68, 1820, 1980.
4. Berryman, J.G., Mixture theories
for rock properties, his volume.5. Biot, M.A., Theory of propag ation
of elastic waves in a fluid saturated
porous solid. I. Low-frequency
range,J. Acoust. Sot. Am., 28,168,
1956a.
6. Biot, M.A., Theory of propagation
of elastic waves in a fluid saturat ed
porous solid. II. High-frequency
range,J. Acoust. Sot. Am., 28,179,
1956b.7. Biot, M.A., Mechanics of
deformation and acoustic
propagation in porous media, J.
Appl. Phys., 33, 1482,1962.
8. Birch, F., The velocity of
compressional waves in rocks to 10
kilobars, Part 1, J. Geophys. Res.,

8/13/2019 Winkler 95 Porous
http://slidepdf.com/reader/full/winkler-95-porous 13/15
ACOUSTIC VELOCITY AND ATI’ENUATION2
9.
IO.
Il.
12.
13.
14.
15.
16.
17.
18.
19.
65, 1083,196O.
Birch, F., The velocity of
compressional waves in rocks to IO
kilobars, Part 2, J. Geophys. Res..
66, 2199, 1961,
Bonner, B.P., Shear wavebirefringence in dilating granite,
Geophys. Res. Lett., I, 217, 1974.
Brace, W.F., B.W. Paulding, and C.
Scholz , Dilatancy in the fracture of
crystalline rocks, J. Geophys. Rrs.,
71, 3939,1966.
Bourbie, T., 0. Coussy, and B.
Zinszner, Acoustics qf Porous
Media, Institut Francais du Pttrole
Publications, Gulf Publishing Co.,
1987.
Burns, D.R., Predicting relative and
absolute variations of in-situpermeability from full-waveform
acoustic logs, The Log Analys t, 32,
246,199l.
Castagna, J.P. and M.M. Backus ,
Offset-dependent reflec tivity -
Theory and practice of AVO
analysis, Investigations in
Geophysics Series, S.E.G., 1993.
Castagna, J.P., M.L. Batzle, and
R.L. Eastwood, Relationships
between compressional-wave and
shear-wave velocities in elastic
silicate rocks, Geophysics, 50, 571,1984.
Chang, S.K., H. L. Liu, and D.L.
Johnson, Low-frequency tube
waves in permeable rocks,
Geophysics .53,519,1988.
Cheng, C.H., Z. Jinzhong, and D.R.
Burns, Effects of in-situ
permeability on the propagation of
Stoneley (tube) waves in a borehole,
Geophysics, 52, 1279,1987.
Cheng, C.H. and M.N. Toksoz,
Inversion of seismic velocities for
the pore aspect ratio spectrum of arock, J. Geophys. Res., 84, 7533,
1979.
Christensen, N.I., Seismic
Veloci ties, in CRC Handbook of
Physical Properties of Rocks, Vol.
II, edited by Robert S. Carmichael,
20.
21.
22.
23.
24.
25.
26.
27.
28.
29.
30.
31.
CRC Press, 1982.
Clark, V.A., The effect of oil under
in-situ conditions on the seism ic
properties of rocks, Geophysics, 57,
894, 1992.
Clark, V.A., B.R. Tittmann, andT.W. Spencer, Effect of volatil es on
attenuation (Q-l ) and veloc ity in
sedimentary rocks , J. Geophys.
Res., 85, 5190, 1980.
Cook, N.G.W. and K. Hodgson,
Some detailed stress-strain curves
for rock, J. Geaphys. Res.. 70,2883,
1965.
Crampin, S., Effective anisotropic
elasti c constants for wave
propagation through cracked solids,
Geophys. 1. Roy. Ast. Sot., 76, 133,
1984.Digby, P.J., The effective elastic
moduli of porous granular rocks , J.
Appl. Mech. ASME 28, 803, 1982.
Dunn, K.J., Acous tic attenuation in
fluid-saturated porous cylinders at
low frequencies, J. Acoust. Sot.
Am., 79, 1709,1986.
Dunn, K.J., Sample boundary effect
in acoustic attenuation of fluid-
saturated porous cylinders, J.
Acoust. Sot. Am., 81, 1259,1987.
Gardner, G.H.F., M.R.J. Wyllie,
and D.M. Droschak, Effects ofpressure and fluid saturation on the
attenuation of elasti c waves in
sands, J. Pet. Tech., 189,1964.
Gassmann, F., Uber die elastizitat
poroser medien, Vier. der Natur.
Gesellschaf t, 96, 1, I95 1.
Gordon, R.B. and L.A. Davis,
Veloc ity and attenuation of seismic
waves in imperfectly elastic rock, J.
Geophys. Res., 73,3917, 1968.
Gordon, R.B. and D. Rader,
Imperfect elasticity of rock: Its
influence on the veloc ity of stresswaves, in Structure and Physical
Properties of the Earth’s Crust,
Geophys. Monograph Series , v.14,
edited by G. Heacock, 235,197l.
Gregory, A.R., Aspects of rock
physi cs from laboratory and log
32.
33.
34.
3.5.
36.
37.
38.
39.
40.
41.
42.
data that are important to seismic
interpretation, Am. Assoc. Petr.
Geol. Mem., 26, 15,1977.
Han, D.-h., A. Nur, and D. Morgan,
Effects of porosity and clay content
on wave velocities in sandstones,Geophysics, J/,2093, 1986.
Hornby, B.E. W.F. Murphy, H.L.
Liu, and K. Hsu, Reservo ir sonics:
A North Sea case study,
Geophysics, 57, 146, 1992.
Hudson, J.A., Wave speeds and
attenuation of elasti c waves in
material containing crack s,
Geophys. J. Roy. Ast. Sot., 64,133,
1981.
Johnson, D.L., Recent
developments in the acoustic
properties of porous media, inFrontiers in Physical Acoustics,
Course XCIII, North-Holland,
Amsterdam, 1986.
Johnson, P.A., A. Miglior i, and T.J.
Shankland, Continuous wave phase
detection for probing nonlinear
elastic wave interactions in rocks, J.
Geophys. Res., 89,598, 1991.
Johnson, P.A., T.J. Shankland, R.J.
O’Connell and J.N. Albright,
Nonlinear generation of elastic
waves in crystalline rock, J.
Geophys. Res., 92,3597,1987.Johnston, D.H. and M.N. Toksoz ,
Ultrason ic P and S wave attenuation
in dry and saturated rocks under
pressure, J. Geophys. Res., 85, 925,
1980.
Jones, L.E.A. and H. Wang,
Ultrasonic velocities in Cretaceous
shales from the Williston basin,
Geophysics, 46,288, 1981.
Jones, T. and A. Nur, Veloci ty and
attenuation in sandstone at elevated
temperatures and pressures,
Geophys. Res. Lett., 10,140,1983.King, M.S., Wave velocities in
rocks as a function of changes in
overburden pressure and pore fluid
saturants, Geophysics , 31, 50,1966.
Kowallis, B., L.E.A. Jones, and H.
F. Wang, Velocity-porosity-clay

8/13/2019 Winkler 95 Porous
http://slidepdf.com/reader/full/winkler-95-porous 14/15
WINKLER AND MURPHY 33
43.
44.
45.
46.
47.
48.
49.
50.
51.
52.
53.
content: Systematics of poorly
consolidated sandstones, J .
Geophys. Res., 89, 10355,1984.
Kuster, G.T. and M.N. Toksoz ,
Veloc ity and attenuation of seism ic
waves in two-phase media: Part 1.
Theoretical formulations,
Geophysics, 39,587,1974.
Lo, Tien-when, K.B. Coyner, and
M.N. Toksoz, Experimental
determination of elastic anisotropy
of Berea sandstone, Chicopee shale,
and Chelmsford granite,
Geophysics, 51, 164.
Lockner, D.A., J.B. Walsh, and J.D.
Byerlee, Changes in seismic
veloc ity and attenuation during
deformation of granite, J. Geophys.
Res., 82,5374: 1977.Mavko, G.M., Frictional
attenuation: An inherent amplitude
dependence, J. Geophys. Res., 80,
1444,1979.
Mavko, G.M. and A. Nur, The
effect of nonellipt ical cracks on the
compressibility of rocks, J. Geoph.
Res., 83,4769,1978.
Mavko, G.M. and A. Nur, Wave
attenuation in partial ly saturated
rocks, Geophysics, 44,161,1979.
McKavanagh, B. and F.D. Stacey,
Mechanical hysteresis in rocks atlow strain amplitudes and seism ic
frequencies, Phys. Earth Planet.
ht., 8,246, 1974.
Murphy, W.F., Effects of partial
water saturation on attenuation in
Massilon sandstone and Vycor
porous glass, J. Acoust. Sot. Am.,
71,1458,1982.
Murphy, W.F., Acoustic measures
of partial gas saturation in tight
sandstones, J. Geophys. Res., 89,
11,549, 1984.
Murphy, W.F., Sonic and ultrasonicvelocities: Theory versus
experiment, Geophys. Res . Lett., 12,
85,1985.
Murphy, W., A. Reischer, and K.
Hsu, Modulus decomposition of
compressiona l and shear velocit ies
54.
55.
56.
57.
58.
59.
60.
61.
62.
63.
64.
in sand bodies, Geophys ics, 58,227,
1993.
Murphy, W.F., K.W. Winkler, and
R.L. Kleinberg, Frame modulus
reduction in sedimentary rocks : The
effect of adsorption on grain
contacts, Geophys. Res. Lett., I,
805,1984.
Murphy, W.F., K.W. Winkler , and
R.L. Kleinberg, Acoustic relaxation
in sedimentary rocks : Dependence
on grain contacts and fluid
saturation, Geophysics, 51, 757,
1986.
Nur, A., Effects of stress on
velocity anisotropy in rocks with
cracks, J. Geophys. Res., 76, 2022,
1971.
Nur, A. and J.D. Byerlee , An exact
effective stress law for elastic
deformation of rock with fluids, J.
Geophys. Res., 76,6414,1971.
Nur, A. and G. Simmons, Stress-
induced velocity anisotropy in rock:
An experimental study, 9. Geophys.
Res., 74,6667, 1969.
Nur, A. and Z. Wang, Seism ic and
Acoustic Velocities in Reservoir
Rocks: Vol. 1, Experimental
Studies, S.E.G., Geophysics Reprint
Series No. 10, 1989.
O’Connell, R.J. and B. Budiansky,
Seismic velocities in dry and
saturated cracked solids, J.
Geophys. Res., 79,5412, 1974.
O’Connell, R.J. and B. Budiansky,
Viscoelastic properties of fluid-
saturated cracked solids, J.
Geophys. Res.. 82,5719, 1977.
Paillet , F.L., Qualitative and
quantitative interpretation of
fracture permeability using acoustic
full-waveform logs, The Log
Analyst, 32, 256, 1991.
Palmer, I.D. and M.L. Traviolia,Attenuation by squirt flow in under-
saturated gas sands, Geophysics, 45,
1780,1981.
Pesein ick, L. and W.F. Outerbridge,
Internal friction in shear and sher
modulus of Solenhofen limestone
65.
66.
67.
68.
69.
70.
71.
72.
73.
74.
75.
over a frequency range of 10’ cycles
per second, J. Geoph. Res., 66,581,
1961.
Pickett, G.R., Acoustic character
logs and their applications in
formation evaluation, J. Petr. Tech.,
15,650,1963.
Plona, T.J., Observations of a
second bulk compressional wave in
a porous medium at ultrason ic
frequencies, Appl. Phys. Lett., 36,
259,198O.
Podio, A.L., A.R. Gregory, and M.
E. Gray, Dynamic properties of dry
and water-saturated Green River
shale under stress, Sot. Petr. Eng.
J., 8, 389, 1968.
Rai, C.S. and K.E. Hanson, Shear-
wave velocity anisotropy in
sedimentary rocks: A laboratory
study, Geophysics , 53, 800, 1988.
Rosenbaum, J.H., Synthet ic
microseismograms: logging in
porous formations, Geophysics, 39,
14.1974.
Savage, J. C., Comments on paper
by R.B. Gordon and L.A. Davis,
‘Velocity and attenuation of seism ic
waves in imperfectly elastic rock’,
J. Geophys. Res., 74, 726, 1969.
Sayers, C.M., Ultrasonic velocity
dispersion in porous materials, J.Phys. D., 14, 413,1981.
Sayers , C.M., J.G. van Munster and
M.S. King, Stress-induced
ultrasonic anisotropy in Berea
sandstone, Int. J. Rock Mech., 27,
429.
Shuey, R.T., A simplif ication of the
Zoeppritz equations, Geophysics,
50, 609,1985.
Simmons, G. and W.F. Brace,
Comparison of static and dynamic
measurements of compressibil ity of
rocks , J. Geophys. Res., 70, 5649,1965.
Spencer, J.W., Stress relaxations at
low frequencies in fluid-saturated
rocks : Attenuation and modulus
dispersion, J. Geophys. Res., 86,
1803,1981.

8/13/2019 Winkler 95 Porous
http://slidepdf.com/reader/full/winkler-95-porous 15/15
ACOUSTIC VELOCITY AND ATI’ENUATION4
16.
77.
78.
79.
80
81
82
83
84
Swan, H.W., Properties of direct
AVO hydrocarbon indicators, in
Offset-dependent reflectivity
Theory and practice of AVO
analysis, Investigations in
Geophysics Series, ed. J.P.
Castagna and M.M. Backus, S.E.G.,
1993.
Thomsen, L., Weak elastic
anisotropy, Geophysics, 51, 1954,
1986.
Tittmann, B.R., J.M. Curnow, and
R.M. Housley, Internal fr iction
quality factor Q>3100 achieved in
lunar rock 70215,85, Proc. Lunar
Sci. Co@. Gth, 3217, 1975.
Tittmann, B.R., H. Noadler, V.A.
Clark, L.A. Ahlberg, and T.W.
Spencer, Frequency dependence ofseismic attenuation in saturated
rocks, Geophys. Res. Lett., 8, 36,
1981.
Toksoz, M.N. and D.H. Johnston,
Seismic Wuve Attenuation, S.E.G.,
Geophysics Reprint Series No. 2,
1981.
Toksoz, M.N., D.H. Johnston, and
A. Timur, Attenuation of seismic
waves in dry and saturated rocks: I.
Laboratory measurements,
Geophysics, 44,681,1979.
Tosaya, C. and A. Nur, Effects ofdiagenesis and clays on
compressional velocities in rocks,
Geophys. Res. Lett., 9,) 1982.
Tutuncu, A.N. and M.M. Sharma,
The influence of fluids on grain
contact s tiffness and frame moduli
in sedimentary rocks, Geophysics,
57, 1571,1992.
Vassili ou, M., C.A. Salvado, and
B.R. Tittmann Seismic Attenuation,
in CRC Handbook of Physical
Proper ties of Rocks, Vol. III, edited
by Robert S. Carmichael, CRC
85.
86.
87.
88.
89.
90.
91.
92.
93.
94.
95.
Press, 1982.
Vernik , L. and A. Nur, Ultrasonic
velocity and anisotropy of
hydrocarbon source rocks,
Geophysics, 57,727, 1992.
Walsh, J.B., The effect of cracks on
the compressibility of rock, J.
Geophys. Res., 70,381,1965.
Wang, Z. and A. Nur, Wave
veloci ties in hydrocarbon-saturated
rocks: Experimental results,
Geophysics, 55,723, 1990.
Wang, Z. and A. Nur, Se ismic and
Acoustic Velocities in Reservoir
Rocks: Vo l. 2. Theoretical and
Model Studies, S.E.G., Geophysics
Reprint Series No. IO, 1992.
Wang, Z., A. Nur, and M. Batzle,
Acoustic velocities in petroleumoils, J. Petr. Tech., 42, 192, 1990.
Watt, J.P., G.F. Davies, and R.J.
O’Connell, Elastic properties of
composite materials, Rev. Geophys.
Space Phys., 14, 541, 1976.
White, J.E., Seismic Waves:
Radiation, Transmission and
Attenuation, McGraw-Hill, N.Y.,
302 pp., 1965.
White, J.E., Underground Sound:
Application of seismic waves,
Elsevier, Amsterdam, 253 pp.,
1983.White, J.E., Biot-Gardner theory of
extensional waves in porous rods,
Geophysics, 51,742,1986.
White, J.E., L. Martineau-Nicoletis,
and C. Monash, Measured
anisotropy in Pierre shale,
Geophysical Prospecting, 31, 709,
1983.
Wiggins, R., G.S. Kenny, and C.D.
McClure, A method for determining
and displaying the shear-velocity
reflec tivities of a geologic
formation, European Patent
96.
97.
98.
99.
100.
101.
102.
103.
104.
105.
Application 0113944, 1983.
Winkler, K.W., Frequency
dependent ultrasonic properties of
high-porosity sandstones, J.
Geophys. Res.. S&,9493,1983.
Winkler, K.W., Dispersion analysis
of veloci ty and attenuation in Berea
sandstone, J. Geophys. Res., 90,
183, 1985.
Winkler, K.W., Estimates of
velocity dispersion between seismic
and ultrasonic frequencies,
Geophysics, 51,6793,1986.
Winkler , K.W., H. Liu, and D. L.
Johnson, Permeabilit y and borehole
Stoneley waves: Comparison
between experiment and theory,
Geophys ics, 54,66, 1989.
Winkler, K. and A. Nur, Pore fluids
and seismic attenuation in rocks,
Geophys. Res. Len., 6,1, 1979.
Winkler, K.W. and A. Nur, Seismic
attenuation: Effects of pore fluids
and frictional sliding, Geophysics,
47,1,1982.
Winkler , K., A. Nur, and M.
Gladwin, Friction and seismic
attenuation in rocks, Nature, 277,
528,1979.
Wyllie, M.R.J., A.R. Gregory, and
L.W. Gardner, Elas tic wave
velocit ies in heterogeneous andporous media, Geophys ics, 22, 41,
1956.
Wyllie , M.R.J., A.R. Gregory, and
G.H.F. Gardner, An experimental
investigation of factors affecting
elastic wave velocities in porous
media, Geophysics, 23,459, 1958.
Zoeppritz, K., On the reflection and
propagation of seismic waves,
Erdbebenwellen VIIIB, Gottinger
Nachrichten, I, 66,1919.