Winding Effect on Spherical Single Layer Space Truss Domes · PDF fileKey words: Schwedler...
13
International Journal of Physical Sciences Vol. 7(16), pp. 2493 - 2505, 16 April, 2012 Available online at http://www.academicjournals.org/IJPS DOI: 10.5897/IJPS11.180 ISSN 1992 - 1950 ©2012 Academic Journals Full Length Research Paper Effect of wind loading on spherical single layer space truss steel domes Alireza Fiouz* and Mohammad Ebrahim Karbaschi Department of Civil Engineering, Persian Gulf University, Bushehr, Iran. Accepted 6 February, 2012 The use of space truss steel domes has been a popular choice for covering large span areas with or without internal columns. High structural stiffness and architectural aesthetics are the main reasons for the wide application of this space truss form. Using formex algebra, the geometry of ribbed and Schwedler single layer space truss domes for various rise-to-span ratios (with a constant span) are modeled. Wind pressure, according to the American National Standards Institute (ANSI) code and the European Convention for Constructional Steelwork (ECCS) are applied to the surfaces of the models. To investigate the effect of wind load when compared with other loads, the uniform dead load applied on models and the results of the analyses in the fields of the node displacement, support reaction, overturning moment and sliding of foundation were compared with each other. Key words: Schwedler domes, single layer space truss dome, formex algebra, ribbed domes, wind pressure. INTRODUCTION Space trusses are a popular choice when covering large span areas without internal columns. Barrel-vault, hypar and domical shapes are various forms of space trusses. Compared to the others, domes have great architectural aesthetics and structural stiffness. Space truss domes can be applied in two forms: a single layer or a double layer. The main difference between the two forms lies in the type of stresses induced in their members. In a double layer, the members mainly operate axially, and in a single layer, the members experience a combination of axial loading and bending. In previous research, the effects of various types of loading, such as thermal and seismic loading, have been investigated for single and double layer space truss domes (Alinia and Kashizadeh, 2006a, b; Kato and Murta, 1997; Kato et al., 1997). However, the effect of wind loading has received less attention. The main complexities in analyzing the application of a wind load to curved space trusses are the inclusion of the three- dimensional form of their members in space and the complex distribution of wind pressure on their surfaces. *Corresponding author. E-mail: [email protected]. Generally, investigations of wind effects on space trusses can be divided into two main groups. In the first group, pressure contour lines on the surfaces of space trusses are determined using a wind tunnel test. For example, Dutt performed wind tunnel tests for various complex forms including pyramidal roofs and multiple hyperbolic paraboloid shell roofs (Dutt, 1985, 1986, 1987). In the next group, the response of space trusses under wind loading is investigated using analytical modeling. Harakat (2001) investigated both lamella-type and Schwedler-type domes under many alternative systems of loading. Various rise-to-span ratios with a constant span were investigated as one parameter. Auta and Maslennikov (2006) and Auta (2006) carried out analyses of tall buildings under excitation by a wind load, taking into account the effects of pulsation. Wind velocity-time graphs were employed for which the change in wind pressure (pulsation) with time was assumed to be proportional to a similar change in wind velocity. Vesmawala et al. (2009) obtained pressure contour lines on the surface of space truss domes with various rise-to-span ratios via numerical modeling using ABAQUS software. They then determine pressure contour lines on the dome’s surface using a neural
Transcript of Winding Effect on Spherical Single Layer Space Truss Domes · PDF fileKey words: Schwedler...
International Journal of Physical Sciences Vol. 7(16), pp. 2493 - 2505, 16 April, 2012 Available online at http://www.academicjournals.org/IJPS DOI: 10.5897/IJPS11.180 ISSN 1992 - 1950 ©2012 Academic Journals
Full Length Research Paper
Effect of wind loading on spherical single layer space truss steel domes
Alireza Fiouz* and Mohammad Ebrahim Karbaschi
Department of Civil Engineering, Persian Gulf University, Bushehr, Iran.
Accepted 6 February, 2012
The use of space truss steel domes has been a popular choice for covering large span areas with or without internal columns. High structural stiffness and architectural aesthetics are the main reasons for the wide application of this space truss form. Using formex algebra, the geometry of ribbed and Schwedler single layer space truss domes for various rise-to-span ratios (with a constant span) are modeled. Wind pressure, according to the American National Standards Institute (ANSI) code and the European Convention for Constructional Steelwork (ECCS) are applied to the surfaces of the models. To investigate the effect of wind load when compared with other loads, the uniform dead load applied on models and the results of the analyses in the fields of the node displacement, support reaction, overturning moment and sliding of foundation were compared with each other. Key words: Schwedler domes, single layer space truss dome, formex algebra, ribbed domes, wind pressure.
INTRODUCTION Space trusses are a popular choice when covering large span areas without internal columns. Barrel-vault, hypar and domical shapes are various forms of space trusses. Compared to the others, domes have great architectural aesthetics and structural stiffness. Space truss domes can be applied in two forms: a single layer or a double layer. The main difference between the two forms lies in the type of stresses induced in their members. In a double layer, the members mainly operate axially, and in a single layer, the members experience a combination of axial loading and bending.
In previous research, the effects of various types of loading, such as thermal and seismic loading, have been investigated for single and double layer space truss domes (Alinia and Kashizadeh, 2006a, b; Kato and Murta, 1997; Kato et al., 1997). However, the effect of wind loading has received less attention. The main complexities in analyzing the application of a wind load to curved space trusses are the inclusion of the three-dimensional form of their members in space and the complex distribution of wind pressure on their surfaces. *Corresponding author. E-mail: [email protected].
Generally, investigations of wind effects on space trusses can be divided into two main groups.
In the first group, pressure contour lines on the surfaces of space trusses are determined using a wind tunnel test. For example, Dutt performed wind tunnel tests for various complex forms including pyramidal roofs and multiple hyperbolic paraboloid shell roofs (Dutt, 1985, 1986, 1987). In the next group, the response of space trusses under wind loading is investigated using analytical modeling.
Harakat (2001) investigated both lamella-type and Schwedler-type domes under many alternative systems of loading. Various rise-to-span ratios with a constant span were investigated as one parameter. Auta and Maslennikov (2006) and Auta (2006) carried out analyses of tall buildings under excitation by a wind load, taking into account the effects of pulsation. Wind velocity-time graphs were employed for which the change in wind pressure (pulsation) with time was assumed to be proportional to a similar change in wind velocity.
Vesmawala et al. (2009) obtained pressure contour lines on the surface of space truss domes with various rise-to-span ratios via numerical modeling using ABAQUS software. They then determine pressure contour lines on the dome’s surface using a neural
2494 Int. J. Phys. Sci.
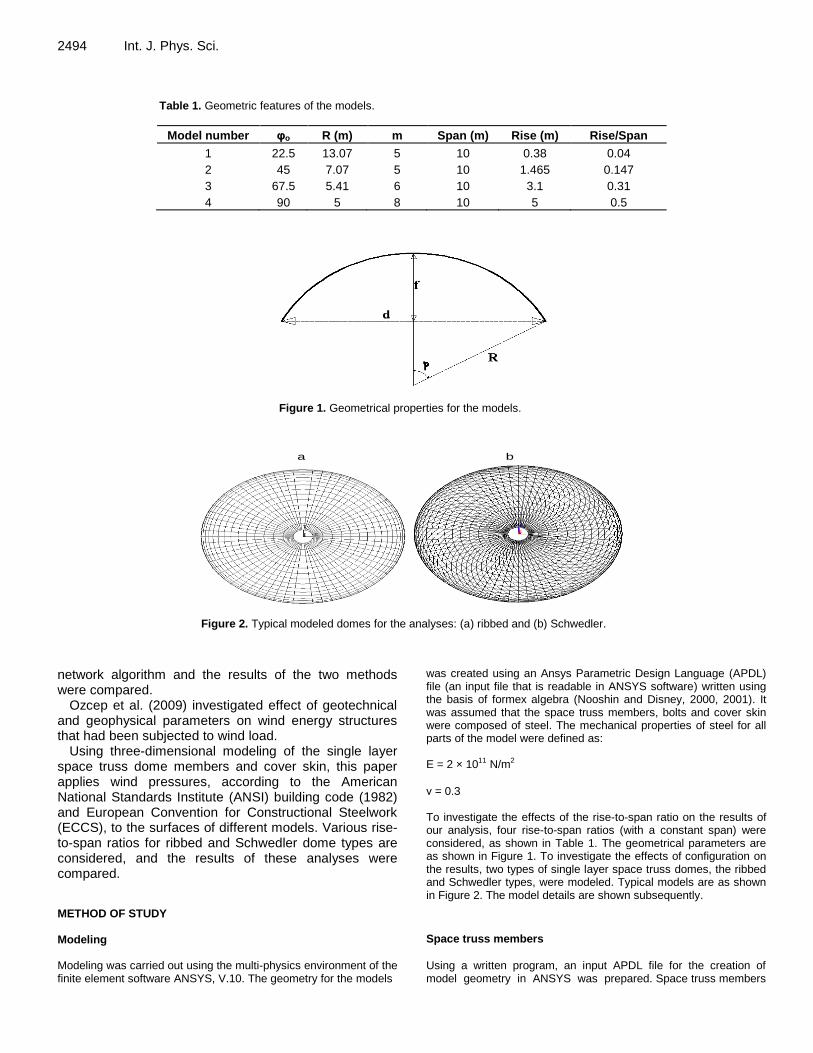
Table 1. Geometric features of the models.
Model number φo R (m) m Span (m) Rise (m) Rise/Span
1 22.5 13.07 5 10 0.38 0.04
2 45 7.07 5 10 1.465 0.147
3 67.5 5.41 6 10 3.1 0.31
4 90 5 8 10 5 0.5
Figure 1. Geometrical properties for the models.
a b
Figure 2. Typical modeled domes for the analyses: (a) ribbed and (b) Schwedler.
network algorithm and the results of the two methods were compared.
Ozcep et al. (2009) investigated effect of geotechnical and geophysical parameters on wind energy structures that had been subjected to wind load.
Using three-dimensional modeling of the single layer space truss dome members and cover skin, this paper applies wind pressures, according to the American National Standards Institute (ANSI) building code (1982) and European Convention for Constructional Steelwork (ECCS), to the surfaces of different models. Various rise-to-span ratios for ribbed and Schwedler dome types are considered, and the results of these analyses were compared.
METHOD OF STUDY Modeling Modeling was carried out using the multi-physics environment of the finite element software ANSYS, V.10. The geometry for the models
was created using an Ansys Parametric Design Language (APDL) file (an input file that is readable in ANSYS software) written using the basis of formex algebra (Nooshin and Disney, 2000, 2001). It was assumed that the space truss members, bolts and cover skin were composed of steel. The mechanical properties of steel for all parts of the model were defined as: E = 2 × 10¹¹ N/m2
ν = 0.3 To investigate the effects of the rise-to-span ratio on the results of our analysis, four rise-to-span ratios (with a constant span) were considered, as shown in Table 1. The geometrical parameters are as shown in Figure 1. To investigate the effects of configuration on the results, two types of single layer space truss domes, the ribbed and Schwedler types, were modeled. Typical models are as shown in Figure 2. The model details are shown subsequently.
Space truss members
Using a written program, an input APDL file for the creation of model geometry in ANSYS was prepared. Space truss members
Fiouz and Karbaschi 2495
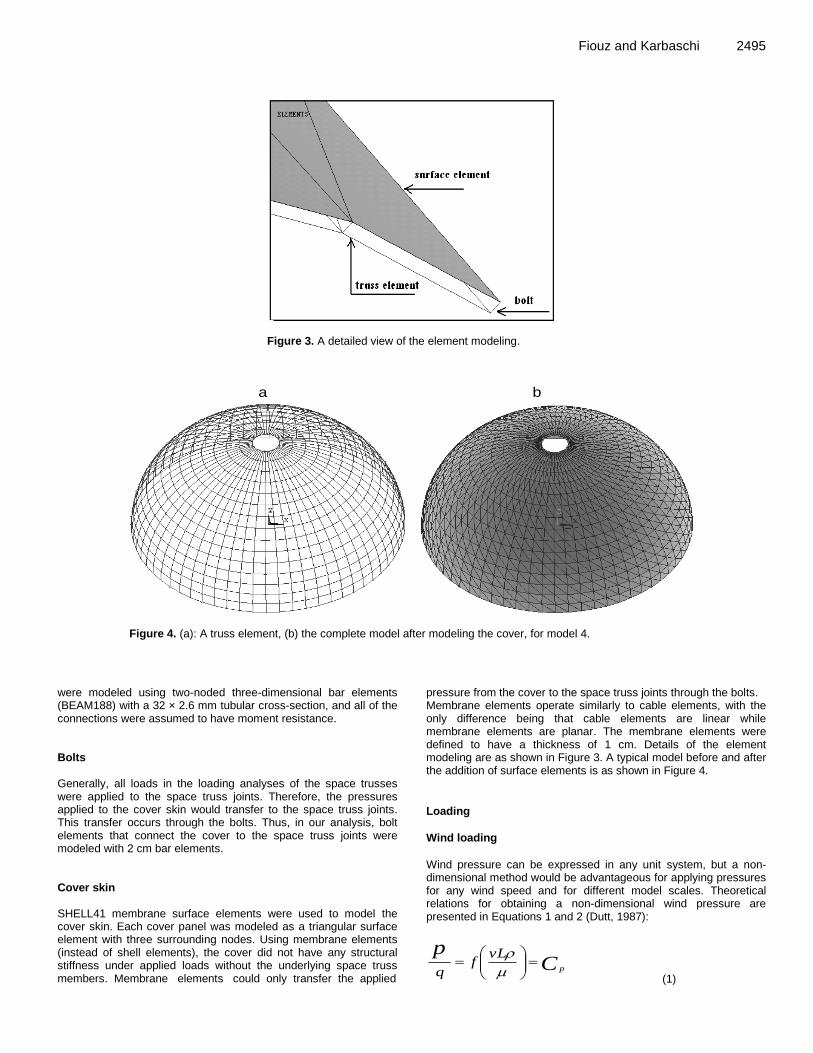
Figure 3. A detailed view of the element modeling.
a b
Figure 4. (a): A truss element, (b) the complete model after modeling the cover, for model 4.
were modeled using two-noded three-dimensional bar elements (BEAM188) with a 32 × 2.6 mm tubular cross-section, and all of the connections were assumed to have moment resistance. Bolts Generally, all loads in the loading analyses of the space trusses were applied to the space truss joints. Therefore, the pressures applied to the cover skin would transfer to the space truss joints. This transfer occurs through the bolts. Thus, in our analysis, bolt elements that connect the cover to the space truss joints were modeled with 2 cm bar elements. Cover skin SHELL41 membrane surface elements were used to model the cover skin. Each cover panel was modeled as a triangular surface element with three surrounding nodes. Using membrane elements (instead of shell elements), the cover did not have any structural stiffness under applied loads without the underlying space truss members. Membrane elements could only transfer the applied
pressure from the cover to the space truss joints through the bolts. Membrane elements operate similarly to cable elements, with the only difference being that cable elements are linear while membrane elements are planar. The membrane elements were defined to have a thickness of 1 cm. Details of the element modeling are as shown in Figure 3. A typical model before and after the addition of surface elements is as shown in Figure 4.
Loading
Wind loading
Wind pressure can be expressed in any unit system, but a non-dimensional method would be advantageous for applying pressures for any wind speed and for different model scales. Theoretical relations for obtaining a non-dimensional wind pressure are presented in Equations 1 and 2 (Dutt, 1987):
Cp
p
vLf
q
(1)
2496 Int. J. Phys. Sci.
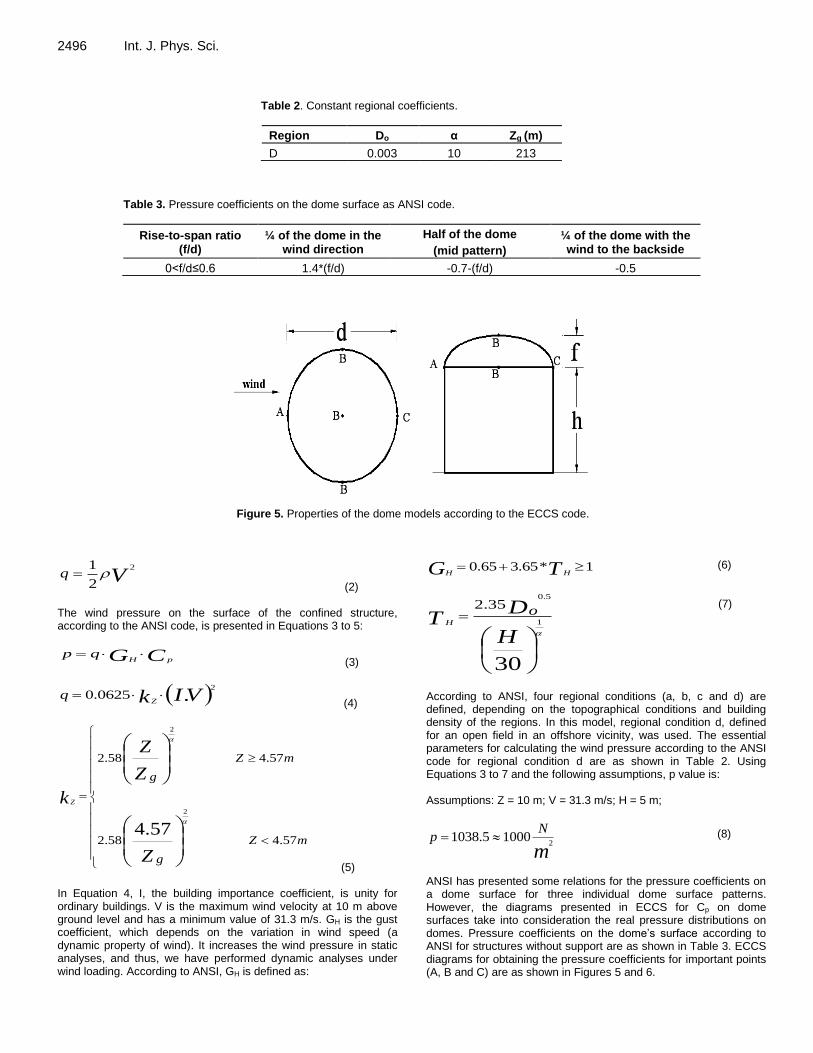
Table 2. Constant regional coefficients.
Region Do α Zg (m)
D 0.003 10 213
Table 3. Pressure coefficients on the dome surface as ANSI code.
Rise-to-span ratio (f/d)
¼ of the dome in the wind direction
Half of the dome
(mid pattern)
¼ of the dome with the wind to the backside
0<f/d≤0.6 1.4*(f/d) -0.7-(f/d) -0.5
Figure 5. Properties of the dome models according to the ECCS code.
Vq2
2
1
(2) The wind pressure on the surface of the confined structure, according to the ANSI code, is presented in Equations 3 to 5:
CG pHqp
(3)
VIkZq .
2
0625.0 (4)
mZ
g
mZ
g
Z
Z
Z
k Z
57.458.2
57.458.2
57.4
2
2
(5) In Equation 4, I, the building importance coefficient, is unity for ordinary buildings. V is the maximum wind velocity at 10 m above ground level and has a minimum value of 31.3 m/s. GH is the gust coefficient, which depends on the variation in wind speed (a dynamic property of wind). It increases the wind pressure in static analyses, and thus, we have performed dynamic analyses under wind loading. According to ANSI, GH is defined as:
1*65.365.0 TG HH (6)
30
1
5.0
35.2
H
DT
oH
(7)
According to ANSI, four regional conditions (a, b, c and d) are defined, depending on the topographical conditions and building density of the regions. In this model, regional condition d, defined for an open field in an offshore vicinity, was used. The essential parameters for calculating the wind pressure according to the ANSI code for regional condition d are as shown in Table 2. Using Equations 3 to 7 and the following assumptions, p value is: Assumptions: Z = 10 m; V = 31.3 m/s; H = 5 m;
m
Np
210005.1038 (8)
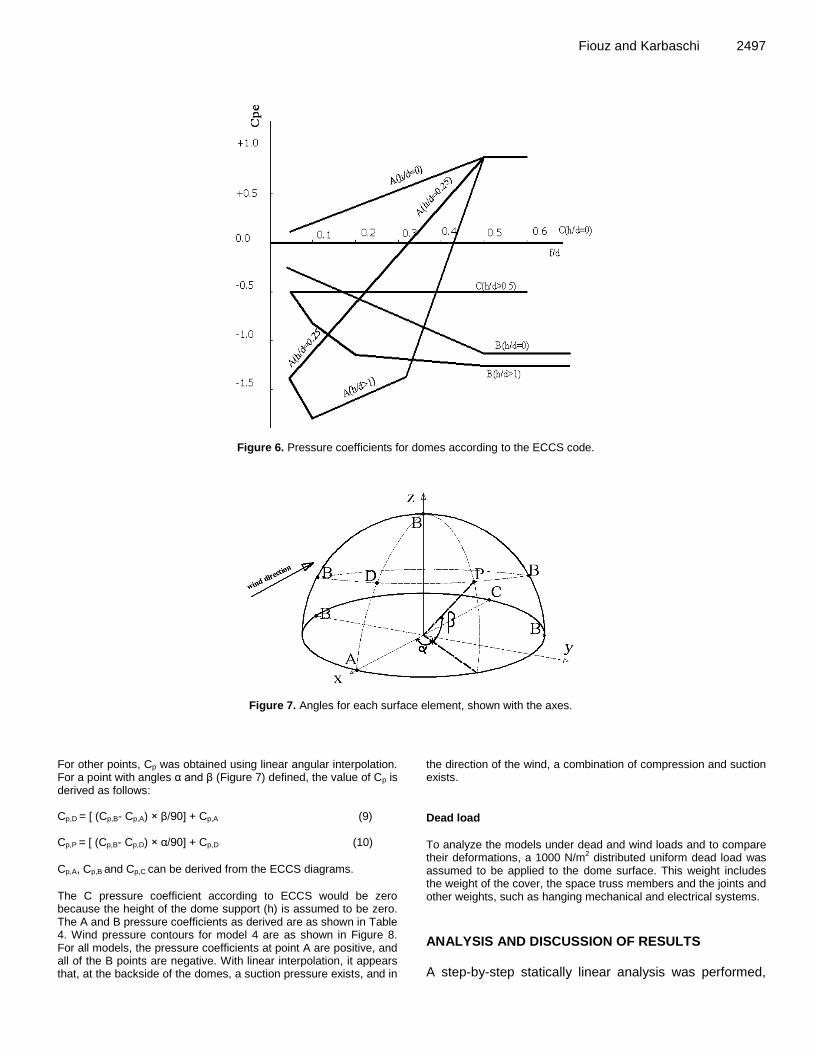
ANSI has presented some relations for the pressure coefficients on a dome surface for three individual dome surface patterns. However, the diagrams presented in ECCS for Cp on dome surfaces take into consideration the real pressure distributions on domes. Pressure coefficients on the dome’s surface according to ANSI for structures without support are as shown in Table 3. ECCS diagrams for obtaining the pressure coefficients for important points (A, B and C) are as shown in Figures 5 and 6.
Fiouz and Karbaschi 2497
Figure 6. Pressure coefficients for domes according to the ECCS code.
Figure 7. Angles for each surface element, shown with the axes.
For other points, Cp was obtained using linear angular interpolation. For a point with angles α and β (Figure 7) defined, the value of Cp is derived as follows: Cp,D = [ (Cp,B- Cp,A) × β/90] + Cp,A (9) Cp,P = [ (Cp,B- Cp,D) × α/90] + Cp,D (10)
Cp,A, Cp,B and Cp,C can be derived from the ECCS diagrams.
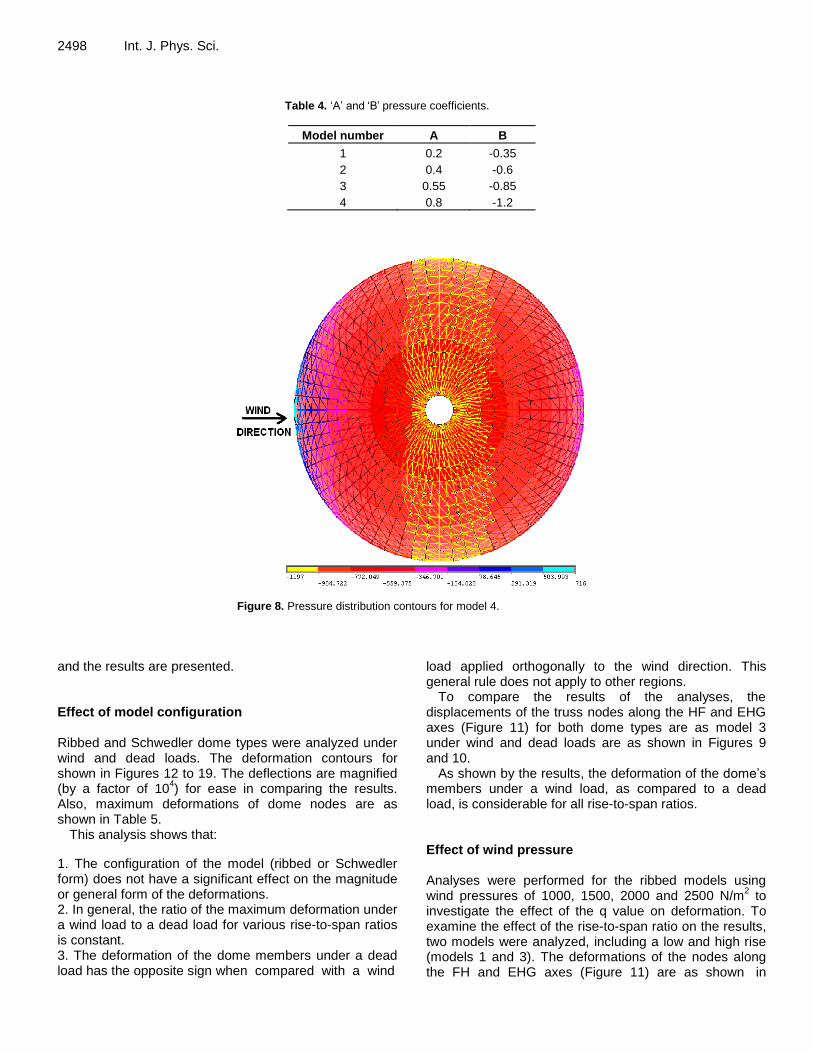
The C pressure coefficient according to ECCS would be zero because the height of the dome support (h) is assumed to be zero. The A and B pressure coefficients as derived are as shown in Table 4. Wind pressure contours for model 4 are as shown in Figure 8. For all models, the pressure coefficients at point A are positive, and all of the B points are negative. With linear interpolation, it appears that, at the backside of the domes, a suction pressure exists, and in
the direction of the wind, a combination of compression and suction exists.
Dead load
To analyze the models under dead and wind loads and to compare their deformations, a 1000 N/m2 distributed uniform dead load was assumed to be applied to the dome surface. This weight includes the weight of the cover, the space truss members and the joints and other weights, such as hanging mechanical and electrical systems.
ANALYSIS AND DISCUSSION OF RESULTS A step-by-step statically linear analysis was performed,
2498 Int. J. Phys. Sci.
Table 4. ‘A’ and ‘B’ pressure coefficients.
Model number A B
1 0.2 -0.35
2 0.4 -0.6
3 0.55 -0.85
4 0.8 -1.2
Figure 8. Pressure distribution contours for model 4.
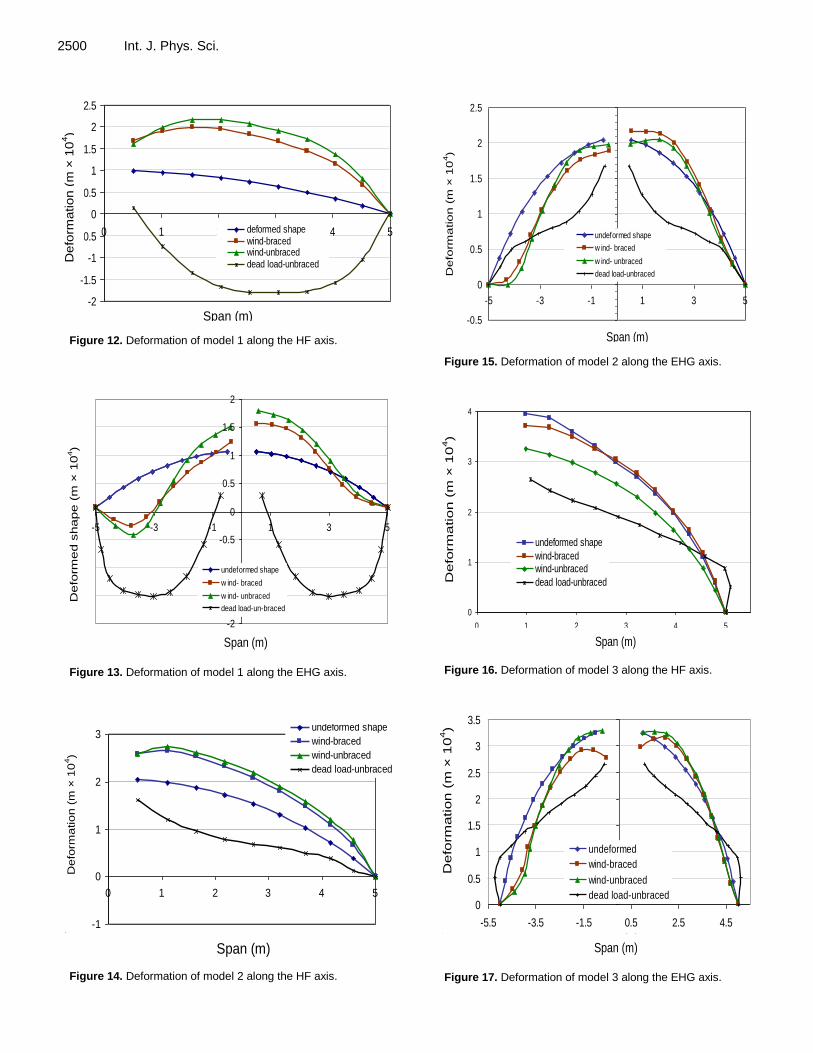
and the results are presented. Effect of model configuration Ribbed and Schwedler dome types were analyzed under wind and dead loads. The deformation contours for shown in Figures 12 to 19. The deflections are magnified (by a factor of 10
4) for ease in comparing the results.
Also, maximum deformations of dome nodes are as shown in Table 5.
This analysis shows that:
1. The configuration of the model (ribbed or Schwedler form) does not have a significant effect on the magnitude or general form of the deformations. 2. In general, the ratio of the maximum deformation under a wind load to a dead load for various rise-to-span ratios is constant. 3. The deformation of the dome members under a dead load has the opposite sign when compared with a wind
load applied orthogonally to the wind direction. This general rule does not apply to other regions.
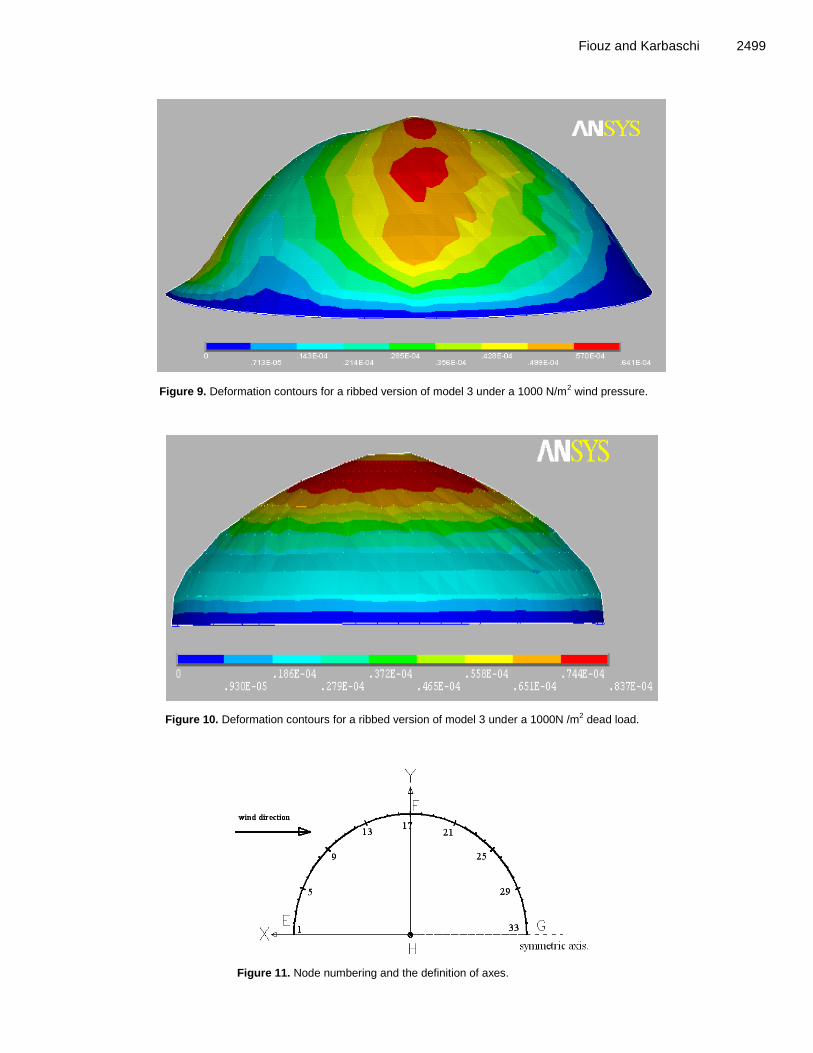
To compare the results of the analyses, the displacements of the truss nodes along the HF and EHG axes (Figure 11) for both dome types are as model 3 under wind and dead loads are as shown in Figures 9 and 10.
As shown by the results, the deformation of the dome’s members under a wind load, as compared to a dead load, is considerable for all rise-to-span ratios. Effect of wind pressure Analyses were performed for the ribbed models using wind pressures of 1000, 1500, 2000 and 2500 N/m
2 to
investigate the effect of the q value on deformation. To examine the effect of the rise-to-span ratio on the results, two models were analyzed, including a low and high rise (models 1 and 3). The deformations of the nodes along the FH and EHG axes (Figure 11) are as shown in
Fiouz and Karbaschi 2499
Figure 9. Deformation contours for a ribbed version of model 3 under a 1000 N/m2 wind pressure.
Figure 10. Deformation contours for a ribbed version of model 3 under a 1000N /m2 dead load.
Figure 11. Node numbering and the definition of axes.
2500 Int. J. Phys. Sci.
-2
-1.5
-1
-0.5
0
0.5
1
1.5
2
2.5
0 1 2 3 4 5
span (m)
defo
rm
ati
on
(m
x10^
4)
deformed shapewind-bracedwind-unbraceddead load-unbraced
De
form
atio
n (
m ×
10
4)
Span (m)
Figure 12. Deformation of model 1 along the HF axis.
-2
-1.5
-1
-0.5
0
0.5
1
1.5
2
-5 -3 -1 1 3 5
spane (m)
defr
med
sh
ap
e (
mx10^
4)
undeformed shape
w ind- braced
w ind- unbraced
dead load-un-braced
D
efo
rmed s
hape (
m ×
10
4)
Span (m)
Figure 13. Deformation of model 1 along the EHG axis.
-1
0
1
2
3
0 1 2 3 4 5
span (m)
de
form
ati
on
(m
x1
0^
4)
undeformed shape
wind-braced
wind-unbraced
dead load-unbraced
D
efo
rmed s
hape (
m ×
10
4)
Span (m)
Defo
rma
tio
n (
m ×
10
4)
Figure 14. Deformation of model 2 along the HF axis.
-0.5
0
0.5
1
1.5
2
2.5
-5 -3 -1 1 3 5
span (m)
defo
rmati
on
(m
x10^4)
undeformed shape
w ind- braced
w ind- unbraced
dead load-unbraced
Span (m)
Defo
rmed
sh
ap
e (
m ×
10
4)
D
efo
rma
tio
n (
m ×
10
4)
Figure 15. Deformation of model 2 along the EHG axis.
0
1
2
3
4
0 1 2 3 4 5span (m)
defo
rm
ati
on
(m
x10^
4)
undeformed shape
wind-bracedwind-unbraced
dead load-unbraced
Span (m)
De
form
atio
n (
m ×
10
4)
Figure 16. Deformation of model 3 along the HF axis.
0
0.5
1
1.5
2
2.5
3
3.5
-5.5 -3.5 -1.5 0.5 2.5 4.5
span (m)
defo
rm
ati
on
(m
x10^
4)
undeformed
wind-braced
wind-unbraced
dead load-unbraced
De
form
ation
(m
× 1
04)
Span (m)
Figure 17. Deformation of model 3 along the EHG axis.
0
1
2
3
4
5
6
0 1 2 3 4 5 6span (m)
defo
rm
atio
n (
mx10^4)
undeformed shapewind-bracedwind-unbraceddead load-unbraced
3
D
efo
rma
tio
n (
m ×
10
4)
Span (m)
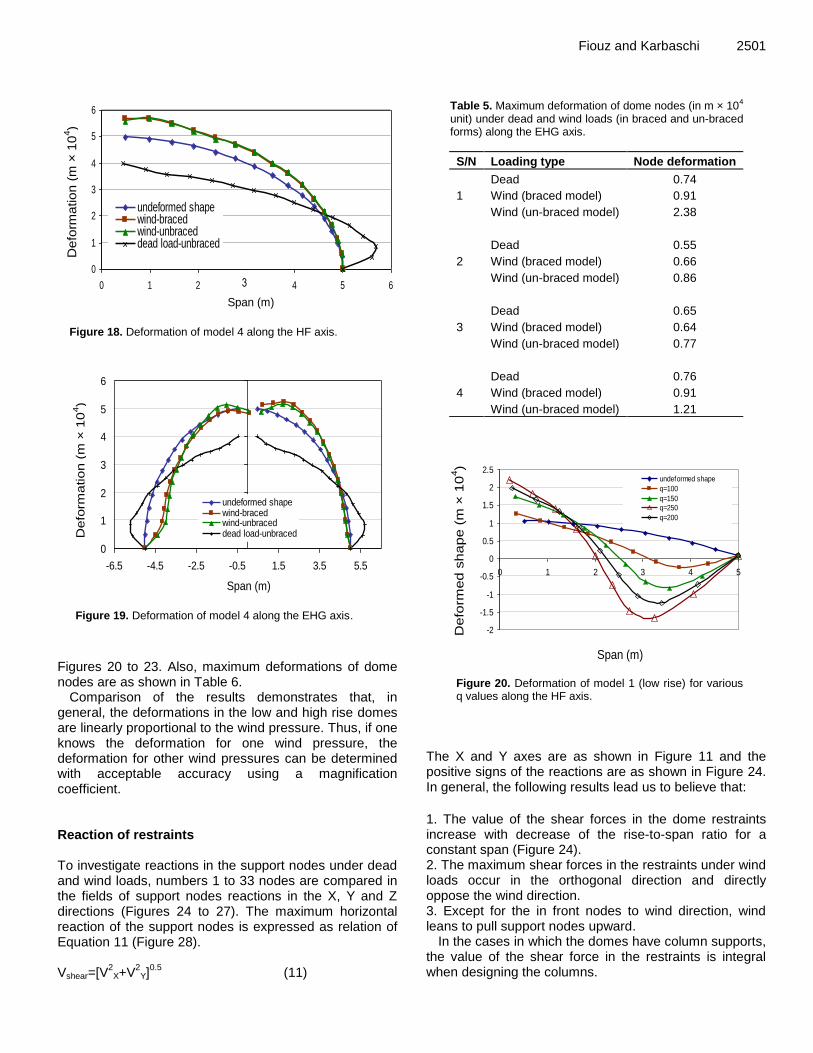
Figure 18. Deformation of model 4 along the HF axis.
0
1
2
3
4
5
6
-6.5 -4.5 -2.5 -0.5 1.5 3.5 5.5span(m)
defo
rmati
on
(m
x10^
4)
undeformed shapewind-bracedwind-unbraceddead load-unbraced
De
form
atio
n (
m ×
10
4)
Span (m)
Figure 19. Deformation of model 4 along the EHG axis.
Figures 20 to 23. Also, maximum deformations of dome nodes are as shown in Table 6.
Comparison of the results demonstrates that, in general, the deformations in the low and high rise domes are linearly proportional to the wind pressure. Thus, if one knows the deformation for one wind pressure, the deformation for other wind pressures can be determined with acceptable accuracy using a magnification coefficient. Reaction of restraints To investigate reactions in the support nodes under dead and wind loads, numbers 1 to 33 nodes are compared in the fields of support nodes reactions in the X, Y and Z directions (Figures 24 to 27). The maximum horizontal reaction of the support nodes is expressed as relation of Equation 11 (Figure 28). Vshear=[V
2X+V
2Y]
0.5 (11)
Fiouz and Karbaschi 2501
Table 5. Maximum deformation of dome nodes (in m × 104 unit) under dead and wind loads (in braced and un-braced forms) along the EHG axis.
S/N Loading type Node deformation
1
Dead 0.74
Wind (braced model) 0.91
Wind (un-braced model) 2.38
2
Dead 0.55
Wind (braced model) 0.66
Wind (un-braced model) 0.86
3
Dead 0.65
Wind (braced model) 0.64
Wind (un-braced model) 0.77
4
Dead 0.76
Wind (braced model) 0.91
Wind (un-braced model) 1.21
-2
-1.5
-1
-0.5
0
0.5
1
1.5
2
2.5
0 1 2 3 4 5
spane (m)
defr
med
sh
ap
e (
mx10^4)
undeformed shape
q=100
q=150
q=250
q=200
Defo
rmed
sh
ap
e (
m ×
10
4)
Span (m)
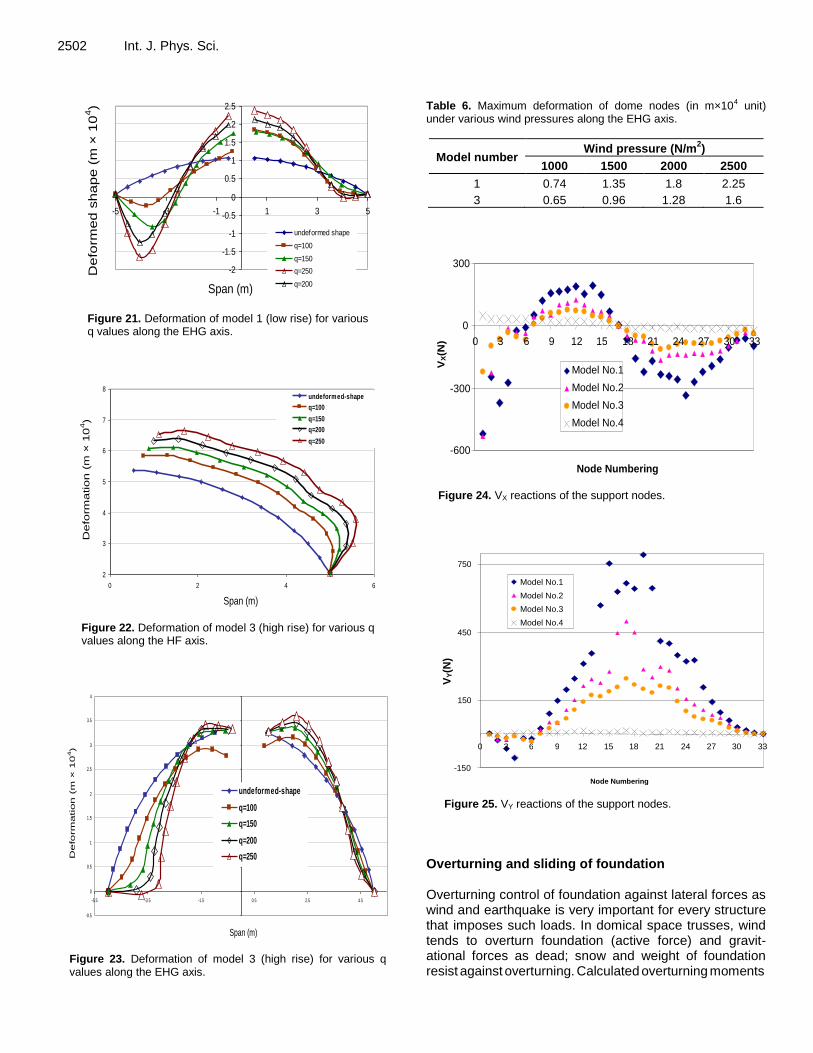
Figure 20. Deformation of model 1 (low rise) for various q values along the HF axis.
The X and Y axes are as shown in Figure 11 and the positive signs of the reactions are as shown in Figure 24. In general, the following results lead us to believe that:
1. The value of the shear forces in the dome restraints increase with decrease of the rise-to-span ratio for a constant span (Figure 24). 2. The maximum shear forces in the restraints under wind loads occur in the orthogonal direction and directly oppose the wind direction. 3. Except for the in front nodes to wind direction, wind leans to pull support nodes upward.
In the cases in which the domes have column supports, the value of the shear force in the restraints is integral when designing the columns.
2502 Int. J. Phys. Sci.
-2
-1.5
-1
-0.5
0
0.5
1
1.5
2
2.5
-5 -3 -1 1 3 5
spane (m)
defr
med
sh
ap
e (
mx10^4)
undeformed shape
q=100
q=150
q=250
q=200
Defo
rmed
sh
ap
e (
m ×
10
4)
Span (m)
Figure 21. Deformation of model 1 (low rise) for various q values along the EHG axis.
2
3
4
5
6
7
8
0 2 4 6
span (m)
defo
rm
ati
on
(m
x10^4)
undeformed-shape
q=100
q=150
q=200
q=250
D
efo
rma
tio
n (
m ×
10
4)
Span (m)
Figure 22. Deformation of model 3 (high rise) for various q values along the HF axis.
-0.5
0
0.5
1
1.5
2
2.5
3
3.5
4
-5.5 -3.5 -1.5 0.5 2.5 4.5
span (m)
defo
rm
atio
n (
mx10^4)
undeformed-shape
q=100
q=150
q=200
q=250
Span (m)
Defo
rm
ation
(m
× 1
04)
Figure 23. Deformation of model 3 (high rise) for various q values along the EHG axis.
Table 6. Maximum deformation of dome nodes (in m×104 unit) under various wind pressures along the EHG axis.
Model number Wind pressure (N/m
2)
1000 1500 2000 2500
1 0.74 1.35 1.8 2.25
3 0.65 0.96 1.28 1.6
-600
-300
0
300
0 3 6 9 12 15 18 21 24 27 30 33
Node Numbering
VX(N
)
)
Model No.1
Model No.2
Model No.3
Model No.4
Figure 24. VX reactions of the support nodes.
-150
150
450
750
0 3 6 9 12 15 18 21 24 27 30 33
Node Numbering
VY(N
)
Model No.1 Model No.2 Model No.3 Model No.4
Figure 25. VY reactions of the support nodes.
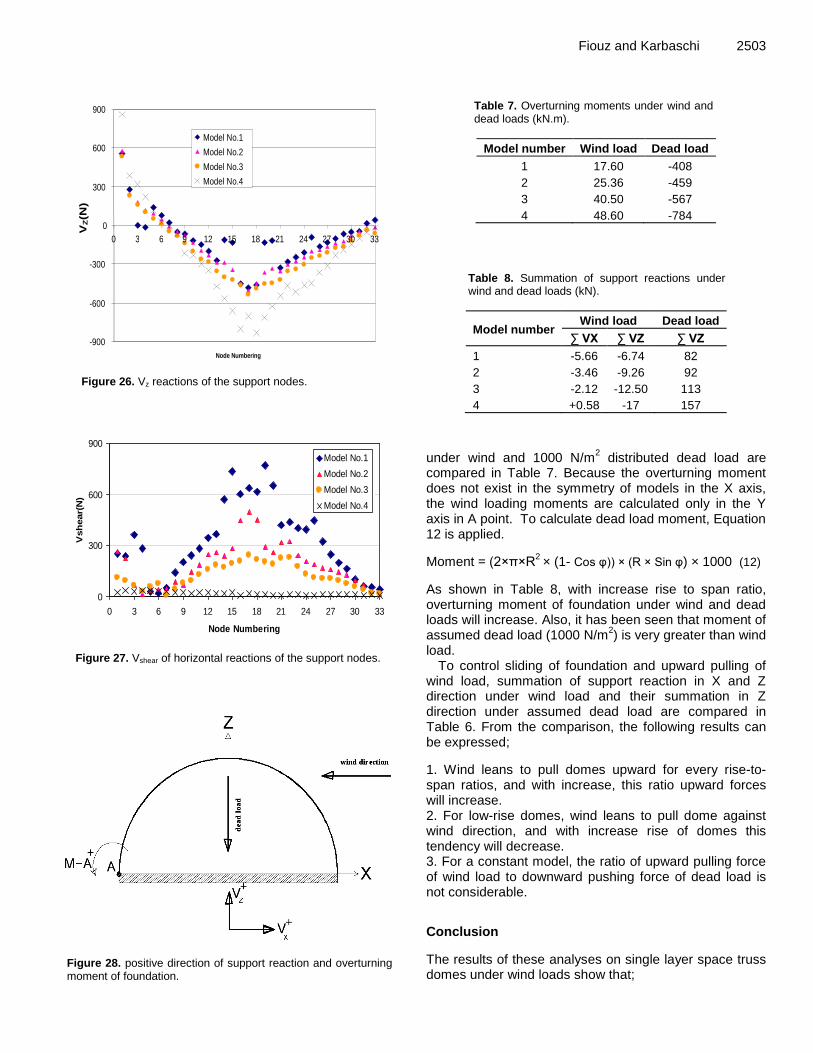
Overturning and sliding of foundation Overturning control of foundation against lateral forces as wind and earthquake is very important for every structure that imposes such loads. In domical space trusses, wind tends to overturn foundation (active force) and gravit-ational forces as dead; snow and weight of foundation resist against overturning. Calculated overturning moments
-900
-600
-300
0
300
600
900
0 3 6 9 12 15 18 21 24 27 30 33
Node Numbering
VZ(N
)
Model No.1 Model No.2 Model No.3 Model No.4
Figure 26. Vz reactions of the support nodes.
0
300
600
900
0 3 6 9 12 15 18 21 24 27 30 33
Node Numbering
Vsh
ear(
N)
Model No.1
Model No.2
Model No.3
Model No.4
Figure 27. Vshear of horizontal reactions of the support nodes.
Figure 28. positive direction of support reaction and overturning moment of foundation.
Fiouz and Karbaschi 2503
Table 7. Overturning moments under wind and dead loads (kN.m).
Model number Wind load Dead load
1 17.60 -408
2 25.36 -459
3 40.50 -567
4 48.60 -784
Table 8. Summation of support reactions under wind and dead loads (kN).
Model number Wind load Dead load
∑ VX ∑ VZ ∑ VZ
1 -5.66 -6.74 82
2 -3.46 -9.26 92
3 -2.12 -12.50 113
4 +0.58 -17 157
under wind and 1000 N/m2 distributed dead load are
compared in Table 7. Because the overturning moment does not exist in the symmetry of models in the X axis, the wind loading moments are calculated only in the Y axis in A point. To calculate dead load moment, Equation 12 is applied.
Moment = (2×π×R2
× (1- Cos φ)) × (R × Sin φ) × 1000 (12)
As shown in Table 8, with increase rise to span ratio, overturning moment of foundation under wind and dead loads will increase. Also, it has been seen that moment of assumed dead load (1000 N/m
2) is very greater than wind
load. To control sliding of foundation and upward pulling of
wind load, summation of support reaction in X and Z direction under wind load and their summation in Z direction under assumed dead load are compared in Table 6. From the comparison, the following results can be expressed;
1. Wind leans to pull domes upward for every rise-to-span ratios, and with increase, this ratio upward forces will increase. 2. For low-rise domes, wind leans to pull dome against wind direction, and with increase rise of domes this tendency will decrease. 3. For a constant model, the ratio of upward pulling force of wind load to downward pushing force of dead load is not considerable.
Conclusion
The results of these analyses on single layer space truss domes under wind loads show that;
2504 Int. J. Phys. Sci. 1. The configuration (either a ribbed or Schwedler form) does not have a significant effect on the deformation of the models. 2. In low and high rise domes, the deformations are linearly proportional to the wind pressure. 3. Wind load leans to pull dome in up-ward direction, and with increase rise-to-span ratio, its value will increase. 4. The maximum shear force in the dome support nodes is expected to decrease considerably with an increase in the rise-to-span ratio for a constant span. 5. Wind load leans to induce overturning moment in foundation and its value will decrease with increase rise-to-span ratio of domes. 6. Wind load will induce sliding shear forces in the foundation of domes that for low-rise cases its direction is in the oppose direction of wind direction and for high-rise cases it is in its direction. Nomenclature: Cp, Effective pressure coefficient; q, wind pressure; p, effective wind pressure on the structure; R, dome radius; φ, internal angle of the partial dome; d, dome span; f, dome rise; g, gravitational acceleration; E,
elasticity modulus; , Poisson’s ratio; h, dome support height; m, number of divisions in height; ρ, density of air; μ, viscosity of air; V, wind speed; f, no-scale coefficient; L, linear scale coefficient; H, mean dome height from ground; GH, gust coefficient; Z, dome height. REFERENCES Alinia MM, Kashizadeh S (2006a). Effect of flexibility of substructures
upon thermal behavior of spherical double layer space truss domes. Part I: Uniform thermal loading. J. Constructional Steel Res., 62: 359-368.
Alinia MM, Kashizadeh S (2006b). Effect of flexibility of substructures upon thermal behavior of spherical double layer space truss domes. Part II: Gradient & partial loading. J. Constructional Steel Res., 62: 675-681.
American National Standard (1982). Minimum Design Loads for Buildings and other Structures. ANSI A58.1. Ansys Gui Help Manuals, Ansys, p. 11.
Auta SM (2006). Wind load estimation on tall building part II: comparison of Russian and Nigerian codes of practice. Asian J. Civil Eng., 7: 517-524.
Auta SM, Maslennikov AM (2006). Dynamic analysis of tall building under Pulsation wind excitation. Asian J. Civil Eng., 7: 95-104.
Dutt AJ (1985). Wind loading on a pyramidal roof structure. J. Space
Structure, 1: 105-110. Dutt AJ (1986). Wind pressure distribution on multiple hyperbolic
paraboloid shell roof building. Space Structure, 2: 49-54. Dutt AJ (1987). Wind loading on a ‘saw tooth’ multiple hyperbolic
paraboloid shell roof. Space Structure, 2: 43-50. Ozcep F, Guzel M, Kepekci D, Laman M, Bozdag S, Cetin H, Akat A
(2009). Geotechnical and geophysical studies for wind energy systems in earthquake-prone areas: Bahce (Osmaniye, Turkey) case. Int. J. Phy. Sci., 4(10): 555–561.
Harakat M (2001). Optimization of space bar structures alternatively loaded using decomposition method. Ph. D. Thesis in Civil Eng. Warsaw University of Technology.
Kato S, Murta M (1997). Dynamic elastoplastic buckling simulation system for single layer reticular domes with semi-rigid connections under multiple loading. Int. J. Space Structures, 12: 161-72.
Kato S, Ueki T, Mukayama Y (1997). Study of dynamic collapse of single layer reticular domes subjected to earthquake motion and estimation of equivalent seismic forces. Int. J. Space Structures, 12: 191-203.
Nooshin H, Disney P, Yamamoto C (2001). FORMIAN. Second Edition, Multi Science Publishers.
Nooshin H, Disney P (2000). Formex configuration processing 1. Int. J. Space Structure. 15: 1-52.
Vesmawala GR, Desai JA, Patil HS (2009). Wind pressure coefficients prediction on different span to height ratio domes using artificial neural networks. Asian J. Civil Eng., 10: 131-144.
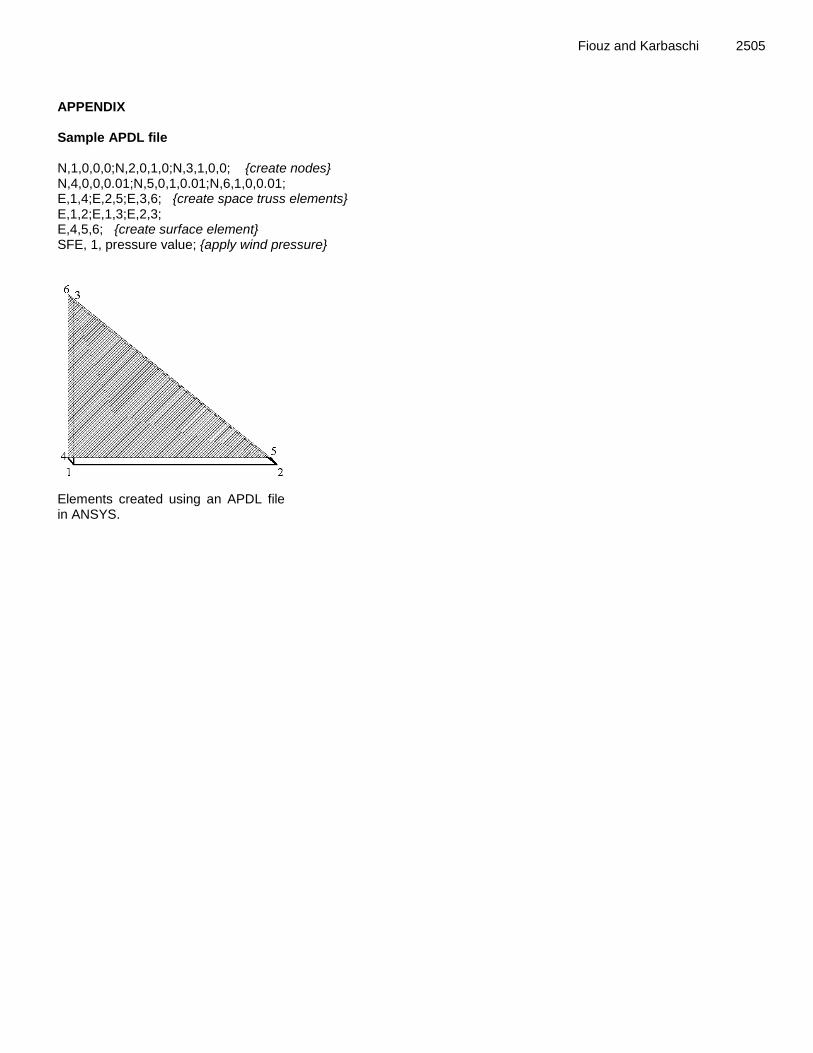
APPENDIX Sample APDL file N,1,0,0,0;N,2,0,1,0;N,3,1,0,0; {create nodes} N,4,0,0,0.01;N,5,0,1,0.01;N,6,1,0,0.01; E,1,4;E,2,5;E,3,6; {create space truss elements} E,1,2;E,1,3;E,2,3; E,4,5,6; {create surface element} SFE, 1, pressure value; {apply wind pressure}
Elements created using an APDL file in ANSYS.
Fiouz and Karbaschi 2505