
Wind to Hydrogen to Ammonia Pilot Project
42
Wind to Ammonia Project Update Douglas G. Tiffany University of Minnesota Extension Service Portland, Oregon September 19, 2011
Transcript of Wind to Hydrogen to Ammonia Pilot Project
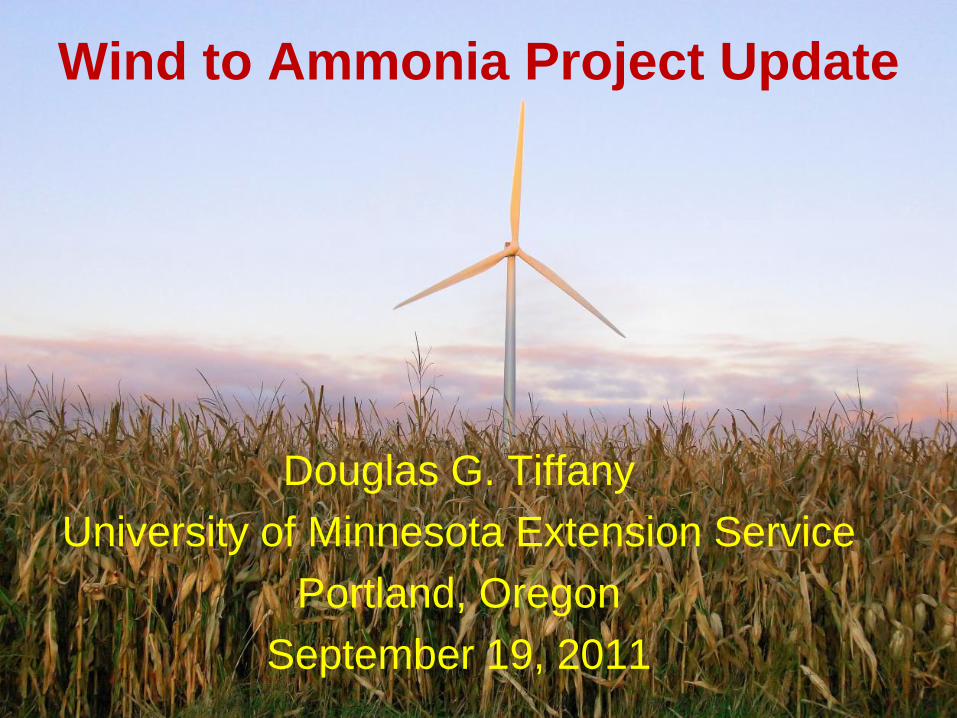
Wind to Ammonia Project Update
Douglas G. Tiffany
University of Minnesota Extension Service
Portland, Oregon
September 19, 2011

Today’s Talk • Review Motivations for this Project
• Update Progress
• Identify Plans for Engineering and
Economic Analysis
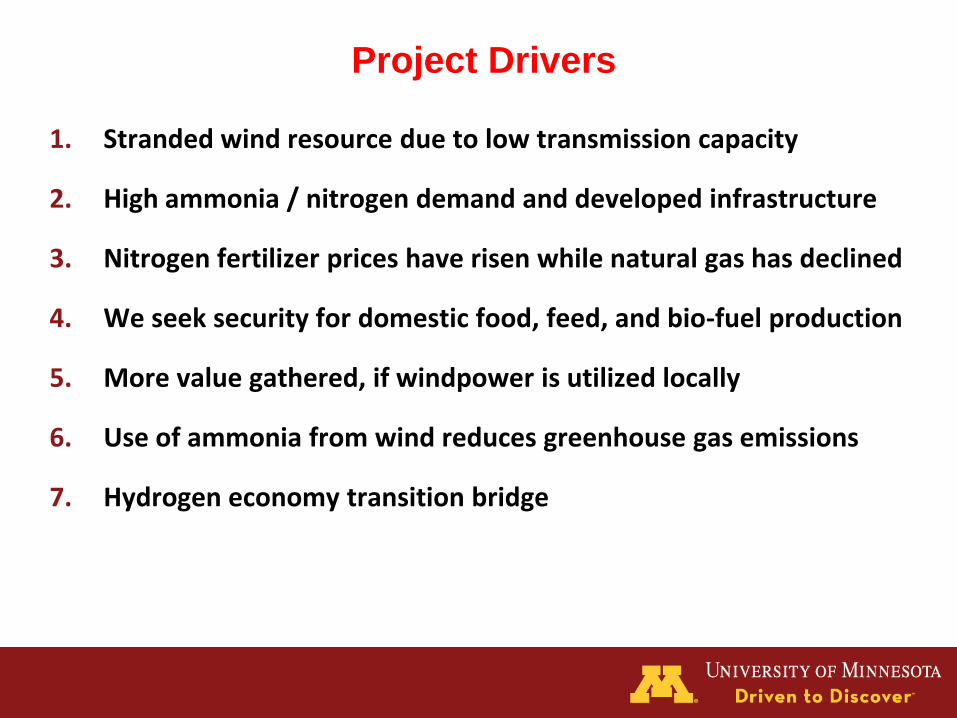
1. Stranded wind resource due to low transmission capacity
2. High ammonia / nitrogen demand and developed infrastructure
3. Nitrogen fertilizer prices have risen while natural gas has declined
4. We seek security for domestic food, feed, and bio-fuel production
5. More value gathered, if windpower is utilized locally
6. Use of ammonia from wind reduces greenhouse gas emissions
7. Hydrogen economy transition bridge
Project Drivers
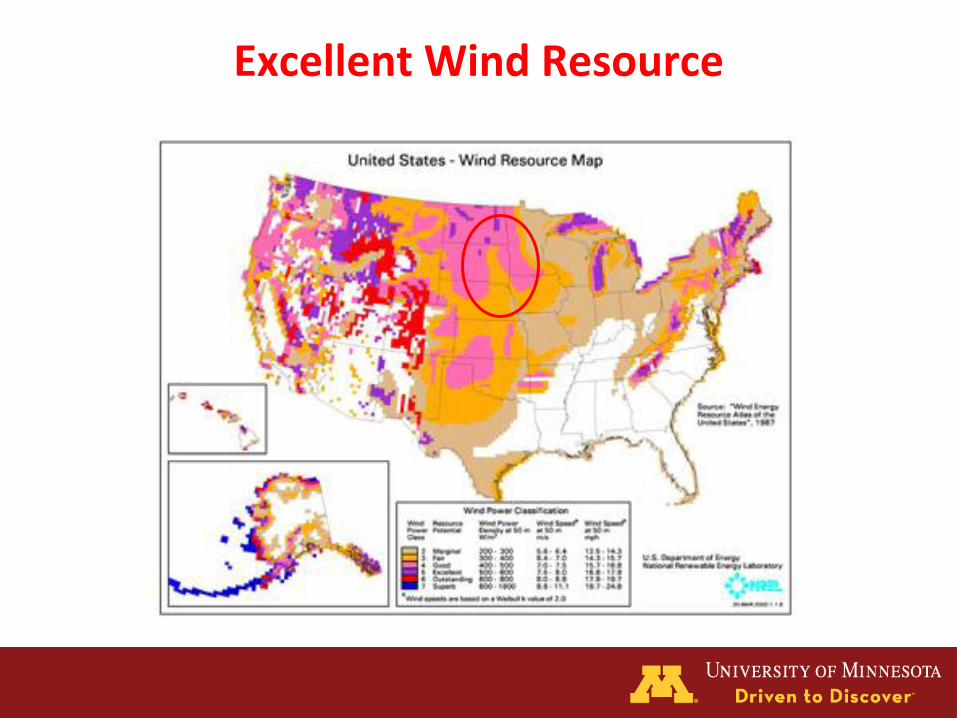
Excellent Wind Resource
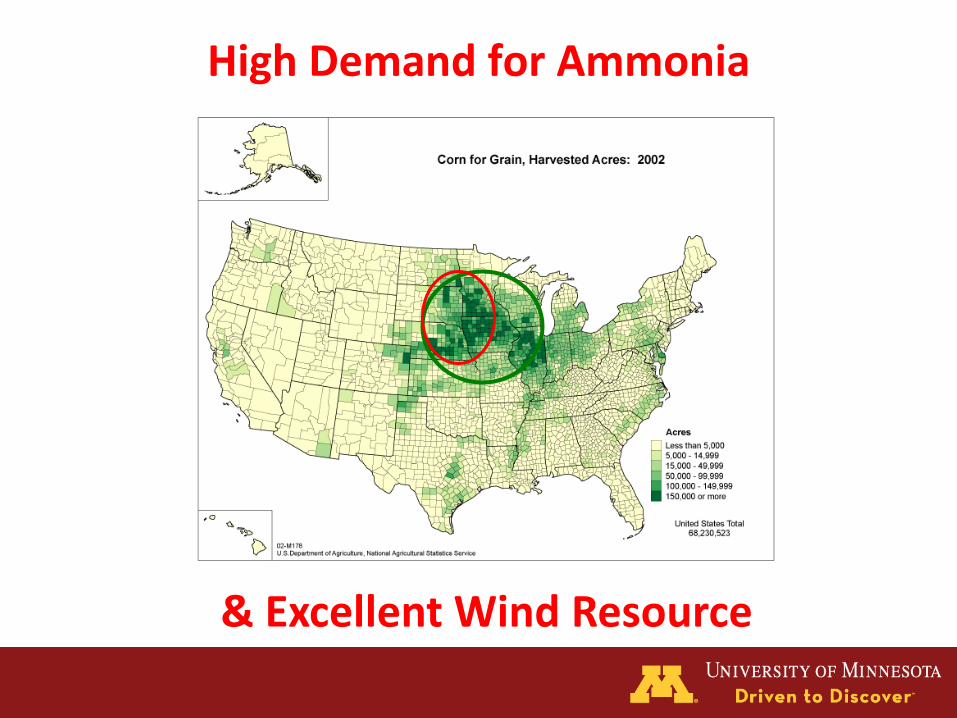
High Demand for Ammonia
& Excellent Wind Resource
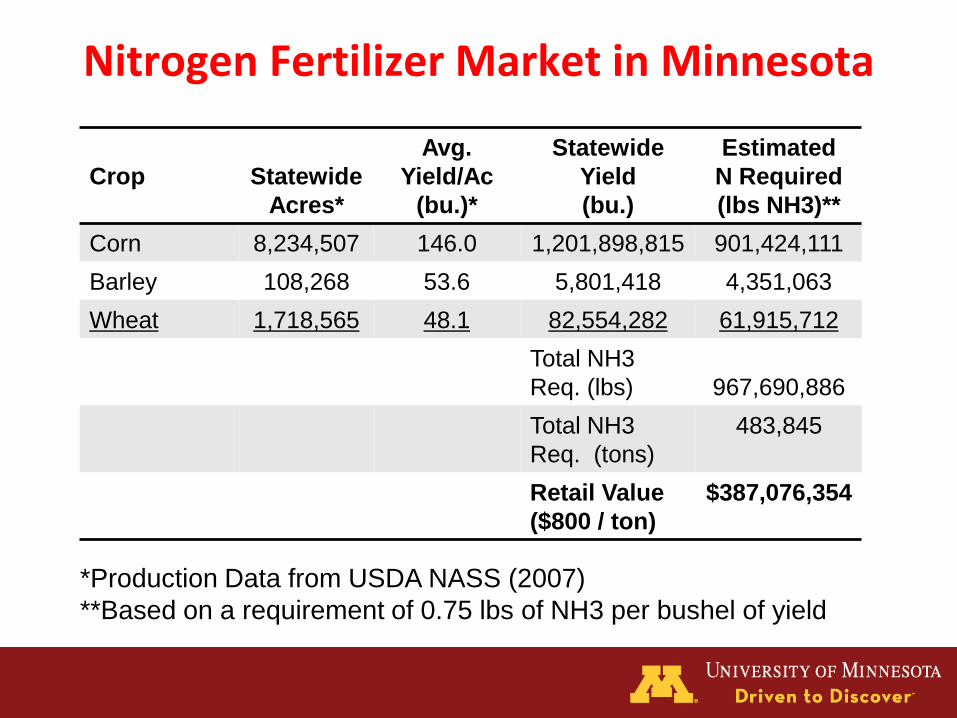
Nitrogen Fertilizer Market in Minnesota
Crop
Statewide
Acres*
Avg.
Yield/Ac
(bu.)*
Statewide
Yield
(bu.)
Estimated
N Required
(lbs NH3)**
Corn 8,234,507 146.0 1,201,898,815 901,424,111
Barley 108,268 53.6 5,801,418 4,351,063
Wheat 1,718,565 48.1 82,554,282 61,915,712
Total NH3
Req. (lbs)
967,690,886
Total NH3
Req. (tons)
483,845
Retail Value
($800 / ton)
$387,076,354
*Production Data from USDA NASS (2007)
**Based on a requirement of 0.75 lbs of NH3 per bushel of yield
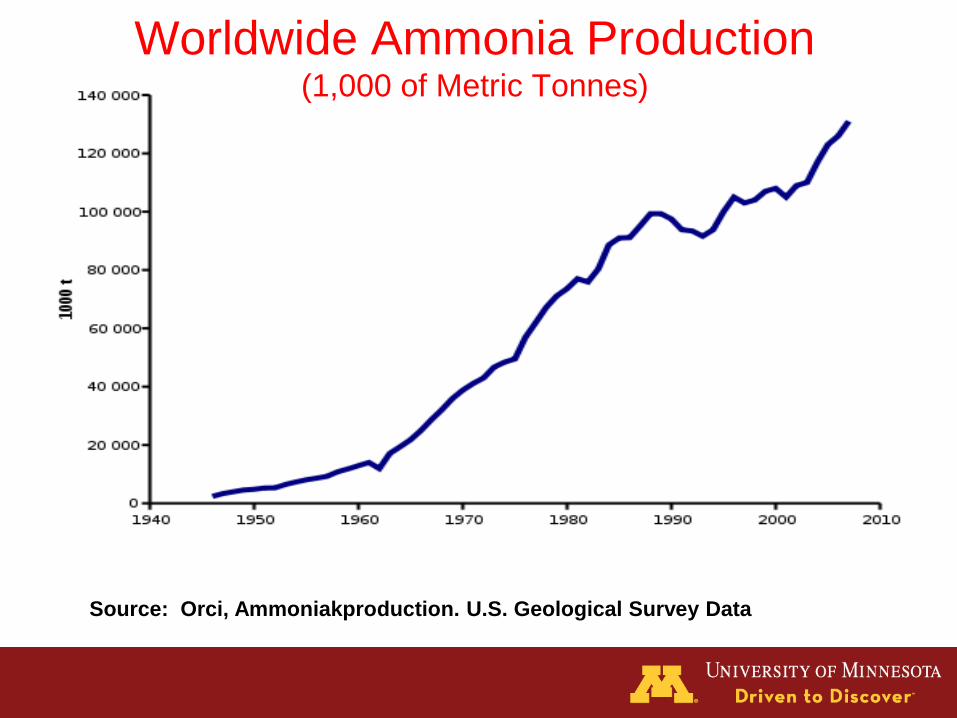
Worldwide Ammonia Production (1,000 of Metric Tonnes)
Source: Orci, Ammoniakproduction. U.S. Geological Survey Data
$-
$100
$200
$300
$400
$500
$600
$700
$800 19
84
1985
1986
1987
1988
1989
1990
1991
1992
1993
1994
1995
1996
1997
1998
1999
2000
2001
2002
2003
2004
2005
2006
2007
2008
2009
2010
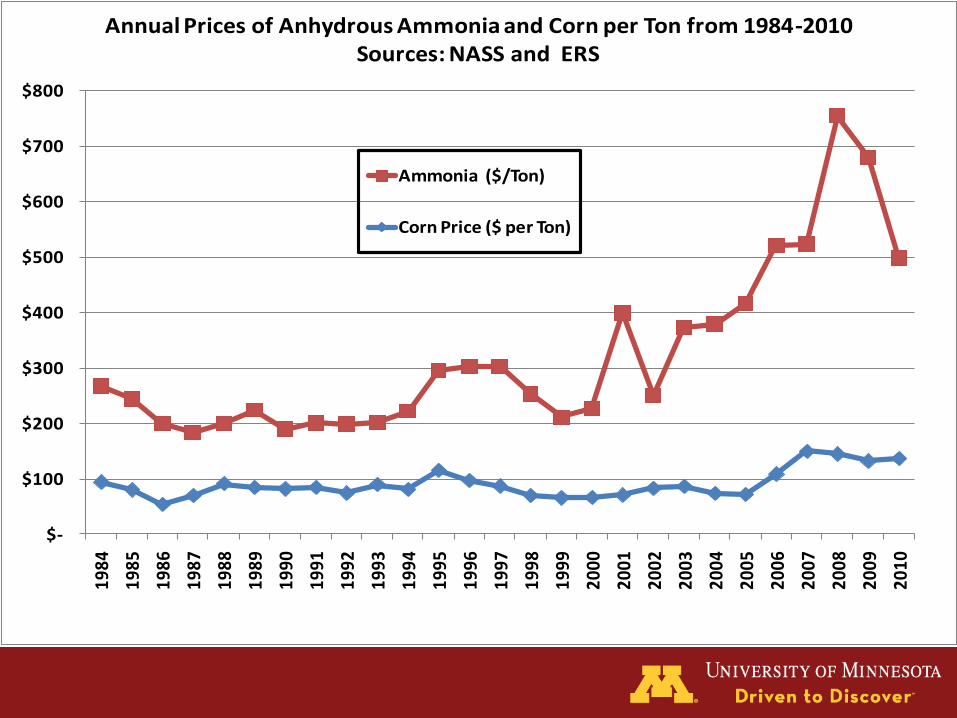
Annual Prices of Anhydrous Ammonia and Corn per Ton from 1984-2010Sources: NASS and ERS
Ammonia ($/Ton)
Corn Price ($ per Ton)
Current Nitrogen Fertilizer Supply Chain
$-
$100
$200
$300
$400
$500
$600
$700
$800 19
84
1985
1986
1987
1988
1989
1990
1991
1992
1993
1994
1995
1996
1997
1998
1999
2000
2001
2002
2003
2004
2005
2006
2007
2008
2009
2010
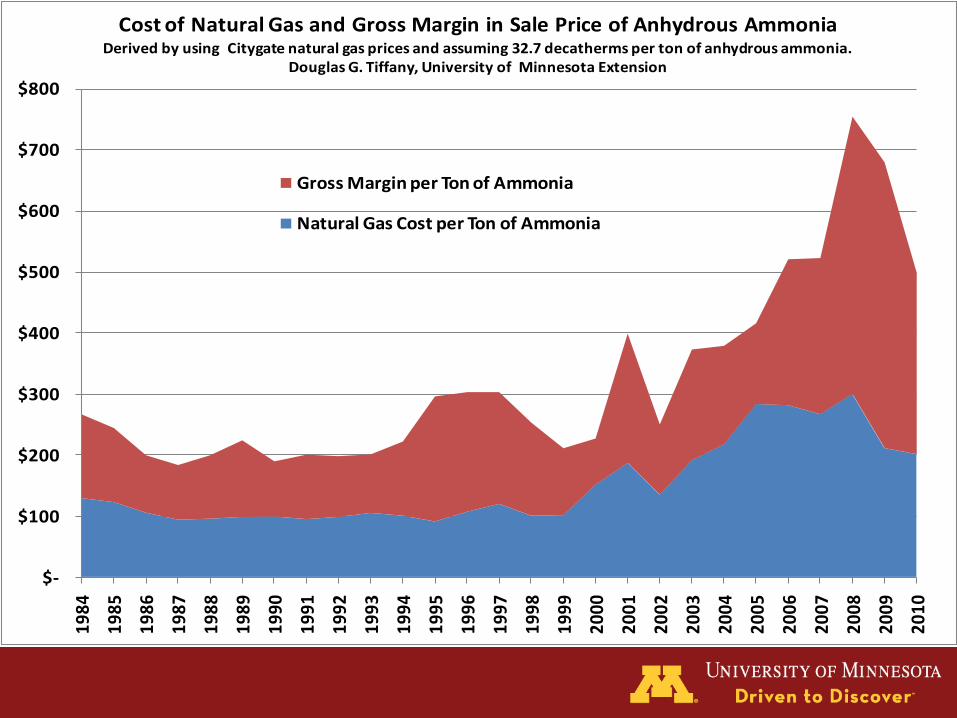
Cost of Natural Gas and Gross Margin in Sale Price of Anhydrous AmmoniaDerived by using Citygate natural gas prices and assuming 32.7 decatherms per ton of anhydrous ammonia.
Douglas G. Tiffany, University of Minnesota Extension
Gross Margin per Ton of Ammonia
Natural Gas Cost per Ton of Ammonia
Transmission vs. Local Ammonia Production
High Level / Back of the Napkin Comparison:
Each cost ~$1 million / MW nameplate capacity (+ / - 50%)
Each result in ~$300,000* annual retail revenue / MW nameplate
Ammonia production keeps dollars local and potentially has less
development constraints (NIMBY Issues, Permitting, Siting, etc)
Wind energy has a utilization problem more than a transmission
and technology problem (net present value of wind is excellent)
*Transmission Case - 1 MW Wind Generation Equals 3,328,800 kWh / yr (times $0.08 per kWh ) equals $266,304.00
*Nitrogen Fertilizer Case - 1 MW Ammonia Plant Equals 1,460,000 lbs NH3 (times $0.40 per lb) equals $584,000.00
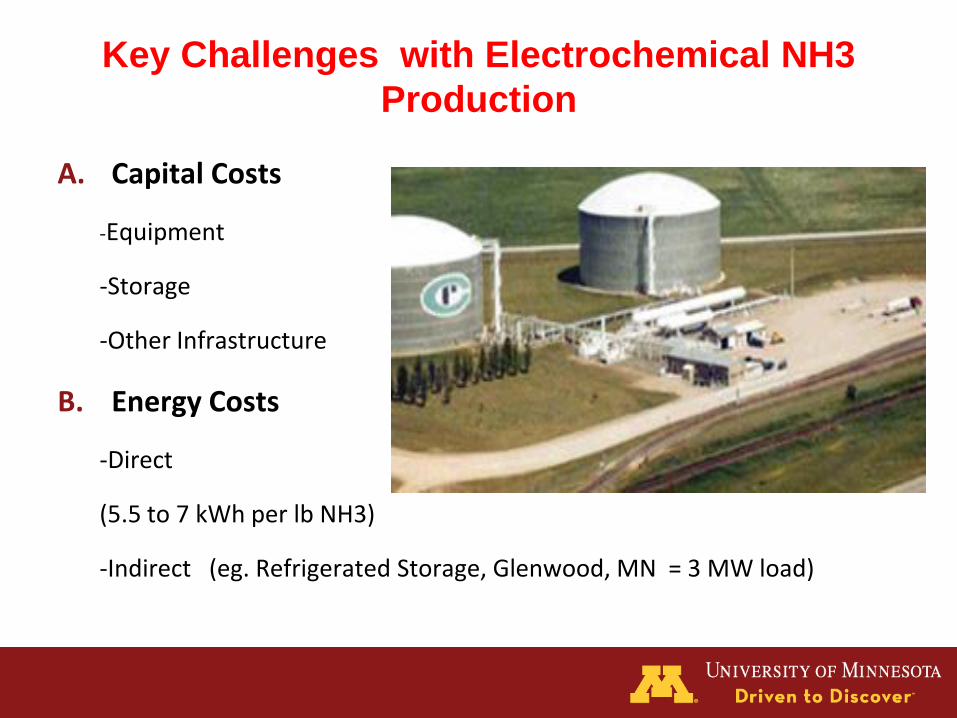
Key Challenges with Electrochemical NH3
Production
A. Capital Costs
-Equipment
-Storage
-Other Infrastructure
B. Energy Costs
-Direct
(5.5 to 7 kWh per lb NH3)
-Indirect (eg. Refrigerated Storage, Glenwood, MN = 3 MW load)
Key Challenges with Electrochemical NH3
Production
C. Operation, Maintenance, Repairs
-Need to replace plates / cells on electrolyzers every 3 to 7 years
-Catalysts (Relatively inexpensive but can damage reactor vessels)
-24 / 7 Operation and Oversight
D. Market
-Competition (Fluctuating NG prices)
-Seasonality of Demand
-Lack of long-term contracts and /or federal and state policy
Key Challenges: Electrochemical NH3 Production
E. Logistics
-What is the appropriate size and scale to optimize logistics?
F. Business Model
-What is the optimum size for financial viability?
-What ownership organizations will be most favorable?
G. Electric Energy Industry
-Regulated industry with “service territories”
-FERC, MISO, PUC
-Retail wheeling (May need to separate wind business from NH3 )
-Socialized costs - transmission, emissions
Key Challenges with Electrochemical NH3
Production
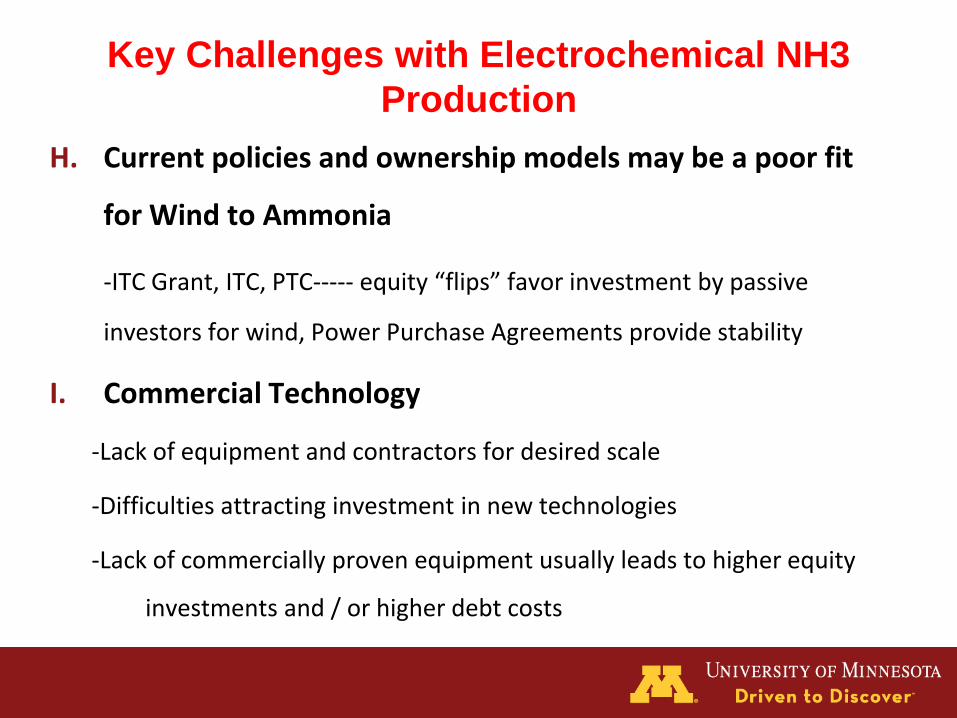
H. Current policies and ownership models may be a poor fit
for Wind to Ammonia
-ITC Grant, ITC, PTC----- equity “flips” favor investment by passive
investors for wind, Power Purchase Agreements provide stability
I. Commercial Technology
-Lack of equipment and contractors for desired scale
-Difficulties attracting investment in new technologies
-Lack of commercially proven equipment usually leads to higher equity
investments and / or higher debt costs
Key Opportunities with Electrochemical NH3
Production
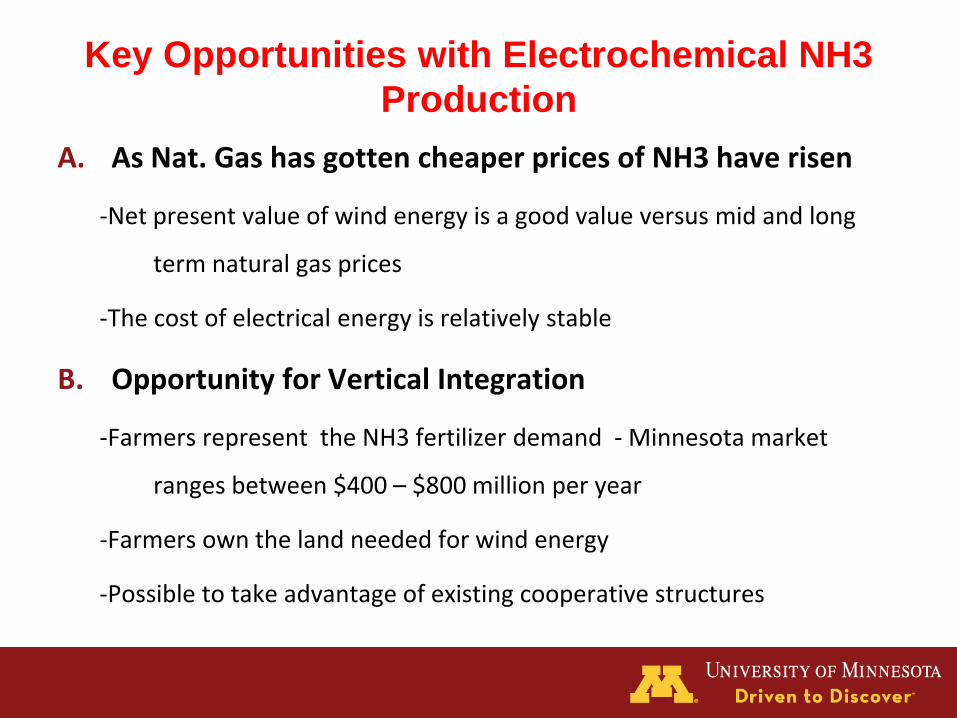
A. As Nat. Gas has gotten cheaper prices of NH3 have risen
-Net present value of wind energy is a good value versus mid and long
term natural gas prices
-The cost of electrical energy is relatively stable
B. Opportunity for Vertical Integration
-Farmers represent the NH3 fertilizer demand - Minnesota market
ranges between $400 – $800 million per year
-Farmers own the land needed for wind energy
-Possible to take advantage of existing cooperative structures
Key Opportunities with Electrochemical NH3
Production
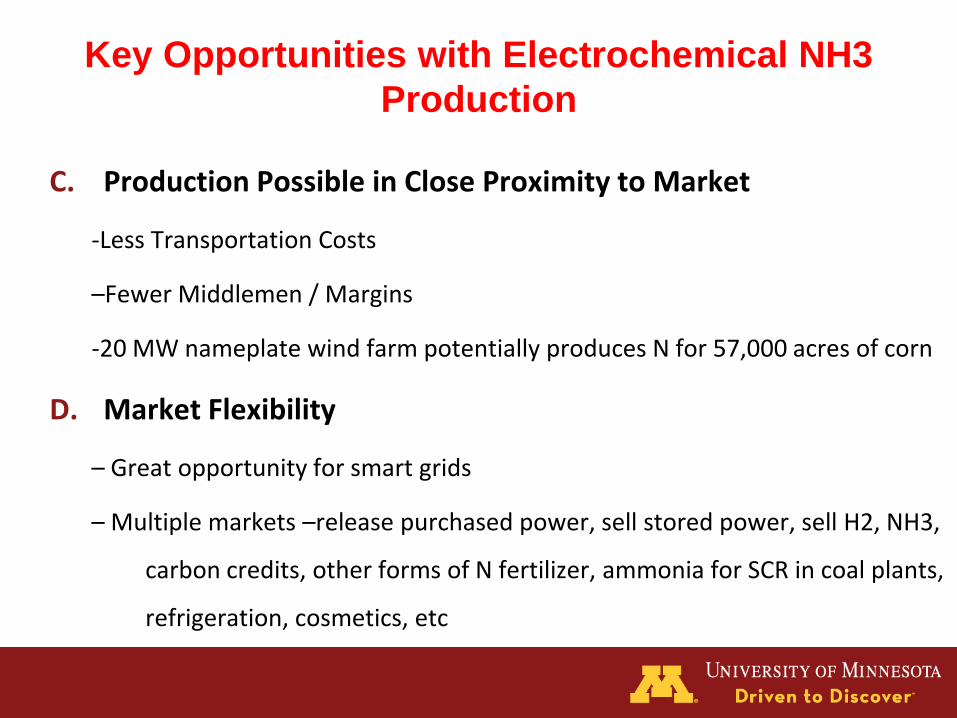
C. Production Possible in Close Proximity to Market
-Less Transportation Costs
–Fewer Middlemen / Margins
-20 MW nameplate wind farm potentially produces N for 57,000 acres of corn
D. Market Flexibility
– Great opportunity for smart grids
– Multiple markets –release purchased power, sell stored power, sell H2, NH3,
carbon credits, other forms of N fertilizer, ammonia for SCR in coal plants,
refrigeration, cosmetics, etc
Key Opportunities with Electrochemical NH3
Production
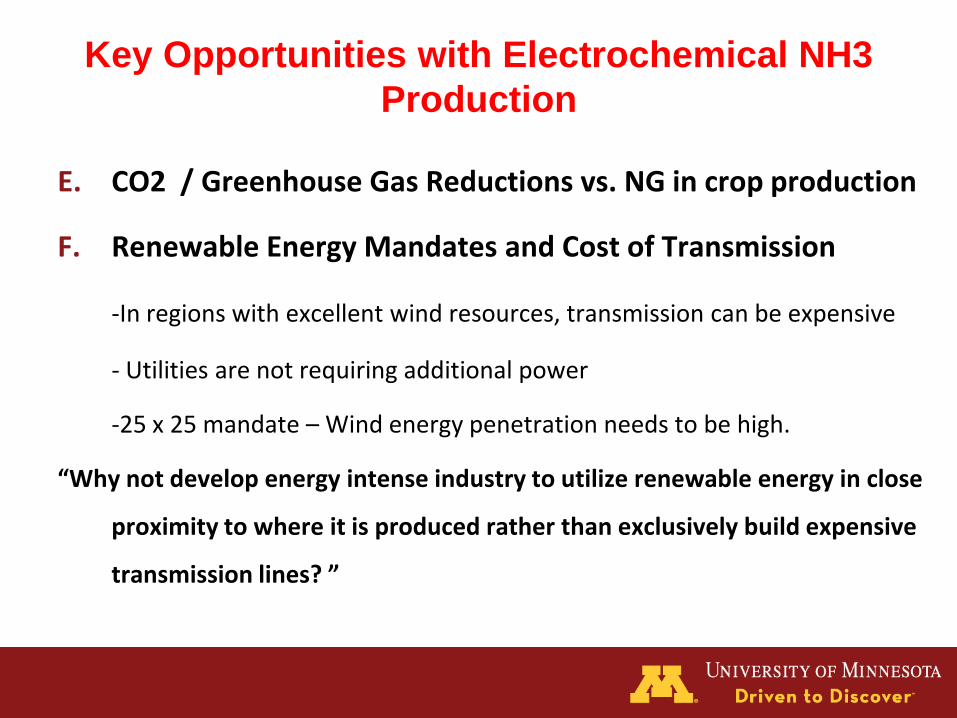
E. CO2 / Greenhouse Gas Reductions vs. NG in crop production
F. Renewable Energy Mandates and Cost of Transmission
-In regions with excellent wind resources, transmission can be expensive
- Utilities are not requiring additional power
-25 x 25 mandate – Wind energy penetration needs to be high.
“Why not develop energy intense industry to utilize renewable energy in close
proximity to where it is produced rather than exclusively build expensive
transmission lines? ”
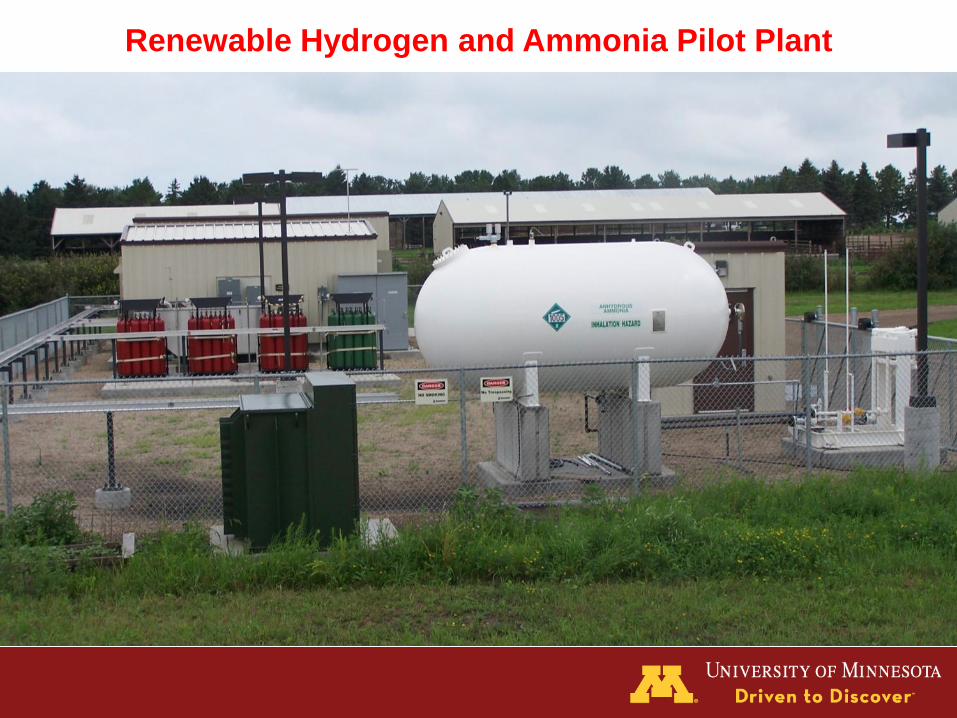
Renewable Hydrogen and Ammonia Pilot Plant
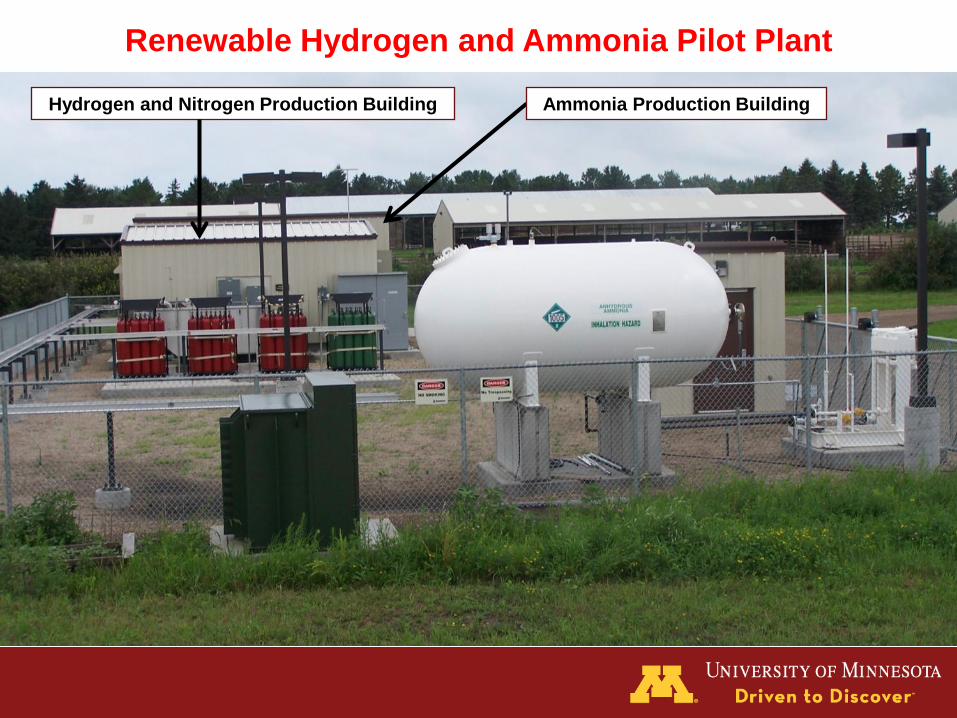
Renewable Hydrogen and Ammonia Pilot Plant
Hydrogen and Nitrogen Production Building Ammonia Production Building

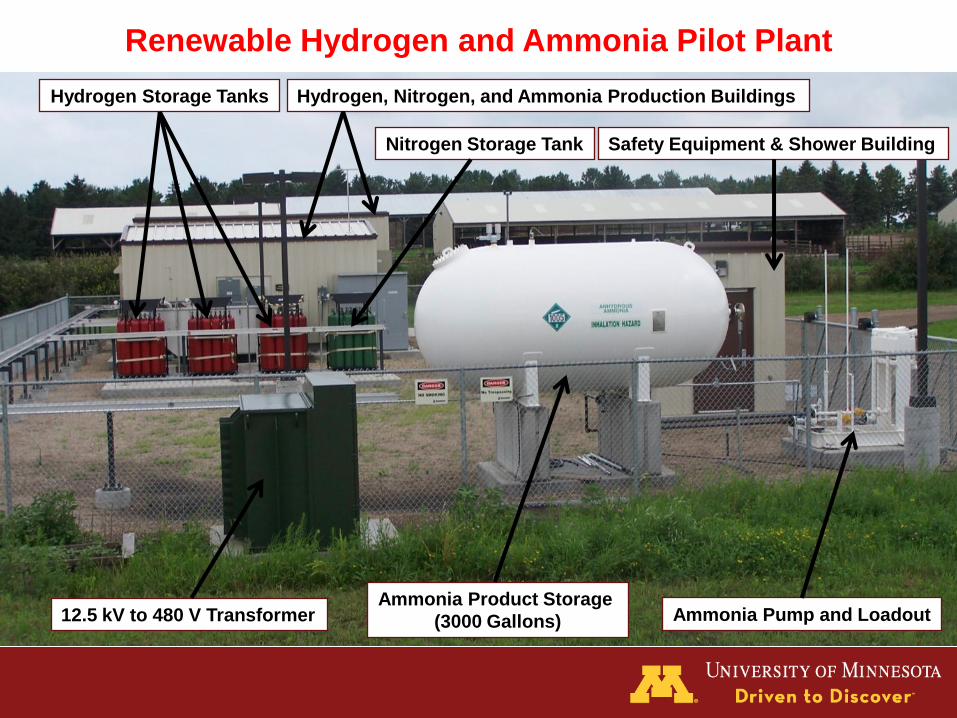
Renewable Hydrogen and Ammonia Pilot Plant
Hydrogen Storage Tanks Nitrogen Storage Tank
12.5 kV to 480 V Transformer Ammonia Product Storage
(3000 Gallons)
Safety Equipment & Shower Building
Ammonia Pump and Loadout

Renewable Hydrogen and Ammonia Pilot Plant
60 kW HEC Hydrogen Engine Genset Switch Gear
Renewable Hydrogen and Ammonia Pilot Plant
Hydrogen Storage Tanks
Nitrogen Storage Tank
Hydrogen, Nitrogen, and Ammonia Production Buildings
12.5 kV to 480 V Transformer Ammonia Product Storage
(3000 Gallons)
Safety Equipment & Shower Building
Ammonia Pump and Loadout
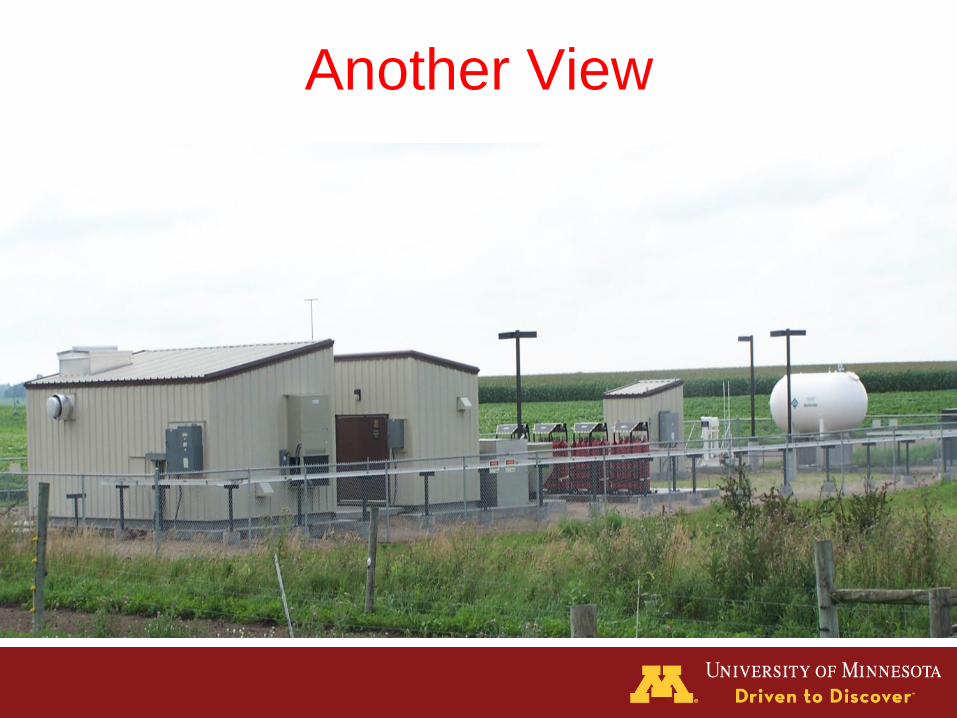
Another View
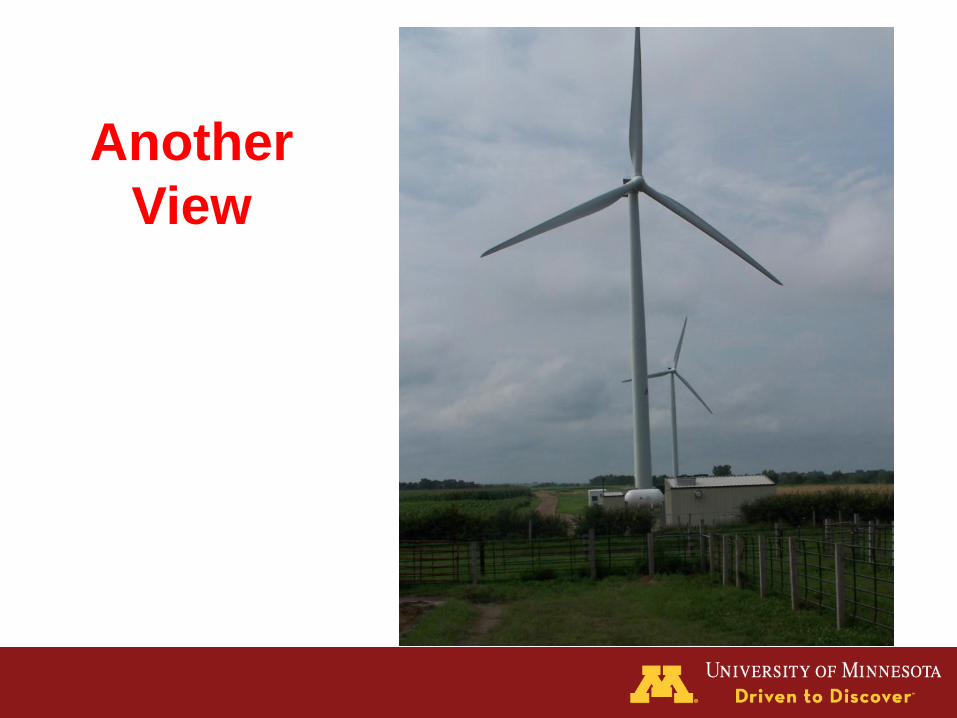
Another
View
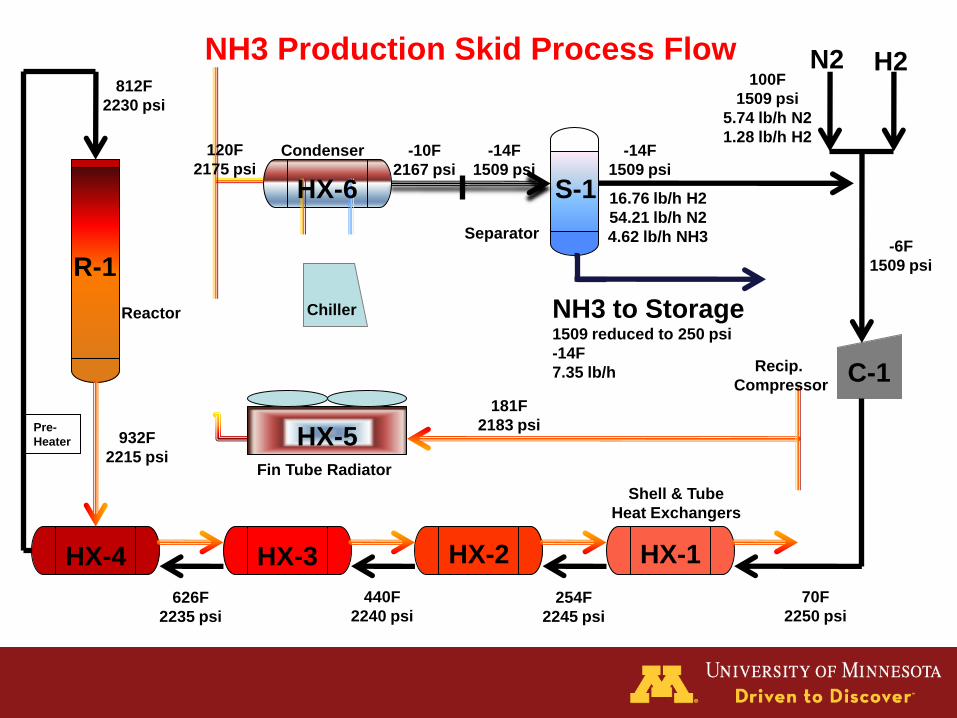
NH3 Production Skid Process Flow N2 H2
NH3 to Storage 1509 reduced to 250 psi
-14F
7.35 lb/h C-1
HX-1 HX-2 HX-3 HX-4
Chiller
HX-5
HX-6 S-1
R-1
932F
2215 psi
812F
2230 psi
70F
2250 psi 254F
2245 psi
440F
2240 psi 626F
2235 psi
-6F
1509 psi
181F
2183 psi Pre-
Heater
120F
2175 psi -10F
2167 psi
-14F
1509 psi
-14F
1509 psi
Condenser
Separator
Fin Tube Radiator
Shell & Tube
Heat Exchangers
Recip.
Compressor
Reactor
100F
1509 psi
5.74 lb/h N2
1.28 lb/h H2
16.76 lb/h H2
54.21 lb/h N2
4.62 lb/h NH3
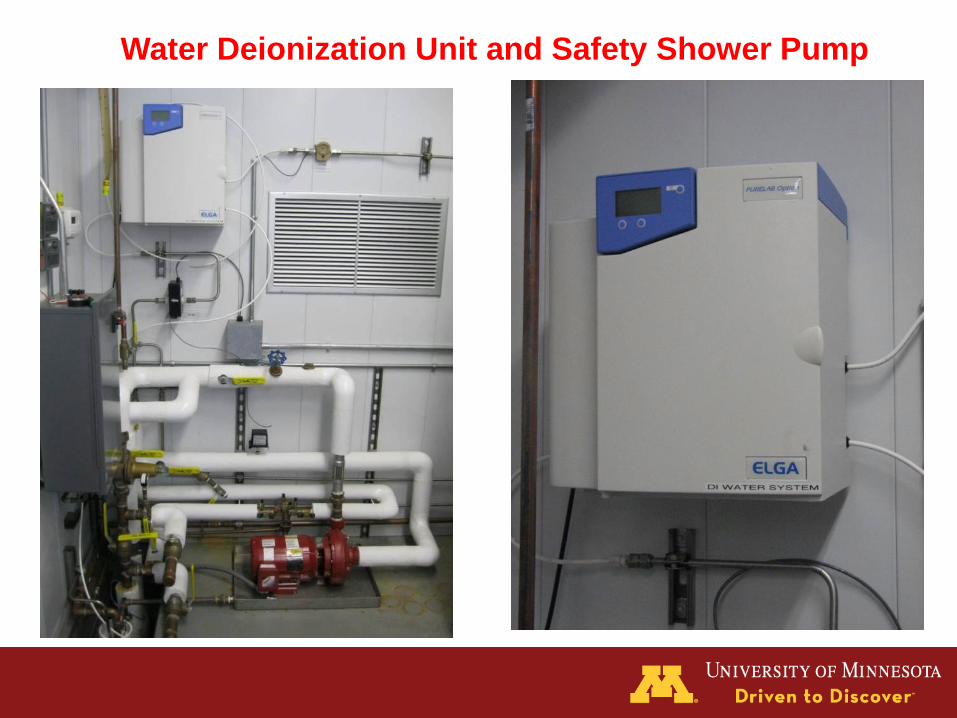
Water Deionization Unit and Safety Shower Pump
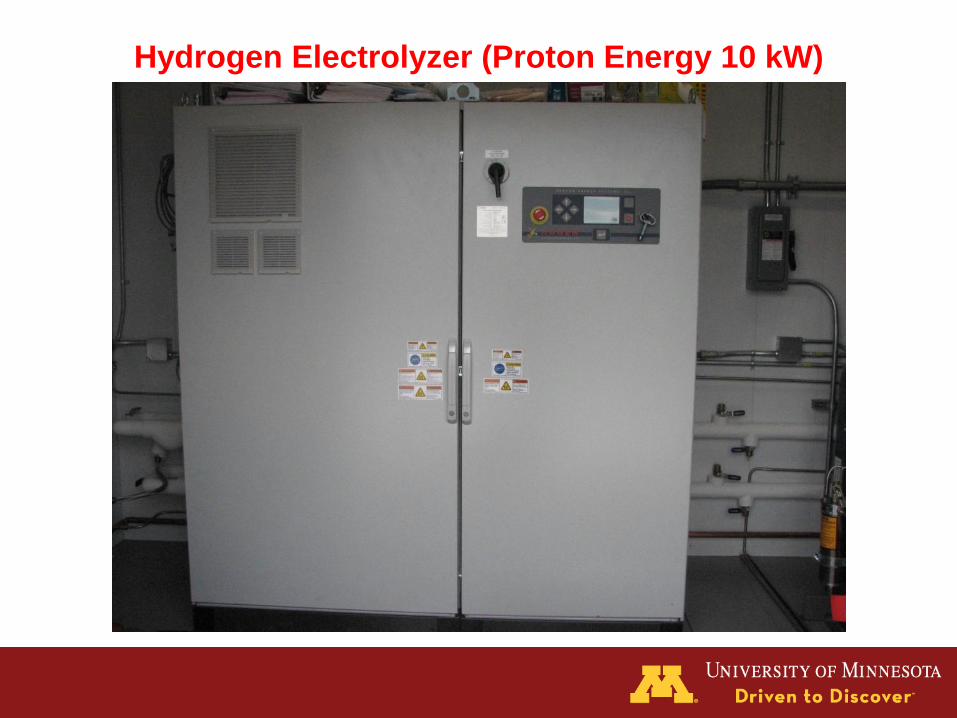
Hydrogen Electrolyzer (Proton Energy 10 kW)
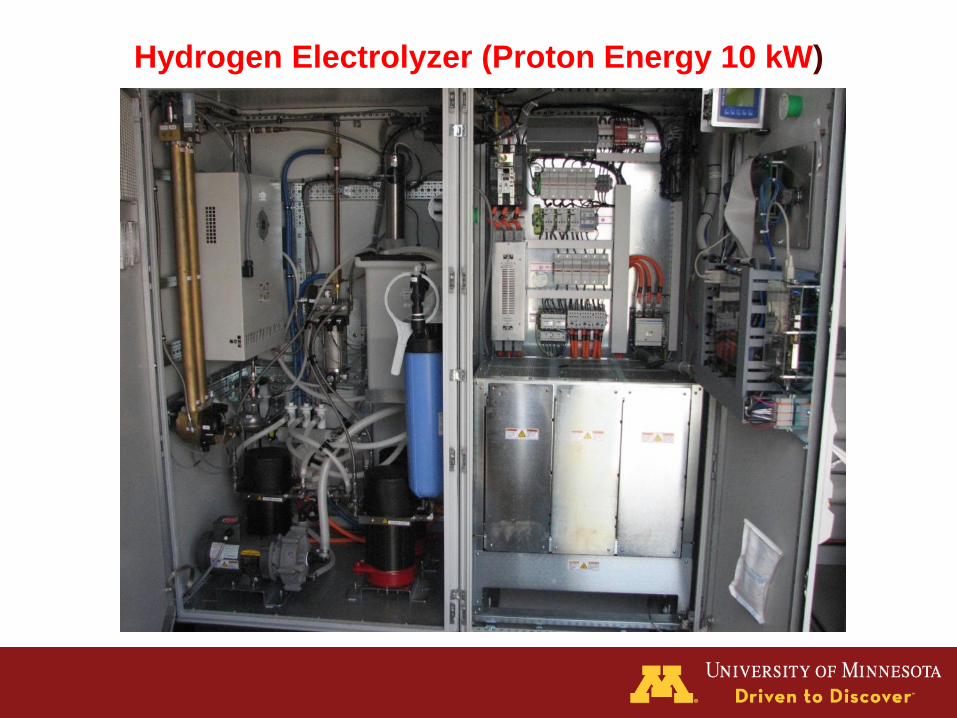
Hydrogen Electrolyzer (Proton Energy 10 kW)
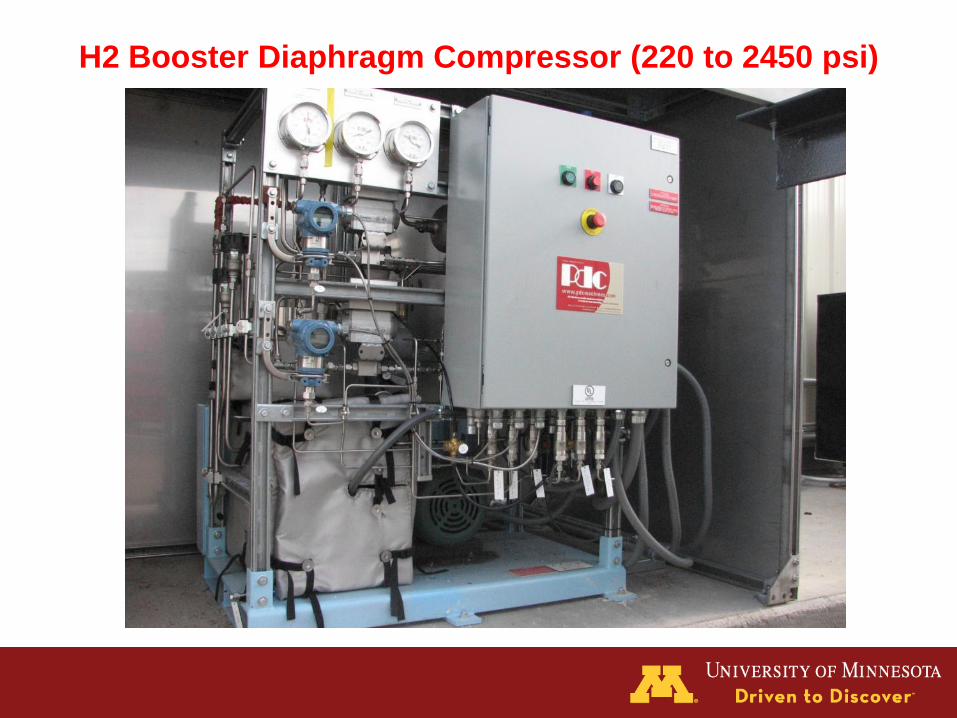
H2 Booster Diaphragm Compressor (220 to 2450 psi)
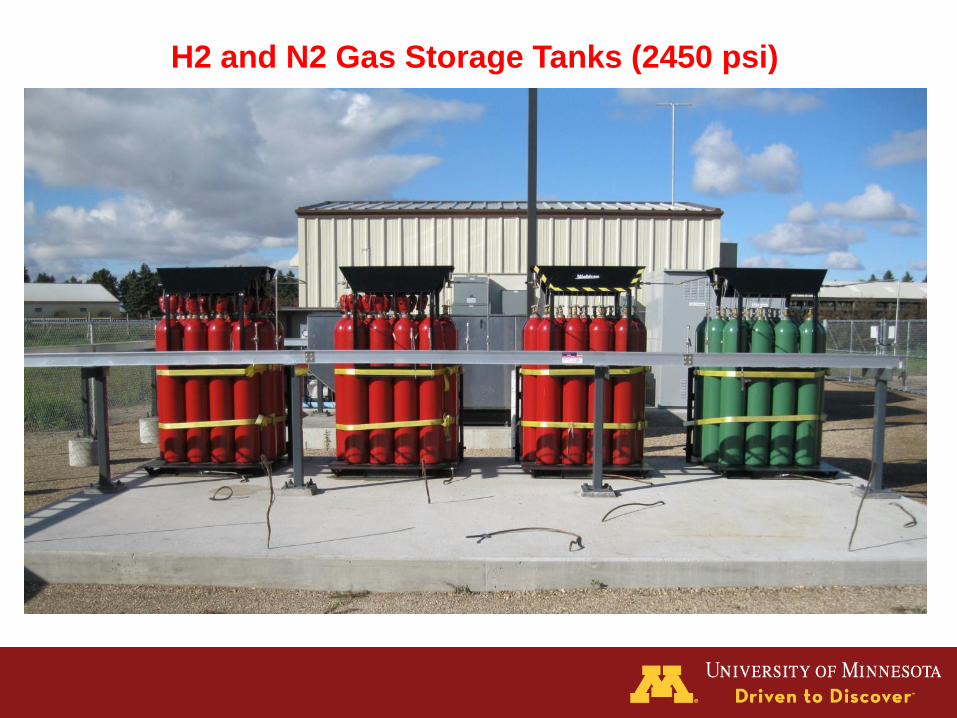
H2 and N2 Gas Storage Tanks (2450 psi)
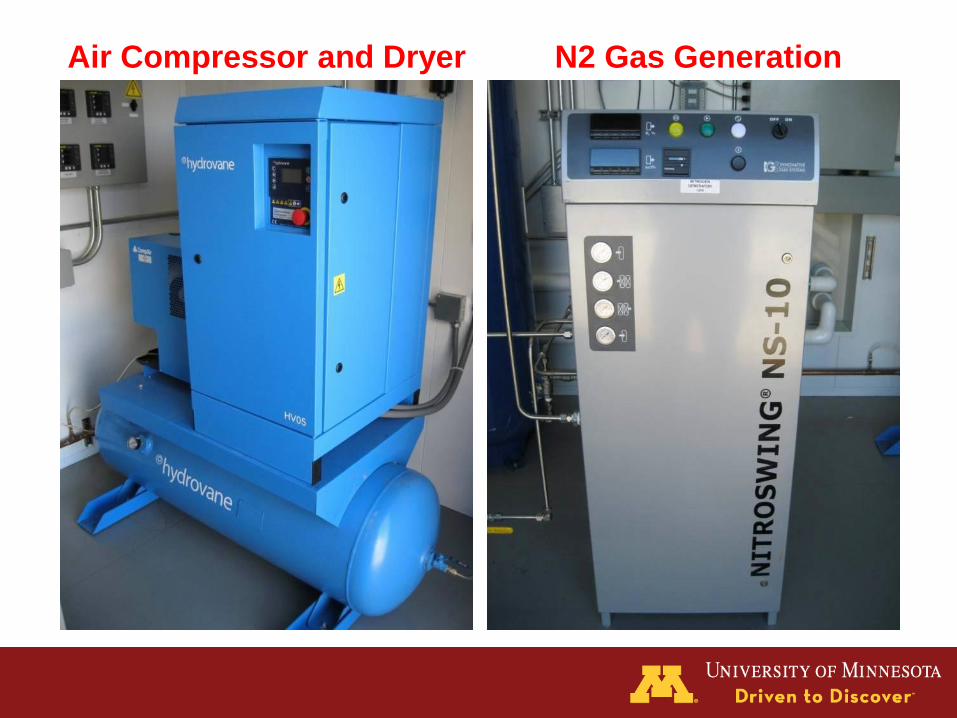
Air Compressor and Dryer N2 Gas Generation
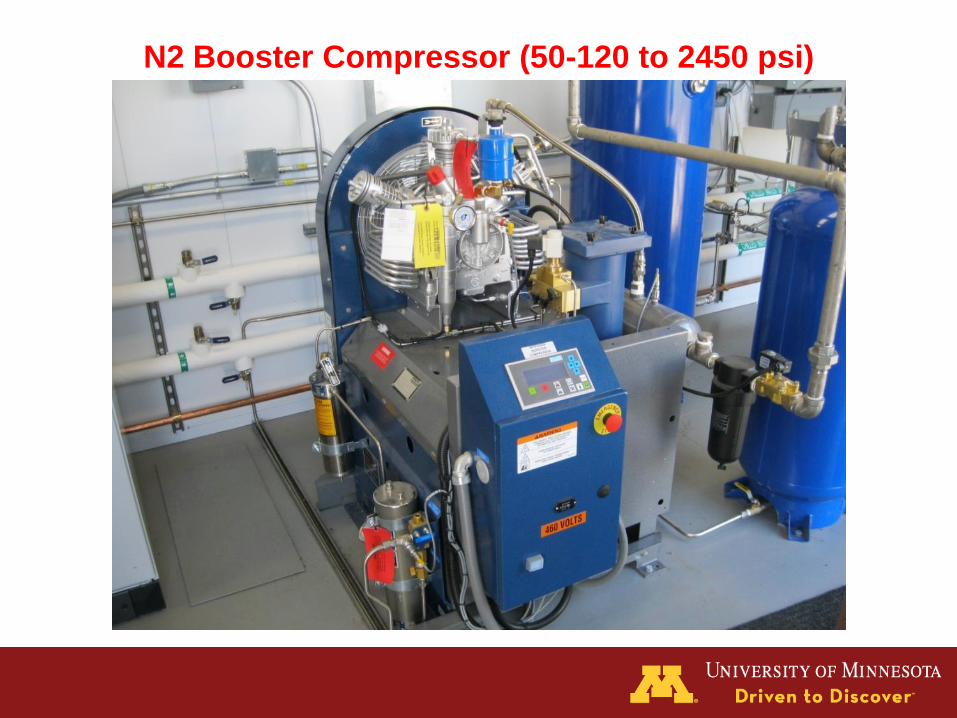
N2 Booster Compressor (50-120 to 2450 psi)
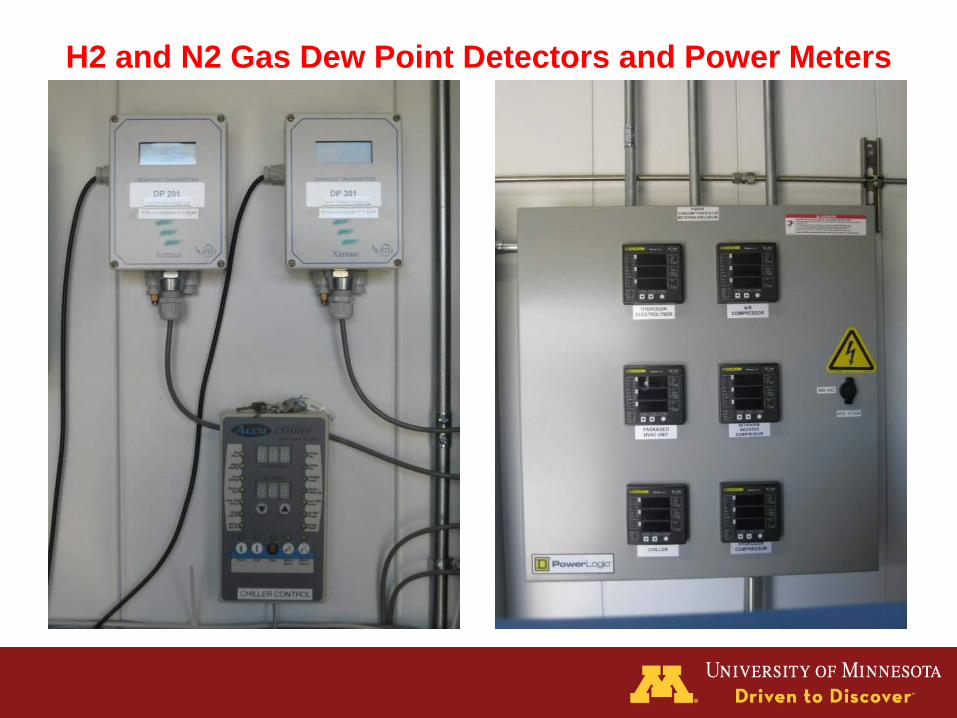
H2 and N2 Gas Dew Point Detectors and Power Meters
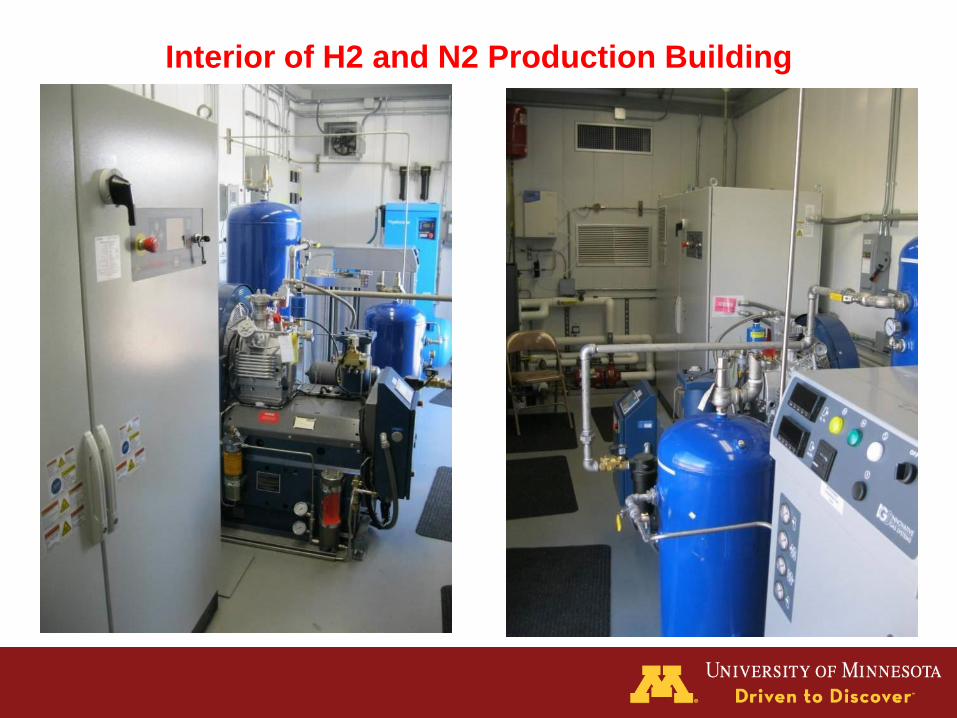
Interior of H2 and N2 Production Building
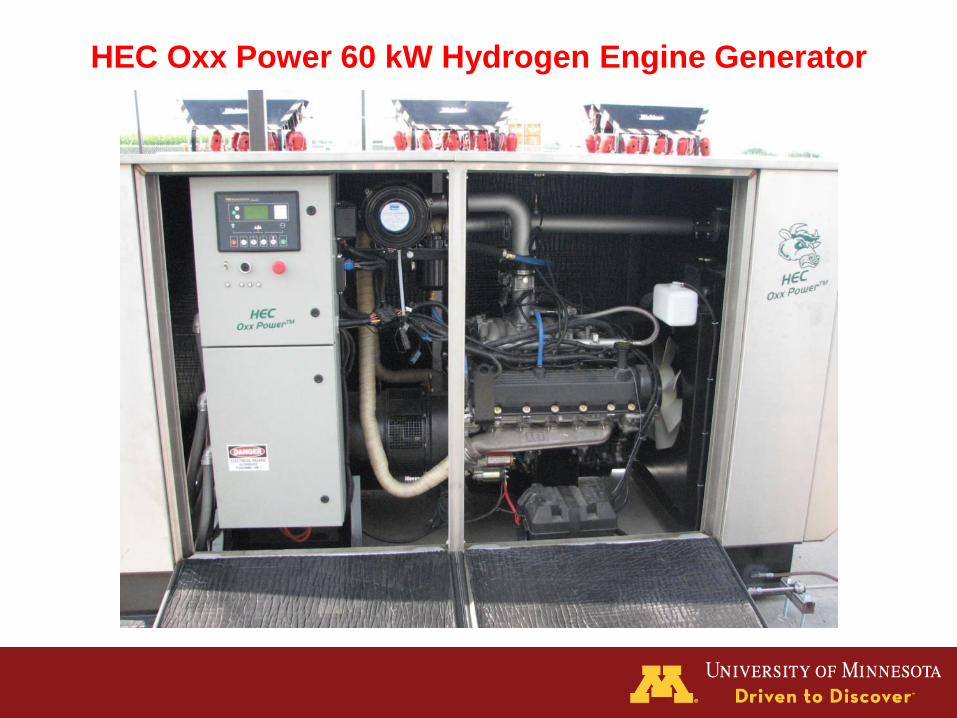
HEC Oxx Power 60 kW Hydrogen Engine Generator
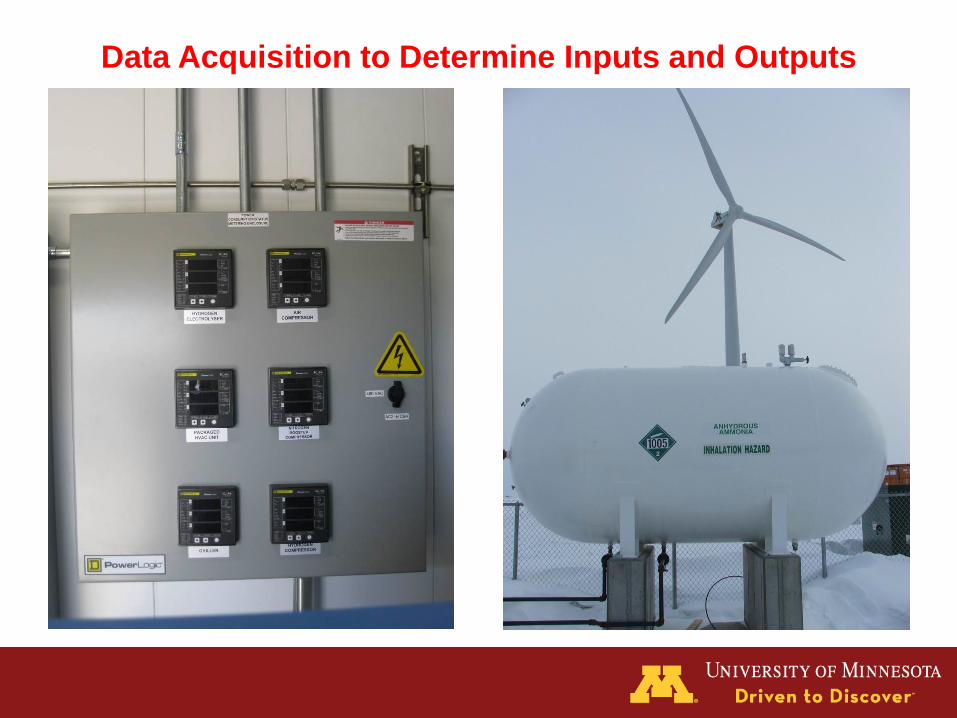
Data Acquisition to Determine Inputs and Outputs
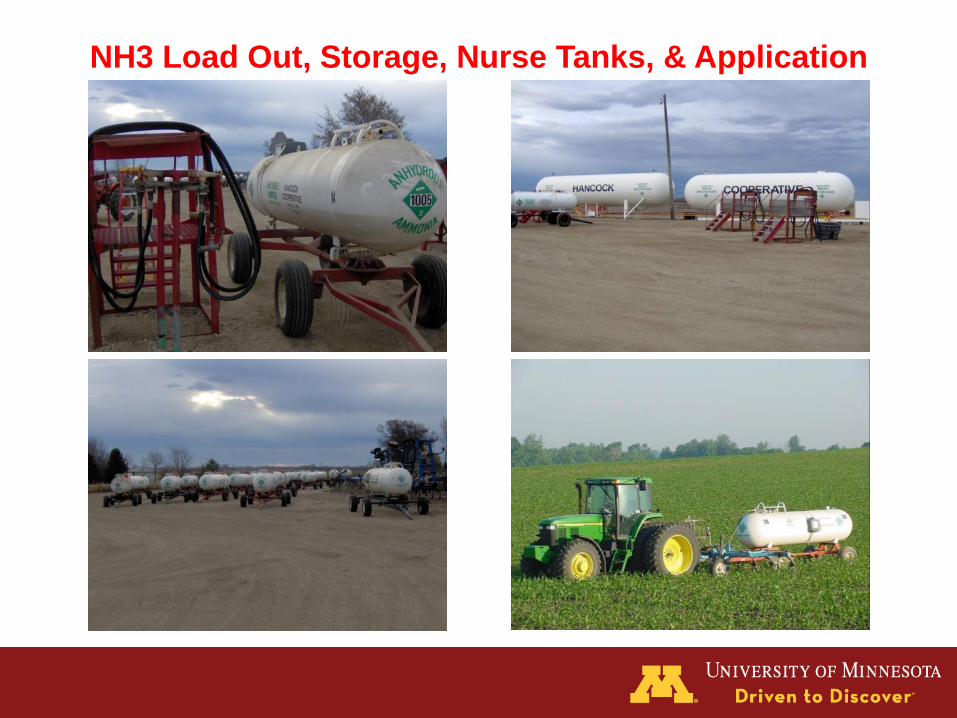
NH3 Load Out, Storage, Nurse Tanks, & Application
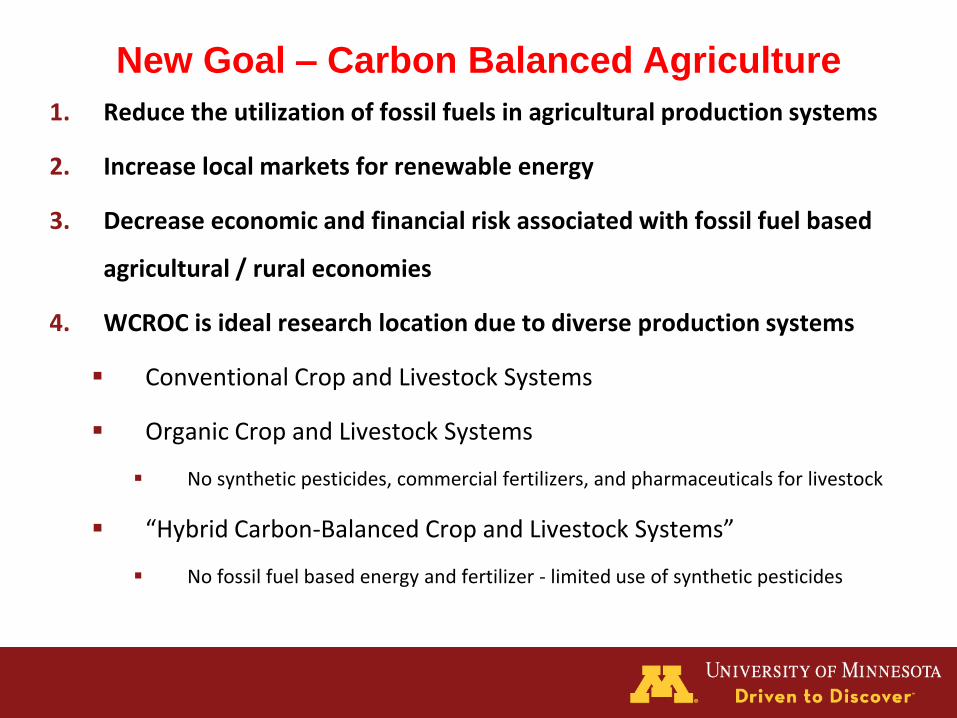
1. Reduce the utilization of fossil fuels in agricultural production systems
2. Increase local markets for renewable energy
3. Decrease economic and financial risk associated with fossil fuel based
agricultural / rural economies
4. WCROC is ideal research location due to diverse production systems
Conventional Crop and Livestock Systems
Organic Crop and Livestock Systems
No synthetic pesticides, commercial fertilizers, and pharmaceuticals for livestock
“Hybrid Carbon-Balanced Crop and Livestock Systems”
No fossil fuel based energy and fertilizer - limited use of synthetic pesticides
New Goal – Carbon Balanced Agriculture
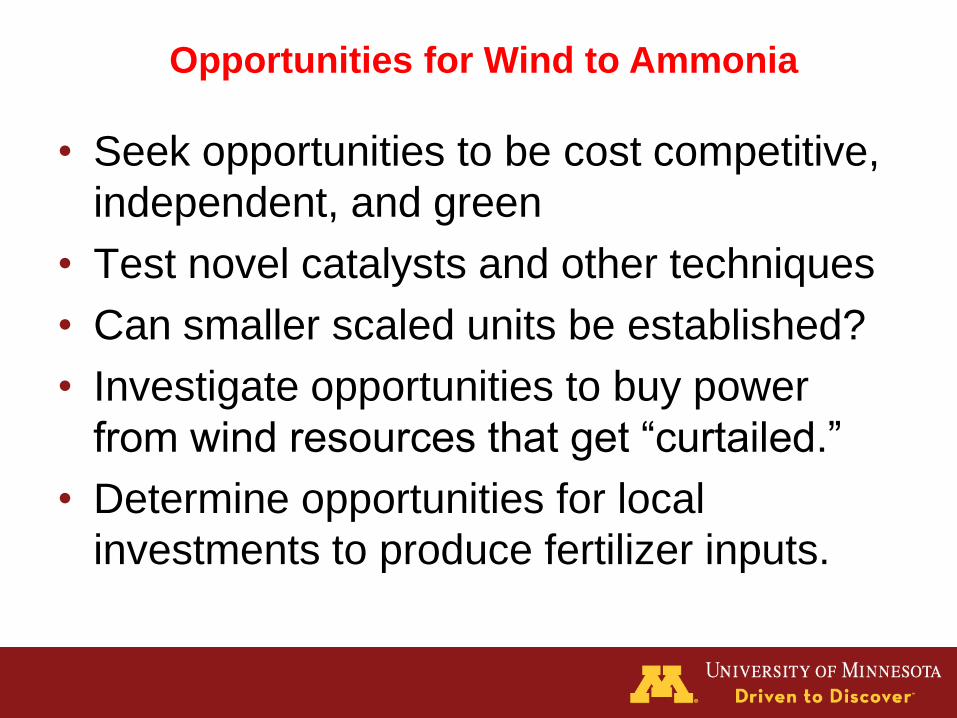
Opportunities for Wind to Ammonia
• Seek opportunities to be cost competitive,
independent, and green
• Test novel catalysts and other techniques
• Can smaller scaled units be established?
• Investigate opportunities to buy power
from wind resources that get “curtailed.”
• Determine opportunities for local
investments to produce fertilizer inputs.
Plan of Investigation
• Determine factor inputs– kWh per Ton
of H2
• Determine power requirements to
segregate the N2
• Determine power required to synthesize
the NH3
• Study costs of U of M unit
• Model reasonable cost assumptions for
scale-up
Other Avenues of Inquiry
• Determine competitiveness of greener
NH3 when markets or regulations
penalize greenhouse gas emissions of
farm inputs.
• GHG emissions from embedded natural
gas used in NH3 production to support
corn production--- huge challenge for
agriculture of U.S. and Minnesota
Contact Information:
Michael Reese
Director- Renewable Energy
West Central Research & Outreach Center
University of Minnesota
Phone: (320) 589-1711
Web: http://renewables.morris.umn.edu
Acknowledgements:
U of MN IREE
MN Corn R & P Council
Natural Resources Trust Fund
NextGen Board
State of Minnesota
Sun Grant
USDA – DOE
Xcel RDF


