Wind Energy Update Larry Flowers National Renewable Energy Laboratory December 13, 2007 Ag Outreach...
50
Wind Energy Update Wind Energy Update Larry Flowers Larry Flowers National Renewable Energy Laboratory National Renewable Energy Laboratory December 13, 2007 December 13, 2007 Ag Outreach Webcast Ag Outreach Webcast
-
date post
19-Dec-2015 -
Category
Documents
-
view
219 -
download
2
Transcript of Wind Energy Update Larry Flowers National Renewable Energy Laboratory December 13, 2007 Ag Outreach...

Wind Energy UpdateWind Energy Update
Larry Flowers Larry Flowers National Renewable Energy Laboratory National Renewable Energy Laboratory
December 13, 2007December 13, 2007Ag Outreach WebcastAg Outreach Webcast

2
People Want Renewable Energy!People Want Renewable Energy!
0
5000
10000
15000
20000
25000
30000
35000
40000
45000
50000
55000
60000
65000
70000
75000
80000
85000
Ca
pa
cit
y (
MW
)
United States Europe Rest of World
1. Germany: 21283 MW2. Spain: 13400 MW3. United States: 13223 MW 4. India: 7000 MW5. Denmark: 3134 MW
Source: WindPower Monthly
World total Oct 2007: 82,255 MW
Total Installed Wind CapacityTotal Installed Wind Capacity

3
U.S. Leads World in Annual Wind U.S. Leads World in Annual Wind Capacity Additions; Third in Cumulative CapacityCapacity Additions; Third in Cumulative Capacity

4
U.S Lagging Other Countries for U.S Lagging Other Countries for Wind As a Percentage of Electricity ConsumptionWind As a Percentage of Electricity Consumption

5
Installed Wind Capacities Installed Wind Capacities (‘99 – Oct 07)(‘99 – Oct 07)
6
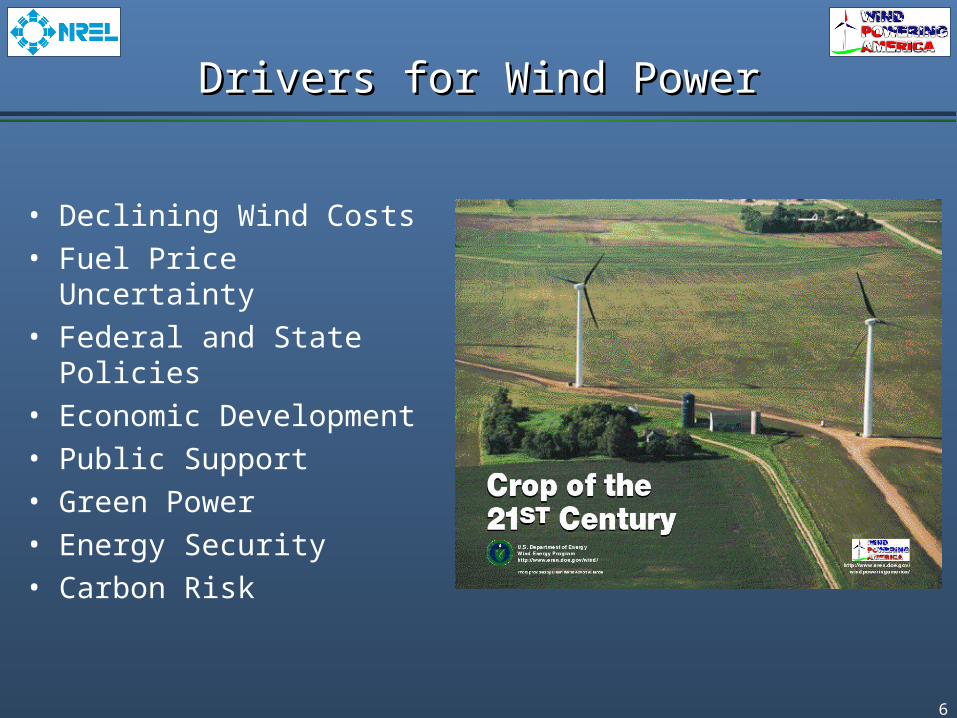
Drivers for Wind PowerDrivers for Wind Power
• Declining Wind Costs• Fuel Price Uncertainty• Federal and State
Policies• Economic Development• Public Support• Green Power• Energy Security• Carbon Risk

7
Wind Cost of EnergyWind Cost of Energy
0
2
4
6
8
10
12
14
1990 1995 2000 2005 2010 2015 2020
CO
E (
¢/k
Wh
[c
on
sta
nt
20
06
$])
Low wind speed sites
High windspeed sites
Depreciated Coal
Depreciated Wind
New Coal
2006: New Wind
Natural Gas (fuel only)
2007: New Wind

Copper & Steel Price Source: World Bank, Commodity Price Data
Wind Cost Wind Cost DriversDrivers
9
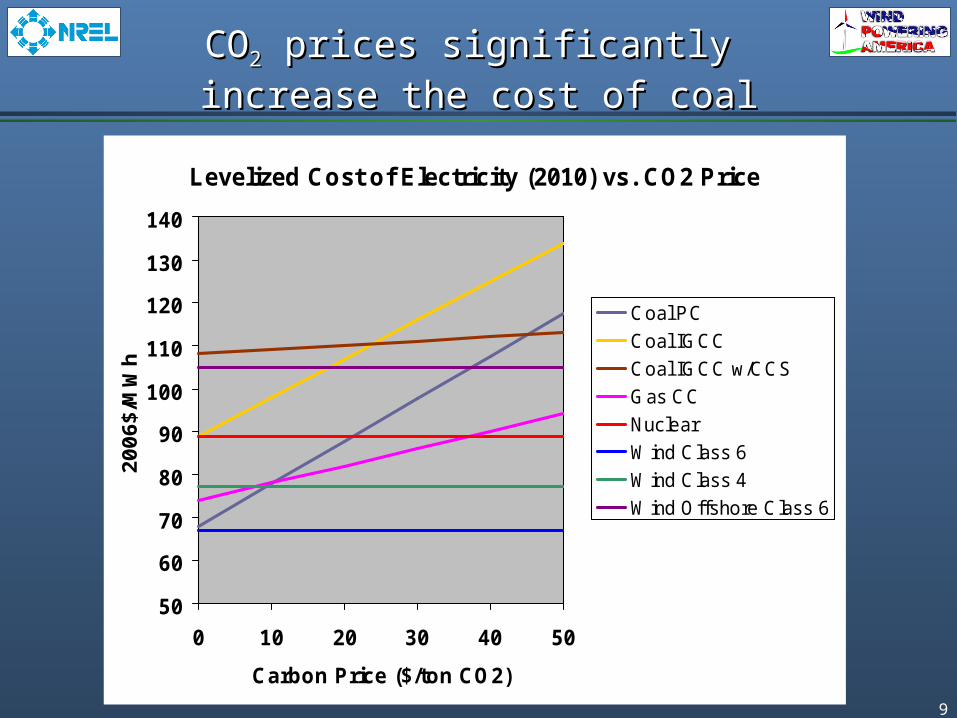
COCO22 prices significantly prices significantly
increase the cost of coalincrease the cost of coal
Levelized Cost of Electricity (2010) vs. CO2 Price
50
60
70
80
90
100
110
120
130
140
0 10 20 30 40 50
Carbon Price ($/ton CO2)
20
06
$/M
Wh
Coal PC
Coal IGCC
Coal IGCC w/CCS
Gas CC
Nuclear
Wind Class 6
Wind Class 4
Wind Offshore Class 6

10
Major Market Distortion: External Costs Major Market Distortion: External Costs of Fossil Fuels not Reflected in Pricingof Fossil Fuels not Reflected in Pricing
(The PTCs are a bargain)(The PTCs are a bargain)
11
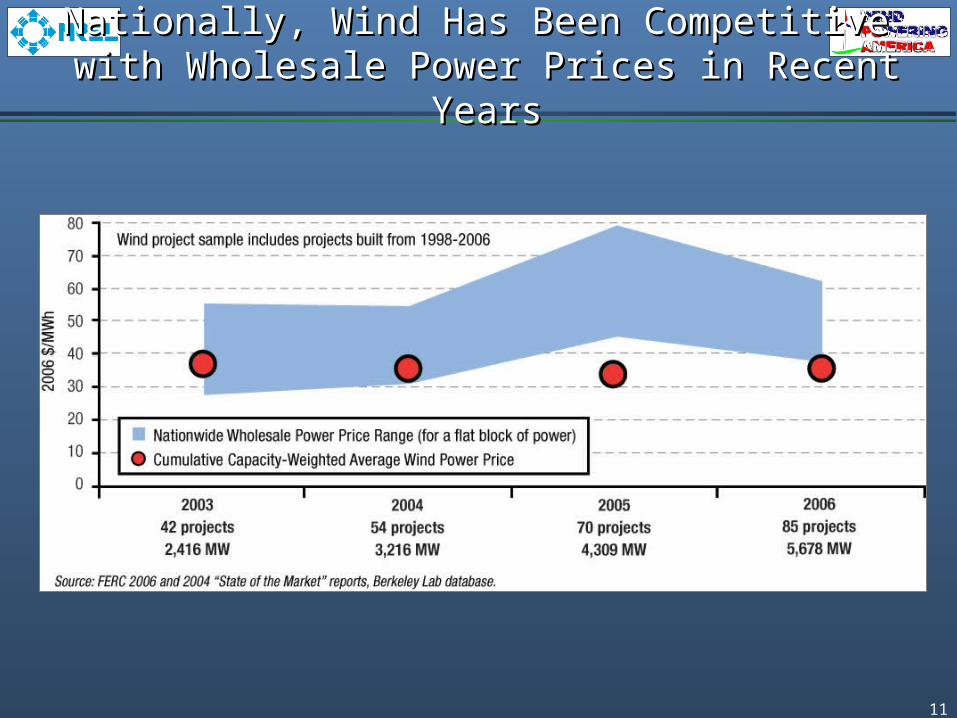
Nationally, Wind Has Been Competitive Nationally, Wind Has Been Competitive with Wholesale Power Prices in Recent Yearswith Wholesale Power Prices in Recent Years

12
In 2006, Wind Projects Built Since 1997 Were In 2006, Wind Projects Built Since 1997 Were Competitive with Wholesale Power Prices in Most RegionsCompetitive with Wholesale Power Prices in Most Regions

13
Renewables Portfolio StandardsRenewables Portfolio Standards
☼ Minimum solar or customer-sited RE requirement* Increased credit for solar or customer-sited RE
¹PA: 8% Tier I / 10% Tier II (includes non-renewables); SWH is a Tier II resourceDSIRE: www.dsireusa.org
September 2007
☼ PA: 18%¹ by 2020
☼ NJ: 22.5% by 2021
CT: 23% by 2020
MA: 4% by 2009 +1% annual increase
WI: requirement varies by utility; 10% by 2015 goal
IA: 105 MW
MN: 25% by 2025(Xcel: 30% by 2020)
TX: 5,880 MW by 2015
☼ AZ: 15% by 2025
CA: 20% by 2010
☼ *NV: 20% by 2015
ME: 30% by 200010% by 2017 - new RE
HI: 20% by 2020
RI: 16% by 2020
☼ CO: 20% by 2020 (IOUs)*10% by 2020 (co-ops & large munis)
☼ DC: 11% by 2022
☼ NY: 24% by 2013
MT: 15% by 2015
IL: 25% by 2025
VT: RE meets load growth by 2012*WA: 15% by 2020
☼ MD: 9.5% in 2022
☼ NH: 23.8% in 2025
OR: 25% by 2025 (large utilities)5% - 10% by 2025 (smaller utilities)
*VA: 12% by 2022
MO: 11% by 2020
☼ *DE: 20% by 2019
☼ NM: 20% by 2020 (IOUs)10% by 2020 (co-ops)
☼ NC: 12.5% by 2021 (IOUs)10% by 2018 (co-ops & munis)
ND: 10% by 2015
State Goal
State RPS
Solar water heating eligible
14
Wind Energy InvestorsWind Energy Investors

15

16
Economic Impacts of Economic Impacts of Alternative GenerationAlternative Generation
Economic impacts of wind vs. coal in Colorado (construction + 20 yrs of operation)
$-
$100
$200
$300
$400
$500
$600
$700
$800
Wind (607 MW) Coal (250 MW fromPRB)
Coal (40% in-state)
Do
llars
in M
illio
ns
Landowner revenue
Property taxes
Coal mining & transport
Operations
Construction
Colorado uses mostly out-of-state coal. But even with in-state coal…

17
Economic Development ImpactsEconomic Development Impacts
• Land Lease Payments: 2-3% of gross revenue $2500-4000/MW/year
• Local property tax revenue: ranges widely - $300K-1700K/yr per 100MW
• 100-200 jobs/100MW during construction
• 6-10 permanent O&M jobs per 100 MW
• Local construction and service industry: concrete, towers usually done locally

18
Case Study: Texas Case Study: Texas
Utilities and wind companies invested $1B in 2001 to build 912 MW of new wind power, resulting in:
• 2,500 quality jobs with a payroll of $75M
• $13.3M in tax revenues for schools and counties
• $2.5M in 2002 royalty income to landowners
• Another 2,900 indirect jobs as a result of the multiplier effect
• $4.6M increase in Pecos County property tax revenue in 2002
19
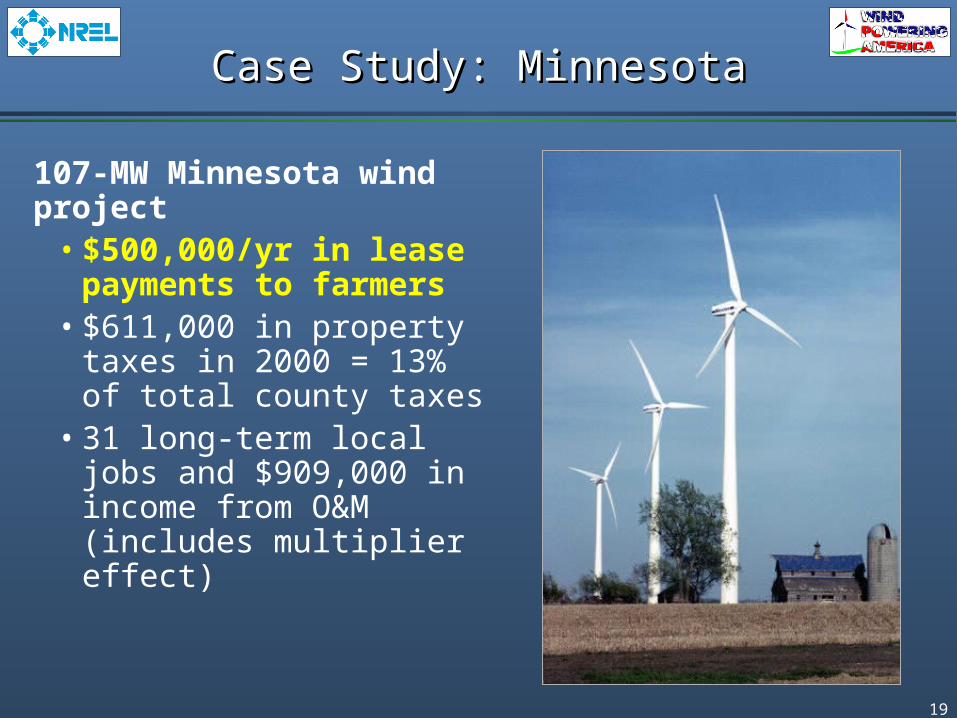
Case Study: MinnesotaCase Study: Minnesota
107-MW Minnesota wind project
• $500,000/yr in lease payments to farmers
• $611,000 in property taxes in 2000 = 13% of total county taxes
• 31 long-term local jobs and $909,000 in income from O&M (includes multiplier effect)

20
Case Study: IowaCase Study: Iowa
240-MW Iowa wind project
• $640,000/yr in lease payments to farmers ($2,000/turbine/yr)
• $2M/yr in property taxes• $5.5M/yr in O&M income• 40 long-term O&M jobs• 200 short-term
construction jobs• Doesn’t include multiplier
effect
21
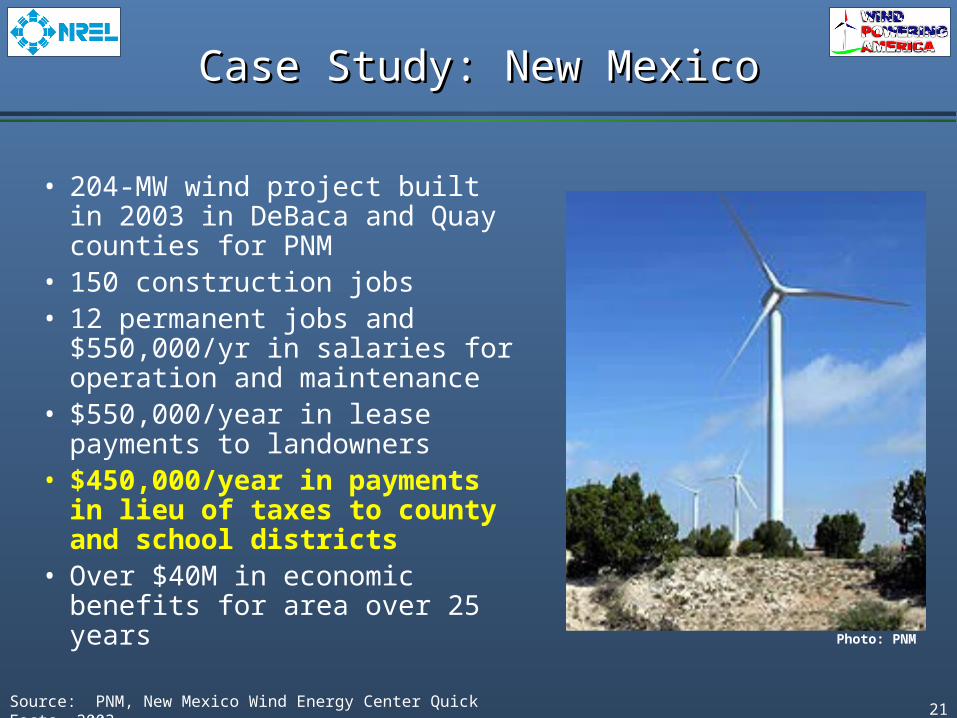
Case Study: New MexicoCase Study: New Mexico
• 204-MW wind project built in 2003 in DeBaca and Quay counties for PNM
• 150 construction jobs• 12 permanent jobs and
$550,000/yr in salaries for operation and maintenance
• $550,000/year in lease payments to landowners
• $450,000/year in payments in lieu of taxes to county and school districts
• Over $40M in economic benefits for area over 25 years
Source: PNM, New Mexico Wind Energy Center Quick Facts, 2003.
Photo: PNM
22
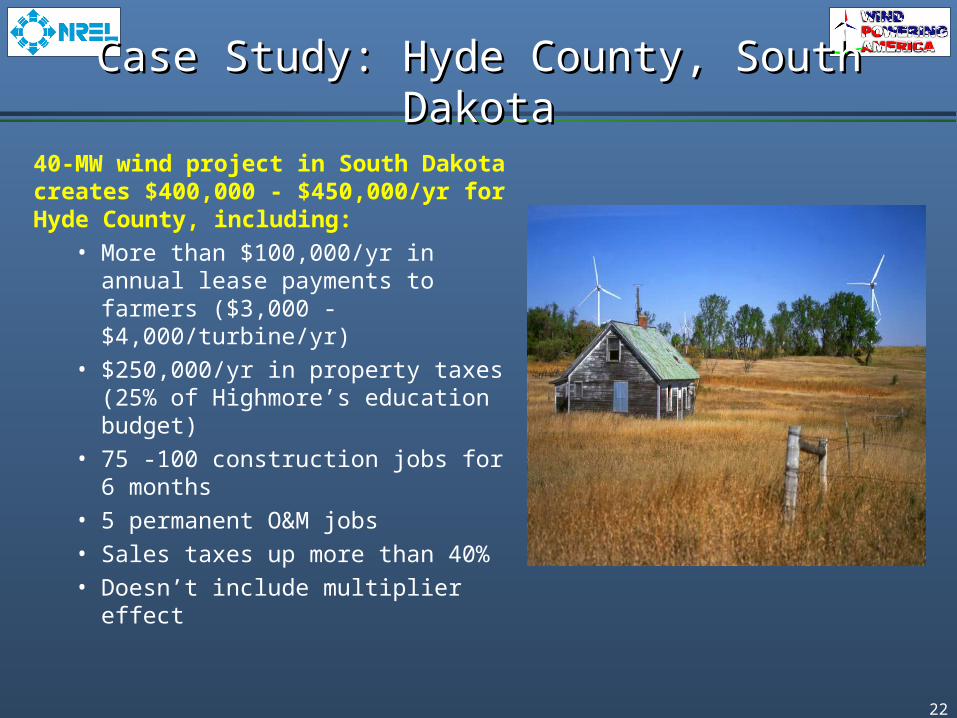
Case Study: Hyde County, South DakotaCase Study: Hyde County, South Dakota
40-MW wind project in South Dakota creates $400,000 - $450,000/yr for Hyde County, including:
• More than $100,000/yr in annual lease payments to farmers ($3,000 - $4,000/turbine/yr)
• $250,000/yr in property taxes (25% of Highmore’s education budget)
• 75 -100 construction jobs for 6 months
• 5 permanent O&M jobs• Sales taxes up more than 40%• Doesn’t include multiplier effect
23
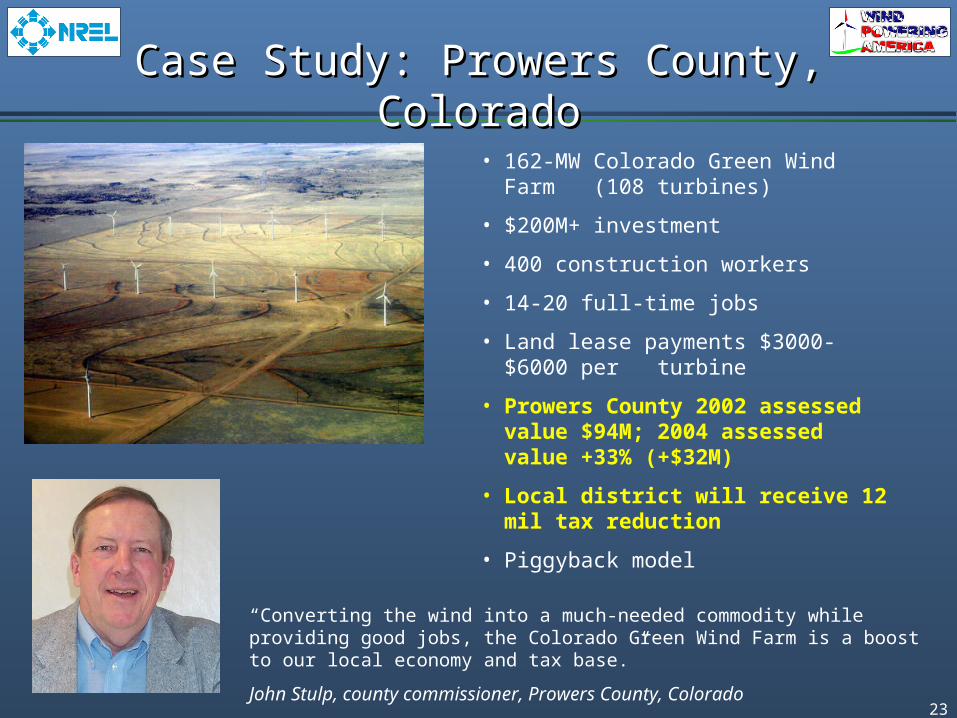
Case Study: Prowers County, ColoradoCase Study: Prowers County, Colorado
“Converting the wind into a much-needed commodity while providing good jobs, the Colorado Green Wind Farm is a boost to our local economy and tax base.”
John Stulp, county commissioner, Prowers County, Colorado
• 162-MW Colorado Green Wind Farm (108 turbines)
• $200M+ investment
• 400 construction workers
• 14-20 full-time jobs
• Land lease payments $3000-$6000 per turbine
• Prowers County 2002 assessed value $94M; 2004 assessed value +33% (+$32M)
• Local district will receive 12 mil tax reduction
• Piggyback model
24
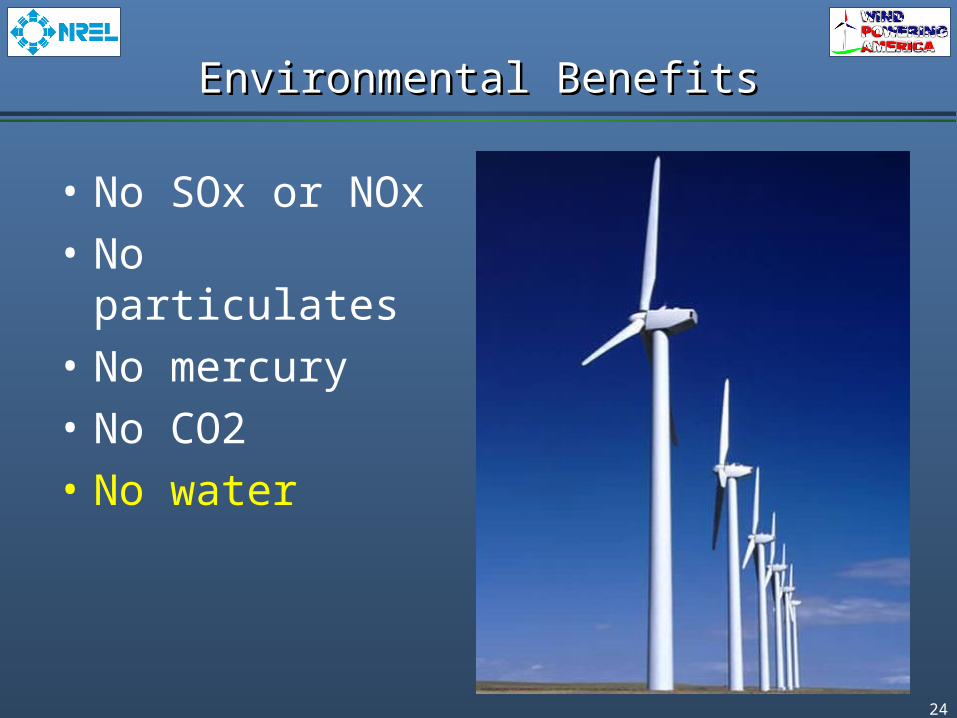
Environmental BenefitsEnvironmental Benefits
• No SOx or NOx
• No particulates
• No mercury
• No CO2
• No water
25Source: NOAA

26Source: NOAA
27
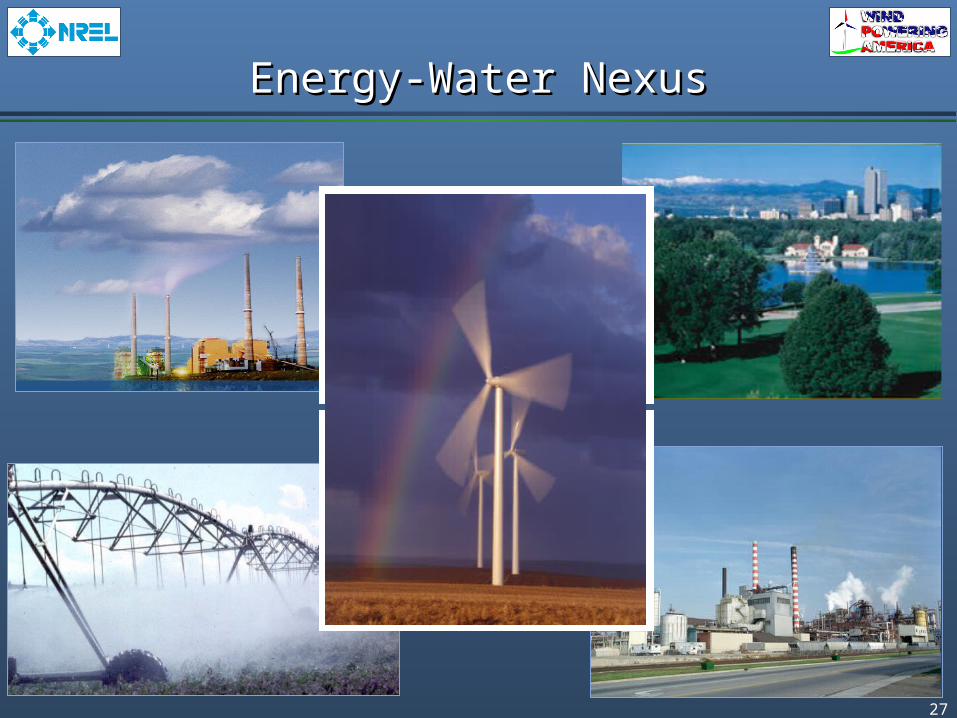
Energy-Water NexusEnergy-Water Nexus
28
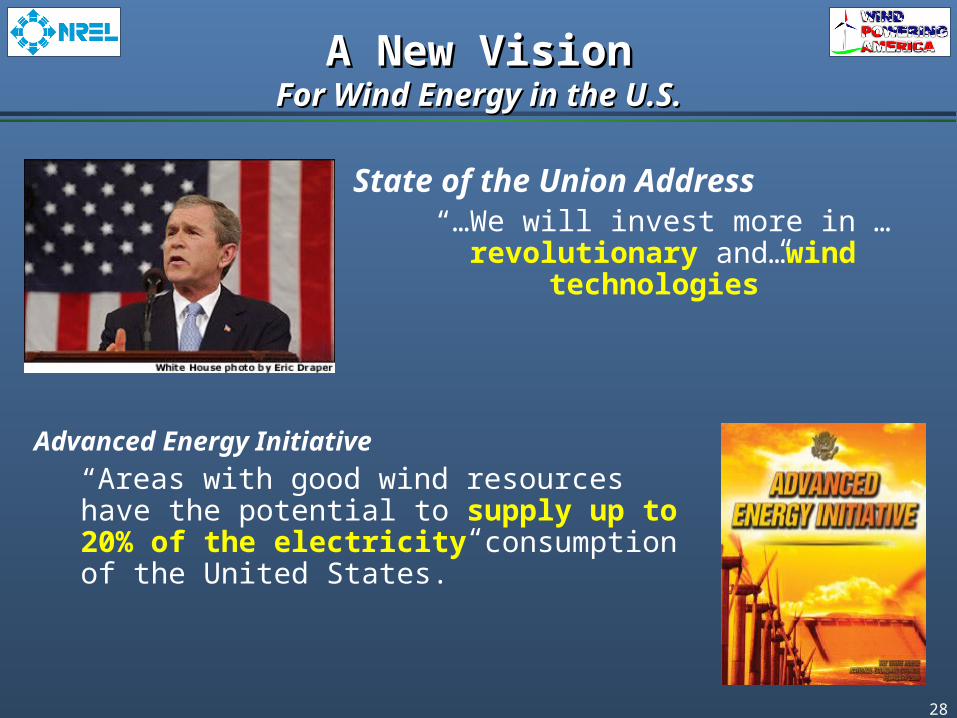
State of the Union Address“…We will invest more in … revolutionary and…wind
technologies”
Advanced Energy Initiative
“Areas with good wind resources have the potential to supply up to 20% of the electricity consumption of the United States.”
A New VisionA New VisionFor Wind Energy in the U.S.For Wind Energy in the U.S.
29
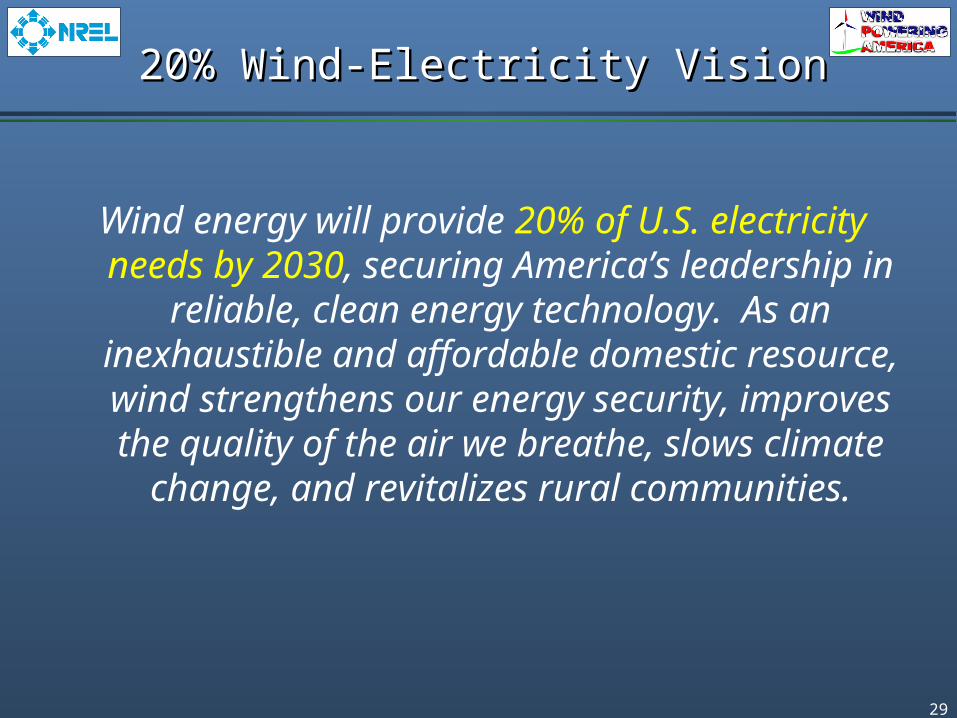
20% Wind-Electricity Vision20% Wind-Electricity Vision
Wind energy will provide 20% of U.S. electricity needs by 2030, securing America’s leadership in
reliable, clean energy technology. As an inexhaustible and affordable domestic resource, wind strengthens our energy security, improves the quality of the air we breathe, slows climate
change, and revitalizes rural communities.

30
20% Wind-Electricity Vision20% Wind-Electricity Vision
• 6 task forces:– Technology/Manufacturing
– Transmission/Utility Operations
– Siting/Environment
– Markets/Stakeholders
– Policy
– Analysis/Benefits
- 200 400 600 800 1,0000
20
40
60
80
100
120
140
Quantity Available, GW
Lev
eliz
ed C
ost
of
En
erg
y, $
/MW
h
Onshore
Class 6
Class 4
Class 7
Class 5
Class 3
Offshore
Class 6
Class 4
Class 7
Class 5
Class 3
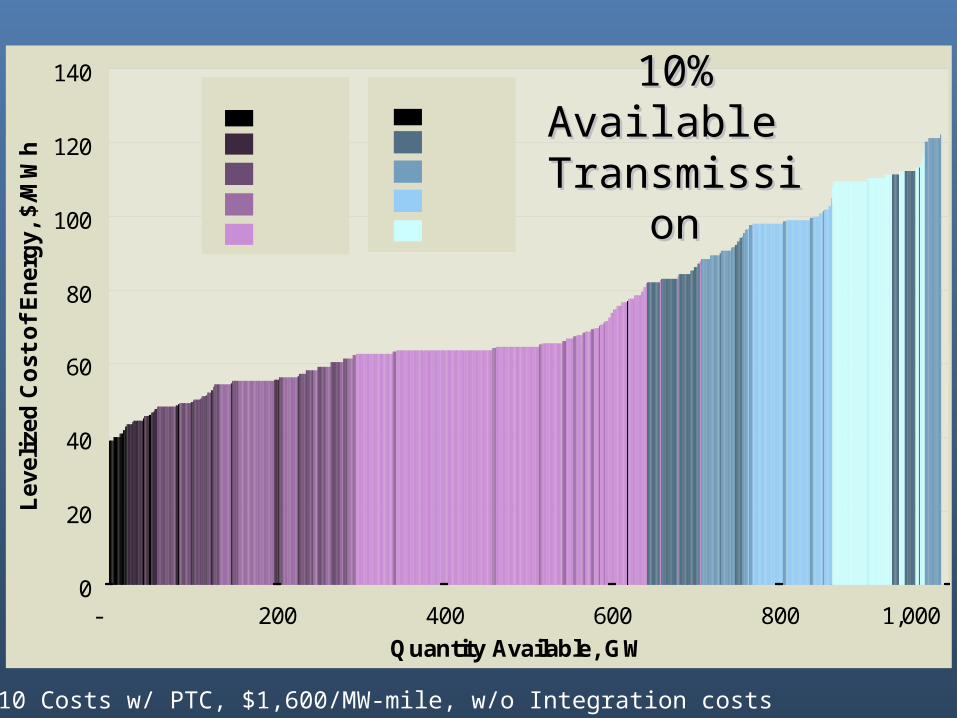
10% Available 10% Available
TransmissionTransmission
2010 Costs w/ PTC, $1,600/MW-mile, w/o Integration costs
33
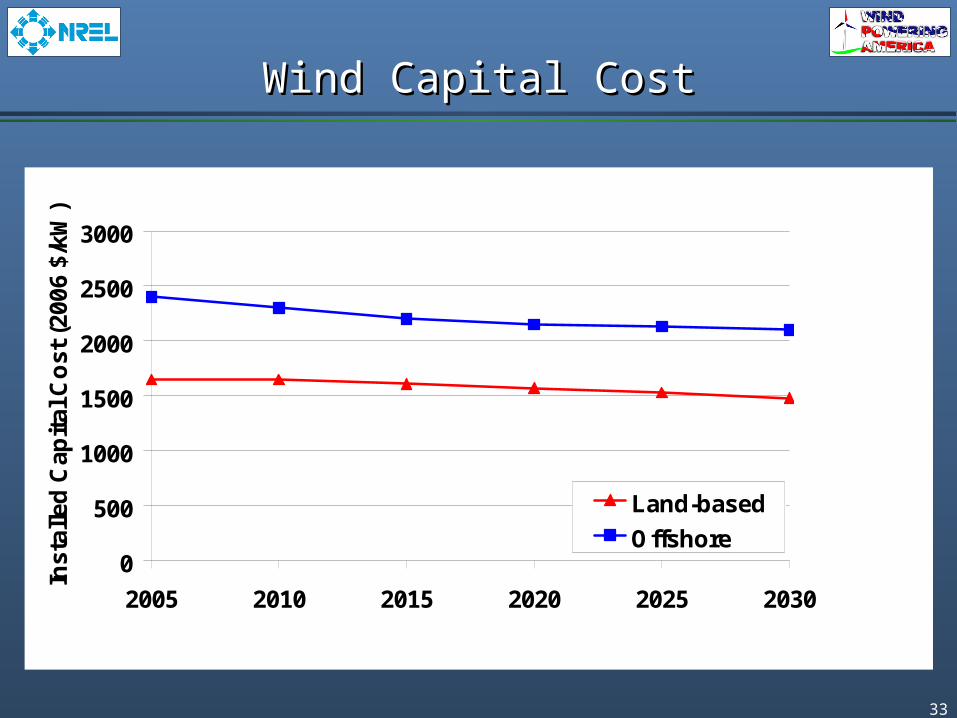
Wind Capital CostWind Capital Cost
0
500
1000
1500
2000
2500
3000
2005 2010 2015 2020 2025 2030
Inst
alle
d C
apit
al C
ost
(20
06 $
/kW
)
Land-based
Offshore
34
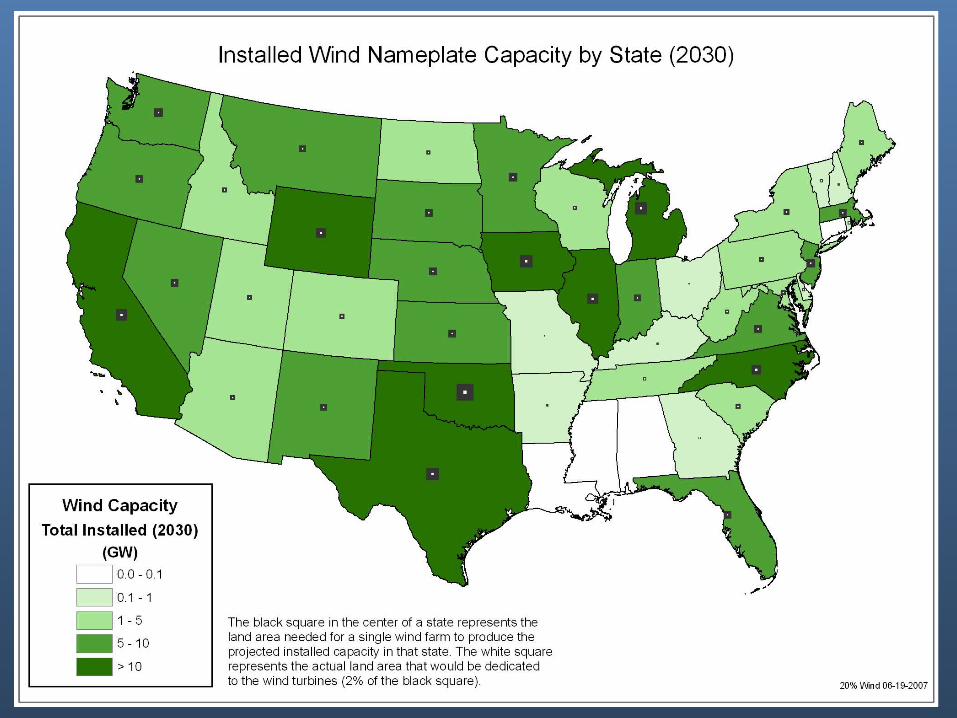
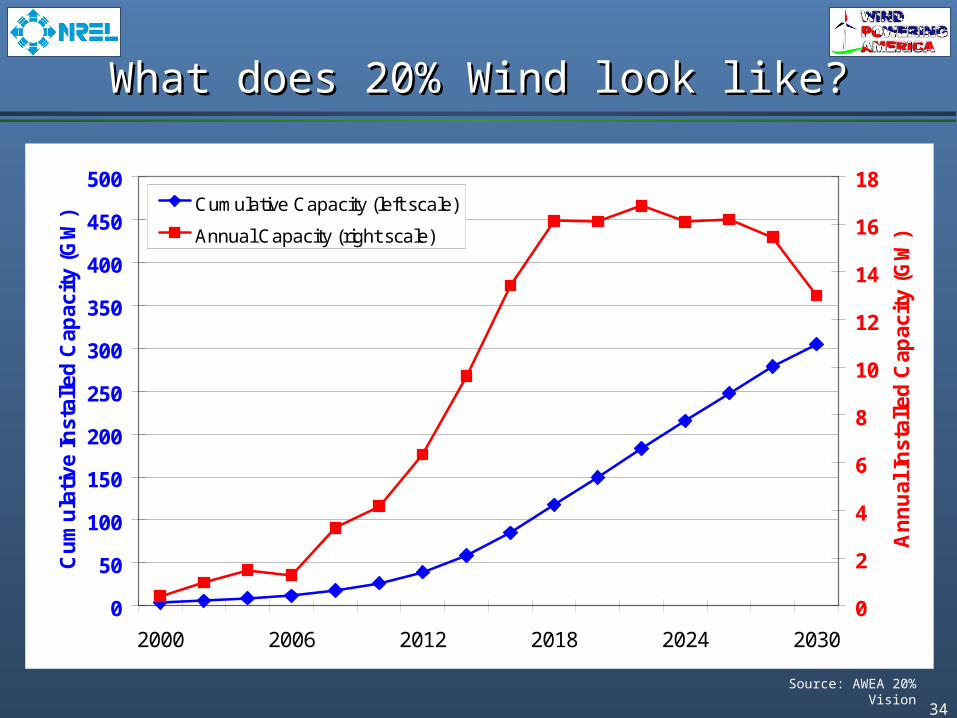
What does 20% Wind look like?What does 20% Wind look like?
Source: AWEA 20% Vision
0
50
100
150
200
250
300
350
400
450
500
2000 2006 2012 2018 2024 2030
Cu
mu
lati
ve In
stal
led
Cap
acit
y (G
W)
0
2
4
6
8
10
12
14
16
18
An
nu
al In
stal
led
Cap
acit
y (G
W)
Cumulative Capacity (left scale)
Annual Capacity (right scale)


36
Generation Mix with and without 20% WindGeneration Mix with and without 20% Wind
0
500
1000
1500
2000
2500
3000
Hydro
Gas-C
T
Gas-C
C
Coal -
w/ Scr
ubbers
Coal -
No Scr
ubbers
Coal-n
ew
Coal-IG
CC
Nuclea
r
Oil-Gas
-Ste
amW
ind
Gen
erat
ion
(T
Wh
)
20% Wind
No Wind
0
50
100
150
200
250
300
350
Hydro
Gas-C
T
Gas-C
C
Coal w
/Scr
ubbers
Coal-N
o Scr
ub
Coal-N
ew
Coal-IG
CC
Nuclea
r
Oil-Gas
-Ste
amW
ind
Cap
acit
y (G
W)
20% WindNo Wind


38
Construction Phase:• 4.46 M FTE jobs• $651 B to the US
economyOperations:• 2.15 M FTE jobs• $293 B to the US
economy
Wind energy’s economic “ripple effect”
All monetary values are in 2006 dollars. Construction Phase = 1-2 years
• Total economic benefit = $1,359 billion
• New jobs during construction = 6.2 M FTE jobs
• New operations jobs =3.3 M FTE jobs
Indirect & Induced Impacts
Totals (construction + 20yrs)
National (U.S.) – Economic Impacts National (U.S.) – Economic Impacts Cumulative impacts from 2007-2030 Cumulative impacts from 2007-2030
From the 20% Scenario- 300 GW new Onshore and Offshore developmentFrom the 20% Scenario- 300 GW new Onshore and Offshore development
Direct Impacts
Payments to Landowners: • $782 MLocal Property Tax Revenue:• $1,877 MConstruction Phase:• 1.75 M FTE jobs• $ 293 B to the US economyOperations:• 1.16 M FTE jobs• $122 B to the US economy

40
20% Wind Vision Employment20% Wind Vision Employment
-
20,000
40,000
60,000
80,000
100,000
120,000
140,000
160,000
180,000
200,000
2007
2009
2011
2013
2015
2017
2019
2021
2023
2025
2027
2029
Job
s
Operations
Construction
Manufacturing
42
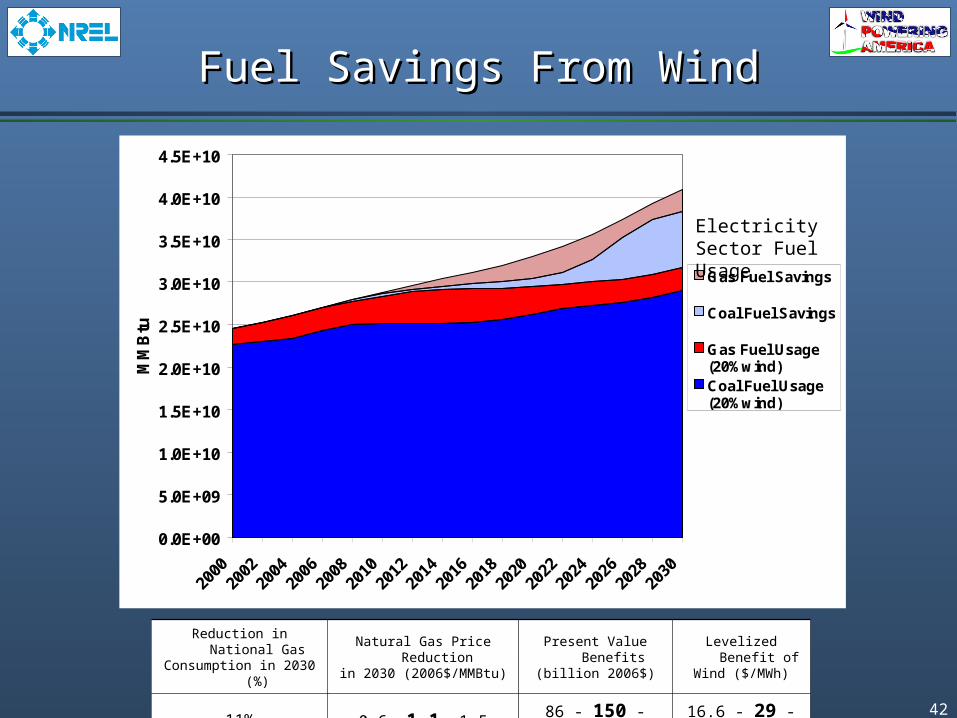
Fuel Savings From WindFuel Savings From Wind
0.0E+00
5.0E+09
1.0E+10
1.5E+10
2.0E+10
2.5E+10
3.0E+10
3.5E+10
4.0E+10
4.5E+10
2000
2002
2004
2006
2008
2010
2012
2014
2016
2018
2020
2022
2024
2026
2028
2030
MM
Btu
Gas Fuel Savings
Coal Fuel Savings
Gas Fuel Usage(20%wind)Coal Fuel Usage(20%wind)
Reduction in National GasConsumption in 2030 (%)
Natural Gas Price Reduction in 2030 (2006$/MMBtu)
Present Value Benefits(billion 2006$)
Levelized Benefit of Wind ($/MWh)
11% 0.6 -1.1- 1.5 86 - 150 - 214 16.6 - 29 - 41.6
Electricity Sector Fuel Usage
43
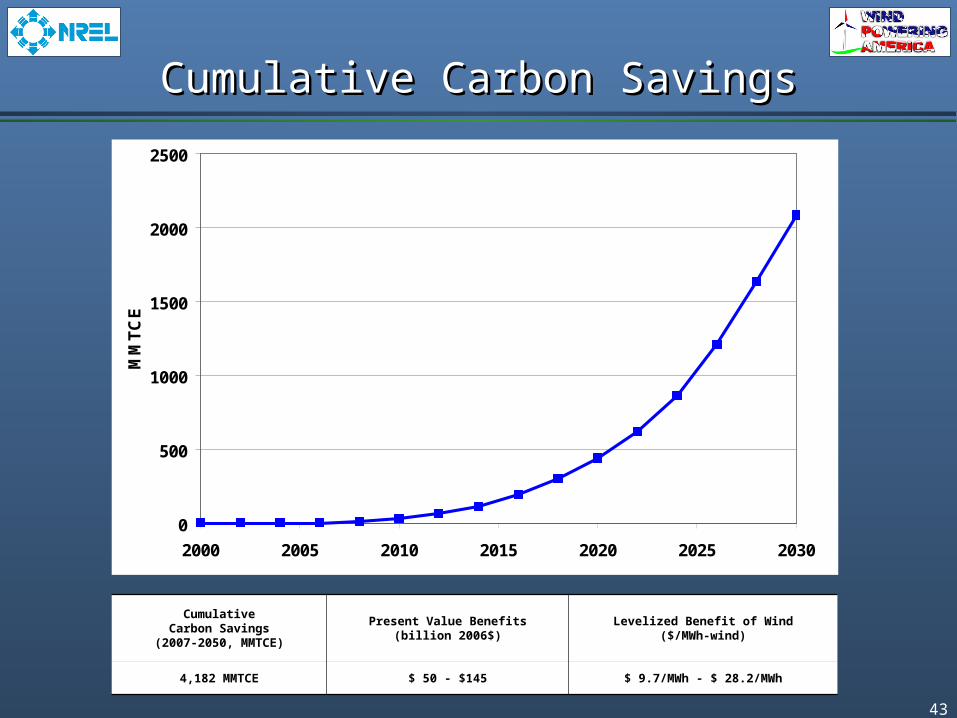
Cumulative Carbon SavingsCumulative Carbon Savings
0
500
1000
1500
2000
2500
2000 2005 2010 2015 2020 2025 2030
MM
TC
E
CumulativeCarbon Savings
(2007-2050, MMTCE)
Present Value Benefits(billion 2006$)
Levelized Benefit of Wind($/MWh-wind)
4,182 MMTCE $ 50 - $145 $ 9.7/MWh - $ 28.2/MWh

44
Electric Sector COElectric Sector CO22 Emissions Emissions
45
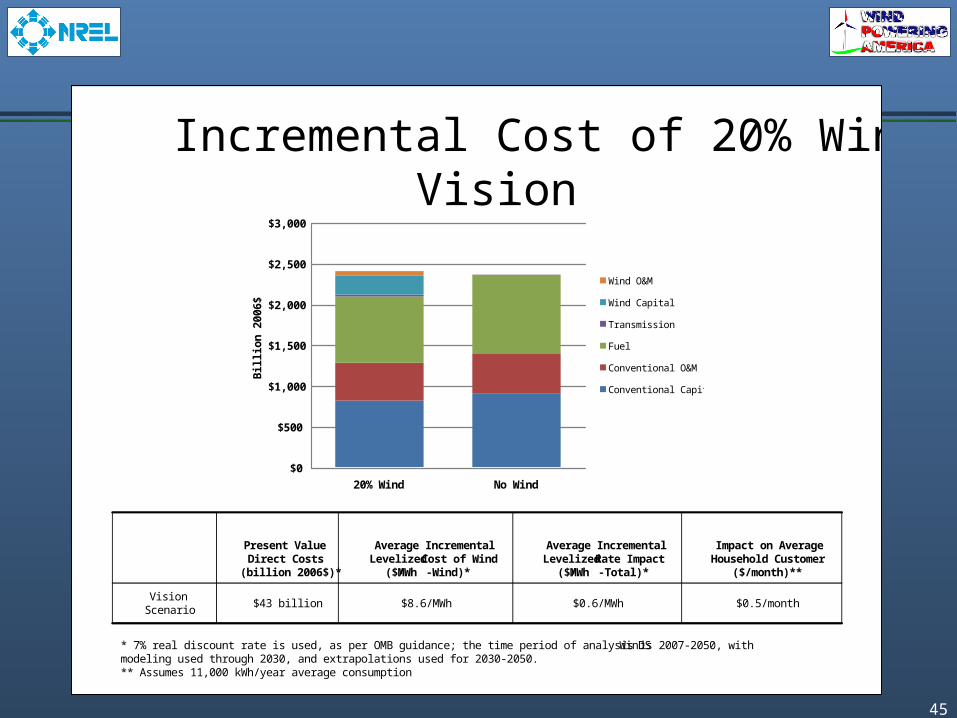
Incremental Cost of 20% WindVision
$0.5/month$0.6/MWh$8.6/MWh$43 billionVision
Scenario
Impact on AverageHousehold Customer
($/month)**
Average IncrementalLevelized Rate Impact
($/MWh-Total)*
Average IncrementalLevelized Cost of Wind
($/MWh-Wind)*
Present ValueDirect Costs
(billion 2006$)*
* 7% real discount rate is used, as per OMB guidance; the time period of analysis is 2007-2050, with WinDSmodeling used through 2030, and extrapolations used for 2030-2050.** Assumes 11,000 kWh/year average consumption
$0
$500
$1,000
$1,500
$2,000
$2,500
$3,000
20% Wind No Wind
Bil
lio
n 2
00
6$
Wind O&M
Wind Capital
Transmission
Fuel
Conventional O&M
Conventional Capital

46
Incremental direct cost to society $43 billion
Reductions in emissions of greenhouse gasses and other atmospheric pollutants
825 M tons (2030)
$98 billion
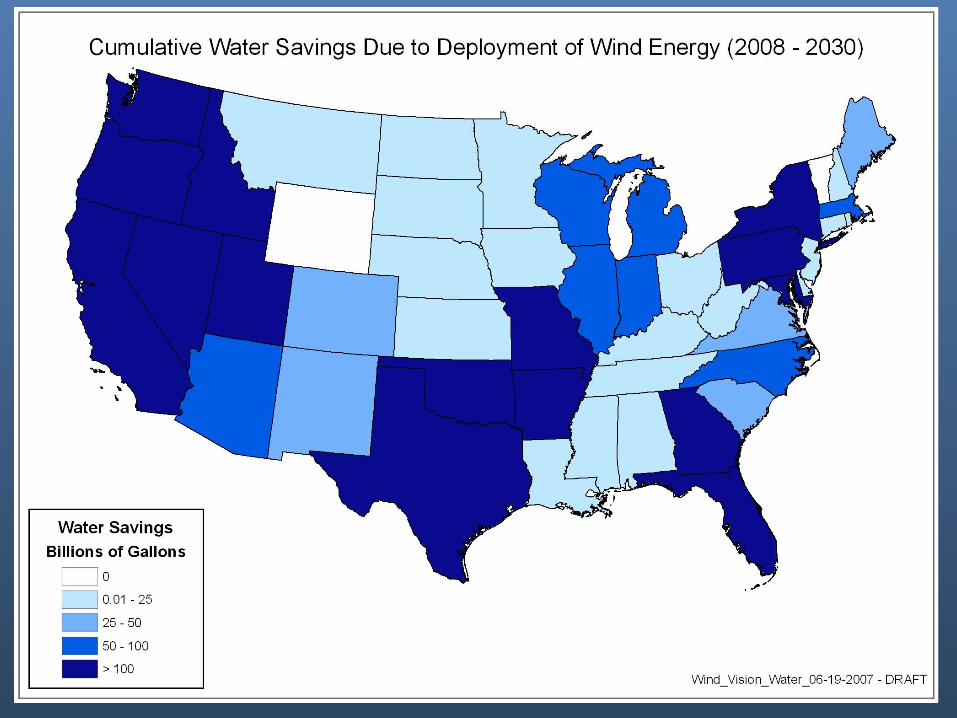
Reductions in water consumption 8% total electric
17% in 2030
Jobs created and other economic benefits
140,000 direct
$450 billion total
Reductions in natural gas use and price pressure
11%
$150 billion
Net Benefits: $205B + Water savings
Results: Results: CostsCosts & Benefits& Benefits

47
• National and state policy uncertainty• Mixed stakeholder perspectives and knowledge• Electricity supply planning based on capacity• Variable wind output viewed as unreliable• Incomplete comparative generation assessments• Mismatch of wind and transmission development
timeframes• Federal lending all source requirements for G&T’s• Lack of interstate approach to transmission development• Need for utility financial incentives to own wind facilities• High cost and low turbine availability for community
projects• Uncertainty in emerging emissions REC markets
Market ChallengesMarket Challenges

48
ConclusionsConclusions
• 20% wind energy penetration is possible• 20% penetration is not going to happen under business
as usual scenario• Policy choices will have a large impact on assessing the
timing and rate of achieving a 20% goal• Key Issues: market transformation, transmission, project
diversity, technology development, policy, public acceptance
• 20% Vision report: February 2008
49
“With public sentiment nothing can fail; without it, nothing can succeed.”
- A. Lincoln

Carpe Ventem
www.windpoweringamerica.gov