WIND DATA REPORT - UMass Amherst · All the work presented in this Wind Data Report including...
21
Wind Energy Center University of Massachusetts, Amherst 160 Governors Drive, Amherst, MA 01003 www.umass.edu/windenergy • (413) 545-4359 • [email protected] WIND DATA REPORT Worcester, MA October 15, 2009 to October 15, 2010 Prepared for Massachusetts Clean Energy Center 55 Summer Street, 9th Floor Boston, MA 02110 by Utama Abdulwahid James F. Manwell Anthony F. Ellis January 28, 2011 Report template version 1.7
Transcript of WIND DATA REPORT - UMass Amherst · All the work presented in this Wind Data Report including...
Wind Energy Center University of Massachusetts, Amherst 160 Governors Drive, Amherst, MA 01003
www.umass.edu/windenergy • (413) 545-4359 • [email protected]
WIND DATA REPORT
Worcester, MA
October 15, 2009 to October 15, 2010
Prepared for
Massachusetts Clean Energy Center 55 Summer Street, 9th Floor
Boston, MA 02110
by
Utama Abdulwahid James F. Manwell Anthony F. Ellis
January 28, 2011
Report template version 1.7

NOTICE AND ACKNOWLEDGEMENTS
This report was prepared by the Wind Energy Center (WEC) at the University of Massachusetts, Amherst in the course of performing work sponsored by the Renewable Energy Trust (RET), as administered by the Massachusetts Clean Energy Center (MassCEC). The opinions expressed in this report do not necessarily reflect those of MTC or the Commonwealth of Massachusetts, and reference to any specific product, service, process, or method does not constitute an implied or expressed recommendation or endorsement of it.
Further, MassCEC, the Commonwealth of Massachusetts, and the Wind Energy Center make no warranties or representations, expressed or implied, as to the fitness for particular purpose or merchantability of any product, apparatus, or service, or the usefulness, completeness, or accuracy of any processes, methods or other information contained, described, disclosed, or referred to in this report. MassCEC, the Commonwealth of Massachusetts, and the Wind Energy Center make no representation that the use of any product, apparatus, process, method, or other information will not infringe privately owned rights and will assume no liability for any loss, injury, or damage directly or indirectly resulting from, or occurring in connection with, the use of information contained, described, disclosed, or referred to in this report.
January 28, 2011 Wind Energy Center Page 1 University of Massachusetts, Amherst Amherst, MA 01003
TABLE OF CONTENTS
Notice and Acknowledgements ...................................................................................................... 1 Table of Contents ............................................................................................................................ 2 Table of Figures .............................................................................................................................. 3 Executive Summary ........................................................................................................................ 4 SECTION 1 - Station Location ....................................................................................................... 5 SECTION 2 - Instrumentation and Equipment ............................................................................... 5 SECTION 3 - Data Summary ......................................................................................................... 6 SECTION 4 - Long Term Estimate and Capacity Factor ............................................................... 8 SECTION 5 - Graphs ...................................................................................................................... 9
Wind Speed Time Series ........................................................................................................... 10 Wind Speed Distributions ......................................................................................................... 11 Monthly Average Wind Speeds ................................................................................................ 11 Diurnal Average Wind Speeds .................................................................................................. 12 Turbulence Intensities ............................................................................................................... 12 Wind Roses ............................................................................................................................... 13
SECTION 6 - Significant Meteorological Events ........................................................................ 13 SECTION 7 - Data Collection and Maintenance .......................................................................... 14 SECTION 8 - Data Recovery and Validation ............................................................................... 14 APPENDIX A - Plot Data............................................................................................................. 15
Wind Speed Distribution Data .................................................................................................. 15 Monthly Average Wind Speed Data ......................................................................................... 16 Diurnal Average Wind Speed Data ........................................................................................... 18 Wind Rose Data ........................................................................................................................ 19
January 28, 2011 Wind Energy Center Page 2 University of Massachusetts, Amherst Amherst, MA 01003
January 28, 2011 Wind Energy Center Page 3 University of Massachusetts, Amherst Amherst, MA 01003
TABLE OF FIGURES
Figure 1 – Site Location .................................................................................................................. 5 Figure 2 - Wind Speed Time Series at 100 m ............................................................................... 10 Figure 3 – Wind Speed Distribution, October 2009 to October 2010 .......................................... 11 Figure 4 – Monthly Average Wind Speed at 50 m and 100 m, October 2009 to October 2010 .. 11 Figure 5 – Diurnal Average Wind Speed, October 2009 to October 2010 ................................... 12 Figure 6 – Turbulence Intensity at 100 m, October 2009 to October 2010 .................................. 12 Figure 7 – Wind Rose – Percentage of Time, October 2009 to October 2010 ............................. 13 Figure 8 – Wind Rose – Average Wind Speed, October 2009 to October 2010 .......................... 13
EXECUTIVE SUMMARY
All the work presented in this Wind Data Report including installation and decommissioning of the meteorological tower and instrumentation, and the data analysis and reporting was performed by the Wind Energy Center (WEC) at the University of Massachusetts, Amherst.
This report covers wind data measured by a Second Wind Triton SODAR unit installed at Green Hill Park complex in the city of Worcester, MA. Installed on October 15th, 2009, the SODAR unit was in continuous operation until October 22nd, 2010. This report is the final report for Worcester.
The data covered by this final report is one calendar year from October 15th, 2009 until October 15th 2010. The gross data recovery percentage (the actual percentage of expected data received) was 100% and the net data recovery percentage (the percentage of expected data which has a quality value of 90% or higher) varies between 92% at 40 m to 30% at 200 m for the annual period covered in this report.
The mean recorded wind speed for this year at 50 m was 5.53 m/s (12.4 mph*) and at 100 m was 6.75 m/s (15.1 mph*). The prevailing wind direction was from the west at both 50 m and 100 m height.
The average wind shear coefficient was 0.25. The average turbulence intensity was both 0.15 at 50 m and at 100 m.
Additional information about interpreting the data presented in this report can be found in the Fact Sheet, “Interpreting Your Wind Resource Data,” produced by WEC and the Massachusetts Technology Collaborative (MTC). This document is found through the WEC website:
http://www.ceere.org/rerl/about_wind/RERL_Fact_Sheet_6_Wind_resource_interpretation.pdf
* 1 m/s = 2.237 mph.
January 28, 2011 Wind Energy Center Page 4 University of Massachusetts, Amherst Amherst, MA 01003

SECTION 1 - Station Location
The site is a parking lot by a baseball field within the Green Hill Park complex in Worcester. The coordinates of the site is 42.27927 N, 71.78072 W (WGS84) and shown as the white triangle in Figure 1. The site sits close to the western face of a ridge that runs from the northeast to the southwest. A lower and shorter ridge runs in the same direction a quarter of a mile to the west.
Figure 1 – Site Location
SECTION 2 - Instrumentation and Equipment
The Second Wind Triton SODAR is used at this location with the following package versions:
Triton Base Package Platform Package SelfTest Package Sodar Package 183 1.7 2.2 1.1 1.7
January 28, 2011 Wind Energy Center Page 5 University of Massachusetts, Amherst Amherst, MA 01003

SECTION 3 - Data Summary
An excerpt of the wind speeds and wind directions measured during the reporting period is included in Table 1. Table 1 includes the mean wind speeds, the maximum instantaneous wind speed and the prevailing wind direction measured at 50 m and 100 m together with the percentage of data used in the calculations of those values. The full table including measurement from all measured heights is given in the Appendix. These values are provided for each month of the reporting period and for the year between October 15th 2009 to October 15th 2010.
Table 1. Wind Speed and Direction Data Summary
Month Mean Wind Speed
Max Wind Speed
Prevailing Wind
Direction
Percentage of Data
Mean Wind Speed
Max Wind Speed
Prevailing Wind
Direction
Percentage of Data
Height 50 m 50 m 50 m 100 m 100 m 100 m
Units [m/s] [m/s] [m/s] [m/s]
Oct‐09 5.56 14.92 NNW 98% 7.14 17.34 NNW 92%
Nov‐09 5.53 15.58 NNW 97% 7.01 16.92 NW 89%
Dec‐09 6.04 16.57 W 68% 7.62 18.88 WNW 49%
Jan‐10 6.05 18.13 W 61% 7.39 17.51 WNW 55%
Feb‐10 6.37 16.14 WNW 86% 7.60 16.84 WNW 79%
Mar‐10 6.57 17.27 NNW 97% 7.66 17.81 NNW 84%
Apr‐10 5.45 17.95 W 98% 6.58 14.99 WNW 90%
May‐10 5.20 15.83 ENE 100% 6.32 16.24 ENE 95%
Jun‐10 4.73 12.31 ENE 99% 5.90 13.96 ENE 98%
Jul‐10 4.82 10.62 ENE 97% 6.00 13.20 ENE 94%
Aug‐10 4.97 11.54 ENE 99% 6.32 14.20 ENE 95%
Sep‐10 5.45 12.04 ENE 99% 6.93 14.97 ENE 96%
Oct‐10 6.16 14.85 NW 92% 7.72 18.59 NNW 87% Oct 2009
to Oct 2010
5.53 18.13 W 90% 6.75 18.88 W 83%
The values above are calculated when the 10-minute data has a Quality Factor of 90% and above. The percentage of data used to obtain values in the table above is reported to show how well they represent their respective time periods.
A summary of the turbulence intensity and mean wind shear measured at each measurement height during the reporting period is included in Table 2. These values are provided for each month of the reporting period and for the whole reporting period. Measurement of Turbulence Intensity from SODAR data is slightly different than from anemometer data. In principle, Turbulence Intensity is calculated by dividing the standard
January 28, 2011 Wind Energy Center Page 6 University of Massachusetts, Amherst Amherst, MA 01003
deviation of the wind speed by the mean wind speed and is a measure of the gustiness of a wind resource. Anemometers provide measurements of the standard deviation and mean wind speed in the same horizontal plane, therefore the turbulence intensity calculated from anemometer measurements is characteristic of the horizontal flow. The Triton measures in 3 directions 11.4 degrees from vertical and equispaced horizontally to derive the horizontal and vertical wind speed components. This means that the direct measurements are made very close to the vertical and the turbulence intensity given by the Triton is characteristic of the turbulence in those directions at which the sound beam is pointed to. During periods of high atmospheric mixing the difference between turbulence from these two methods are close to each other but they may differ up to 30% when there is less mixing, for example during night time.
Lower turbulence results in lower mechanical loads on a wind turbine. Turbulence intensity varies with wind speed. The average turbulence intensity presented in Table 2 is the mean turbulence intensity at 50 m and 100 m reported by the Triton.
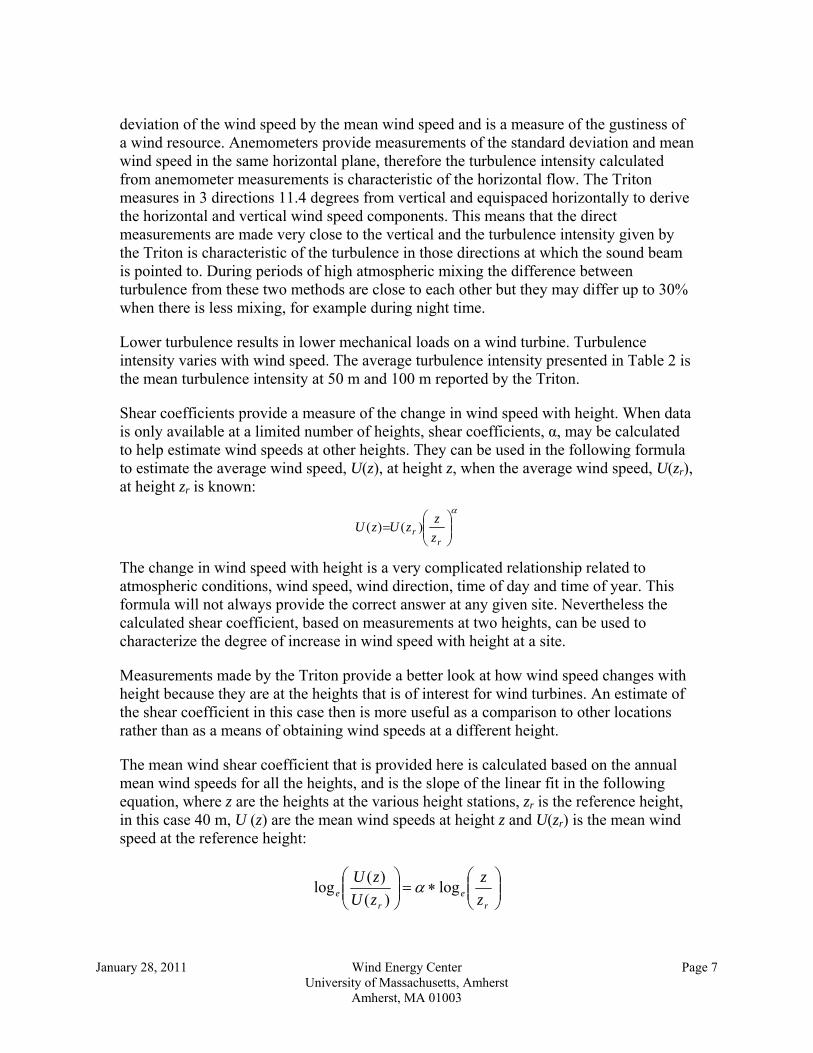
Shear coefficients provide a measure of the change in wind speed with height. When data is only available at a limited number of heights, shear coefficients, α, may be calculated to help estimate wind speeds at other heights. They can be used in the following formula to estimate the average wind speed, U(z), at height z, when the average wind speed, U(zr), at height zr is known:
α
⎟⎟⎠
⎞⎜⎜⎝
⎛=
rr z
zzUzU )()(
The change in wind speed with height is a very complicated relationship related to atmospheric conditions, wind speed, wind direction, time of day and time of year. This formula will not always provide the correct answer at any given site. Nevertheless the calculated shear coefficient, based on measurements at two heights, can be used to characterize the degree of increase in wind speed with height at a site.
Measurements made by the Triton provide a better look at how wind speed changes with height because they are at the heights that is of interest for wind turbines. An estimate of the shear coefficient in this case then is more useful as a comparison to other locations rather than as a means of obtaining wind speeds at a different height.
The mean wind shear coefficient that is provided here is calculated based on the annual mean wind speeds for all the heights, and is the slope of the linear fit in the following equation, where z are the heights at the various height stations, zr is the reference height, in this case 40 m, U (z) are the mean wind speeds at height z and U(zr) is the mean wind speed at the reference height:
⎟⎟⎠
⎞⎜⎜⎝
⎛∗=⎟⎟
⎠
⎞⎜⎜⎝
⎛
re
re z
zzUzU log
)()(log α
January 28, 2011 Wind Energy Center Page 7 University of Massachusetts, Amherst Amherst, MA 01003

Table 2. Shear and Turbulence Intensity Data Summary
Month Turbulence Intensity
Turbulence Intensity
Shear Coefficient
Height 50 m 100 m ‐ Oct‐09 0.15 0.13 0.40 Nov‐09 0.13 0.12 0.39 Dec‐09 0.14 0.14 0.33 Jan‐10 0.14 0.16 0.35 Feb‐10 0.15 0.18 0.22 Mar‐10 0.15 0.16 0.21 Apr‐10 0.14 0.16 0.24 May‐10 0.15 0.17 0.26 Jun‐10 0.14 0.15 0.31 Jul‐10 0.15 0.14 0.28 Aug‐10 0.15 0.15 0.29 Sep‐10 0.14 0.13 0.34 Oct‐10 0.14 0.13 0.31
October 2009 to October 2010
0.15 0.15 0.25
SECTION 4- Long Term Estimate and Capacity Factor
Wind speed varies year by year and the mean obtained over the measurement period may be less or more compared to what is seen over a longer time period. Therefore, the use of the long term mean at the site is preferred when projecting the performance of a wind turbine. The long term mean at a site may be estimated by using the Measure-Correlate-Predict (MCP) method.
The MCP method correlates wind speed measurements at the target site to a reference site which collects data over the same period of time and has been collecting data for a much longer period. Based on this correlation, the reference wind speed data is used to predict long term mean at the site.
Long term data from Paxton between June 24th. 2003 and June 24th, 2010 is used as reference in the case of Worcester. Correlation between the two sites are obtained from concurrent data between January 1st, 2010 and October 15th, 2010. The long term mean at Worcester at 80 m is estimated to be 6.1 m/s with an uncertainty of 1.3% for the MCP process.
The capacity factor of a wind turbine at a given site depends on the hub height, wind speed distribution at the hub height, the wind turbine power curve and any assumptions about down time and losses due to wake effects from upwind wind turbines, etc. If the
January 28, 2011 Wind Energy Center Page 8 University of Massachusetts, Amherst Amherst, MA 01003
hub height wind speed is estimated from data at lower heights, then the capacity factor will also depend on the estimated wind shear and the wind speeds measured at lower heights. No simple estimate of capacity factor at a site could take all of these effects and choices into account. Nevertheless, an estimate of the capacity factor of a wind turbine at this site is provided here to help the reader understand the order of magnitude of the wind resource at this site.
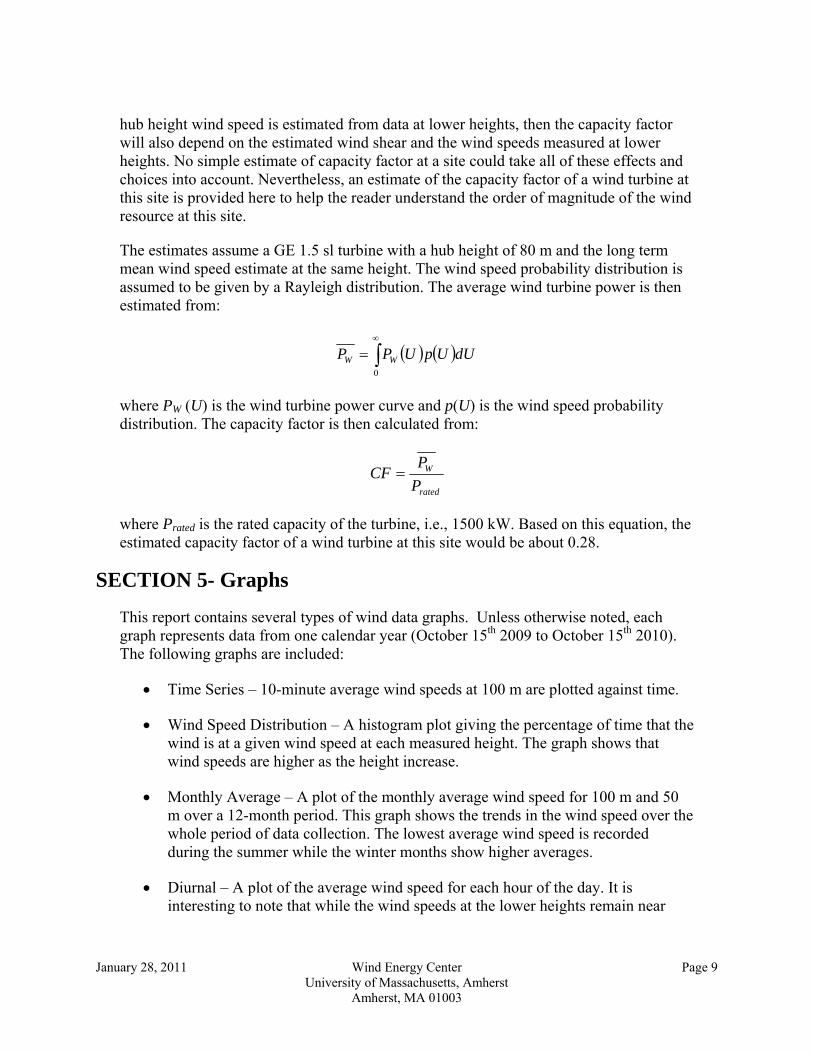
The estimates assume a GE 1.5 sl turbine with a hub height of 80 m and the long term mean wind speed estimate at the same height. The wind speed probability distribution is assumed to be given by a Rayleigh distribution. The average wind turbine power is then estimated from:
( ) ( )∫∞
=0
dUUpUPP WW
where PW (U) is the wind turbine power curve and p(U) is the wind speed probability distribution. The capacity factor is then calculated from:
rated
W
PP
CF =
where Prated is the rated capacity of the turbine, i.e., 1500 kW. Based on this equation, the estimated capacity factor of a wind turbine at this site would be about 0.28.
SECTION 5- Graphs
This report contains several types of wind data graphs. Unless otherwise noted, each graph represents data from one calendar year (October 15th 2009 to October 15th 2010). The following graphs are included:
• Time Series – 10-minute average wind speeds at 100 m are plotted against time.
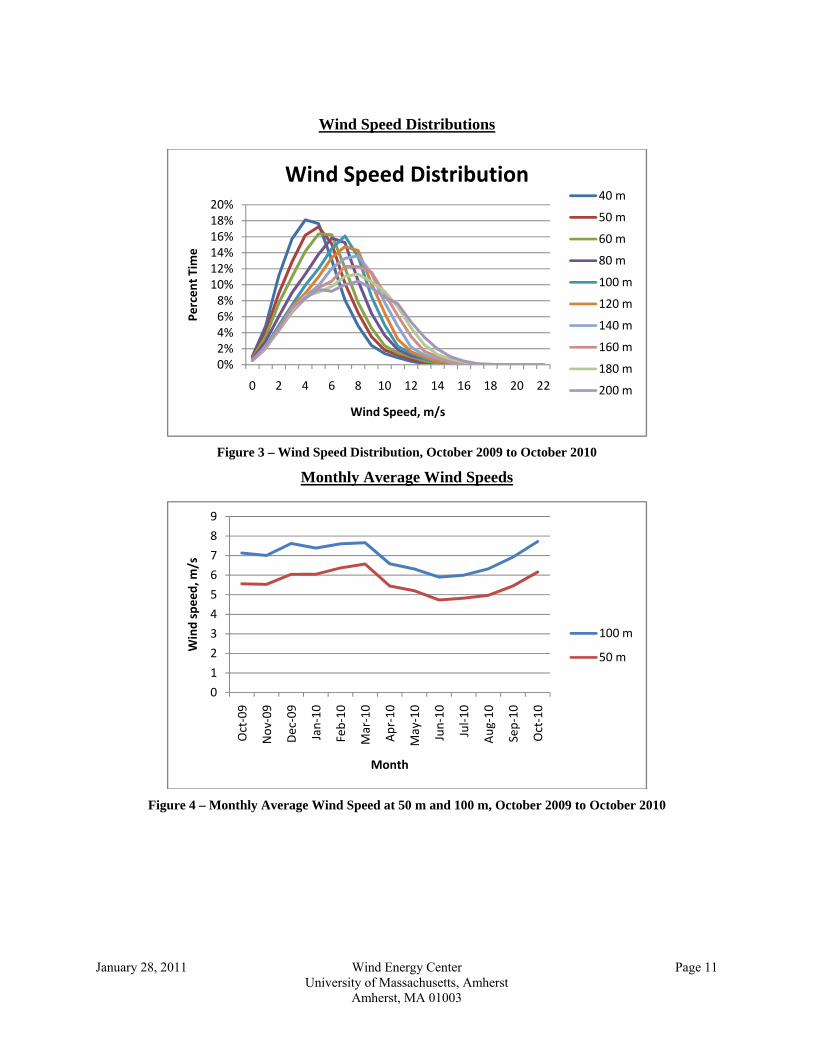
• Wind Speed Distribution – A histogram plot giving the percentage of time that the wind is at a given wind speed at each measured height. The graph shows that wind speeds are higher as the height increase.
• Monthly Average – A plot of the monthly average wind speed for 100 m and 50 m over a 12-month period. This graph shows the trends in the wind speed over the whole period of data collection. The lowest average wind speed is recorded during the summer while the winter months show higher averages.
• Diurnal – A plot of the average wind speed for each hour of the day. It is interesting to note that while the wind speeds at the lower heights remain near
January 28, 2011 Wind Energy Center Page 9 University of Massachusetts, Amherst Amherst, MA 01003

constant throughout the day, wind speeds at the higher heights are significantly higher during the night and drops during the day.
• Turbulence Intensity – A plot of turbulence intensity as a function of wind speed at 100 m. Turbulence Intensity is a measure of the gustiness of a wind resource. Lower turbulence results in lower mechanical loads on a wind turbine.
• Wind Rose – A plot, by compass direction showing the percentage of time that the wind comes from a given direction and the average wind speed in that direction. The graph indicates that at the lower heights the winds are predominantly coming in from the northwest while at the higher heights they are coming in from the southwest and south-southwest. The average wind speeds are highest for the sector between south-southwest and northwest together with the north-northeast and northeast sector. The lowest average wind speed comes in from the east-southeast direction.
Data for the wind speed histograms, monthly and diurnal average plots, and wind roses are included in APPENDIX B.
Wind Speed Time Series
Figure 2 - Wind Speed Time Series at 100 m
15
10
5
0
Win
d S
peed
, m/s
11/1/2009 1/1/2010 3/1/2010 5/1/2010 7/1/2010 9/1/2010Date
January 28, 2011 Wind Energy Center Page 10 University of Massachusetts, Amherst Amherst, MA 01003
Wind Speed Distributions
0%2%4%6%8%
10%12%14%16%18%20%
0 2 4 6 8 10 12 14 16 18 20 22
Percen
t Tim
e
Wind Speed, m/s
Wind Speed Distribution40 m
50 m
60 m
80 m
100 m
120 m
140 m
160 m
180 m
200 m
Figure 3 – Wind Speed Distribution, October 2009 to October 2010
Monthly Average Wind Speeds
0
1
2
3
4
5
6
7
8
9
Oct‐09
Nov
‐09
Dec‐09
Jan‐10
Feb‐10
Mar‐10
Apr‐10
May‐10
Jun‐10
Jul‐1
0
Aug
‐10
Sep‐10
Oct‐10
Wind speed, m
/s
Month
100 m
50 m
Figure 4 – Monthly Average Wind Speed at 50 m and 100 m, October 2009 to October 2010
January 28, 2011 Wind Energy Center Page 11 University of Massachusetts, Amherst Amherst, MA 01003

Diurnal Average Wind Speeds
0
2
4
6
8
10
12
0 2 4 6 8 10 12 14 16 18 20 22
Wind Speed, m
/s
Hour of Day
200 m
180 m
160 m
140 m
120 m
100 m
80 m
60 m
50 m
40 m
Figure 5 – Diurnal Average Wind Speed, October 2009 to October 2010
Turbulence Intensities
Figure 6 – Turbulence Intensity at 100 m, October 2009 to October 2010
1.0
0.8
0.6
0.4
0.2
Turb
ulen
ce In
tens
ity
5 10 15Wind Speed, m/s
January 28, 2011 Wind Energy Center Page 12 University of Massachusetts, Amherst Amherst, MA 01003

Wind Roses
0.00
0.05
0.10
0.15N
NNE
NE
ENE
E
ESE
SE
SSES
SSW
SW
WSW
W
WNW
NW
NNW
Wind Rose ‐ Percentage of Time
200 m
180 m
160 m
140 m
120 m
100 m
80 m
60 m
50 m
40 m
Figure 7 – Wind Rose – Percentage of Time, October 2009 to October 2010
0.002.004.006.008.0010.00
NNNE
NE
ENE
E
ESE
SE
SSES
SSW
SW
WSW
W
WNW
NW
NNW
Wind Rose ‐ Average Wind Speed200 m
180 m
160 m
140 m
120 m
100 m
80 m
60 m
50 m
40 m
Figure 8 – Wind Rose – Average Wind Speed, October 2009 to October 2010
SECTION 6 - Significant Meteorological Events
There were multiple instances of sustained 10-minute wind speed averages above 15 m/s but no reported wind speeds out of the ordinary for the time period included in this report.
January 28, 2011 Wind Energy Center Page 13 University of Massachusetts, Amherst Amherst, MA 01003
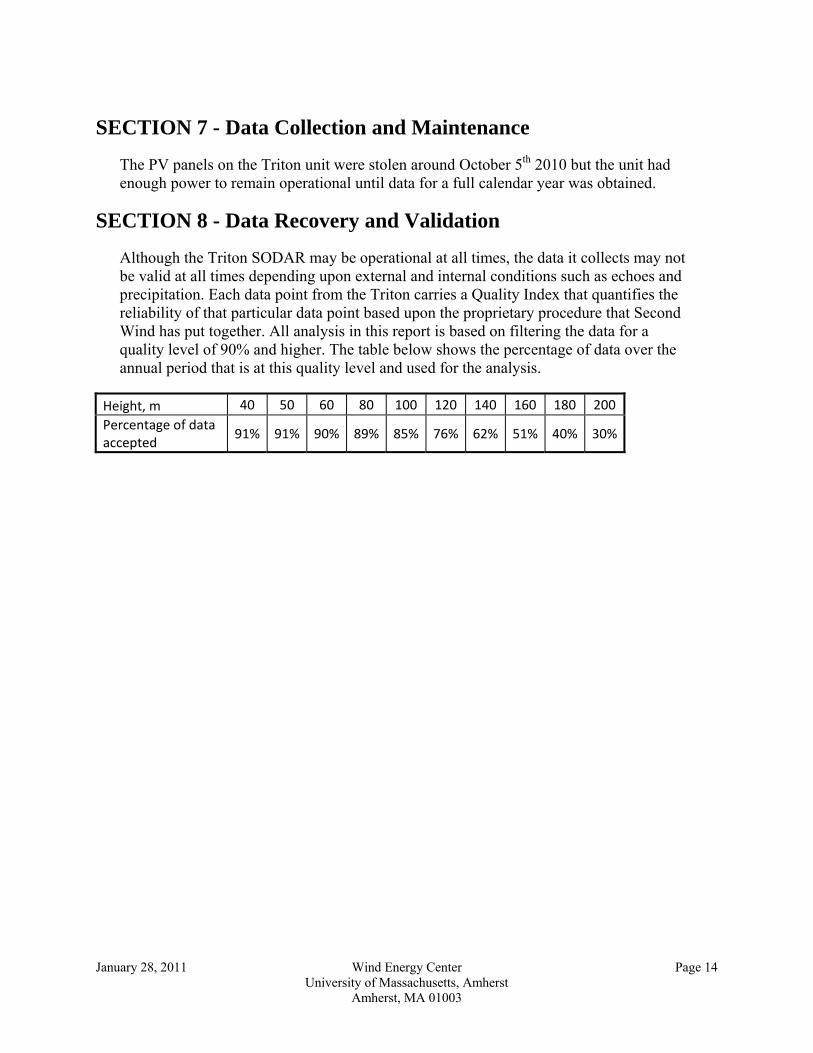
SECTION 7 - Data Collection and Maintenance
The PV panels on the Triton unit were stolen around October 5th 2010 but the unit had enough power to remain operational until data for a full calendar year was obtained.
SECTION 8 - Data Recovery and Validation
Although the Triton SODAR may be operational at all times, the data it collects may not be valid at all times depending upon external and internal conditions such as echoes and precipitation. Each data point from the Triton carries a Quality Index that quantifies the reliability of that particular data point based upon the proprietary procedure that Second Wind has put together. All analysis in this report is based on filtering the data for a quality level of 90% and higher. The table below shows the percentage of data over the annual period that is at this quality level and used for the analysis.
Height, m 40 50 60 80 100 120 140 160 180 200 Percentage of data accepted
91% 91% 90% 89% 85% 76% 62% 51% 40% 30%
January 28, 2011 Wind Energy Center Page 14 University of Massachusetts, Amherst Amherst, MA 01003
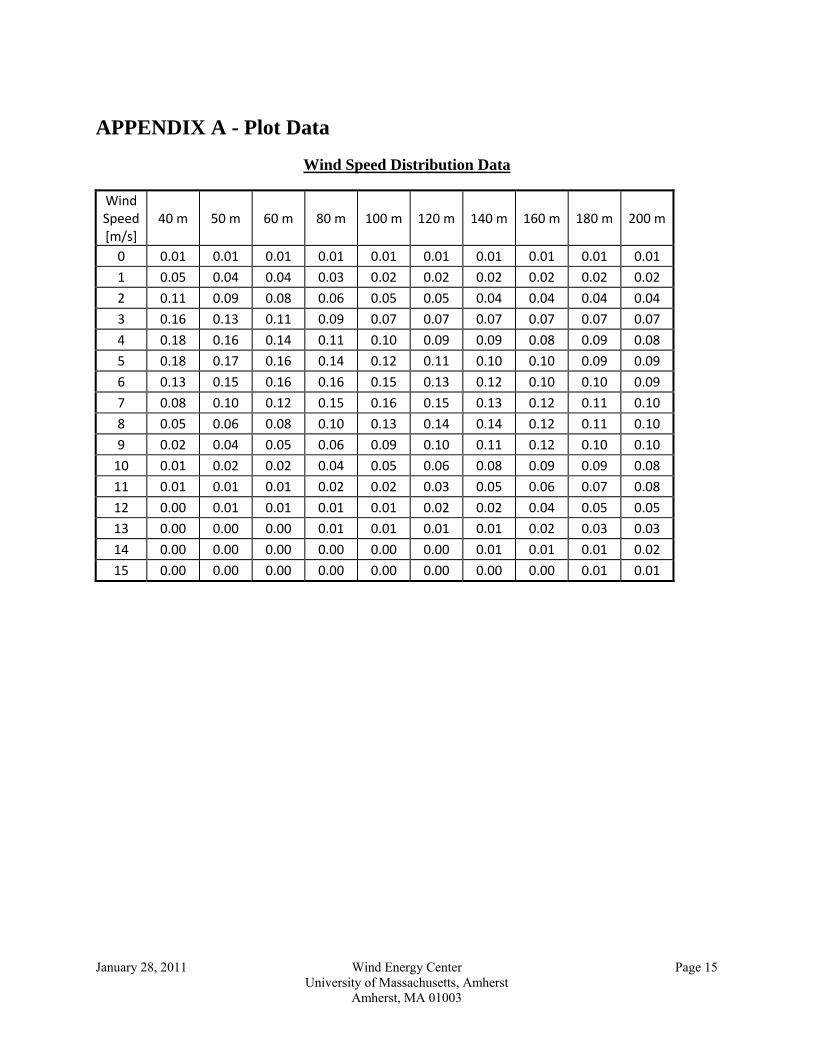
APPENDIX A - Plot Data
Wind Speed Distribution Data
Wind Speed [m/s]
40 m 50 m 60 m 80 m 100 m 120 m 140 m 160 m 180 m 200 m
0 0.01 0.01 0.01 0.01 0.01 0.01 0.01 0.01 0.01 0.01 1 0.05 0.04 0.04 0.03 0.02 0.02 0.02 0.02 0.02 0.02
2 0.11 0.09 0.08 0.06 0.05 0.05 0.04 0.04 0.04 0.04 3 0.16 0.13 0.11 0.09 0.07 0.07 0.07 0.07 0.07 0.07
4 0.18 0.16 0.14 0.11 0.10 0.09 0.09 0.08 0.09 0.08 5 0.18 0.17 0.16 0.14 0.12 0.11 0.10 0.10 0.09 0.09
6 0.13 0.15 0.16 0.16 0.15 0.13 0.12 0.10 0.10 0.09 7 0.08 0.10 0.12 0.15 0.16 0.15 0.13 0.12 0.11 0.10
8 0.05 0.06 0.08 0.10 0.13 0.14 0.14 0.12 0.11 0.10 9 0.02 0.04 0.05 0.06 0.09 0.10 0.11 0.12 0.10 0.10
10 0.01 0.02 0.02 0.04 0.05 0.06 0.08 0.09 0.09 0.08 11 0.01 0.01 0.01 0.02 0.02 0.03 0.05 0.06 0.07 0.08
12 0.00 0.01 0.01 0.01 0.01 0.02 0.02 0.04 0.05 0.05 13 0.00 0.00 0.00 0.01 0.01 0.01 0.01 0.02 0.03 0.03
14 0.00 0.00 0.00 0.00 0.00 0.00 0.01 0.01 0.01 0.02 15 0.00 0.00 0.00 0.00 0.00 0.00 0.00 0.00 0.01 0.01
January 28, 2011 Wind Energy Center Page 15 University of Massachusetts, Amherst Amherst, MA 01003
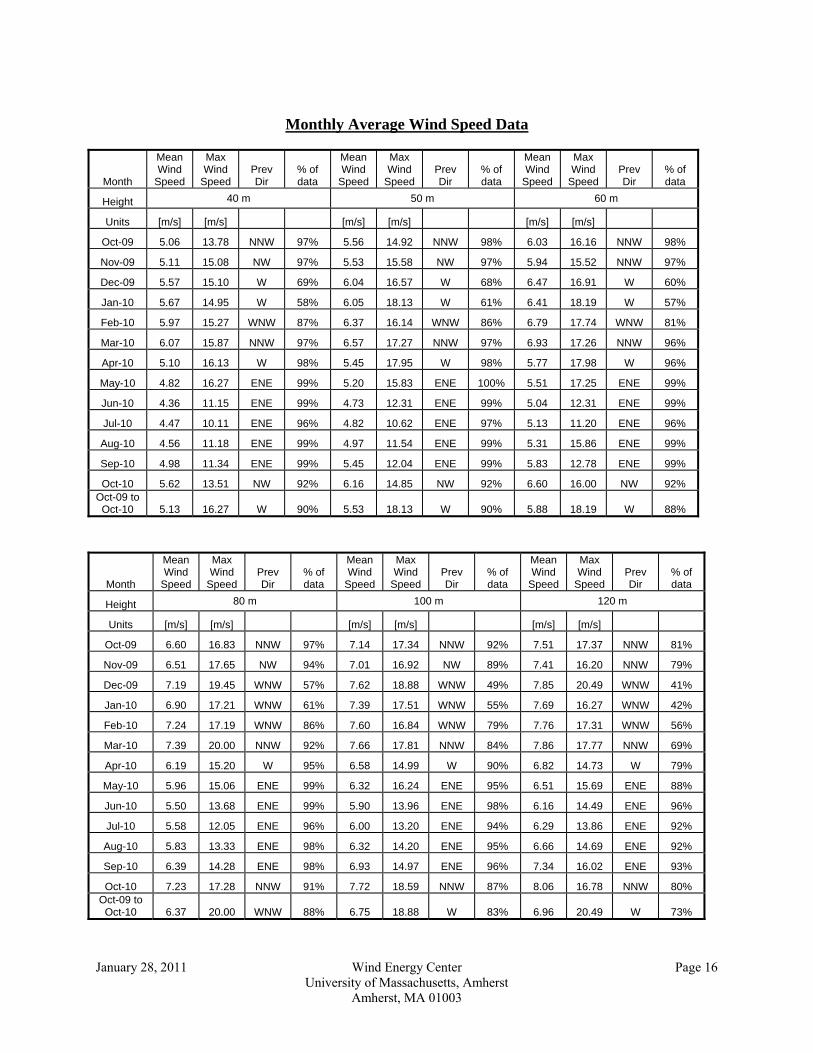
Monthly Average Wind Speed Data
Month
Mean Wind
Speed
Max Wind
Speed Prev Dir
% of data
Mean Wind
Speed
Max Wind
Speed Prev Dir
% of data
Mean Wind
Speed
Max Wind
Speed Prev Dir
% of data
Height 40 m 50 m 60 m
Units [m/s] [m/s] [m/s] [m/s] [m/s] [m/s]
Oct-09 5.06 13.78 NNW 97% 5.56 14.92 NNW 98% 6.03 16.16 NNW 98%
Nov-09 5.11 15.08 NW 97% 5.53 15.58 NW 97% 5.94 15.52 NNW 97%
Dec-09 5.57 15.10 W 69% 6.04 16.57 W 68% 6.47 16.91 W 60%
Jan-10 5.67 14.95 W 58% 6.05 18.13 W 61% 6.41 18.19 W 57%
Feb-10 5.97 15.27 WNW 87% 6.37 16.14 WNW 86% 6.79 17.74 WNW 81%
Mar-10 6.07 15.87 NNW 97% 6.57 17.27 NNW 97% 6.93 17.26 NNW 96%
Apr-10 5.10 16.13 W 98% 5.45 17.95 W 98% 5.77 17.98 W 96%
May-10 4.82 16.27 ENE 99% 5.20 15.83 ENE 100% 5.51 17.25 ENE 99%
Jun-10 4.36 11.15 ENE 99% 4.73 12.31 ENE 99% 5.04 12.31 ENE 99%
Jul-10 4.47 10.11 ENE 96% 4.82 10.62 ENE 97% 5.13 11.20 ENE 96%
Aug-10 4.56 11.18 ENE 99% 4.97 11.54 ENE 99% 5.31 15.86 ENE 99%
Sep-10 4.98 11.34 ENE 99% 5.45 12.04 ENE 99% 5.83 12.78 ENE 99%
Oct-10 5.62 13.51 NW 92% 6.16 14.85 NW 92% 6.60 16.00 NW 92% Oct-09 to Oct-10 5.13 16.27 W 90% 5.53 18.13 W 90% 5.88 18.19 W 88%
Month
Mean Wind
Speed
Max Wind
Speed Prev Dir
% of data
Mean Wind
Speed
Max Wind
Speed Prev Dir
% of data
Mean Wind
Speed
Max Wind
Speed Prev Dir
% of data
Height 80 m 100 m 120 m
Units [m/s] [m/s] [m/s] [m/s] [m/s] [m/s]
Oct-09 6.60 16.83 NNW 97% 7.14 17.34 NNW 92% 7.51 17.37 NNW 81%
Nov-09 6.51 17.65 NW 94% 7.01 16.92 NW 89% 7.41 16.20 NNW 79%
Dec-09 7.19 19.45 WNW 57% 7.62 18.88 WNW 49% 7.85 20.49 WNW 41%
Jan-10 6.90 17.21 WNW 61% 7.39 17.51 WNW 55% 7.69 16.27 WNW 42%
Feb-10 7.24 17.19 WNW 86% 7.60 16.84 WNW 79% 7.76 17.31 WNW 56%
Mar-10 7.39 20.00 NNW 92% 7.66 17.81 NNW 84% 7.86 17.77 NNW 69%
Apr-10 6.19 15.20 W 95% 6.58 14.99 W 90% 6.82 14.73 W 79%
May-10 5.96 15.06 ENE 99% 6.32 16.24 ENE 95% 6.51 15.69 ENE 88%
Jun-10 5.50 13.68 ENE 99% 5.90 13.96 ENE 98% 6.16 14.49 ENE 96%
Jul-10 5.58 12.05 ENE 96% 6.00 13.20 ENE 94% 6.29 13.86 ENE 92%
Aug-10 5.83 13.33 ENE 98% 6.32 14.20 ENE 95% 6.66 14.69 ENE 92%
Sep-10 6.39 14.28 ENE 98% 6.93 14.97 ENE 96% 7.34 16.02 ENE 93%
Oct-10 7.23 17.28 NNW 91% 7.72 18.59 NNW 87% 8.06 16.78 NNW 80% Oct-09 to Oct-10 6.37 20.00 WNW 88% 6.75 18.88 W 83% 6.96 20.49 W 73%
January 28, 2011 Wind Energy Center Page 16 University of Massachusetts, Amherst Amherst, MA 01003

Month
Mean Wind
Speed
Max Wind
Speed Prev Dir
% of data
Mean Wind
Speed
Max Wind
Speed Prev Dir
% of data
Mean Wind
Speed
Max Wind
Speed Prev Dir
% of data
Height 140 m 160 m 180 m
Units [m/s] [m/s] [m/s] [m/s] [m/s] [m/s]
Oct-09 8.03 17.06 NNW 64% 8.63 16.87 NNW 49% 9.28 16.60 NNW 34%
Nov-09 7.91 16.79 NNW 64% 8.50 16.06 NNW 49% 9.14 16.24 N 35%
Dec-09 8.29 20.20 WNW 31% 8.74 20.27 WNW 23% 9.22 18.98 NNW 15%
Jan-10 8.29 15.57 WNW 24% 9.10 18.08 WNW 15% 9.62 16.57 WNW 9%
Feb-10 8.00 16.37 NNW 28% 8.10 15.15 NNE 12% 8.05 16.74 ENE 6%
Mar-10 8.16 18.37 N 46% 8.39 17.66 NNE 29% 8.34 18.85 NNE 15%
Apr-10 7.07 16.59 E 61% 7.31 15.29 E 44% 7.35 15.51 ENE 30%
May-10 6.75 15.78 ENE 76% 7.03 17.37 ENE 65% 7.27 18.24 ENE 57%
Jun-10 6.45 16.48 ENE 91% 6.72 17.02 ENE 81% 6.96 18.63 ENE 69%
Jul-10 6.56 14.74 ENE 88% 6.77 15.95 ENE 82% 6.87 16.29 ENE 74%
Aug-10 6.95 14.73 ENE 86% 7.14 15.80 ENE 78% 7.20 15.92 ENE 69%
Sep-10 7.74 16.63 ENE 85% 8.04 16.64 ENE 72% 8.40 17.56 NE 57%
Oct-10 8.39 17.71 NNW 70% 8.80 16.56 NNW 58% 9.16 15.63 NNW 41% Oct-09 to Oct-10 7.19 20.20 W 59% 7.41 20.27 E 47% 7.55 18.98 ENE 37%
Month
Mean Wind
Speed Max Wind
Speed Prev Dir % of data
Height 200 m
Units [m/s] [m/s]
Oct-09 10.25 16.97 E 22%
Nov-09 10.02 17.61 N 23%
Dec-09 9.80 18.44 NNW 10%
Jan-10 10.08 17.42 NW 6%
Feb-10 7.90 14.42 ENE 3%
Mar-10 7.51 17.54 ENE 8%
Apr-10 7.39 16.19 NE 20%
May-10 7.48 19.09 ENE 47%
Jun-10 7.22 19.23 ENE 55%
Jul-10 6.98 15.99 ENE 62%
Aug-10 7.13 15.55 ENE 56%
Sep-10 8.77 18.45 NE 42%
Oct-10 9.50 16.08 N 26% Oct-09 to Oct-10 7.69 19.23 ENE 28%
January 28, 2011 Wind Energy Center Page 17 University of Massachusetts, Amherst Amherst, MA 01003

Diurnal Average Wind Speed Data
Hour 40 m 50 m 60 m 80 m 100 m 120 m 140 m 160 m 180 m 200 m
0 4.97 5.48 5.91 6.63 7.31 7.77 8.32 8.97 9.30 9.71 1 4.96 5.42 5.89 6.61 7.30 7.81 8.32 8.92 9.23 9.67
2 4.98 5.47 5.87 6.62 7.33 7.87 8.46 9.03 9.46 9.97 3 4.96 5.45 5.91 6.67 7.33 7.82 8.43 8.89 9.40 9.85
4 4.98 5.46 5.94 6.70 7.35 7.92 8.48 9.03 9.50 10.20 5 5.00 5.48 5.94 6.69 7.36 7.83 8.38 8.92 9.40 9.77
6 4.88 5.35 5.78 6.42 6.98 7.46 7.98 8.42 8.77 9.15 7 4.84 5.27 5.59 6.07 6.42 6.71 7.00 7.29 7.56 7.77
8 4.85 5.21 5.46 5.84 6.03 6.08 6.15 6.25 6.30 6.42 9 4.90 5.23 5.48 5.70 5.86 5.83 5.74 5.74 5.69 5.59
10 5.07 5.37 5.60 5.85 5.93 5.81 5.67 5.63 5.55 5.42 11 5.30 5.65 5.88 6.11 6.13 6.03 5.89 5.80 5.60 5.36
12 5.37 5.70 5.92 6.16 6.28 6.20 6.13 6.00 5.93 5.77 13 5.53 5.86 6.12 6.36 6.46 6.37 6.28 6.20 6.10 6.04
14 5.65 6.02 6.30 6.56 6.66 6.60 6.54 6.50 6.42 6.31 15 5.58 5.94 6.25 6.53 6.73 6.74 6.78 6.71 6.62 6.58
16 5.48 5.88 6.18 6.53 6.76 6.85 6.89 6.80 6.80 6.89 17 5.25 5.65 5.99 6.43 6.79 6.91 7.04 7.21 7.45 7.49
18 5.12 5.59 5.94 6.46 6.90 7.21 7.49 7.79 7.99 8.31 19 5.13 5.56 5.94 6.56 7.13 7.49 7.85 8.10 8.44 8.67
20 5.06 5.49 5.90 6.54 7.14 7.59 7.98 8.35 8.76 9.08 21 5.05 5.52 5.93 6.60 7.22 7.71 8.19 8.71 9.14 9.43
22 5.01 5.46 5.87 6.57 7.21 7.65 8.22 8.77 9.14 9.57 23 4.99 5.48 5.93 6.60 7.29 7.77 8.32 8.90 9.28 9.62
January 28, 2011 Wind Energy Center Page 18 University of Massachusetts, Amherst Amherst, MA 01003
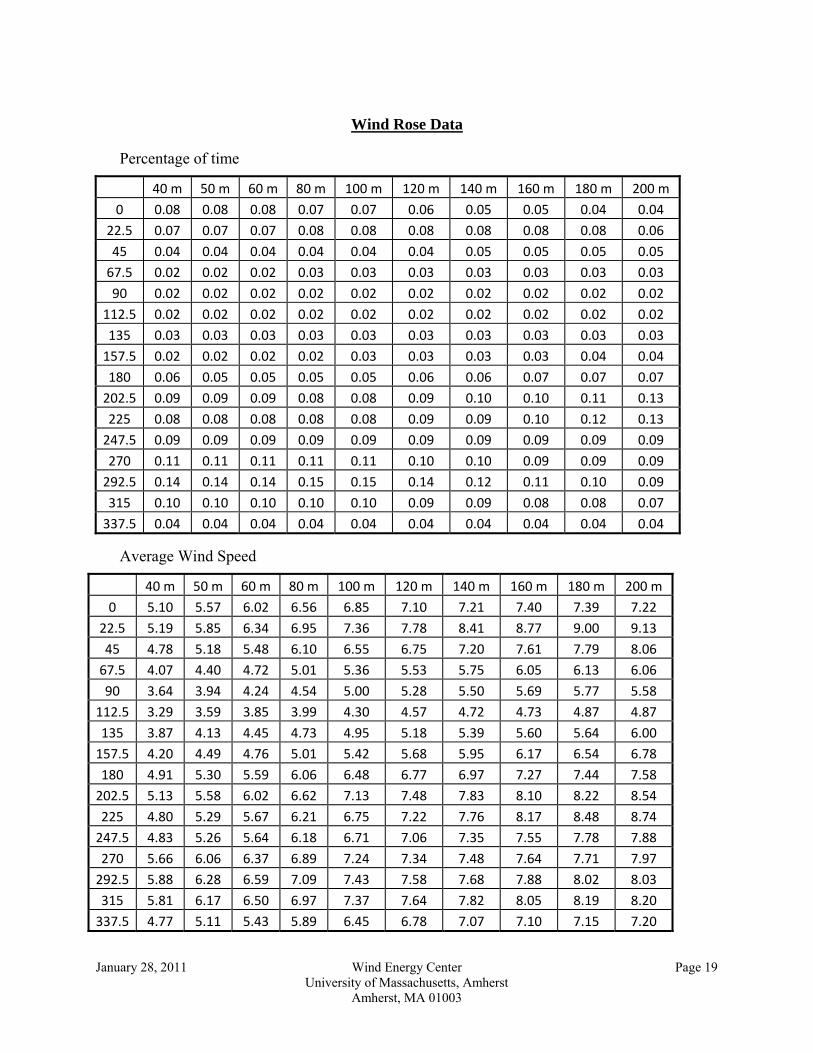
Wind Rose Data
Percentage of time
40 m 50 m 60 m 80 m 100 m 120 m 140 m 160 m 180 m 200 m
0 0.08 0.08 0.08 0.07 0.07 0.06 0.05 0.05 0.04 0.04 22.5 0.07 0.07 0.07 0.08 0.08 0.08 0.08 0.08 0.08 0.06
45 0.04 0.04 0.04 0.04 0.04 0.04 0.05 0.05 0.05 0.05 67.5 0.02 0.02 0.02 0.03 0.03 0.03 0.03 0.03 0.03 0.03
90 0.02 0.02 0.02 0.02 0.02 0.02 0.02 0.02 0.02 0.02 112.5 0.02 0.02 0.02 0.02 0.02 0.02 0.02 0.02 0.02 0.02
135 0.03 0.03 0.03 0.03 0.03 0.03 0.03 0.03 0.03 0.03 157.5 0.02 0.02 0.02 0.02 0.03 0.03 0.03 0.03 0.04 0.04
180 0.06 0.05 0.05 0.05 0.05 0.06 0.06 0.07 0.07 0.07 202.5 0.09 0.09 0.09 0.08 0.08 0.09 0.10 0.10 0.11 0.13
225 0.08 0.08 0.08 0.08 0.08 0.09 0.09 0.10 0.12 0.13 247.5 0.09 0.09 0.09 0.09 0.09 0.09 0.09 0.09 0.09 0.09
270 0.11 0.11 0.11 0.11 0.11 0.10 0.10 0.09 0.09 0.09 292.5 0.14 0.14 0.14 0.15 0.15 0.14 0.12 0.11 0.10 0.09
315 0.10 0.10 0.10 0.10 0.10 0.09 0.09 0.08 0.08 0.07 337.5 0.04 0.04 0.04 0.04 0.04 0.04 0.04 0.04 0.04 0.04
Average Wind Speed
40 m 50 m 60 m 80 m 100 m 120 m 140 m 160 m 180 m 200 m
0 5.10 5.57 6.02 6.56 6.85 7.10 7.21 7.40 7.39 7.22 22.5 5.19 5.85 6.34 6.95 7.36 7.78 8.41 8.77 9.00 9.13
45 4.78 5.18 5.48 6.10 6.55 6.75 7.20 7.61 7.79 8.06 67.5 4.07 4.40 4.72 5.01 5.36 5.53 5.75 6.05 6.13 6.06
90 3.64 3.94 4.24 4.54 5.00 5.28 5.50 5.69 5.77 5.58 112.5 3.29 3.59 3.85 3.99 4.30 4.57 4.72 4.73 4.87 4.87
135 3.87 4.13 4.45 4.73 4.95 5.18 5.39 5.60 5.64 6.00 157.5 4.20 4.49 4.76 5.01 5.42 5.68 5.95 6.17 6.54 6.78
180 4.91 5.30 5.59 6.06 6.48 6.77 6.97 7.27 7.44 7.58 202.5 5.13 5.58 6.02 6.62 7.13 7.48 7.83 8.10 8.22 8.54
225 4.80 5.29 5.67 6.21 6.75 7.22 7.76 8.17 8.48 8.74 247.5 4.83 5.26 5.64 6.18 6.71 7.06 7.35 7.55 7.78 7.88
270 5.66 6.06 6.37 6.89 7.24 7.34 7.48 7.64 7.71 7.97 292.5 5.88 6.28 6.59 7.09 7.43 7.58 7.68 7.88 8.02 8.03
315 5.81 6.17 6.50 6.97 7.37 7.64 7.82 8.05 8.19 8.20 337.5 4.77 5.11 5.43 5.89 6.45 6.78 7.07 7.10 7.15 7.20
January 28, 2011 Wind Energy Center Page 19 University of Massachusetts, Amherst Amherst, MA 01003

January 28, 2011 Wind Energy Center Page 20 University of Massachusetts, Amherst Amherst, MA 01003