WILSONS LEATHER -...
92
WILSONS LEATHER Annual Report 2006
-
Upload
truongkiet -
Category
Documents
-
view
214 -
download
0
Transcript of WILSONS LEATHER -...

WILSONS LEATHERAnnual Report 2006

shareholder letter
annual report on form 10-K
Visit the Company’s e-commerce site at www.wilsonsleather.com
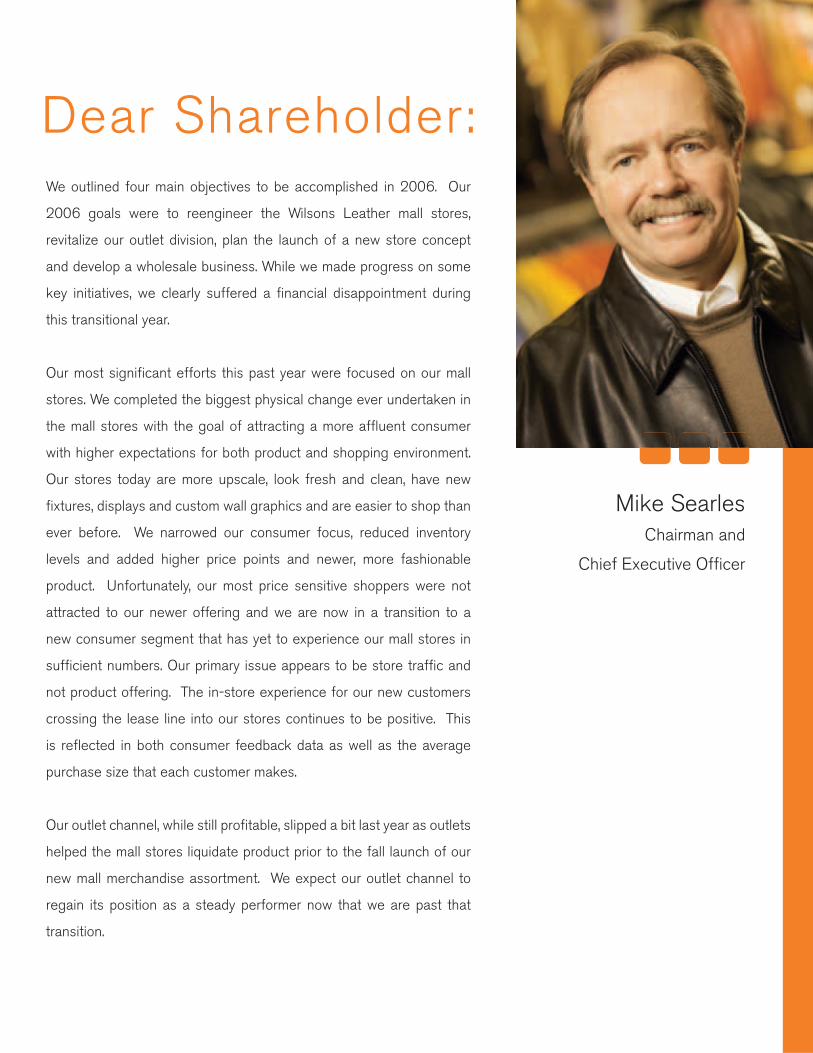
Mike SearlesChairman and
Chief Executive Offi cer
We outlined four main objectives to be accomplished in 2006. Our
2006 goals were to reengineer the Wilsons Leather mall stores,
revitalize our outlet division, plan the launch of a new store concept
and develop a wholesale business. While we made progress on some
key initiatives, we clearly suffered a fi nancial disappointment during
this transitional year.
Our most signifi cant efforts this past year were focused on our mall
stores. We completed the biggest physical change ever undertaken in
the mall stores with the goal of attracting a more affl uent consumer
with higher expectations for both product and shopping environment.
Our stores today are more upscale, look fresh and clean, have new
fi xtures, displays and custom wall graphics and are easier to shop than
ever before. We narrowed our consumer focus, reduced inventory
levels and added higher price points and newer, more fashionable
product. Unfortunately, our most price sensitive shoppers were not
attracted to our newer offering and we are now in a transition to a
new consumer segment that has yet to experience our mall stores in
suffi cient numbers. Our primary issue appears to be store traffi c and
not product offering. The in-store experience for our new customers
crossing the lease line into our stores continues to be positive. This
is refl ected in both consumer feedback data as well as the average
purchase size that each customer makes.
Our outlet channel, while still profi table, slipped a bit last year as outlets
helped the mall stores liquidate product prior to the fall launch of our
new mall merchandise assortment. We expect our outlet channel to
regain its position as a steady performer now that we are past that
transition.
Dear Shareholder:

Also, in 2006 we talked about plans to open a freestanding accessory store concept. We
did not pursue these plans in 2006 due to the signifi cant effort involved in transforming
our mall stores and do not anticipate doing so in the near future.
Finally, we launched our wholesale business in 2006 and established relationships with
some of the biggest names in retail as our fi rst wholesale customers. With our vertical
sourcing capabilities and our knowledge of the leather market, we believe our wholesale
business has the potential to become a meaningful contributor of sales and profi ts in
the future.
We believe we are headed in the right direction. We are committed to our strategic
direction of appealing to a more affl uent and contemporary customer. However, we
need to make some changes to deliver the results that we all expect. Our primary goal
in 2007 is to increase customer traffi c. This will entail a two-pronged approach.
First, we will introduce a number of designer brands that we have not carried before.
Second, we will be testing various marketing concepts that will target the specifi c
demographic that our new product offering is geared towards. We believe the
combination of these two initiatives will drive consumers into our stores who have not
yet experienced “the new Wilsons Leather.”
Today’s consumer wants 24/7 access to brands that they favor. They are smarter and
have more access to information than ever before. They don’t want to be told what to
buy, they want choices. In this environment, our single Wilsons Leather brand model
is limiting. Therefore, in 2007 we are going to diversify our assortment to offer the
consumer recognizable branded leather apparel. By adding branded apparel we will
offer the consumer the brands they trust, a broader assortment and better value through
our Wilsons Leather brand. We believe this change will dramatically reposition our
stores for consumers - making Wilsons Leather the one place to shop for all their
leather outerwear and accessory needs.

In addition to our branded apparel model and focused marketing efforts, in 2007 we will
continue to drive greater penetration of our accessories business. Our goal for 2006
was to drive 40% of our sales from accessories and we came in at 41%. Our goal in
2007 is to generate 50% of our sales from our accessory business.
What is important now is to generate increased traffi c in our stores, and in so doing,
build momentum back to the achievement of positive comparable store sales. Once
consumers are in our store, we believe we can win. We win because of the superior
experience we provide our customers in our stores. This includes our associates’ leather
intelligence, product intelligence and, as this year progresses, their understanding of
the essence of the brands we offer. This separates us from the other places where our
customers could shop. We are the leather experts.
2006 was a diffi cult year for shareholders and associates, but one that we have survived
and one we can build from. Change is a diffi cult but necessary part of reinvention if
Wilsons Leather is to remain a relevant concept and brand for another one hundred
years.
Wilsons Leather has come a long way in a very short time. We are not changing direction
in 2007 but will be improving our course to deliver on the Brand Mission we established
for our chain during 2006:
At Wilsons Leather, we celebrate the beauty and quality of leather. Our branded
apparel and accessories highlight the essence of leather - its feel, its value
its fashion. Our stores invite each customer to see and touch every product,
connecting to their own sense of personal style. Our in-store brand
representatives promote our legacy and core competence, as they teach
Leather Intelligence to the men and women shopping in our stores.
That mission is unchanged today. We are becoming a better store that will better deliver
on that mission for our customers. We have much to do in 2007. As a team, we will get
it done with commitment and enthusiasm.
I want to thank all our associates, shareholders and members of our Board of Directors
for their support during this diffi cult year of transition. I look forward to improving our
results in the future.
Sincererly,
Mike SearlesChairman andChief Executive Offi cer

annual report on form 10-K

SECURITIES AND EXCHANGE COMMISSIONWASHINGTON, D.C. 20549
FORM 10-K(Mark one)
¥ ANNUAL REPORT PURSUANT TO SECTION 13 OR 15(d) OF THE SECURITIES EXCHANGEACT OF 1934
For the fiscal year ended February 3, 2007
ORn TRANSITION REPORT PURSUANT TO SECTION 13 OR 15(d) OF THE SECURITIES EXCHANGE
ACT OF 1934For the transition period from to
Commission file number 000-21543
Wilsons The Leather Experts Inc.(Exact name of registrant as specified in its charter)
Minnesota 41-1839933(State or other jurisdiction ofincorporation or organization)
(I.R.S. EmployerIdentification No.)
7401 Boone Ave. N., Brooklyn Park, MN 55428(Address of principal executive offices) (Zip Code)
Registrant’s telephone number, including area code: (763) 391-4000Securities registered pursuant to Section 12(b) of the Act:
Common stock, $.01 par value Nasdaq Global Market(Title of Class) (Name of Exchange on Which Registered)
Securities registered pursuant to Section 12(g) of the Act: None
Indicate by check mark if the registrant is a well-known seasoned issuer, as defined in Rule 405 of the SecuritiesAct. Yes n No ¥
Indicate by check mark if the registrant is not required to file reports pursuant to Section 13 or Section 15(d) of theAct. Yes n No ¥
Indicate by check mark whether the registrant (1) has filed all reports required to be filed by Section 13 or 15(d) of theSecurities Exchange Act of 1934 during the preceding 12 months (or for such shorter period that the registrant was required tofile such reports), and (2) has been subject to such filing requirements for the past 90 days. Yes ¥ No n
Indicate by check mark if the disclosure of delinquent filers pursuant to Item 405 of Regulation S-K is not contained herein,and will not be contained, to the best of the registrant’s knowledge, in definitive proxy or information statements incorporated byreference in Part III of this Form 10-K or any amendment to this Form 10-K. n
Indicate by check mark whether registrant is a large accelerated filer, an accelerated filer, or a non-accelerated filer (asdefined in Rule 12b-2 of the Exchange Act).
Large accelerated filer n Accelerated filer ¥ Non-accelerated filer n
Indicate by check mark whether the registrant is a shell company (as defined in Rule 12b-2 of the ExchangeAct). Yes n No ¥
The aggregate market value of the common equity held by non-affiliates of the registrant was $69,913,423 based on theclosing sale price for the common stock on the last business day of the registrant’s most recently completed second fiscal quarteras reported by the Nasdaq Global MarketSM. For purposes of determining such aggregate market value, all executive officers anddirectors of the registrant are considered to be affiliates of the registrant. This number is provided only for the purpose of thisAnnual Report on Form 10-K and does not represent an admission by either the registrant or any such person as to the status ofsuch person.
The number of shares outstanding of the registrant’s common stock, $.01 par value, was 39,204,299 at March 23, 2007.
DOCUMENTS INCORPORATED BY REFERENCE
Portions of the definitive Proxy Statement of Wilsons The Leather Experts Inc. for the 2007 Annual Meeting ofShareholders (the “Proxy Statement”), which will be filed within 120 days after the registrant’s fiscal year ended February 3,2007, are incorporated by reference into Part III of this Annual Report on Form 10-K (“Form 10-K”). The Audit CommitteeReport is expressly not incorporated by reference in this Form 10-K.

®This Page Intentionally Left Blank©

WILSONS THE LEATHER EXPERTS INC.
FORM 10-K
For the fiscal year ended February 3, 2007
TABLE OF CONTENTSDESCRIPTION PAGE
PART IItem 1. Business . . . . . . . . . . . . . . . . . . . . . . . . . . . . . . . . . . . . . . . . . . . . . . . . . . . . . . . . . . . . 1Item 1A. Risk Factors . . . . . . . . . . . . . . . . . . . . . . . . . . . . . . . . . . . . . . . . . . . . . . . . . . . . . . . . . 11Item 1B. Unresolved Staff Comments . . . . . . . . . . . . . . . . . . . . . . . . . . . . . . . . . . . . . . . . . . . . . 18Item 2. Properties . . . . . . . . . . . . . . . . . . . . . . . . . . . . . . . . . . . . . . . . . . . . . . . . . . . . . . . . . . . 18Item 3. Legal Proceedings . . . . . . . . . . . . . . . . . . . . . . . . . . . . . . . . . . . . . . . . . . . . . . . . . . . . . 18Item 4. Submission of Matters to a Vote of Security Holders . . . . . . . . . . . . . . . . . . . . . . . . . . . 18Item 4A. Executive Officers of the Registrant . . . . . . . . . . . . . . . . . . . . . . . . . . . . . . . . . . . . . . . . 18
PART IIItem 5. Market for Registrant’s Common Equity, Related Stockholder Matters and Issuer
Purchases of Equity Securities . . . . . . . . . . . . . . . . . . . . . . . . . . . . . . . . . . . . . . . . . . . . 20Item 6. Selected Financial Data . . . . . . . . . . . . . . . . . . . . . . . . . . . . . . . . . . . . . . . . . . . . . . . . . 22Item 7. Management’s Discussion and Analysis of Financial Condition and Results of
Operations . . . . . . . . . . . . . . . . . . . . . . . . . . . . . . . . . . . . . . . . . . . . . . . . . . . . . . . . . . 23Item 7A. Quantitative and Qualitative Disclosure About Market Risk . . . . . . . . . . . . . . . . . . . . . . 40Item 8. Financial Statements and Supplementary Data . . . . . . . . . . . . . . . . . . . . . . . . . . . . . . . . 40Item 9. Changes in and Disagreements with Accountants on Accounting and Financial
Disclosure . . . . . . . . . . . . . . . . . . . . . . . . . . . . . . . . . . . . . . . . . . . . . . . . . . . . . . . . . . 40Item 9A. Controls and Procedures . . . . . . . . . . . . . . . . . . . . . . . . . . . . . . . . . . . . . . . . . . . . . . . . 40Item 9B. Other Information . . . . . . . . . . . . . . . . . . . . . . . . . . . . . . . . . . . . . . . . . . . . . . . . . . . . . 43
PART IIIItem 10. Directors, Executive Officers and Corporate Governance . . . . . . . . . . . . . . . . . . . . . . . . 43Item 11. Executive Compensation . . . . . . . . . . . . . . . . . . . . . . . . . . . . . . . . . . . . . . . . . . . . . . . . 43Item 12. Security Ownership of Certain Beneficial Owners and Management and Related
Stockholder Matters . . . . . . . . . . . . . . . . . . . . . . . . . . . . . . . . . . . . . . . . . . . . . . . . . . . 43Item 13. Certain Relationships and Related Transactions, and Director Independence . . . . . . . . . . 43Item 14. Principal Accountant Fees and Services . . . . . . . . . . . . . . . . . . . . . . . . . . . . . . . . . . . . . 44
PART IVItem 15. Exhibits and Financial Statement Schedules . . . . . . . . . . . . . . . . . . . . . . . . . . . . . . . . . . 44
Signatures . . . . . . . . . . . . . . . . . . . . . . . . . . . . . . . . . . . . . . . . . . . . . . . . . . . . . . . . . . . . . . . . . . . . . . 45
®This Page Intentionally Left Blank©

PART I
When we refer to “we,” “our,” “us,” or “Wilsons Leather,” we mean Wilsons The Leather Experts Inc. and itssubsidiaries, including its predecessor companies. Unless otherwise indicated, references to our fiscal year meanthe year ended on the Saturday closest to January 31. The periods that will end or have ended on February 2, 2008,February 3, 2007, January 28, 2006, January 29, 2005, January 31, 2004, and February 1, 2003, are referred toherein as 2007, 2006, 2005, 2004, 2003, and 2002, respectively. The results of operations for fiscal year 2006consisted of 53 weeks. All other fiscal years referenced consist of 52 weeks.
Item 1. Business
Disclosure Regarding Forward-Looking Statements
The information presented in this Form 10-K under the headings Item 1. “Business” and Item 7. “Manage-ment’s Discussion and Analysis of Financial Condition and Results of Operations” contains certain forward-looking statements within the meaning of Section 21E of the Securities Exchange Act of 1934, as amended (the“Exchange Act”). Such forward-looking statements are based on the beliefs of our management as well as onassumptions made by and information currently available to us at the time such statements were made and relate to,among other things, future comparable store sales results, business strategies, changes to merchandise mix, futuresales results, expected demand for our products, financing requirements, capital expenditures, store operations,store openings and closings, and competition. Although we believe these statements are reasonable, readers of thisForm 10-K should be aware that actual results could differ materially from those projected by such forward-lookingstatements as a result of a number of factors, many of which are outside of our control, including those set forthunder Item 1A. “Risk Factors,” beginning on page 11 of this Form 10-K. Readers of this Form 10-K should considercarefully the factors listed under Item 1A. “Risk Factors,” as well as the other information and data contained in thisForm 10-K. All forward-looking statements attributable to us or persons acting on our behalf are expressly qualifiedin their entirety by the cautionary statements set forth under Item 1A. “Risk Factors” in this section. The words“anticipate,” “believe,” “estimate,” “expect,” “intend,” “plan,” “target,” “may,” “will,” “project,” “should,” “con-tinue,” and similar expressions or the negative thereof, as they relate to us, are intended to identify such forward-looking statements. We undertake no obligation to publicly update or revise any forward-looking statements,whether as a result of new information, future events or otherwise.
Overview
We are the leading specialty retailer of quality leather outerwear, accessories and apparel in the United States.Our multi-channel store locations are designed to target a broad customer base with a superior level of customerservice. Through our international leather sourcing network and in-house design capabilities, we are able toconsistently provide our customers with quality, fashionable merchandise at attractive prices. Our business structureresults in shorter lead times, allowing us to react quickly to popular and emerging fashion trends and customerpreferences, rapidly replenish fast-selling merchandise and minimize fashion risk.
As of February 3, 2007, we operated a total of 417 stores located in 45 states, including 287 mall stores,116 outlet stores and 14 airport locations. We have historically supplemented our permanent stores with temporaryseasonal stores during our peak selling season. However, operation of our temporary seasonal stores was suspendedin 2006. In 2005 and 2004, we operated 118 and 102 temporary seasonal stores, respectively. We do not intend tooperate any temporary seasonal stores in the foreseeable future, but may reconsider in the future. Our mall storesaverage approximately 2,550 total leased square feet and feature a large assortment of classic and contemporaryleather outerwear, accessories and apparel. Our outlet stores operate primarily under the Wilsons Leather OutletSM
name, average approximately 3,950 total leased square feet and offer a combination of clearance merchandise fromour mall stores, special outlet-only merchandise and key in-season goods. Our airport stores average approximately650 total leased square feet, feature travel-related products as well as leather accessories and provide us theopportunity to showcase our products and the Wilsons Leather brand to millions of potential customers each year insome of the busiest airports in the United States.
1

Financial Strategy
Our main focus in 2006 was on creating a new model that would lead to consistent top-line performance whilemaintaining merchandise margins, cash position, the health of our balance sheet, and a rational store count.
This strategy included four key initiatives:
Reengineer the Mall Stores. Throughout 2006, we aggressively pursued our strategic initiative related to thereengineering of our mall stores. This included transitioning our merchandise to a newer, fresher and less outerweardependent product mix. During the first half and into the third quarter of 2006, receipts of new merchandise werelimited to focus on repositioning our inventory and eliminating non-go-forward and overstocked inventory,including styles carried over from prior years. We reduced the number of styles we offer in many of our outerwearand apparel categories while increasing our accessory penetration by offering a greater assortment of higher quality,higher fashion handbags in a wider range of price points. Overall, our product mix migrated to a mix with higherprice points.
The reengineering of our mall stores also included a significant investment in new fixtures, including newwindow fixtures, custom wall graphics, display tables, boutique wall presentations, and new interior signage.Product presentation, pricing strategies and store set-ups were also updated giving our mall stores a fresh and cleanlook that is much easier to shop. These changes were all made with the goal of transitioning our customer basetoward a more value-oriented, fashion-focused customer and away from the price-driven promotional customer wehave historically sold to. The transformation of our mall stores was substantially completed in the third quarter of2006 in advance of the holiday selling season.
In addition to this transformation of our mall stores, we began the process of repositioning the Wilsons Leatherbrand. We believe every company has its own personality. The personality of Wilsons Leather is driven by the natureof our product. Leather is associated with inherent attributes that give it a mystique, a personality affecting essenceunique among apparel materials. It is genuine, adventurous, confident, distinctive, indulgent, smart, primal, andcool. These are the attributes of the Wilsons Leather brand. To reinforce this belief, in the fall of 2006, we introducedour new logo and Wilsons Leather Brand Mission:
“At Wilsons Leather, we celebrate the beauty and quality of leather. Our branded apparel and accessorieshighlight the essence of leather — its feel, its value, its fashion. Our stores invite each customer to see andtouch every product, connecting to their own sense of personal style. Our in-store brand representativespromote our legacy and core competence, as they teach Leather Intelligence to the men and women shoppingin our stores.”
This new logo and brand mission were incorporated into our stores’ new design and layout, our apparel andaccessory merchandise, as well as our associates’ training.
Revitalize the Outlet Division. We implemented new marketing packages within our outlet division differ-entiated from our mall stores. We also improved merchandising within the outlet stores, including more oppor-tunistic purchases from third-party vendors, as well as our traditional suppliers.
Planning the Launch of a New Store Concept. We planned to develop a new accessory store concept thatwould focus on mid-to-higher-end fashion accessory offerings with a limited assortment of outerwear geared toserve a fashion savvy customer, with price points significantly higher than in our Wilsons Leather stores. We set agoal to launch these stores in 2007. However, due to the significant effort involved in transforming our mall stores,we did not pursue these plans in 2006 and do not anticipate doing so in the near future.
Develop a Wholesale Business. In 2006, we laid the foundation for a wholesale business to sell proprietarylicensed and branded leather products in geographies and product categories outside our current markets andproduct mix. During the year, we established relations with certain major retailers and other wholesale customersand expanded our NASCAR licensing rights to our wholesale channel. By virtue of our sourcing expertise, webelieve we are well positioned to sell an array of leather products to other retailers and that our wholesale channel,while in its early stages, has the potential to become a meaningful contributor of sales and profit in the future.
2

From the outset, we believed the impact of our efforts related to these strategies would not be realized untilafter 2006, as these initiatives were part of a multi-year, multi-format strategy intended to move Wilsons Leatherinto a stronger position as a company and a more relevant brand for the future. We anticipated that these changes tothe physical layout of our mall stores, our new product mix and new merchandise strategies would take time toresonate with our new target customer.
We believed that the 2006 holiday selling season would provide confirmation that these strategies, particularlythe transformation of our mall stores, were gaining traction with our new target customer. However, we experienceda significant decrease in holiday selling season traffic and the resulting 21.6% decrease in our fourth quartercomparable store sales was evidence that the migration to our new target customer will take additional time and ourstrategic course will need to be refined to improve top-line performance.
In 2007, we plan to build on the “reinvented” Wilsons Leather we worked to create in 2006 and increaserecognition and acceptance of the new Wilsons Leather brand. We intend to continue to appeal to a morecontemporary and upscale target customer. We do not intend to revert to the promotional “price only” environmentof crowded stores and unattractive presentations that was our past.
Our accessories penetration increased to 41.4% of net sales in 2006 and we will continue to increase ouraccessories profile as we go forward by offering new collections of high quality, high fashion handbags at a widerange of price points. However, we are still dependent on our outerwear business to drive traffic into our stores.While we focus on building the Wilsons Leather brand, we will increase the number of nationally recognizeddesigner brands in our outerwear offerings to help generate additional traffic. We believe that once customers enterour stores they will be able to compare the high quality, distinctive leathers, quality construction, and refined detailsthat are the Wilsons Leather brand. We expect that the introduction of additional designer brands into our stores willbegin in the second quarter of 2007.
Merchandising Strategy and Product Design
Our merchandising is now tailored to a more contemporary and upscale customer base. In 2006, we introduceda new offering of a broad selection of higher quality, higher fashion merchandise at higher prices. We currently offerapproximately 3,000 and 5,900 styles of leather merchandise throughout our mall and outlet stores, respectively.The accessories consist primarily of handbags, briefcases, computer cases, gloves, wallets, planners, and belts. Ourmerchandising staff, including buyers and designers, continually monitors emerging trends and changing consumerpreferences and utilizes information provided by our customers to ensure that we maintain a consistent andup-to-date selection of products. To further minimize our inventory risk and maximize our sales performance, ourmerchandising team utilizes our flexible merchandise management information system to test new merchandise inmany of our stores before making large commitments and purchase orders with our suppliers.
The elements of our merchandise strategy combine to create an assortment of products that appeal toconsumers from a broad range of socio-economic, demographic and cultural profiles and are designed to generatedemand and increase comparable store sales. We perform internal market research at least annually, and we willcontinue to survey our current and potential customers each year to update our customer demographics. We believethat our strategy will continue to position us as the leading specialty retailer of quality leather outerwear, accessoriesand apparel and strengthen the position of the Wilsons Leather brand. The principal elements of our merchandisestrategy include:
Increase the Merchandising of Accessories. In 2006, we updated the merchandising within our mall stores toincrease the profile of our accessories business with an added emphasis on handbags. As a result, accessoriespenetration increased to 41.4% from 38.3% of net sales the year before. We plan to drive accessories growth bycontinuing to offer new and fresh collections of handbags that will attract customers into our stores on a morefrequent basis. Our accessories business has proven to be less seasonal and has grown into the largest merchandisecategory of our business. We believe that further increasing our accessories business will offer us an opportunity tolimit the risk inherent in our business and reduce our seasonality. Therefore, we will continue to offer a greaterassortment of high quality, high fashion handbags in a wider range of price points.
3
Grow Brand Recognition. We plan to build on the “reinvented” Wilsons Leather we worked to create in2006, when we began the process of transforming Wilsons Leather into a stronger brand by introducing our newlogo and brand mission. This new logo and brand mission were incorporated into our stores’ new design and layout,our apparel and accessory merchandise, as well as our associates’ training. Our goal in 2007 will be to continue topromote the recognition and acceptance of the Wilsons Leather brand through a variety of in-store visualpresentations in our national network of mall and outlet stores, through our e-commerce site and through targetedmarketing campaigns. As the leading specialty retailer of quality leather outerwear, accessories and apparel, we willcontinue to expand the recognition of the Wilsons Leather brand by focusing our merchandising efforts on bothclassic and fashion-forward styles designed to reach our target market.
Designer Label Outerwear. We plan to introduce additional nationally recognized designer labels into ourouterwear offerings to draw more customers into our mall stores. While accessories are the largest merchandisecategory of our business, we are still heavily dependent on men’s and women’s outerwear and apparel. While webuild acceptance of the Wilsons Leather brand with a more upscale customer base, the addition of these familiarhigh-end names to our outerwear and apparel assortment should lend credibility to our products. We believe thatthese well-known labels will generate additional traffic and allow more customers the opportunity to favorablycompare the high quality, distinctive leathers, quality construction, and refined details that are the Wilsons Leatherbrand. The introduction of additional designer brands into our stores will begin in the second quarter of 2007.
Optimize Merchandise Assortment. We continually evaluate our merchandise assortment to optimize ourmix and price points. In 2006, we introduced a newer, fresher and less outerwear dependent product mix of highquality, high fashion merchandise at higher price points. In addition, we utilize our outlet channel to moreeffectively clear mall merchandise in order to keep our mall stores fresh and up-to-date. We will continue to offerhigh quality, high fashion products at price points geared to our targeted customer base in 2007.
Target Core Customer Base. In 2007, we intend to continue to appeal to a more classic and contemporarytarget customer. In our stores, we target high potential, high-volume customers ages 25 to 55, and we work to ensurethat our stores are assorted with the products they want. By delivering fashion-right leather merchandise that fits thelifestyle needs of our target customers at prices they find attractive we believe we will improve our customer focusand build consumer loyalty to the Wilsons Leather brand.
Capitalize on Worldwide Sourcing Network and In-House Design Team. We believe that our integratedworldwide sourcing and in-house design capabilities enable us to gain numerous competitive advantages andbenefit our stores. We have established strong relationships with suppliers globally and our design team worksclosely with our suppliers to ensure seamless development of leather styles, colors and finishes. We have a staff ofapproximately 47 professionals in China, Hong Kong, India, and South Korea to ensure that our designs aremanufactured quickly with consistent quality standards. As new market trends are identified, we make merchandisedesign decisions to ensure that key features of fashion merchandise are incorporated in future designs. Our staff ofin-house designers combines industry experience with the latest fashion trends to produce product lines that are bothclassic and fashion-forward while also considering anticipated retail prices and profit margins of the merchandise,the availability of leather and raw materials and the capabilities of the factories that will manufacture themerchandise. These designs are created to ensure a quality, theme and image consistent with the Wilsons Leatherbrand. We believe that our control of design and sourcing results in shorter lead times, reducing inventoryrequirements and fashion risk and permitting in-season reorders.
Pursue Multiple Selling Channels. Our distribution network of multiple store formats allows us to specif-ically tailor our stores with a wide selection of merchandise at multiple price points and to optimize raw materialsusage, inventory flow and sales across all channels. We operate our stores in malls, outlet centers and airports. Wealso sell through our e-commerce site. We believe the efforts we made in 2006 to reengineer our mall stores createda better shopping environment for our more contemporary and upscale target customer. Our outlet stores enable usto effectively manage inventories, drive year-round sales and extend the recognition of the Wilsons Leather brandwhile building our customer base. In 2007, we will continue to build a wholesale channel that offers licensed andbranded products and targets retailers who either do not compete with us or who look for us to supply categories ofmerchandise that we do not carry in our own stores. Through the creative use of marketing and promotions, and our
4

continued efforts to achieve optimal leather merchandise assortments in each of our selling channels, we believe wecan successfully reach our targeted retail and wholesale customer bases.
The following table sets forth the percentages of net sales by major merchandise category for 2006, 2005 and2004:
Merchandise Category 2006 2005 2004
Accessories . . . . . . . . . . . . . . . . . . . . . . . . . . . . . . . . . 41.4% 38.3% 35.6%
Women’s apparel . . . . . . . . . . . . . . . . . . . . . . . . . . . . . 28.0% 30.0% 32.1%
Men’s apparel . . . . . . . . . . . . . . . . . . . . . . . . . . . . . . . 30.6% 31.7% 32.3%
Total . . . . . . . . . . . . . . . . . . . . . . . . . . . . . . . . . . . . . . 100.0% 100.0% 100.0%
Sourcing and Quality Assurance
We believe that our extensive knowledge of the world’s leather markets is critical in mitigating pricefluctuations in the cost of raw leather during times of high volatility. While we do not normally obtain possessionof a significant level of raw material, we assist tanneries and factories in partnering, developing and sourcing rawmaterial from all over the world, ensuring broad access to the marketplace. However, from time to time we purchasesupplies of leather to take advantage of market opportunities to ensure reserves of quality materials at acceptableprices. Leather is primarily sourced in China, India, Italy, South Korea, and South America. Our buying strategies,coupled with our expertise in leather development, enable us to purchase entire lots of leather and use varyinggrades of leather in different products, providing us with significant price advantages.
Our sourcing infrastructure and strong relationships with our suppliers allow us to effectively controlmerchandise production without owning manufacturing facilities. Our designers and buyers work closely withour sourcing team to identify and develop leather styles, colors and finishes. We have a staff of approximately47 professionals located in China, Hong Kong, India, and South Korea who are primarily responsible for overseeingthe production and quality assurance process in overseas factories and are supervised by the sourcing team at ourcorporate headquarters. Their responsibilities include inspecting leather at the tanneries, coordinating the pro-duction capacity, matching product samples to our technical specifications, and providing technical assistance andquality assurance through inspection in the factories.
Our merchandising department works closely with our overseas personnel to coordinate order fulfillment. Wehave consistently maintained our merchandise production cycle at approximately 90 days. We believe thisproduction cycle allows us to better control our production needs and reorder faster-selling merchandise duringour peak selling season. We believe that this strategy results in more effective and efficient inventory managementand gives us the ability to manage production as the business climate changes.
We have developed strong and long-standing relationships with our manufacturers and tanneries. In 2006,approximately 82.0% of our leather garments and accessories were manufactured by approximately 73 indepen-dently owned manufacturing facilities in China, India and South Korea. Our relationships, coupled with oursignificant purchasing power, enable us to achieve economies of scale and ensure that we can consistently maintainour quality and obtain sufficient manufacturing capacity when needed.
In 2006, we made significant gains in our quality processes and overall product quality, which will continueinto 2007, as we plan to offer higher quality merchandise to our customers with distinctive leathers, improvedconstruction and more refined details and trimmings.
Store Formats and Locations
As of February 3, 2007, we operated 417 retail stores located in 45 states, including 287 mall stores, 116 outletstores and 14 airport locations. While we have historically supplemented our permanent stores with temporaryseasonal stores during our peak selling season, operation of our temporary seasonal stores was suspended in 2006.In 2005 and 2004, we operated 118 and 102 temporary seasonal stores, respectively.
5

In addition, our e-commerce site at www.wilsonsleather.com offers leather outerwear, accessories and apparel,as well as company background and financial information.
Store Locations as of February 3, 2007:
State Mall Outlet Airport Total
Alabama . . . . . . . . — 1 — 1Arkansas . . . . . . . . 1 — — 1Arizona . . . . . . . . . 2 1 — 3California . . . . . . . . 25 14 1 40Colorado . . . . . . . . 6 3 — 9Connecticut . . . . . . 7 1 — 8Delaware . . . . . . . . 3 1 — 4Florida . . . . . . . . . . 8 8 1 17Georgia . . . . . . . . . 8 5 3 16Iowa . . . . . . . . . . . 4 1 — 5Idaho . . . . . . . . . . . 1 — — 1Illinois . . . . . . . . . . 24 4 5 33Indiana . . . . . . . . . 8 2 — 10Kansas . . . . . . . . . . 2 1 — 3Kentucky . . . . . . . . 4 — — 4Louisiana . . . . . . . . — 2 — 2Massachusetts . . . . . 9 2 — 11Maryland . . . . . . . . 8 4 — 12Maine . . . . . . . . . . 3 2 — 5Michigan . . . . . . . . 16 3 — 19Minnesota . . . . . . . 13 3 1 17Missouri . . . . . . . . . 3 3 — 6Mississippi . . . . . . . — 2 — 2
State Mall Outlet Airport Total
North Carolina . . . . 7 3 — 10North Dakota . . . . . 3 — — 3Nebraska . . . . . . . . 1 — — 1New Hampshire . . . . 4 2 — 6New Jersey . . . . . . . 7 3 — 10New Mexico . . . . . . 2 1 — 3Nevada . . . . . . . . . 1 3 — 4New York . . . . . . . . 18 5 — 23Ohio . . . . . . . . . . . 14 4 — 18Oklahoma. . . . . . . . 3 — — 3Oregon . . . . . . . . . 5 1 — 6Pennsylvania . . . . . . 15 4 1 20Rhode Island . . . . . . 1 — — 1South Carolina . . . . — 5 — 5South Dakota . . . . . 2 — — 2Tennessee . . . . . . . . 6 4 — 10Texas. . . . . . . . . . . 12 7 — 19Utah . . . . . . . . . . . 1 1 1 3Virginia . . . . . . . . . 6 3 1 10Washington . . . . . . . 10 3 — 13Wisconsin. . . . . . . . 13 4 — 17West Virginia . . . . . 1 — — 1
GRAND TOTAL . . 287 116 14 417
Site Selection for Store Openings and Closings. We use a detailed process to identify favorable storelocations in existing or new markets. Within each targeted market, we identify potential sites for new andreplacement stores by evaluating market dynamics. Our site selection criteria include:
• customer segment and demographic data derived from our point-of-sale network and outside sources;
• information relating to population density in concentric circles surrounding the center;
• the performance of past temporary seasonal stores within the center;
• the proposed location within the center; and
• projected profitability, cost, return on investment, and cash-flow objectives.
Our cross-functional review committee approves proposed store projects, including new sites and leaserenewals. We periodically evaluate our stores to assess the needs for remodeling or the timing of possible closurebased on economic factors. We use our knowledge of market areas and rely upon the familiarity of our name, theuniqueness of our product category and our national reputation with landlords to enhance our ability to obtain primestore locations and negotiate favorable lease terms. Our real estate, store planning and executive management teamsanalyze the performance and profitability of our stores and markets to assess the potential for new and replacementstores and to identify underperforming stores. In 2007, we plan to open approximately five stores and closeapproximately nine stores (primarily related to natural lease terminations).
6

The following chart highlights the number of stores, by format, opened or closed in each of the last three years:
Mall Outlet Airport Total
Store count as of January 31, 2004 . . . . . . . . . . . . . . . . . 334 107 19 460
Fiscal year ended January 29, 2005Stores opened. . . . . . . . . . . . . . . . . . . . . . . . . . . . . . . 3 2 — 5
Stores closed . . . . . . . . . . . . . . . . . . . . . . . . . . . . . . . (26) — (3) (29)
End of year count. . . . . . . . . . . . . . . . . . . . . . . . . . . . 311 109 16 436
Fiscal year ended January 28, 2006Stores opened. . . . . . . . . . . . . . . . . . . . . . . . . . . . . . . 4 3 — 7
Stores closed . . . . . . . . . . . . . . . . . . . . . . . . . . . . . . . (17) (2) (2) (21)
End of year count. . . . . . . . . . . . . . . . . . . . . . . . . . . . 298 110 14 422
Fiscal year ended February 3, 2007Stores opened. . . . . . . . . . . . . . . . . . . . . . . . . . . . . . . 3 6 — 9
Stores closed . . . . . . . . . . . . . . . . . . . . . . . . . . . . . . . (14) — — (14)
End of year count. . . . . . . . . . . . . . . . . . . . . . . . . . . . 287 116 14 417
Mall Stores. As of February 3, 2007, we operated 287 mall stores in 41 states. Our mall stores showcase a fullrange of leather outerwear, accessories and apparel primarily under our proprietary labels. These stores averageapproximately 2,550 total leased square feet and are located in all types of shopping malls, serving diversedemographics. A typical mall store will carry a selection of approximately 3,000 different styles of ourmerchandise.
We have historically supplemented our mall stores with temporary seasonal stores during our peak sellingseason. We did not operate any temporary seasonal stores in 2006. In 2005 and 2004, we operated 116 and99 temporary seasonal mall stores, respectively. We do not intend to operate any temporary seasonal mall stores inthe foreseeable future, but may reconsider if circumstances warrant.
Outlet Stores. Our 116 outlet stores are located in 36 states and operate under the names Wilsons LeatherOutletSM and The Wallet Works». To maintain brand image, we generally locate outlet stores in larger outlet centersin areas away from our mall stores. Our Wilsons Leather OutletSM stores offer clearance items and specialoutlet-only merchandise as well as certain key in-season products. Wilsons Leather OutletSM stores averageapproximately 3,950 total leased square feet and generally carry approximately 5,900 styles of merchandise. TheWallet Works» stores average approximately 1,800 square feet and carry mainly accessories. We did not operate anytemporary seasonal outlet stores in 2006. In 2005 and 2004, we operated two and three temporary seasonal outletstores, respectively. We do not intend to operate any temporary seasonal outlet stores in the foreseeable future, butmay reconsider if circumstances warrant.
Airport Stores. Our 14 airport stores play a key role in growing awareness of the Wilsons Leather brand andshowcasing our products to millions of travelers who pass by our airport stores each year. These stores averageapproximately 650 total leased square feet and carry approximately 1,000 of our best-selling styles, primarilyaccessories.
e-commerce. Our e-commerce site, www.wilsonsleather.com, offers an extension of our store experience andis intended to increase brand awareness, strengthen the relationship with our customers, make our merchandisemore accessible to our customers and facilitate cross-marketing with our stores. We are also using e-mail as a meansof reaching out to our customers. Our e-commerce site features key in-season merchandise as well as promotionalmerchandise. In 2006, our on-line net sales grew 7.1% to $6.7 million as compared to $6.3 million in 2005. We planto continue to invest prudently in the development and maintenance of our on-line presence, with the Internetserving as an additional shopping format for our customers, as well as a vehicle for building brand awareness. Theadministration and marketing of our e-commerce site is outsourced to a third party vendor who performs similarservices for other specialty retailers.
7

Store Operations. Our store operations are organized by region. Our mall and airport stores are divided intotwo regions, and our outlet stores comprise a third region, with each region subdivided into districts. Each districtmanager is responsible for anywhere from eight to 17 stores. Individual stores are staffed by a manager, an assistantmanager and a complement of full- and part-time sales associates whose numbers fluctuate based upon expectedand actual sales. A typical store manager has an average of over 4.5 years experience with our company. Storemanagers are responsible for hiring and associate training, sales and other operations including visual display andinventory control. All other aspects of store operations are administered centrally by our corporate offices.
A core aspect of our corporate culture is to focus on employee training and customer service. We emphasizesales associate training to ensure each associate has knowledge of our merchandise and our target customer. Ourassociates receive ongoing training in the unique properties of leather, the appropriate methods of care for thevarious leather finishes and the product specifications and details of our merchandise. In addition, we trainassociates to perform minor repairs in the store for customers free of charge.
We regularly evaluate our customer service performance through on-line customer satisfaction surveys, directsurveys of customers who return merchandise and mall intercept surveys. Issues relating to policy, procedure ormerchandise are frequently reviewed to improve service and quality.
Distribution
Merchandise for our stores is shipped directly from domestic merchandise vendors or overseas manufacturersto our distribution center located in Brooklyn Park, Minnesota or to a third-party distribution facility in Kent,Washington. We are party to a 15-year operating lease, with a five-year option to extend, for our 289,000 square-foot distribution center in Brooklyn Park, Minnesota that is equipped with automated garment-sorting equipment,automated accessory packing equipment, and hand-held radio frequency scanners for rapid bar code scanning andenhanced merchandise control. Approximately 20% of the merchandise received is immediately sent to our storesthrough cross-docking via the Kent, Washington distribution center, which allows for reduced logistics expense andimproved speed to market. Additional merchandise is stored in our Brooklyn Park, Minnesota distribution center toreplenish stores weekly with key styles and to build inventory for the peak holiday selling season. Through theintegration of merchant and distribution systems, we are able to frequently replenish goods to ensure that our storesmaintain an appropriate level of inventory.
Marketing and Advertising
Our marketing strategy is to position Wilsons Leather as the preferred retailer of quality leather products forour target customer, capitalizing on our position as the leading specialty retailer of leather outerwear, accessoriesand apparel in the United States. In 2006, we began the process of transforming Wilsons Leather into a brand, notjust a store, by introducing our new logo and brand mission, which have been incorporated into our stores’ newdesign and layout, our apparel and accessory merchandise, as well as our associates’ training. In addition, theWilsons Leather brand identity and current fashion trends are communicated to customers through compellingfashion photo imagery in our stores and storefronts. Our airport stores showcase the Wilsons Leather brand tomillions of travelers annually in some of the busiest airports in the United States. Our e-commerce site makes ourmerchandise more accessible to customers, increases brand awareness and facilitates cross-marketing efforts withour brick-and-mortar stores.
We market to specific lifestyles and offer outerwear, accessories and apparel in styles ranging from classic tocontemporary. We target high potential, high-volume customers between the ages of 25 and 55. In addition, webelieve cross-channel brand marketing is an important driver for our future success. By leveraging our variousselling formats — malls, outlets, airports, and our e-commerce site — we intend to strengthen the Wilsons Leatherbrand as the fashion leather leader in the marketplace.
In 2006, as part of the reengineering of our mall stores, we introduced new wall graphics, signage, ticketing,and store fixtures making our stores more contemporary and easier to shop. These changes better emphasize thespecial nature of our product offerings making them more inviting for our customers to touch and experience. Inaddition, we created multiple buying opportunities for our customers through a national magazine advertisingcampaign that ran over the holiday selling season, a bounce-back coupon campaign and our holiday “Gift Leather”
8

gift card event, which resulted in a significant increase in gift card sales and represents substantial retail sales uponredemption.
We will evaluate several different forms of media promotion to better reach our target customer in 2007,including additional national magazine advertising, direct mailings, freestanding newspaper inserts, and othermeans.
Licensing
Our sales of licensed products are an important component of our business. We have teamed with some ofNASCAR’s top drivers for the license to produce a line of products including men’s and women’s fashion leatherjackets, handbags and other accessories bearing the marks of these popular drivers. These licensed products arecurrently sold through Wilsons Leather stores nationwide, as well as our e-commerce site and our wholesalebusiness. During 2006, we added the ability to sell NASCAR and other licensed products through our wholesaledistribution channels. We broadened our selection of licensed products through agreements with, among others,Disney Consumer Products, a division of Disney Enterprises, Inc. Our various license agreements have terms thatexpire from December 31, 2007 to April 30, 2010.
Under these licensing agreements, we are generally required to achieve a minimum level of net sales, payspecified royalties and receive prior approval from the licensor as to all elements of the licensed merchandise we areto offer. We are also limited as to the selling channels we may use and are precluded from competing with certainlicensor channels. The licensor generally maintains the right to terminate our license agreement if we fail to satisfythe specified requirements. Certain of our license agreements have provisions requiring minimum sales and relatedroyalty commitments be met. As such, our ability to extend the terms of our current license agreements may bedependent upon meeting minimum sales and/or royalty levels or complying with all other specified conditions ofthe agreements. Other matters may also affect our ability to renew existing licenses and there is no assurance that wewill be able to renew our current license agreements when they expire.
Licensed product net sales were $10.9 million, $13.3 million and $9.4 million, in 2006, 2005 and 2004,respectively. In 2007, we will continue to explore new licensing opportunities to expand our collection of licensedmerchandise and broaden the markets that we serve. We anticipate that the sale of licensed products will be asignificant component of the wholesale business we will continue to develop in 2007 and beyond.
Information Systems
We continually assess and upgrade our information systems in an effort to better support our stores’ operationsand home office administrative functions. Over the past several years, we have made considerable investments inimproving our information systems and completing the replacement of major operating platforms in the functionalareas of merchandising, finance, human resources, manufacturing, and store point-of-sale and back-office systems.Most recently, in 2006 we completed a significant upgrade to our financial systems, replaced the core componentsof our store point-of-sale systems hardware, installed traffic counters in certain stores on a pilot basis, andimplemented a data warehouse to provide more timely and detailed information. These systems provide all levels ofour organization access to information, powerful analytical tools to improve our understanding of sales andoperating trends and the flexibility needed to anticipate future business needs. We believe that our current systems,along with planned upgrades, are adequate to meet our operational plans over the next several years.
Our point-of-sale and back-office systems have been designed to, among other things, free store associates’time so that they can focus on serving our customers. Our point-of-sale system automates store operations and giveseach store the ability to view inventory at other store locations, access human resource and inventory managementdocumentation and enables customer information collection. On a daily basis, we obtain sales and inventory datafrom our stores, facilitating merchandising decisions regarding the allocation of inventory, pricing and inventorylevels. Our connection to our overseas product sourcing offices provides both field management and home officepersonnel access to pertinent business information. The continuous flow of information to and from our overseaspersonnel permits us to better control inventory, plan manufacturing capacity, regulate merchandise flow, andensure product consistency among manufacturers.
9

Competition
The retail leather outerwear, accessories and apparel industry is both highly competitive and fragmented. Webelieve that the principal bases upon which we compete are selection, style, quality, price, value, store location, andservice. We compete with a broad range of other retailers, including specialty retailers, department stores, massmerchandisers and discounters, and other retailers of leather outerwear, accessories and apparel. We have found thatwe have different competitors during different times of the year. For example, our competition with departmentstores increases during the holiday gift giving season. Over the past few years, we have faced increased competitionfrom department stores, mass merchandisers and discounters as they have significantly expanded into the leatherouterwear category at promotional price points. While our prices are competitive and we believe our quality issuperior, we lack the marketing leverage these parties can bring to bear during the fourth quarter when they promoteleather outerwear.
Trademarks
We conduct our business under various trade names, brand names, trademarks, and service marks in the UnitedStates, including M. JulianTM, Maxima», Pelle Studio», Wilsons The Leather ExpertsTM, Tannery West», Geor-getown Leather DesignTM, The Wallet Works», Wilsons LeatherTM, Wilsons Leather OutletSM, Handcrafted byWilsons The Leather ExpertsTM, and Vintage by Wilsons The Leather ExpertsTM.
Employees
As of February 3, 2007, we had 3,461 associates working for our company. Of these, 288 were corporate officeand distribution center associates, 3,126 were full-time, part-time and seasonal associates in our stores and 47 werelocated in our far east sourcing offices. In 2006, during our peak selling season from October through January, weemployed approximately 105 additional seasonal associates in our distribution center and approximately 1,814additional seasonal associates in our stores. We consider our relationships with our associates to be good. None ofour associates are governed by collective bargaining agreements.
Available Information
Our Internet address is www.wilsonsleather.com. We make available free of charge through our Internet Website our annual report on Form 10-K, quarterly reports on Form 10-Q, current reports on Form 8-K, and amendmentsto those reports filed or furnished pursuant to Section 13(a) of the Exchange Act, as amended, as soon as reasonablypracticable after we electronically file such material with, or furnish it to, the Securities and Exchange Commission.Our Code of Business Ethics and Conduct and our Board of Directors Committee charters are also available via ourWeb site.
10

Item 1A. Risk Factors
The risks and uncertainties described below are not the only ones facing our company. Additional risks anduncertainties also may impair our business operations. If any of the following risks actually occur, our business,financial condition and results of operations would likely suffer.
Our growth is dependent on strengthening our existing stores and brand strategy development.
Our ability to grow our existing business depends in part on our ability to appropriately identify, develop andeffectively execute strategies and initiatives related to strengthening our stores’ operations and increasing brandacceptance. Our growth over the next several years depends on our ability to successfully and effectively manageour existing business by continuing to revitalize our mall and outlet stores, increase acceptance of our brand andopen new stores on a limited basis as opportunities arise. Our ability to grow our business will be limited, however, ifwe are unable to improve the sales performance and productivity of our existing stores. Failure to effectivelyidentify, develop and execute strategies and initiatives may lead to increased operating costs without offsettingbenefits and could have a material adverse effect on our results of operations. During 2006, we reengineered ourmall stores with a goal of transitioning our customer base toward a more fashion-focused and less price-sensitivecustomer. In addition, we introduced the new Wilsons Leather logo and brand mission to better promote theuniqueness of our merchandise. Based on our experience over the 2006 holiday selling season, we believe that it willtake longer for our new product mix and merchandise strategy to reach our new target customer than we expectedand it is possible that the new strategy may not be successful at all. If we are not able to attract customers through ournew strategy and increase acceptance of the Wilsons Leather brand, our comparable store sales, operating marginsand cash flow will be adversely affected, which would likely have a material adverse effect on our business,financial condition and results of operations.
Our comparable store sales declined during four of the past five years.
Our comparable store sales decreased by 17.2% in 2006, including a 21.6% decrease in the fourth quarter. In2005, our comparable store sales decreased by 2.9%, with a 10.0% decrease in the fourth quarter. Comparable storesales declined 6.8% and 7.0% in 2003 and 2002, respectively. Comparable store sales for 2004 increased nominallyby 0.6%. Our comparable store sales are affected by a variety of factors, including:
• general economic conditions and, in particular, the retail sales environment;
• consumer shopping preferences;
• transition of our target customer base;
• acceptance of the Wilsons Leather brand;
• actions by competitors or mall anchor tenants;
• weather conditions;
• fashion trends;
• changes in our merchandise mix;
• the timing of new store openings and the relative proportion of new stores to mature stores;
• maintaining appropriate inventory levels;
• calendar shifts of seasonal periods; and
• timing of promotional events.
A continued inability to generate comparable store sales increases in the future would erode operating marginsif we were unable to implement additional cost reductions and could have a material adverse effect on our business,financial condition and results of operations.
11

We may need funding in addition to our cash flow from operations and existing credit facilities.
Based on our current 2007 plan, we believe that the borrowing capacity under our senior credit facility,together with cash on hand, current and anticipated cash flow from operations, and cost reductions associated withour lower store count will be adequate to meet our working capital and capital expenditure requirements through thefirst half of 2008. However, if our comparable store sales do not increase as planned in the second half of 2007, weexpect that we may need additional financing in 2008 in order to fund our working capital and capital expenditurerequirements. Even if our performance during 2007 is on track with plan, we may also seek to obtain additionalfinancing during 2007 for 2008 working capital needs as well as the ability to accelerate implementation of ourmerchandise and brand acceptance strategies. We are currently exploring various financing strategies. There can beno assurance that additional financing would be possible or could be obtained on terms that are favorable to us, or atall. If we are not able to obtain such access to capital, we may not be able to implement our key initiatives to growour business. If we raise capital through the issuance of additional equity securities, the holdings of existingshareholders may be diluted.
We are dependent upon our key supplier to implement our merchandising strategy to offer designer labelsin our stores’ outerwear product mix.
We plan to introduce additional nationally recognized designer labels into our outerwear offerings beginningin the second quarter of 2007. We believe that in offering these designer labels, we will generate additional trafficand allow more customers the opportunity to favorably compare the high quality of the Wilsons Leather brand tothese well-known labels. The successful implementation of this merchandising strategy will depend on ourrelationship with our key supplier. Our inability to successfully source and integrate additional designer labels intoour outerwear merchandise mix may limit acceptance of the Wilsons Leather brand, which may have a materialadverse effect on our business, financial condition and results of operations.
Changes in customer shopping patterns could harm our sales.
Most of our stores are located in enclosed shopping malls and regional outlet centers. Our ability to sustain orincrease the level of sales depends in part on the continued popularity of malls and outlet centers as shoppingdestinations and the ability of malls and outlet centers, tenants and other attractions to generate a high volume ofcustomer traffic. Many factors beyond our control may decrease mall traffic, including, among other things,economic downturns, rising energy prices, the closing of anchor department stores, weather, concerns of terroristattacks, construction and accessibility to strip malls, or alternative shopping formats (such as catalogs, e-commerceor discount stores). Any changes in consumer preferences and shopping patterns could adversely affect our financialcondition and operating results.
We may not be able to build and grow our wholesale business effectively and timely and we cannot assurethat our wholesale business will warrant additional growth or gain market acceptance.
In 2006, we laid the foundation for a wholesale business to sell proprietary licensed and branded leatherproducts in geographies and product categories outside our current markets and product mix. During the year, weestablished relations with certain major retailers and other wholesale customers and expanded our NASCARlicensing rights to our wholesale channel. However, our wholesale business is unproven and still in the early stagesof development. Competitive circumstances and consumer characteristics in new markets served by our wholesalebusiness may differ substantially from those in the markets in which we have substantial experience. While webelieve that our wholesale business may have the potential for expansion, there can be no assurance that we willexpand our wholesale business to a meaningful contributor of sales and profit in the future.
We may need to record additional impairment losses in the future if our stores’ operating performancedoes not improve.
We continually review our stores’ operating performance and evaluate the carrying value of their assets inrelation to their expected future cash flows. In those cases where circumstances indicate that the carrying value ofthe applicable assets may not be recoverable, we record an impairment loss related to the long-lived assets. In the
12

fourth quarter of 2006, we recorded an impairment loss of $0.7 million related to certain mall stores’ assets. If ourstores’ operating performance does not improve in the future, the carrying value of our stores’ assets may not berecoverable in light of future expected cash flows. This may result in our need to record additional impairmentlosses in certain markets where our stores operate that could have a materially adverse effect on our business,financial condition and results of operation.
The high level of competition in our markets may lead to reduced sales and profits.
The retail leather outerwear, accessories and apparel markets are highly competitive and fragmented. Wecompete with a broad range of other retailers, including other specialty retailers, department stores, massmerchandisers and discounters, many of which have greater financial and other resources. Increased competitionmay reduce sales, increase operating expenses, decrease profit margins, and negatively affect our ability to obtainsite locations, sales associates and other employees. During 2003 through 2006, we faced increased competitionfrom department stores, mass merchandisers and discounters as they have significantly expanded into the leatherouterwear category at promotional price points. There can be no assurance that we will be able to competesuccessfully in the future and, if we are unable to do so, our business, financial condition and operating results couldbe adversely affected.
Uncertainty in general economic conditions may lead to reduced consumer demand for our leatherouterwear, accessories and apparel and could adversely affect our business and liquidity.
Meeting our future capital requirements depends on the sustained demand for our leather products. Manyfactors affect the level of consumer spending on our products, including, among others:
• general economic conditions;
• rising energy prices;
• interest rates;
• the availability of consumer credit;
• continued hostilities in the Middle East and other significant national and international events; and
• taxation and consumer confidence in future economic conditions.
Consumer purchases of discretionary items, such as our products, tend to decline during recessionary periodswhen disposable income is lower. Any uncertainties in the United States’ economic outlook can adversely affectconsumer spending habits and mall traffic and result in lower than expected net sales on a quarterly and annualbasis.
Increased energy prices put additional pressure on consumer purchases of discretionary items, which couldadversely affect our net sales. In addition, these higher energy costs may have the potential to increase our shippingand delivery costs and could adversely affect our merchandise margins if we are unable to pass these costs on to ourcustomers.
Unseasonably warm weather, particularly during the fall and winter, has in the past and may in thefuture negatively effect our sales performance.
Unseasonably warm weather during the fall and winter season has negatively impacted our comparable storesales and total net sales performance over the past two years. Continued warm weather trends in the future may havea material adverse effect on our business, financial condition and results of operations.
Our inability to effectively respond to changes in fashion trends and consumer demands could adverselyaffect our sales.
Our success depends on our ability to identify fashion and product trends as well as our ability to anticipate,gauge and react swiftly to changes in consumer demand. Our products must remain appealing for a broad range ofconsumers with diverse and changing preferences; however, our orders for products must be placed in advance of
13
customer purchases. We cannot be certain that we will be able to identify new fashion trends and adjust our productmix in a timely manner. If we misjudge market preferences, we may be faced with significant excess inventories forsome products and missed opportunities for other products. In response, we may be forced to rely on additionalmarkdowns or promotional sales to dispose of excess, slow-moving inventories. In addition, consumer sentimenttoward and demand for leather may change and we may not be able to react to any such changes effectively, or at all.There can be no assurance that demand for our leather products will not decline as a result of negative publicityregarding certain diseases that may affect the supply of hides used to make leather products such as mad cow andhoof-and-mouth disease. If we are unable to anticipate, gauge and respond to changes in demand or if we misjudgefashion trends, it could have a material adverse effect on our business, financial condition and results of operations.
A decrease in the availability of leather or an increase in its price could harm our business.
The purchase of leather comprised approximately 51.3%, 55.2% and 56.1% of our costs of goods sold forleather apparel and 52.5%, 47.8% and 47.6% of the costs of goods sold for accessories in 2006, 2005 and 2004,respectively. A number of factors affect the price of leather, including the demand for leather in the shoe, furnitureand automobile upholstery industries. In addition, leather supply is influenced by worldwide meat consumption andthe availability of hides. Fluctuations in leather supply and pricing, which can be significant, may have a materialadverse effect on our business, financial condition and results of operations.
We could have difficulty obtaining merchandise from our foreign suppliers.
We import our leather garments and accessories from independent foreign contract manufacturers locatedprimarily in China and India. We do not have long-term contracts or formal supply arrangements with our contractmanufacturers. In 2006, approximately 82.0% of our leather garments and accessories contracted for manufacturewere purchased from foreign suppliers, with approximately 64.0% purchased from China and 12.0% purchasedfrom India. Trade relations with China and India have, in the past, been contentious. If trade relations with thesecountries or any other country from which we source goods deteriorate, or if any new or additional duties, quotas ortaxes are imposed on imports from these countries, leather purchase and production costs could increasesignificantly, negatively impacting our sales prices, profitability or the demand for leather merchandise. Further,we cannot predict whether any of the countries in which our products are currently manufactured or may bemanufactured in the future will be subject to trade restrictions imposed by the United States government, includingthe likelihood, type or effect of any such restrictions, or whether any other conditions having an adverse effect onour ability to source products will occur. In addition, it will take time for us to transition our sourcing to othercountries. Certain other risks related to foreign sourcing include:
• transportation delays and interruptions, including delays relating to labor disputes;
• economic and political instability;
• restrictive actions by foreign governments;
• trade and foreign tax laws;
• fluctuations in currency exchange rates and restrictions on the transfer of funds; and
• the possibility of boycotts or other actions prompted by domestic concerns regarding foreign labor practicesor other conditions beyond our control.
Any event causing a sudden disruption of imports from China, India or other foreign countries, including adisruption due to financial difficulties of a supplier or a catastrophic event (such as, but not limited to, a fire,tornado, flood, or act of terrorism) could have a material adverse effect on our business, financial condition andresults of operations. In the event that commercial transportation is curtailed or substantially delayed due to adockworkers’ strike or other similar work action, our business may be adversely impacted, as we may havedifficulty shipping merchandise to our distribution centers and stores.
14

The seasonality of our business could affect our profitability.
Since our leather outerwear and apparel products are most often purchased during the holiday season, weexperience substantial fluctuations in our sales and profitability. We generate a significant portion of our net salesfrom October through January, which includes the holiday selling season. We generated 49.2% of our annual netsales during that time period in 2006, and 23.6% in December alone. Because our profitability, if any, is historicallyderived in the fourth quarter, our annual results of operations have been, and will continue to be, heavily dependenton the results of operations from October through January.
Given the seasonality of our business, misjudgments in fashion trends, the effects of war and other significantnational and international events or unseasonably warm or severe weather during our peak selling season could havea material adverse effect on our financial condition and results of operations. Our results of operations may alsofluctuate significantly as a result of a variety of other factors, including:
• merchandise mix offered during the peak selling season;
• the timing and level of markdowns and promotions by us during the peak selling season;
• the timing and level of markdowns and promotions by our competitors during the peak selling season;
• consumer shopping patterns and preferences;
• the timing of certain holidays; and
• the number of shopping days and weekends between Thanksgiving and Christmas.
Our inability to renew existing licensing agreements and/or to enter into new relationships could nega-tively impact our sales.
Our sales from licensing agreements are an important component of our business. Net sales of licensedproducts were $10.9 million, $13.3 million and $9.4 million in 2006, 2005 and 2004, respectively. Under theselicensing agreements we are generally required to achieve a minimum level of net sales, pay specified royalties andreceive prior approval from the licensor as to all elements of the licensed merchandise we are to offer. We are alsolimited as to the selling channels we may use and are precluded from competing with certain licensor channels. Thelicensor generally maintains the right to terminate our license agreement if we fail to satisfy the specifiedrequirements. Certain of our license agreements have provisions requiring us to meet minimum sales and relatedroyalty commitments. There can be no assurance that we will be able to accomplish the following, any of whichcould have an adverse effect on our business, financial condition and results of operations:
• achieve net sales sufficient to cover specified minimum royalty payments that may be required underexisting agreements;
• successfully negotiate renewal of agreements when they expire;
• obtain the ability to sell through additional selling channels, including wholesale; and
• enter into new licensing agreements with other parties.
The public sale of our common stock issued pursuant to our employee benefit plans or the sale into themarket of the shares issued in our equity financing in April 2004 or issuable upon exercise of the war-rants delivered in connection with our April 2004 equity financing could decrease the price of our com-mon stock or make it more difficult to obtain additional financing in the future.
As of February 3, 2007, 1,122,283 shares were subject to issuance upon the exercise of vested stock optionspreviously granted by us, all of which would be freely tradable if issued, subject to compliance with Rule 144 in thecase of our affiliates. In addition, 1,636,921 shares of our common stock have been reserved for issuance pursuant toour employee benefit plans. In connection with the April 25, 2004 equity financing which was completed on July 2,2004, we issued 17,948,718 shares of our common stock and warrants to purchase four million shares of ourcommon stock, subject to certain adjustments, to three institutional investors. The market price of our commonstock could decline as a result of market sales of such shares of common stock or the perception that such sales will
15

occur. Such sales or the perception that such sales might occur also might make it difficult for us to sell equitysecurities in the future at a time and at a price that we deem appropriate.
Our accounting policies and methods are key to how we report our financial condition and results ofoperations and they may require management to make estimates about matters that are inherentlyuncertain.
Our management must select and apply many of these accounting policies and methods so that they not onlycomply with U.S. generally accepted accounting principles, but they also reflect management’s judgment as to themost appropriate manner in which to record and report our financial condition and results of operations. In somecases, management must select the accounting policy or method to apply from two or more alternatives, any ofwhich might be reasonable under the circumstances, yet might result in our reporting materially different amountsthan would have been reported under a different alternative. Note 1, “Summary of significant accounting policies,”to our consolidated financial statements describes our significant accounting policies.
We have identified two accounting policies as being “critical” to the presentation of our financial condition andresults of operations because they require management to make particularly subjective and/or complex judgmentsabout matters that are inherently uncertain and because of the likelihood that materially different amounts would bereported under different conditions or using different assumptions. These critical accounting policies relate to thevaluation of inventory and the valuation of property and equipment for impairment. Because of the uncertainty ofestimates about these matters, we cannot provide any assurance that we will not:
• significantly increase our lower of cost or market allowance for obsolete inventory; or
• recognize a significant provision for impairment of our fixed assets at our stores.
For more information, refer to Item 7, “Management’s Discussion and Analysis of Financial Condition andResults of Operations — Critical Accounting Policies.”
Changes to financial accounting standards may affect our results of operations and cause us to changeour business practices.
We prepare our financial statements to conform with U.S. generally accepted accounting principles. Theseaccounting principles are subject to interpretation by the American Institute of Certified Public Accountants, theSecurities and Exchange Commission and various bodies formed to interpret and create appropriate accountingprinciples. A change in those principles could have a significant effect on our reported results and may affect ourreporting of transactions completed before a change is announced. Changes to those rules or the questioning ofcurrent practices may adversely affect our reported financial results or the way we conduct our business.
Loss of key members of our senior management team could adversely affect our business.
Our success depends largely on the efforts and abilities of our current senior management team. The loss ofservice of any of these persons could adversely affect our business. We do not maintain key-man life insurance onany members of our senior management team.
Ownership of our common stock is concentrated.
R. Ted Weschler, one of our directors, is the sole managing member of the investment manager of PeninsulaInvestment Partners, L.P. (“Peninsula”). Peninsula beneficially owned, in the aggregate, 43.6% of our commonstock as of March 23, 2007. Peninsula voting alone would be able to exert significant influence over our businessand affairs, including:
• the election of individuals to our board of directors;
• the adoption of amendments to our Amended and Restated Articles of Incorporation; and
• the approval of certain mergers, additional financing, sales of assets, and other business acquisitions ordispositions.
16
In addition, the ownership concentration of our stock may limit liquidity and cause shareholders to experiencefluctuations when selling large blocks of our stock.
The market price for our common stock may be volatile.
Our stock price has been, and is expected to continue to be, highly volatile. There could be an immediateadverse impact on our stock price as a result of:
• any future sales of our common stock or other securities;
• a decline in any month or quarter of our net sales or earnings;
• a decline in any month or quarter of comparable store sales;
• a deviation in our net sales, earnings or comparable store sales from levels expected by securities analysts;
• changes in financial estimates by securities analysts; or
• changes in market valuations of other companies in the same or similar markets.
In addition, the Nasdaq Global MarketSM has experienced extreme volatility that has often been unrelated tothe performance of particular companies. Future market fluctuations may cause our stock price to fall regardless ofour performance. Such volatility may limit our future ability to raise additional capital.
We rely on third parties for upgrading and maintaining our information systems.
The efficient operation of our business is heavily dependent on our information systems. In particular, we relyheavily on the automated sortation system used in our Brooklyn Park, Minnesota distribution center and themerchandise management system used to track sales and inventory. We also rely on a third-party package for ouraccounting, financial reporting and human resource functions. We depend on our vendors to maintain andperiodically upgrade these systems so that these systems continue to support our business. The software programssupporting our automated sorting equipment and processing our inventory management information are licensed tous by independent software developers. The inability of these developers to continue to maintain and upgrade thesesoftware programs would disrupt our operations if we were unable to convert to alternate systems in an efficient andtimely manner.
War, acts of terrorism or the threat of either may negatively impact the availability of merchandise andotherwise adversely impact our business.
In the event of war or acts of terrorism, or if either is threatened, our ability to obtain merchandise available forsale in our stores may be negatively affected. We import a substantial portion of our merchandise from othercountries. If imported goods become difficult or impossible to bring into the United States, and if we cannot obtainsuch merchandise from other sources at similar costs, our sales and profit margins may be adversely affected.
The majority of our stores are located in enclosed shopping malls and regional outlet centers. In response to theterrorist attacks of September 11, 2001, security has been heightened in public areas. Any further threat of terroristattacks or actual terrorist events, particularly in public areas, could lead to lower customer traffic in shopping mallsand outlet centers. In addition, local authorities or mall management could close shopping malls and outlet centersin response to any immediate security concern. Mall closures, as well as lower customer traffic due to securityconcerns, could result in decreased sales that would have a material adverse effect on our business, financialcondition and results of operations.
Any significant interruption in the operation of our corporate offices and distribution centers could havea material adverse effect on our business.
Our corporate offices and our Brooklyn Park, Minnesota distribution center are in one location. Our operationscould be materially and adversely affected if a catastrophic event (such as, but not limited to a, fire, tornado, flood,or act of terrorism) impacts the use of these facilities. Similarly, any such catastrophic event impacting our third-party distribution center in Kent, Washington could also have a material adverse affect on our operations. There can
17

be no assurance that we would be successful in obtaining alternative facilities in a timely manner if such acatastrophic event were to occur.
Item 1B. Unresolved Staff Comments
None.
Item 2. Properties
As of February 3, 2007, we operated 417 leased store locations. All of our stores were located in shoppingmalls, outlet centers or airport retail locations. New store leases with third parties are typically 10 years in duration.Most leases require us to pay annual minimum rent plus a contingent rent dependent on the store’s annual sales inexcess of a specified threshold. In addition, the leases generally require us to pay costs such as real estate taxes andcommon area maintenance costs.
We are also party to a 15-year operating lease, with a five-year option to extend, for a 289,000 square-footdistribution center and 69,000 square-foot corporate office space located in Brooklyn Park, Minnesota.
Item 3. Legal Proceedings
We are involved in various legal actions arising in the ordinary course of business. In the opinion of ourmanagement, the ultimate disposition of these matters will not have a material adverse effect on our consolidatedfinancial position and results of operations.
Item 4. Submission of Matters to a Vote of Security Holders
None.
Item 4A. Executive Officers of the Registrant
The following table sets forth certain information concerning our executive officers as of March 23, 2007:
Name Age Position
Michael M. Searles . . . . . . . . . . . . . . . . 57 Chairman and Chief Executive Officer
Stacy A. Kruse . . . . . . . . . . . . . . . . . . . 47 Chief Financial Officer and Treasurer
M. Adam Boucher . . . . . . . . . . . . . . . . . 45 Vice President, Store Sales and Real Estate
William S. Hutchison . . . . . . . . . . . . . . 33 Chief Merchandising and Sourcing OfficerJeffrey M. Loeb. . . . . . . . . . . . . . . . . . . 51 Chief Information Officer
Michael J. Tripp . . . . . . . . . . . . . . . . . . 38 Vice President, Global Logistics and CustomsCompliance
Michael M. Searles has served as our Chief Executive Officer since December 2004 and as Chairman andChief Executive Officer since February 2005. Prior to joining Wilsons Leather, Mr. Searles had been in private retailconsulting from 2002 to November 2004. He served as Chairman of the Board and Chief Executive Officer ofFactory 2-U Stores, Inc., an off-price apparel and home products retailer, from 1998 to 2002. Factory 2-U Stores,Inc. filed for Chapter 11 bankruptcy in January 2004. Mr. Searles served in various positions at Montgomery Ward,a full-line department store chain, from 1996 to 1997, most recently as President, Merchandising and Marketing.Mr. Searles was President of Women’s Specialty Retail Group (formerly, the Casual Corner Group), then a divisionof United States Shoe Corporation, a manufacturing and retail apparel and footwear company, from 1993 to 1995.Mr. Searles also served as President of Kids “R” Us, a leading retailer of toys, baby products and children’s apparelfrom 1984 to 1993.
Stacy A. Kruse has served as our Chief Financial Officer and Treasurer since January 2006, prior to which sheserved as our Vice President Finance and Treasurer from August 2004 to January 2006, our Director of Finance andTreasurer from April 2003 to August 2004, and Director of Business Planning & Analysis and Treasurer from June2001 to March 2003. Prior to joining Wilsons Leather, Ms. Kruse was Director of Finance (Information Servicesand Business Operations) at US Bancorp, a financial services company, from 1999 to 2001 and held various
18

positions at Carlson Marketing Group, a marketing services company, from 1995 to 1999, most recently as Directorof Operations (Loyalty Division) from 1996 to 1999.
M. Adam Boucher has served as our Vice President, Store Sales and Real Estate since January 2006, prior towhich he served as our Vice President, Store Sales from August 2005 to December 2005. Prior to joiningWilsons Leather, Mr. Boucher held various retail stores and corporate development positions at Payless Shoe-Source, a specialty family footwear retailer, from 1988 to 2005, most recently as Vice President, Retail OperationsEastern Zone from 2004 to 2005.
William S. Hutchison has served as our Chief Merchandising and Sourcing Officer since March 2007, prior towhich he served as our Vice President, Sourcing and Wholesale from January 2006 to February 2007, our VicePresident, Sourcing from September 2005 to January 2006 and our Divisional Merchandise Manager — Men’sfrom February 2001 to September 2005. Prior to joining Wilsons Leather, Mr. Hutchison held various merchan-dising positions with Dillard’s Department Stores, Inc. from 1995 to 2001, most recently as Product Development,Brand Manager from 1999 to 2001.
Jeffrey M. Loeb joined our company as Chief Information Officer on March 27, 2007. Prior to becoming anexecutive officer of Wilsons Leather, Mr. Loeb served as an information technology consultant since November2004, and in that capacity he provided consulting services to Wilsons Leather from June 2006 to March 2007.Mr. Loeb previously served in various information technology positions at Best Buy, a consumer electronicsretailer, including most recently as a Program Director, from 2000 to November 2004.
Michael J. Tripp has served as our Vice President, Global Logistics and Customs Compliance since February2007, prior to which he served as our Vice President, Logistics from June 2006 to February 2007, our Director ofDistribution and Transportation from April 2004 to June 2006, and our General Manager Distribution fromFebruary 2001 to April 2004. Prior to joining Wilsons Leather, Mr. Tripp held various distribution center leadershippositions with Kmart, a mass merchandise retailer, from 1997 to February 2000, most recently as Assistant GeneralManager from 1999 to 2000 and as an Operations Supervisor with Target, an upscale discounter, from 1995 to 1997.
19

PART II
Item 5. Market for Registrant’s Common Equity, Related Stockholder Matters and Issuer Purchasesof Equity Securities
Market Information
Our common stock, $.01 par value, trades on the Nasdaq Global MarketSM under the symbol WLSN. Theclosing price of our common stock on March 23, 2007 was $1.68. The following table presents the high and lowmarket prices from January 30, 2005 through February 3, 2007.
Fiscal quarter ended High LowQuarterly Common Stock Price Ranges
April 30, 2005 . . . . . . . . . . . . . . . . . . . . . . . . . . . . . . . . . . . . . . . . . . . . . $5.60 $2.62
July 30, 2005 . . . . . . . . . . . . . . . . . . . . . . . . . . . . . . . . . . . . . . . . . . . . . $7.20 $4.80
October 29, 2005 . . . . . . . . . . . . . . . . . . . . . . . . . . . . . . . . . . . . . . . . . . . $7.26 $4.97
January 28, 2006 . . . . . . . . . . . . . . . . . . . . . . . . . . . . . . . . . . . . . . . . . . . $5.03 $3.04
April 29, 2006 . . . . . . . . . . . . . . . . . . . . . . . . . . . . . . . . . . . . . . . . . . . . . $3.98 $3.14
July 29, 2006 . . . . . . . . . . . . . . . . . . . . . . . . . . . . . . . . . . . . . . . . . . . . . $4.12 $3.25
October 28, 2006 . . . . . . . . . . . . . . . . . . . . . . . . . . . . . . . . . . . . . . . . . . . $3.70 $2.46
February 3, 2007 . . . . . . . . . . . . . . . . . . . . . . . . . . . . . . . . . . . . . . . . . . . $2.84 $1.68
There were 70 record holders of our common stock as of March 23, 2007.
20

Comparative Stock Performance
The comparative stock performance graph below compares the cumulative shareholder return on our commonstock for the period from February 2, 2002 through February 3, 2007, with the cumulative total return on (i) theNasdaq Retail Composite Stock Index and (ii) the S&P 500 Index. The table assumes the investment of $100 in ourcommon stock, the Nasdaq Retail Composite Stock Index and the S&P 500 Index on February 2, 2002, and thereinvestment of all dividends through the last trading day of the years ended February 1, 2003, January 31, 2004,January 29, 2005, January 28, 2006, and February 3, 2007.
2/3/071/28/061/29/051/31/042/1/032/2/02
DO
LL
AR
S
Wilsons The Leather Experts Inc.
Nasdaq Retail Composite Stock Index
S&P 500 Index
0
50
100
150
200
2/2/02 2/1/03 1/31/04 1/29/05 1/28/06 2/3/07
Wilsons The Leather Experts Inc. 100.00 38.16 25.60 26.02 28.35 16.29
Nasdaq Retail Composite Stock Index 100.00 81.32 119.23 142.79 154.85 170.14
S&P 500 Index 100.00 76.25 100.80 104.38 114.39 129.07
Dividends
We have not declared any cash dividends since our inception in May 1996. In addition, our loan agreementscontain certain restrictions limiting, among other things, our ability to pay cash dividends or make otherdistributions. See Item 7. “Management’s Discussion and Analysis of Financial Condition and Results ofOperations — Liquidity and Capital Resources.”
Purchases of Equity Securities
We did not purchase any shares of our common stock during the fourth quarter of 2006.
21

Item 6. Selected Financial Data
The selected historical consolidated financial data set forth below should be read in conjunction with Item 7.“Management’s Discussion and Analysis of Financial Condition and Results of Operations” and our ConsolidatedFinancial Statements, beginning on page F-1 of this report. The selected historical consolidated financial data hasbeen derived from our audited consolidated financial statements.
SELECTED HISTORICAL CONSOLIDATED FINANCIAL AND OPERATING DATA
(In thousands, except per share amounts and operating data)
February 3,2007
January 28,2006
January 29,2005
January 31,2004
February 1,2003
For the years ended(1)
Statement of Operations Data:Net sales . . . . . . . . . . . . . . . . . . . . . . . . . . . . . . . . . $321,262 $397,986 $441,071 $521,025 $571,547Gross margin . . . . . . . . . . . . . . . . . . . . . . . . . . . . . . 87,011 139,232 141,358 147,111 169,753Operating income (loss) . . . . . . . . . . . . . . . . . . . . . . (35,610) 12,282 (18,512) (25,920) (13,603)Income (loss) from continuing operations before
income taxes and cumulative effect of a change inaccounting principle . . . . . . . . . . . . . . . . . . . . . . . (37,472) 9,126 (25,939) (36,788) (23,856)
Income tax benefit . . . . . . . . . . . . . . . . . . . . . . . . . . (4,377) (3,086) (2,183) (3,205) (9,543)
Income (loss) from continuing operations beforecumulative effect of a change in accountingprinciple . . . . . . . . . . . . . . . . . . . . . . . . . . . . . . . (33,095) 12,212 (23,756) (33,583) (14,313)
Income (loss) from discontinued operations, net oftax . . . . . . . . . . . . . . . . . . . . . . . . . . . . . . . . . . . — — 173 — (42,014)
Cumulative effect of a change in accounting principle,net of tax(2) . . . . . . . . . . . . . . . . . . . . . . . . . . . . . — — — — (24,567)
Net income (loss) . . . . . . . . . . . . . . . . . . . . . . . . . . . $ (33,095) $ 12,212 $ (23,583) $ (33,583) $ (80,894)
Basic income (loss) per share:Income (loss) from continuing operations before
cumulative effect of a change in accountingprinciple . . . . . . . . . . . . . . . . . . . . . . . . . . . . . . . $ (0.85) $ 0.31 $ (0.76) $ (1.64) $ (0.71)
Income (loss) from discontinued operations . . . . . . . . . — — 0.01 — (2.10)Cumulative effect of a change in accounting principle. . — — — — (1.22)
Basic income (loss) per share . . . . . . . . . . . . . . . . . . . $ (0.85) $ 0.31 $ (0.75) $ (1.64) $ (4.03)
Diluted income (loss) per share:Income (loss) from continuing operations before
cumulative effect of a change in accountingprinciple . . . . . . . . . . . . . . . . . . . . . . . . . . . . . . . $ (0.85) $ 0.30 $ (0.76) $ (1.64) $ (0.71)
Income (loss) from discontinued operations . . . . . . . . . — — 0.01 — (2.10)Cumulative effect of a change in accounting principle. . — — — — (1.22)
Diluted income (loss) per share . . . . . . . . . . . . . . . . . $ (0.85) $ 0.30 $ (0.75) $ (1.64) $ (4.03)
Weighted average common shares outstanding:Basic . . . . . . . . . . . . . . . . . . . . . . . . . . . . . . . . . . . 39,154 38,994 31,275 20,528 20,053Diluted . . . . . . . . . . . . . . . . . . . . . . . . . . . . . . . . . . 39,154 40,767 31,275 20,528 20,053Selected Operating Data:Number of permanent stores open at end of period(3) . . 417 422 436 460 618Change in comparable store sales(3)(4) . . . . . . . . . . . . . (17.2)% (2.9)% 0.6% (6.8)% (7.0)%Net sales per square foot for stores open entire
period(3) . . . . . . . . . . . . . . . . . . . . . . . . . . . . . . . . $ 324 $ 381 $ 395 $ 377 $ 380Total selling square footage at end of period(3) (in
thousands) . . . . . . . . . . . . . . . . . . . . . . . . . . . . . . 962 970 1,004 1,052 1,377Peak number of seasonal stores during period . . . . . . . N/A 118 102 229 284
22

February 3,2007
January 28,2006
January 29,2005
January 31,2004
February 1,At year ended
Balance Sheet Data:Working capital . . . . . . . . . . . . . . . . . . . . . $ 75,193 $102,878 $ 86,221 $ 61,847 $107,096
Inventories . . . . . . . . . . . . . . . . . . . . . . . . . 74,897 85,645 86,059 89,298 118,701
Total assets . . . . . . . . . . . . . . . . . . . . . . . . 145,345 179,868 188,580 215,765 259,303
Total debt (short and long-term) . . . . . . . . . 20,000 20,000 25,000 56,189 55,740
Shareholders’ equity . . . . . . . . . . . . . . . . . . 78,501 108,054 95,107 85,354 117,228
(1) The year ended February 3, 2007 is a 53 week year, all other years presented are 52 week years.
(2) Includes a charge to operations, net of tax, of $24.6 million resulting from the cumulative effect of adoptingSFAS No. 142, Goodwill and Other Intangible Assets.
(3) The figures for January 31, 2004 exclude the 111 liquidation stores.
(4) A store is included in the comparable store sales calculation after it has been opened and operated by us formore than 52 weeks. The percentage change is computed by comparing total net sales for comparable storesas thus defined at the end of the applicable reporting period with total net sales from comparable stores for thecomparable period in the prior year.
Item 7. Management’s Discussion and Analysis of Financial Condition and Results of Operations
The following discussion of our financial condition and results of operations should be read in conjunctionwith our selected historical consolidated financial data and consolidated financial statements and notes theretoappearing elsewhere in this Form 10-K.
Executive Overview
We measure performance using such key operating statistics as comparable store sales, sales per square foot,gross margin percentage, and store operating expenses, with a focus on labor, as a percentage of sales. These resultstranslate into store operating contribution and store cash flow, which we use to evaluate overall performance on anindividual store basis. Store operating contribution is calculated by deducting a store’s operating expenses from itsgross margin and is measured as a percentage of sales. Store operating contribution gives us an overall measure as towhether or not individual locations and markets are meeting our financial objectives.
In addition, general and administrative expenses are monitored in absolute amount, as well as on a percentageof net sales basis. We continue to monitor product costing and promotional activity, which allows us to generallymaintain acceptable margin levels. In 2006, our inventory markdowns were higher than in the past as weaggressively liquidated certain merchandise and repositioned our inventory mix pursuant to our strategic initiativeof reengineering our mall stores. Our gross margins are influenced by the mix of merchandise between outerwearand accessories in our total sales.
We also measure and evaluate investments in our retail locations, including inventory and property andequipment. Inventory performance is primarily measured by inventory turns, or the number of times store inventoryturns over in a given period, and amounts of owned inventory at various times based on payment terms from ourvendors. The most significant investments in property and equipment are made at the time we open a store.
As of February 3, 2007, we operated a total of 417 stores located in 45 states, including 287 mall stores, 116outlet stores and 14 airport locations. We have historically supplemented our permanent stores with temporaryseasonal stores during our peak selling season. However, operation of our temporary seasonal stores was suspendedin 2006. In 2005 and 2004, we operated 118 and 102 temporary seasonal stores, respectively. We do not intend tooperate any temporary seasonal stores in the foreseeable future, but may reconsider in the future.
We generate a significant portion of our net sales from October through January, which includes the holidayselling season. We generated 49.2% of our annual net sales in that time period in 2006, and 23.6% in December
23
2003

alone. As part of our strategy to improve operating margins and maximize revenue and profitability during non-peakselling seasons, we have increased the number of outlet locations since 2000, which are less seasonal, and modifiedour product mix to emphasize accessories. In addition, our continued focus on accessory penetration has resulted inaccessory sales growth as a percentage of our total net sales to 41.4% in 2006 from 38.3% in 2005 and 35.6% in2004.
Comparable store sales decreased 17.2% and 2.9% in 2006 and 2005, respectively, and increased 0.6% in2004. A store is included in the comparable store sales calculation after it has been open and operated by us for morethan 52 weeks. The percentage change is computed by comparing total net sales for comparable stores as thusdefined at the end of the applicable reporting period with total net sales from comparable stores for the comparableperiod in the prior year. As a percentage of net sales, continuing operations resulted in a net loss of 10.3% in 2006,net income of 3.1% in 2005, and a net loss of 5.4% in 2004.
The following table contains selected information for each of our store formats for 2006.
SalesComparableStore Sales Average Size
Sales per SellingSquare Foot(1)
(in millions) (in sellingsquare feet)
Mall stores. . . . . . . . . . . . . . . . $173.1 (22.7)% 2,000 $ 296
Outlet stores . . . . . . . . . . . . . . 128.7 (8.9)% 3,250 347
Airport stores . . . . . . . . . . . . . . 10.7 (12.7)% 600 1,289
E-commerce . . . . . . . . . . . . . . 6.7 — — —
Wholesale . . . . . . . . . . . . . . . . 1.5 — — —
Seasonal . . . . . . . . . . . . . . . . . 0.6 — — —
Total . . . . . . . . . . . . . . . . . . . . $321.3
The following table contains selected information for each of our store formats for 2005.
SalesComparableStore Sales Average Size
Sales per SellingSquare Foot(1)
(in millions) (in sellingsquare feet)
Mall stores. . . . . . . . . . . . . . . . $225.8 (2.5)% 2,000 $ 367
Outlet stores . . . . . . . . . . . . . . 134.7 (4.3)% 3,300 378
Airport stores . . . . . . . . . . . . . . 12.9 4.1% 600 1,438
E-commerce . . . . . . . . . . . . . . 6.3 — — —
Seasonal . . . . . . . . . . . . . . . . . 18.3 — — —
Total . . . . . . . . . . . . . . . . . . . . $398.0
The following table contains selected information for each of our store formats for 2004.
SalesComparableStore Sales Average Size
Sales per SellingSquare Foot(1)
(in millions) (in sellingsquare feet)
Mall stores. . . . . . . . . . . . . . . . $246.3 (0.3)% 2,000 $ 388
Outlet stores . . . . . . . . . . . . . . 139.0 2.0% 3,300 378
Airport stores . . . . . . . . . . . . . . 13.6 4.6% 700 1,650
E-commerce . . . . . . . . . . . . . . 4.2 — — —
Seasonal . . . . . . . . . . . . . . . . . 17.2 — — —
Liquidation . . . . . . . . . . . . . . . 20.8 — — —
Total . . . . . . . . . . . . . . . . . . . . $441.1
(1) Sales per square foot is defined as net sales for stores open a full 12 months divided by total selling square feetfor stores open a full 12 months.
24

In 2006, our focus was on creating a new model that would lead to consistent top-line performance whilemaintaining merchandise margins, cash position, the health of our balance sheet, and a rational store count. To thatend we planned to pursue four initiatives:
• reengineering our Wilsons Leather mall stores with greater accessory penetration, migration to a productmix with higher price points, introduction of new signage, product ticketing and store set-ups, giving ourmall stores a fresh and clean look that is easier to shop;
• revitalizing our outlet division with marketing packages differentiated from our mall stores and improvedmerchandising within the outlet stores;
• planning the launch of a new store concept in the future, which was to focus on mid-to-higher-end accessoryofferings with a limited assortment of outerwear; and
• developing a wholesale business to sell proprietary licensed and branded leather products in geographies andproduct categories outside our current markets and product mix.
Throughout 2006, we aggressively pursued our strategic initiative related to the reengineering of our mallstores. This included transitioning our merchandise to a newer, fresher and less outerwear dependent product mixand making a significant investment in new store fixtures. In addition, our product presentation, pricing strategiesand store set-ups were also updated giving our mall stores a fresh and clean look that is much easier to shop. Thesechanges were all made with the goal of transitioning our customer base toward a more value-oriented, fashion-focused customer. The transformation of our mall stores was substantially completed in the third quarter of 2006 inadvance of the holiday selling season.
We also implemented new marketing packages within our outlet division differentiated from our mall stores.Merchandising within the outlet stores improved, including more opportunistic purchases from third-party vendors,as well as our traditional suppliers.
While we planned to develop a new accessory store concept that would focus on mid-to-higher-end fashionaccessory offerings, the significant effort involved in transforming our mall stores has led us to abandon these plansfor the near future.
Our efforts in the wholesale channel should enable us to grow our wholesale business to sell proprietarylicensed and branded leather products in geographies and product categories outside our current markets andproduct mix. We plan to continue our efforts to grow our wholesale business in 2007.
These initiatives were part of a multi-year, multi-format strategy intended to move Wilsons Leather into astronger position as a company and a more relevant brand for the future. From the outset, we believed the impact ofour efforts related to these strategies would not be realized until after 2006. As we anticipated, the changes to thephysical layout of our mall stores, our new product mix and new merchandise strategies have taken time to resonatewith our new target customer. The future success of these initiatives is dependent upon our ability to transition ourtarget customer base and increase acceptance of the Wilsons Leather brand.
We believed that the 2006 holiday selling season would provide confirmation that these strategies, particularlythe transformation of our mall stores, were gaining traction with our new target customer. However, we experienceda significant decrease in holiday selling season traffic and the resulting 21.6% decrease in our fourth quartercomparable store sales was evidence that the migration to our new target customer will take additional time and ourstrategic course will need to be refined to improve top-line performance.
In 2007, we plan to build on the “reinvented” Wilsons Leather we worked to create in 2006 and increaserecognition and acceptance of the Wilsons Leather brand. We will continue to appeal to a more contemporary andupscale target customer. We do not intend to revert to the promotional “price only” environment of crowded storesand unattractive presentations that was our past. We will continue to increase our accessories profile by offering newcollections of high quality, high fashion handbags. In addition, we will increase the number of designer labels we
25
carry in our outerwear offerings to help generate additional traffic into our stores and add credibility to the WilsonsLeather brand.
We intend the discussion of our financial condition and results of operations that follows to provideinformation that will assist in understanding our consolidated financial statements, the changes in certain keyitems in those consolidated financial statements from year to year and the primary factors that accounted for thosechanges, as well as how certain accounting principles, policies and estimates affect our consolidated financialstatements.
Critical Accounting Policies
Our significant accounting policies are described in Note 1, “Summary of significant accounting policies,”contained in our consolidated financial statements beginning on page F-7 of this report. We believe that the followingdiscussion addresses our critical accounting policies, which are those that are most important to the portrayal of ourfinancial condition and results of operations and require management’s most difficult, subjective and complexjudgments, often as a result of the need to make estimates about the effect of matters that are inherently uncertain.
Inventories
We value our inventories, which consist primarily of finished goods held for sale purchased from domestic andforeign vendors, at the lower of cost or market value, determined by the retail inventory method using the last-in,first-out (“LIFO”) basis. As of February 3, 2007 and January 28, 2006, the LIFO cost of inventories approximatedthe first-in, first-out cost of inventories. The inventory cost includes the cost of merchandise, freight, duty, sourcingoverhead, and other merchandise-specific charges. A periodic review of inventory quantities on hand is performedto determine if inventory is properly stated at the lower of cost or market. Management evaluates several factorsrelated to valuing inventories at the lower of cost or market such as anticipated consumer demand, fashion trends,expected permanent retail markdowns, the aging of inventories, and class or type of inventories. A provision isrecorded to reduce the cost of inventories to the estimated net realizable values, if required.
Permanent markdowns designated for clearance activity are recorded at the point of decision, when utility ofinventory has diminished, versus the point of sale. Factors considered in the determination of permanent mark-downs include current and anticipated demand, customer preferences, age of the merchandise, and style trends. Thecorresponding reduction to gross margin is also recorded in the period that the decision is made.
Shrinkage is estimated as a percentage of sales for the period from the last inventory date to the end of the fiscalyear. Physical inventories are taken at least biannually for all stores and distribution centers and inventory recordsare adjusted accordingly. The shrink rate for the most recent physical inventory, in combination with current eventsand historical experience, is used as the accrual rate to record shrink for the next inventory cycle.
Any significant unanticipated changes in the factors noted above could have a significant impact on the valueof our inventories and our reported operating results.
Property and Equipment Impairment
Our property and equipment consists principally of store leasehold improvements and store fixtures and areincluded in the “Property and equipment” line item in our consolidated balance sheets in our consolidated financialstatements. These long-lived assets are recorded at cost and are amortized using the straight-line method over thelesser of the applicable store lease term or the estimated useful life of the leasehold improvements. The typicalinitial lease term for our stores is 10 years. Computer hardware and software and distribution center equipment areamortized over three to five years and 10 years, respectively. We review long-lived assets for impairment wheneverevents, such as decisions to close a store or changes in circumstances, indicate that the carrying value of an assetmay not be recoverable. In the fourth quarter of 2006, we determined, based on our most recent sales projections forvarious markets in which we have stores, that the current estimate of the future undiscounted cash flows in certain ofthese markets would not be sufficient to recover the carrying value of those markets’ mall store fixed assets.Accordingly, we recorded an impairment loss of $0.7 million in the fourth quarter of 2006 related to those mallstores’ assets. Such assets were written down to fair value less the expected disposal value, if any, of such furniture,fixtures and equipment. We determined that these assets had no fair value, as the majority of such assets relate to
26

leasehold improvements and other store-specific fixtures and equipment. This impairment charge was recorded as acomponent of selling, general and administrative expenses. During 2005 and 2004, our impairment testing did notindicate any impairment and no such charge was recorded in either year.
Results of Operations
Overview
In evaluating our financial performance and operating trends, management considers information concerning ouroperating income (loss), net income (loss), basic and diluted income (loss) per share and certain other information beforeliquidation and restructuring costs that are not calculated in accordance with U.S. generally accepted accountingprinciples (“GAAP”). See Note 2, “Reorganization and partial store liquidation,” to our consolidated financial statementsbeginning on page F-14 of this report. A reconciliation of these non-GAAP financial measures to GAAP numbers for theyear-to-date period ended January 29, 2005 is included in the table below. We believe that the non-GAAP numberscalculated before liquidation and restructuring costs recorded in 2004 provide a useful analysis of our ongoing operatingtrends and are useful in comparing operating performance period to period. We evaluated these non-GAAP numberscalculated before liquidation and restructuring costs on a quarterly basis in order to measure and understand our ongoingoperating trends. Our management incentive bonuses for 2004 were based on an earnings before tax measure calculatedbefore liquidation and restructuring costs.
27

WILSONS THE LEATHER EXPERTS INC. AND SUBSIDIARIES
Reconciliation of GAAP Consolidated Statement of Operations toAdjusted Statement of Operations for the year ended January 29, 2005
(In thousands, except per share amounts)(Unaudited)
For the yearended January 29,2005—as reported
Liquidation,Restructuring
and OtherCharges(1)
For the yearended January 29,
2005—Adjusted
NET SALES . . . . . . . . . . . . . . . . . . . . . . . . . . . . . . . . . . . . . . $441,071 $ 20,778 $420,293
COST OF GOODS SOLD, BUYING AND OCCUPANCY COSTS. . 299,713 16,944 282,769
Gross margin . . . . . . . . . . . . . . . . . . . . . . . . . . . . . . . . . . . . 141,358 3,834 137,524
SELLING, GENERAL AND ADMINISTRATIVE EXPENSES . . . 129,240 17,442 111,798
DEPRECIATION AND AMORTIZATION. . . . . . . . . . . . . . . . . . 30,630 13,780 16,850
Operating income (loss) . . . . . . . . . . . . . . . . . . . . . . . . . . . . . (18,512) (27,388) 8,876
INTEREST EXPENSE, net . . . . . . . . . . . . . . . . . . . . . . . . . . . . 7,427 — 7,427
Income (loss) from continuing operations before income taxes . . (25,939) (27,388) 1,449
INCOME TAX BENEFIT . . . . . . . . . . . . . . . . . . . . . . . . . . . . . (2,183) — (2,183)
Income (loss) from continuing operations . . . . . . . . . . . . . . . . . (23,756) (27,388) 3,632
INCOME FROM DISCONTINUED OPERATIONS, net of tax . . . 173 — 173
Net income (loss) . . . . . . . . . . . . . . . . . . . . . . . . . . . . . . . $ (23,583) $(27,388) $ 3,805
BASIC INCOME (LOSS) PER SHARE:
Income (loss) from continuing operations . . . . . . . . . . . . . . . . . $ (0.76) $ (0.87) $ 0.11
Income (loss) from discontinued operations . . . . . . . . . . . . . . . 0.01 — 0.01
Basic income (loss) per share . . . . . . . . . . . . . . . . . . . . . . . $ (0.75) $ (0.87) $ 0.12
Basic weighted average shares outstanding . . . . . . . . . . . . . . 31,275 — 31,275
DILUTED INCOME (LOSS) PER SHARE:
Income (loss) from continuing operations . . . . . . . . . . . . . . . . . $ (0.76) $ (0.85) $ 0.11
Income (loss) from discontinued operations . . . . . . . . . . . . . . . 0.01 — 0.01
Diluted income (loss) per share . . . . . . . . . . . . . . . . . . . . . . $ (0.75) $ (0.85) $ 0.12
Diluted weighted average shares outstanding . . . . . . . . . . . . . 31,275 — 32,057
(1) Includes $27.4 million related to the transfer of inventory to an independent liquidator in conjunction withthe closing of approximately 111 stores, accelerated depreciation, fixed asset write-offs, lease terminationcosts related to store closings, severance, and other restructuring charges.
28

The following table contains selected information from our historical consolidated statements of operations,expressed as a percentage of net sales:
February 3,2007
January 28,2006
January 29,2005
As reportedFor the years ended
NET SALES . . . . . . . . . . . . . . . . . . . . . . . . . . . . . . . . . . . . . . . . . . . 100.0% 100.0% 100.0%COST OF GOODS SOLD, BUYING AND OCCUPANCY COSTS . . . 72.9 65.0 68.0
Gross margin. . . . . . . . . . . . . . . . . . . . . . . . . . . . . . . . . . . . . . . . . . 27.1 35.0 32.0
SELLING, GENERAL AND ADMINISTRATIVE EXPENSES . . . . . . 34.3 28.4 29.3
DEPRECIATION AND AMORTIZATION. . . . . . . . . . . . . . . . . . . . . . 3.9 3.5 6.9
Operating income (loss) . . . . . . . . . . . . . . . . . . . . . . . . . . . . . . . . . . (11.1) 3.1 (4.2)
INTEREST EXPENSE, net . . . . . . . . . . . . . . . . . . . . . . . . . . . . . . . . . 0.6 0.8 1.7
INCOME TAX BENEFIT . . . . . . . . . . . . . . . . . . . . . . . . . . . . . . . . . . (1.4) (0.8) (0.5)
Income (loss) from continuing operations . . . . . . . . . . . . . . . . . . . . . (10.3) 3.1 (5.4)
INCOME FROM DISCONTINUED OPERATIONS, net of tax. . . . . . . — — —
Net income (loss) . . . . . . . . . . . . . . . . . . . . . . . . . . . . . . . . . . . . (10.3)% 3.1% (5.3)%
The following table contains selected information from our historical consolidated statements of operations,expressed as a percentage of net sales for 2004 “as adjusted” to exclude the liquidation and restructuring costs:
January 29,2005
As adjustedFor the year ended
NET SALES . . . . . . . . . . . . . . . . . . . . . . . . . . . . . . . . . . . . . . . . . . . . . . . . . . . . . . . . . . . 100.0%
COST OF GOODS SOLD, BUYING AND OCCUPANCY COSTS . . . . . . . . . . . . . . . . . . . 67.3
Gross margin . . . . . . . . . . . . . . . . . . . . . . . . . . . . . . . . . . . . . . . . . . . . . . . . . . . . . . . . . 32.7
SELLING, GENERAL AND ADMINISTRATIVE EXPENSES . . . . . . . . . . . . . . . . . . . . . . 26.6
DEPRECIATION AND AMORTIZATION . . . . . . . . . . . . . . . . . . . . . . . . . . . . . . . . . . . . . 4.0
Operating income . . . . . . . . . . . . . . . . . . . . . . . . . . . . . . . . . . . . . . . . . . . . . . . . . . . . . . 2.1
INTEREST EXPENSE, net . . . . . . . . . . . . . . . . . . . . . . . . . . . . . . . . . . . . . . . . . . . . . . . . . 1.8
INCOME TAX BENEFIT . . . . . . . . . . . . . . . . . . . . . . . . . . . . . . . . . . . . . . . . . . . . . . . . . . (0.5)
Income from continuing operations . . . . . . . . . . . . . . . . . . . . . . . . . . . . . . . . . . . . . . . . . 0.9
INCOME FROM DISCONTINUED OPERATIONS, net of tax . . . . . . . . . . . . . . . . . . . . . . —
Net income . . . . . . . . . . . . . . . . . . . . . . . . . . . . . . . . . . . . . . . . . . . . . . . . . . . . . . . . . 0.9%
2006 Compared to 2005
Net Sales. 2006 net sales of $321.3 million decreased 19.3% from $398.0 million in 2005. This decrease innet sales was primarily the result of a decrease in 2006 comparable store sales of 17.2% compared to a 2.9%decrease in 2005. The decrease in comparable store sales was experienced in all merchandise lines, with men’sdown 19.8%, women’s down 21.8% and accessories down 11.9%. Mall and outlet channels were down 22.7% and8.9%, respectively.
Temporary seasonal stores contributed $18.3 million in net sales in 2005 compared to $0.6 million in 2006,which amount in 2006 was generated in the first month of the year. We have historically supplemented ourpermanent stores with temporary seasonal stores during our peak selling season from October to January. However,operation of our temporary seasonal stores was suspended in 2006. In 2005, we operated 118 temporary seasonal
29

stores. We do not intend to operate any temporary seasonal stores in the foreseeable future, but may reconsider ifcircumstances warrant.
We also had a 1.7% reduction in the average store count year-over-year. We opened nine stores and closed 14stores during 2006 compared to opening seven stores and closing 21 stores in 2005. As of February 3, 2007, weoperated 417 stores compared to 422 as of January 28, 2006. Our selling square footage in 2006 was relatively flatcompared to 2005 at 962,100 and 969,900, respectively.
Lastly, unseasonably warm weather was again experienced throughout the 2006 holiday selling season and, asin 2005, had a considerable negative impact on our outerwear sales.
Throughout 2006, we aggressively pursued our strategic initiative related to the reengineering of our mallstores. This included transitioning our merchandise to a newer, fresher and less outerwear dependent product mix.During the first half of 2006 and into the third quarter, receipts of new merchandise were limited to focus onrepositioning our inventory and eliminating non-go-forward and overstocked inventory including styles carriedover from prior years. This repositioning of our inventory contributed to the decline in comparable net sales during2006.
The significant transition we have undertaken in our Wilsons Leather mall stores during 2006 leading up to andinto the fourth quarter has also had a negative impact on our comparable store sales. Our mall stores now have a verydifferent look and feel, are less crowded and more shoppable. Entering the holiday selling season, each mall storehad been refitted with new window fixtures, custom wall graphics, display tables, boutique wall presentations, andnew interior signage. Product presentation and pricing strategies were also updated, all with the goal of transitioningour customer base toward a more value-oriented, fashion-focused customer and away from the price-drivenpromotional customer we have historically sold to. The transformation of our mall stores was substantiallycompleted in the third quarter. We anticipated that these changes to the physical layout of our mall stores, our newproduct mix and new merchandise strategies would take time to resonate with our new target customer and was partof a multi-year, multi-format strategy. However, we experienced a significant decrease in holiday selling seasontraffic and the resulting 21.6% decrease in fourth quarter comparable store sales was evidence that the migration toour new target customer will take additional time and our strategic course will need to be refined to improve top-lineperformance.
Cost of Goods Sold, Buying and Occupancy Costs. Cost of goods sold, buying and occupancy costsdecreased $24.5 million or 9.5% to $234.3 million in 2006 from $258.8 million in 2005. This decrease was drivenby: (1) a $30.8 million decrease in product costs due to the significantly lower sales volume experienced in 2006 and(2) a $0.7 million decrease in buying and occupancy costs relating to our decreased receipts during the year and thereduction in average store count year-over-year. These decreases were somewhat offset by: (1) a $6.6 millionincrease in temporary and permanent markdowns and (2) a $0.4 million increase in delivery and other costs of salesyear-over-year.
Early in 2006, we took extensive temporary and permanent markdowns to liquidate and reposition ourinventory pursuant to our strategic initiative relating to the reengineering of our mall stores’ product mix. As ourproduct mix strategy evolved during the year, we continued to take aggressive actions to reduce our outerwearinventory as well as accelerating markdowns on certain handbag and accessory inventory in preparation for the fallimplementation of the new look and feel of our mall stores. Additional markdowns were taken in the fourth quarteras a result of our lower than planned holiday sales volume and as a result of our “Gift Leather” holiday gift cardpromotion.
Gross margin dollars decreased $52.2 million, or 37.5%, to $87.0 million in 2006 compared to $139.2 millionin 2005 primarily related to the lower sales volume in 2006 compared to 2005. In addition, temporary seasonalstores contributed $7.4 million in gross margin in 2005 compared to $0.2 million in the first month of 2006.
Gross margin as a percentage of net sales decreased by 790 basis points to 27.1% in 2006 compared to 35.0% in2005 primarily due to: (1) the de-leveraging resulting from our comparable store sales, which resulted in a 420 basispoint increase in buying and occupancy costs as a percentage of net sales, (2) a 330 basis point decrease inmerchandise margins resulting from a 170 basis point increase in initial markups offset by a 500 basis point increase
30
in markdowns as a percentage of net sales due to the aggressive 2006 markdowns discussed above and (3) a 40 basispoint increase in delivery and other costs of goods sold as a percentage of net sales.
Selling, General and Administrative Expenses. Selling, general and administrative (“SG&A”) expensesdecreased $2.7 million or 2.4% to $110.2 million in 2006 from $112.9 million in 2005. As a percentage of net sales,2006 SG&A expenses increased to 34.3% from 28.4% in the similar period last year. The increase in percentage rateis the result of our lower sales volume, which more than offset the decrease in SG&A spending.
The $2.7 million decrease in 2006 SG&A spending was primarily due to a net $7.7 million decrease in storerelated expenses resulting from our lower sales volume and reduced store count as we operated on average sevenfewer stores in 2006 compared to the similar period last year. This decrease included: (1) $3.9 million in reducedpayroll costs, as our overall payroll hours were lower year-over-year consistent with our decreased sales levels,(2) $1.4 million decreased shrink expense, (3) $1.5 million decreased credit card fees due to lower transactionvolume and a refund of prior fees received as part of the VISA/MasterCard antitrust litigation settlement, and(4) $1.7 million in net lower administrative costs, all of which were somewhat offset by $0.8 million in lowerlayaway and other service fees. Layaway purchases were discontinued in December 2006 and for the foreseeablefuture. Suspending operation of our temporary seasonal stores in 2006 accounted for $4.5 million of the decrease instore related expenditures.
The decrease in store related spending was mostly offset by: (1) a $2.3 million charge related to stock-basedcompensation costs recorded in 2006 with the adoption of Statement of Financial Accounting Standards (“SFAS”)No. 123 (Revised 2004), Share-Based Payment (“SFAS No. 123R”), with no corresponding amount in the similarperiod last year, (2) $0.7 million of spending related to the start-up of our wholesale operations, (3) a $0.7 millionasset impairment loss related to certain mall stores, (4) a $0.5 million increase in promotional spending related tothe rollout of our reengineered mall stores (primarily print ad buys for the holiday selling season), and (5) a$0.8 million net increase in other administrative costs including increased spending on medical/dental insuranceclaims and workers compensation expenditures as well as the estimated settlement of certain infringement claimssomewhat offset by lower payroll costs. Administrative costs related to operation of our temporary seasonal storeswere $1.4 million lower in 2006 as compared to 2005.
Depreciation and Amortization. 2006 depreciation and amortization decreased $1.6 million to $12.5 millioncompared to $14.1 million in 2005. The decrease was primarily the result of: (1) $0.9 million net expense related toassets fully depreciated in the prior year, primarily store cash register hardware and software, (2) a decrease of$0.5 million in accelerated depreciation related to known store closings in 2006 compared to last year and (3) adecrease in store depreciation due to a 1.7% decrease in the year-to-date average store count. As a percentage of netsales, depreciation and amortization increased to 3.9% from 3.5% last year.
Operating Income (Loss). As a result of the above, 2006 operating income (loss) decreased $47.9 million toan operating loss of $35.6 million compared to operating income of $12.3 million in 2005. This decline in operatingperformance was due to: (1) a $52.2 million decrease in gross margin somewhat offset by, (2) a $2.7 milliondecrease in SG&A spending in the current year compared to last year and (3) a $1.6 million decrease in depreciationand amortization. The decreased operating performance in 2006 is reflective of the significant efforts we haveundertaken to transition Wilsons Leather pursuant to our strategic initiatives, which have had a negative impact onour results.
Interest Expense. Net interest expense of $1.9 million in 2006 decreased $1.3 million compared to$3.2 million in 2005. The net decrease was due to a $0.6 million decrease in interest expense in the current yearcompared to 2005, as we had lower average borrowings in 2006 compared to 2005. In addition, interest incomeincreased $0.8 million year-over-year, as our average cash balances during 2006 were higher than 2005. Theseamounts were slightly offset by $0.1 million in debt issuance costs written off in the fourth quarter of 2006 relatingto our amended credit facility.
Income Tax Benefit. In 2006, we recorded a net income tax benefit of approximately $4.4 million comparedto a net benefit of $3.1 million recorded in 2005. The net benefit recorded in the current year related primarily to thereduction of the income tax provision we recorded in the fourth quarter of 2005 and the release of certain stateincome tax contingency reserves. Due to our July tax year end, we recorded a provision in the fourth quarter of 2005
31

for income taxes due based on taxable income through the first half of the tax year. As a result of the net lossincurred in the first six months of 2006, the taxable income and related income taxes due as of the end of 2005 werereduced. Subsequent to our July 2006 tax year end, we elected to conform our tax year end to our fiscal year end asof February 3, 2007. Therefore, fluctuations created by different book and tax year ends will be eliminated goingforward. See Note 9, “Income taxes” contained in our consolidated financial statements.
Net Income (Loss). Our net loss for 2006 was $33.1 million compared to net income of $12.2 million in2005, or a loss of $0.85 per basic and diluted common share in 2006 compared to income in 2005 of $0.31 and$0.30 per basic and diluted common share, respectively. The $45.3 million decline in our 2006 net income wasprimarily the result of our decreased net sales and lower gross margins, which were slightly offset by decreasedSG&A spending, decreased depreciation and decreased net interest expense (all discussed above).
2005 Compared to 2004
Net Sales. Net sales decreased 9.8% to $398.0 million in 2005 from $441.1 million in 2004. Included in the2004 net sales were approximately $20.8 million in sales recorded in the first quarter of 2004 resulting from theliquidation of 111 stores. See Note 2, “Reorganization and partial store liquidation” to our consolidated financialstatements. Excluding these liquidation sales, 2005 net sales of $398.0 million decreased 5.3% from $420.3 millionin 2004. This decrease is the result of our operating on average 24 fewer stores in 2005 compared to 2004 as well as a2.9% decrease in comparable store sales for 2005 compared to a 0.6% increase in 2004.
The decrease in comparable store sales for 2005 was primarily the result of: (1) the unseasonably warmweather experienced over most of the country during the fall season, which had a considerable negative impact onour outerwear sales and (2) lower than anticipated volume during the holiday selling season as we faced increasedcompetition from department and chain stores that have significantly expanded into the leather outerwear category.
We opened seven stores and closed 21 stores during 2005 compared to opening five stores and closing 29 storesin 2004 (excluding the 111 liquidation stores). As of January 28, 2006, we operated 422 stores compared to 436 as ofJanuary 29, 2005. Our selling square footage in 2005 decreased 3.4% to 969,900 from 1,004,000 in 2004. Inaddition, we operated 118 temporary seasonal stores during the 2005 holiday selling season as compared to 102temporary seasonal stores during 2004. As mentioned above, we suspended operation of our temporary seasonalstores in 2006 and for the foreseeable future, but may reconsider if circumstances warrant.
Cost of Goods Sold, Buying and Occupancy Costs. Cost of goods sold, buying and occupancy costsdecreased $41.0 million or 13.7% to $258.8 million in 2005 from $299.7 million in 2004. This decrease waspartially due to the lower sales volume due to the $20.8 million of liquidation sales in 2004. When adjusted toremove the effects of the liquidation and restructuring charges, cost of goods sold, buying and occupancy costsdecreased $24.0 million, or 8.5%, from $282.8 million. This decrease is the result of: (1) a $17.6 million decrease inproduct costs due to the lower sales volume discussed above, (2) a $4.4 million decrease in markdowns, (3) a$1.2 million decrease in delivery costs, and (4) a $0.8 million decrease in buying and occupancy costs, which isreflective of a 5.3% decrease in average store count year-over-year. Gross margin dollars decreased $2.1 million, or1.5%, to $139.2 million in 2005 compared to $141.4 million in 2004 primarily related to the lower sales volume in2005 compared to 2004, somewhat offset by improved merchandise margins discussed below.
Gross margin as a percentage of net sales increased by 300 basis points to 35.0% in 2005 compared to 32.0% in2004 primarily due to improved merchandise margins resulting from a 600 basis point improvement in initial mark-on and a $1.7 million decrease in markdowns offsetting a $2.3 million increase in buying and occupancy costs. Theincrease in buying and occupancy costs relates primarily to the reversal in 2004 of $3.6 million of deferred rentliabilities related to the closed liquidation stores.
Excluding the effects of the liquidation and restructuring charges, gross margin increased $1.7 million, or1.2%, from $137.5 million in 2004 and as a percentage of net sales was 230 basis points higher than the 32.7% in2004. This improvement was the result of a 250 basis point improvement in initial mark-on, lower markdowns anddelivery costs as a percentage of net sales and a $0.8 million decrease in buying and occupancy costs.
Selling, General and Administrative Expenses. SG&A expenses in 2005 of $112.9 million decreased$16.4 million, or 12.7%, from $129.2 million in 2004. As a percentage of net sales, 2005 SG&A expenses decreased
32

to 28.4% compared to 29.3% last year. The $16.4 million decrease was primarily due to: (1) $17.4 million ofliquidation and restructuring charges incurred in 2004, primarily related to lease termination costs, asset write-offsrelated to store closings, severance, and other restructuring charges, (2) a $1.9 million decrease in general andadministrative costs due to a $1.5 million decrease in bonuses accrued in 2005 compared to 2004 and approximately$0.4 million reduced spending on medical insurance claims and workers compensation expenditures due to a lowerstore count and (3) a decrease in other store expenses of $0.4 million also due to lower sales volume and reducedstore count. These decreases were somewhat offset by: (1) a $1.0 million increase in e-commerce fulfillmentexpenses due to higher on-line sales volume, (2) a $1.5 million increase in selling and field sales managementexpenses primarily related to higher payroll rates, more store hours and floor sets and (3) $0.8 million in reducedlayaway service fees, as we discontinued layaways in the months of December and January.
SG&A expenses as a percentage of net sales, excluding the liquidation and restructuring charges (whichtotaled $17.4 million, or 83.9% of the year-to-date liquidation sales of $20.8 million), increased to 28.4% for 2005compared to 26.6% for 2004. The increase in rate as a percentage of net sales reflects our net $1.1 million increase inspending and the lower sales volume.
Depreciation and Amortization. Depreciation and amortization decreased $16.6 million to $14.1 million in2005 compared to $30.6 million in 2004, and as a percentage of net sales to 3.5% from 6.9%. The decrease wasprimarily the result of the $13.8 million in accelerated depreciation recorded in 2004 related to the liquidation storesand a $2.8 million decrease in store and administrative depreciation due to the 5.3% decrease in average store countyear-over-year. Excluding the effects of the liquidation and restructuring, depreciation and amortization decreased$2.8 million to $14.1 million from $16.8 million a year ago, or as a percentage of net sales, to 3.5% from 4.0%.
Operating Income (Loss). As a result of the above, operating income for 2005 increased $30.8 million to$12.3 million compared to an operating loss of $18.5 million in 2004. This improvement was primarily due to:(1) net liquidation and restructuring charges of $27.4 million in 2004, (2) $1.7 million in improved gross margindollars as compared to 2004 and (3) $2.8 million in decreased depreciation and amortization expenditures in 2005.These improvements were somewhat offset by an additional $1.1 million in SG&A spending year-over-year.Excluding the effects of the liquidation and restructuring charges, 2005 operating income of $12.3 million increased$3.4 million compared to $8.9 million in 2004.
Interest Expense. Net interest expense of $3.2 million in 2005 decreased $4.3 million compared to$7.4 million in 2004, due to the repurchase and repayment of our 111⁄4% Senior Notes in the second and thirdquarters of 2004, respectively, the prepayment of $5.0 million of the Term B promissory note in March 2005, lowerrevolver borrowings in the third and fourth quarters of 2005 as compared to the similar periods of 2004 and a$0.6 million increase in interest income in 2005 as compared to 2004. In addition, during the first quarter of 2004 wewrote off $0.5 million of debt issuance costs related to the amended senior credit facility. The liquidation andrestructuring did not impact interest expense.
Income Tax Benefit. For 2005, we recorded a net income tax benefit of approximately $3.1 millioncompared to a net benefit of $2.2 million in 2004. The 2005 net benefit was comprised of: (1) a $5.6 million benefitas a result of both a reduced tax basis of our LIFO inventory reserve and a tax planning strategy that allowed us tomaintain a valuation allowance on the net deferred tax assets inclusive of the LIFO reserve, (2) a $1.7 million benefitrelated to the resolution of certain income tax contingencies previously accrued as a result of an Internal RevenueService review of amended returns completed in our second quarter and (3) a $4.2 million provision for incometaxes due. See Note 9, “Income taxes” contained in our consolidated financial statements.
Income from Discontinued Operations. We reported no income from discontinued operations in 2005compared to $0.2 million net of tax in 2004.
Net Income (Loss). Net income for 2005 improved $35.8 million to $12.2 million compared to a net loss of$23.6 million in 2004. The improvement in net income was primarily due to the $27.4 million net loss relating to the2004 liquidation and restructuring as well as our improved gross margins and decreased depreciation and interestexpense somewhat offset by increased SG&A expenses (all discussed above). Excluding the effects of theliquidation and restructuring, net income of $12.2 million increased $8.4 million compared to $3.8 million in 2004.
33

Liquidity and Capital Resources
Our capital requirements are primarily driven by our seasonal working capital needs, investments in newstores, remodeling existing stores, enhancing information systems, and increasing capacity and efficiency for ourdistribution center. In addition, implementation of our key initiatives relating to our new multi-format model,increasing recognition and acceptance of the Wilsons Leather brand and continuing to develop our wholesalebusiness require significant resources including capital dollars. Our peak working capital needs typically occurduring the period from August through early December as inventory levels are increased in advance of our peakselling season from October through January.
Our future capital requirements depend on the sustained demand for our leather products. Many factors affectthe level of consumer spending on our products, including, among others, general economic conditions, includingrising energy prices, customer shopping patterns, interest rates, the availability of consumer credit, weather, theoutbreak of war, acts of terrorism or the threat of either, other significant national and international events, taxation,and consumer confidence in future economic conditions. Consumer purchases of discretionary items such as ourleather products tend to decline during periods when disposable income is lower. The uncertain outlook in theUnited States’ economy has shifted consumer spending habits toward large discount retailers, which has decreasedmall traffic, resulting in lower net sales on a quarterly and annual basis.
Our ability to meet our debt service obligations depends upon our future performance, which will be subject togeneral economic conditions and financial, business and other factors affecting our operations, or our ability to raiseadditional capital, which may not be available on terms that are favorable to us, or at all. If we are unable to generatesufficient cash flow from operations or financing activities in the future to service our debt, we may be required toobtain additional debt or equity financing. There can be no assurance that any such additional financing would bepossible or could be obtained on terms that are favorable to us, or at all.
General Electric Capital Corporation and a syndicate of banks have provided us with a senior credit facility, asamended, that provides for borrowings of up to $135.0 million in aggregate principal amount, including a$20.0 million Term B promissory note and a $75.0 million letter of credit subfacility. The maximum amountavailable under the revolving credit portion of our senior credit facility is limited to:
• 90% of the then applicable discount rate applied in appraising eligible retail inventories to reflect their valueas if sold in an orderly liquidation, plus the lesser of 10% of various components of the borrowing base or thethen outstanding principal balance of the Term B promissory note, except that such amount is reduced by theamount of certain in-transit inventory to the extent such inventory reflects a disproportionate amount of ourtotal inventory;
• plus the lesser of $10.0 million or 50% of the difference between the book value of eligible wholesaleinventory and the book value of eligible wholesale inventory in-transit in excess of $5.0 million;
• plus 90% of the discount rate applied in appraising retail inventories to reflect their value as if sold in anorderly liquidation, times the future retail inventory subject to trade letters of credit;
• plus 50% of the book value of our future wholesale inventories related to trade letters of credit;
• plus 90% of credit card receivables;
• plus the lesser of $10.0 million or 90% of eligible wholesale accounts receivable; and
• minus a reserve equal to the outstanding principal amount of the Term B promissory note ($20.0 million as ofFebruary 3, 2007) and a separate reserve equal to 10% of the lesser of $115.0 million and the maximumamount calculated under the formula described above.
As of February 3, 2007, we had no borrowings under the revolving portion of the senior credit facility and theTerm B promissory note had a balance of $20.0 million and we had $3.8 million in outstanding letters of credit.
Interest is currently payable on revolving credit borrowings at variable rates determined by the applicableLIBOR plus 1.25% to 1.75%, or the prime rate plus 0.0% to 0.5% (commercial paper rate plus 1.25% to 1.75% if theloan is made under the “swing line” portion of the revolver). Interest is currently payable on the Term B promissorynote at a variable rate equal to the LIBOR plus 4.0%. The applicable margins will be adjusted quarterly on aprospective basis as determined by the previous quarters’ ratio of borrowings to borrowing availability.
34
We pay monthly fees of 0.25% per annum on the unused portion of the senior credit facility, as defined, and perannum fees on the average daily amount of letters of credit outstanding during each month ranging from .625% to.875% in the case of trade letters of credit and from 1.25% to 1.75% in the case of standby letters of credit. Such feesare subject to quarterly adjustment in the same manner as our interest rate margins. The senior credit facilityexpiration is June 30, 2010, at which time all borrowings, including the Term B promissory note, become due andpayable. Prepayment of the Term B promissory note is payable only with the consent of the senior lenders. Any suchprepayment would be subject to a 1.0% prepayment fee if prepayment is made on or prior to June 30, 2008 and a0.5% prepayment fee if prepayment is made after June 30, 2008 but on or prior to June 30, 2009. After June 30,2009, any remaining balance of the Term B promissory note is prepayable without penalty. The revolving creditportion of the senior credit facility is subject to a 1.0% prepayment fee under most circumstances.
The senior credit facility contains certain restrictions and covenants, which, among other things, restrict ourability to acquire or merge with another entity; make investments, loans or guarantees; incur additional indebt-edness; create liens or other encumbrances; or pay cash dividends or make other distributions. At February 3, 2007,we were in compliance with all covenants related to the senior credit facility.
We plan to use the senior credit facility for our immediate and future working capital needs. We are dependenton the senior credit facility to fund working capital and letter of credit needs. Based on our current 2007 plan, webelieve that the borrowing capacity under our senior credit facility, together with cash on hand, current andanticipated cash flow from operations, and cost reductions associated with our lower store count will be adequate tomeet our working capital and capital expenditure requirements through the first half of 2008. However, if ourcomparable store sales do not increase as planned in the second half of 2007, we expect that we may need additionalfinancing in 2008 in order to fund our working capital and capital expenditure requirements. Even if ourperformance during 2007 is on track with plan, we may also seek to obtain additional financing during 2007for 2008 working capital needs as well as the ability to accelerate implementation of our merchandise and brandacceptance strategies. We are currently exploring various financing strategies. There can be no assurance thatadditional financing would be possible or could be obtained on terms that are favorable to us, or at all. If we are notable to obtain such access to capital, we may not be able to implement our key initiatives to grow our business. If weraise capital through the issuance of equity securities, the holdings of existing shareholders may be diluted.
On January 22, 2004, we announced a reorganization and partial store liquidation as described in Note 2,“Reorganization and partial store liquidation” contained in our consolidated financial statements.
On April 25, 2004, we entered into an agreement to issue 17,948,718 shares of our common stock to threeinstitutional investors at a price of $1.95 per share. The equity financing closed on July 2, 2004, with gross proceedsof $35.0 million before offering costs. As additional consideration for the investors’ commitment, on April 25,2004, we issued two million warrants exercisable for five years to the investors upon signing the equity financingagreement, and at closing issued an additional two million warrants exercisable for five years, all at an exercise priceof $3.00 per share of common stock. The proceeds of the offering were used to repurchase and repay our 111⁄4%Senior Notes. The remaining balance of these funds was used for general working capital purposes. See Note 10,“Capital Stock” contained in our consolidated financial statements.
35

Cash Flow Analysis
The following table summarizes our cash flow activity for fiscal 2006, 2005 and 2004:
February 3,2007
January 28,2006
(Revised)
January 29,2005
(Revised)
For the years ended
(in thousands)
Net cash (used in) provided by operating activities of continuingoperations . . . . . . . . . . . . . . . . . . . . . . . . . . . . . . . . . . . . . . . . . . . . $(14,550) $10,958 $11,046
Net cash used in investing activities of continuing operations . . . . . . . . (11,033) (9,986) (4,552)
Net cash (used in) provided by financing activities of continuingoperations . . . . . . . . . . . . . . . . . . . . . . . . . . . . . . . . . . . . . . . . . . . . (60) (4,241) 157
Net cash used in discontinued operations . . . . . . . . . . . . . . . . . . . . . . . — — (233)
NET (DECREASE) INCREASE IN CASH AND CASHEQUIVALENTS . . . . . . . . . . . . . . . . . . . . . . . . . . . . . . . . . . . . . . . $(25,643) $ (3,269) $ 6,418
Operating Activities. In 2006, operating activities of continuing operations used net cash of $14.6 millioncompared to providing net cash of $11.0 million in 2005 and 2004, respectively.
Net cash utilized by operating activities in 2006 of $14.6 million was comprised of: (1) our net loss fromcontinuing operations of $33.1 million, (2) a $5.4 million net decrease in income taxes payable and other liabilitiesprimarily resulting from a decrease of $4.8 million in taxes payable due to the income tax benefit recorded in 2006and a $0.6 million decrease in our straight line rent liability and (3) a $4.8 million increase in prepaid expensesprimarily related to the timing of rent payments.
These were somewhat offset by the following sources of cash: (1) $13.2 million in non-cash adjustments fordepreciation and amortization, (2) a $10.7 million decrease in inventories resulting from our aggressive manage-ment of inventory levels in 2006, (3) $2.3 million in non-cash charges related to stock-based compensation costs,(4) a $0.9 million decrease in net accounts receivable primarily relating to outstanding insurance claims fordamages caused by Hurricane Katrina in 2005 and paid in 2006, as well as decreased credit card and constructionallowance receivables, (5) a $0.7 million increase in accounts payable and accrued expenses primarily due toincreased customer payables related to outstanding gift cards, and (6) a $0.7 million non-cash charge related to theasset impairment loss we recorded for certain of our mall stores in 2006.
The $11.0 million of net cash provided by operating activities in 2005 was comprised of: (1) net income fromcontinuing operations of $12.2 million, (2) $14.7 million in non-cash adjustments for depreciation and amorti-zation, (3) a $1.3 million decrease in prepaid expenses due to the timing of rent payments and marketingpromotions, (4) a $0.8 million net increase in income taxes payable and other liabilities primarily due to an increaseof $1.4 million in taxes payable somewhat offset by a $0.5 million decrease in our straight line rent liability, and (5) adecrease in inventories of $0.4 million.
These sources of cash were partially offset by: (1) a $12.3 million decrease in accounts payable and accruedexpenses primarily due to a $5.8 million decrease in accounts payable related to lower levels of in-transit inventoryin 2005 as compared to 2004 and a $6.5 million decrease in accrued expenses primarily due to payroll expensesrelated to bonus and severance, as well as decreased accrued sales tax resulting from our lower sales volume, (2) a$5.5 million decrease in our deferred tax liability and (3) an increase in accounts receivable of $0.4 millionprimarily due to outstanding tenant allowances receivable from landlords and insurance proceeds receivable relatedto Hurricane Katrina damages, somewhat offset by reduced credit card receivables resulting from our lower salesvolume.
The $11.0 million of cash provided by operating activities in 2004 was comprised of: (1) $34.0 million in non-cash adjustments for depreciation, amortization, property and equipment impairment, and restricted stock com-pensation expense (including $13.8 million in accelerated depreciation related to the liquidation and restructuringactivities), (2) a $3.2 million decrease in inventories (due to a $14.6 million decrease in liquidation inventory offsetby increased in-transit of new inventory receipts as of the end of 2004), (3) a $2.5 million decrease in accountsreceivable due primarily to reduced credit card receivables as a result of the lower sales volume, (4) a $2.2 million
36

increase in accounts payable and accrued expenses primarily due to increased accounts payable related to in-transitinventory as partially offset by decreased accrued expenses as a result of the overall headcount and store reductionin 2004, and (5) a $0.5 million decrease in prepaid expenses primarily related to decreased marketing pre-payments.
These sources of cash were partially offset by: (1) a net loss from continuing operations of $23.8 million, (2) a$2.6 million decrease in our deferred income tax liability primarily related to our decreased LIFO inventory reserveand (3) a $5.0 million decrease in our income tax and other liability accounts.
Investing Activities. In 2006, continuing operations investing activities were a net $11.0 million with capitalexpenditures of $11.1 million being somewhat offset by $0.1 million of proceeds on the disposition of property andequipment. Capital expenditures in 2006 included: (1) $6.0 million for the construction of new stores and therenovation of and improvements to existing stores, (2) $2.2 million in new fixtures for our mall stores, (3)$2.0 million in information systems projects including new cash register CPUs and printers for our stores, (4) a$0.5 million automated conveyor system in our distribution center, and (5) $0.4 million in other administrative fixedassets.
Investing activities of continuing operations in 2005 were $10.0 million including capital expenditures of$10.3 million partially offset by $0.3 million from proceeds on the disposition of property and equipment. Capitalexpenditures in 2005 were comprised of: (1) $7.1 million for the construction of new stores and the renovation ofand improvements to existing stores, including new store fixtures, (2) $0.9 million for wireless handheld computertechnology related to receiving and pricing for store operations, (3) $0.8 million for point-of-sale hardware,(4) $0.4 million for distribution center equipment, and (5) $1.1 million in other administrative fixed assets.
Investing activities of continuing operations for 2004 were comprised of $4.8 million in capital expendituresprimarily for the construction of new stores and the renovation of and improvements to existing stores, partiallyoffset by $0.2 million from the proceeds on the sale of property and equipment.
Financing Activities. In 2006, financing activities utilized net cash of $0.1 million, with $0.4 million in debtacquisition costs relating to our restated credit agreement offsetting $0.3 million in proceeds from the issuance ofcommon stock from the exercise of stock options, share grants to our non-employee directors and from ouremployee stock purchase plan.
In 2005, financing activities utilized net cash of $4.2 million primarily due to $5.0 million used for pre-payment of a portion of our Term B promissory note, somewhat offset by $0.8 million provided by the issuance ofcommon stock primarily from the exercise of stock options.
Cash provided by financing activities in 2004 was $0.2 million as a result of $32.5 million in net proceeds fromthe equity financing completed on July 2, 2004, as offset by: (1) $30.6 million used to repurchase and repay our111⁄4% Senior Notes, (2) $0.6 million in reduced other borrowings and (3) $1.2 million used for debt acquisitioncosts related to amendments to our senior credit facility in April 2004.
Discontinued Operations. In 2004, operating activities of discontinued operations utilized net cash of$0.2 million.
Contractual Obligations and Commercial Commitments. We have entered into agreements that createcontractual obligations and commercial commitments. These obligations and commitments will have an impact onfuture liquidity and the availability of capital resources. The tables presented below summarize these obligationsand commitments.
Contractual Obligations
Payments Due by Period (in thousands)Total
Obligations 2007 2008-2009 2010-2011After Five
Years
Operating leases(1) . . . . . . . . . . . . . . . . . . . . . . . . $168,112 $33,343 $57,629 $40,871 $36,269
Licensing obligations . . . . . . . . . . . . . . . . . . . . . . 1,040 645 295 100 —
Debt obligations(2) . . . . . . . . . . . . . . . . . . . . . . . . 20,000 — — 20,000 —
Total contractual obligations . . . . . . . . . . . . . . . . . $189,152 $33,988 $57,924 $60,971 $36,269
37

(1) Includes store and distribution center operating leases, which generally provide for payment of directoperating costs in addition to rent. These obligation amounts include future minimum lease payments andexclude related direct operating costs.
(2) Excludes variable rate interest of the LIBOR plus 4.0%.
Commercial Commitments
Amount of Commitment by Period (in thousands)Total
Obligations 2007 2008-2009 2010-2011After Five
Years
Documentary letters of credit . . . . . . . . . . . . . . . . . $ 945 $ 945 $— $— $—
Standby letters of credit . . . . . . . . . . . . . . . . . . . . . 2,830 2,830 — — —
Total commercial commitments . . . . . . . . . . . . . . . $3,775 $3,775 $— $— $—
Off-Balance Sheet Arrangements
We have no off-balance sheet arrangements that have or are reasonably likely to have a current or future effecton our financial condition, changes in our financial condition, revenues or expenses, results of operations, liquidity,capital expenditures or capital resources that is material to investors.
Seasonality and Inflation
A majority of our net sales and operating profit is generated in the peak selling period from October throughJanuary, which includes the holiday selling season. As a result, our annual operating results have been, and willcontinue to be, heavily dependent on the results of our peak selling period. Net sales are generally lowest during theperiod from April through July, and we typically do not become profitable, if at all, until the fourth quarter of a givenyear. Most of our stores are unprofitable during the first three quarters. Conversely, in a typical year nearly all of ourstores are profitable during the fourth quarter, even those that may be unprofitable for the full year. Historically, wehave opened most of our stores during the last half of the year. As a result, new mall stores opened just prior to thefourth quarter produce profits in excess of their annualized profits since the stores typically generate losses in thefirst nine months of the year.
We do not believe that inflation has had a material effect on the results of operations during the past three years;however, there can be no assurance that our business will not be affected by inflation in the future.
Discontinued Operations
In November 2002, we liquidated our Travel Subsidiaries (El Portal Group, Inc., Bentley’s Luggage Corp. andFlorida Luggage Corp.), which were presented as a discontinued operation in the applicable years’ financialstatements. In 2004, we recorded $0.3 million in income from discontinued operations representing the reversal ofthe 2004 balance of the discontinued operations liabilities, related to lease termination and store closing costs, thatwere no longer required. This resulted in $0.2 million in income from discontinued operations net of tax, or $0.01 netincome per share. As of February 3, 2007 and January 28, 2006, there were no assets or liabilities related to ourdiscontinued operations.
Reorganization and Partial Store Liquidation
On January 22, 2004, we announced that we would liquidate up to 100 underperforming mall and outlet stores(subsequently revised to 111 stores) and eliminate approximately 950 store-related positions. We entered into anAgency Agreement with a joint venture comprised of Hilco Merchant Resources, LLC, Gordon Brothers RetailPartners, LLC and Hilco Real Estate, LLC (the “Hilco/Gordon Brothers Joint Venture”) to liquidate the inventory inthe 111 stores and assist in the discussions with landlords regarding lease terminations in approximately 94 of thesestores. Pursuant to the Agency Agreement, the Hilco/Gordon Brothers Joint Venture guaranteed us an amount of84.0% of the cost value of the inventory, subject to certain adjustments. The Hilco/Gordon Brothers Joint Venturewas responsible for all expenses related to the sale. In addition, we announced that we would eliminate approx-imately 70 positions at our corporate headquarters in Brooklyn Park, Minnesota and distribution centers located in
38

Minnesota and Nevada, as well as the closure of our distribution center in Las Vegas, Nevada, to better align ourfinancial structure with current business conditions. See Note 2, “Reorganization and partial store liquidation”contained in our consolidated financial statements.
For these actions we incurred charges related to the restructuring and partial store liquidation of $27.4 millionduring 2004 primarily related to the transfer of inventory to an independent liquidator in conjunction with theclosing of the liquidation stores, lease termination costs, accelerated depreciation, asset write-offs related to storeclosings, severance, and other restructuring costs. In 2004, a total of $17.4 million and $13.8 million of thesecharges were recorded in selling, general and administrative expenses and depreciation and amortization,respectively, as partially offset by $3.8 million of gross margin earned on the liquidation sales. The liquidationsales were completed in April 2004, and as of May 1, 2004, all the liquidation stores had been closed. As ofOctober 30, 2004, we had successfully negotiated all of the lease terminations. The overall net cash outlay for therestructuring activities was slightly negative.
Quarterly Results
The following table sets forth certain unaudited consolidated financial information from our historicalconsolidated statements of operations for each fiscal quarter of 2006 and 2005. This quarterly information hasbeen prepared on a basis consistent with our audited consolidated financial statements appearing elsewhere in thisForm 10-K and reflects adjustments which, in the opinion of management, consist of normal recurring adjustmentsnecessary for a fair presentation of such unaudited quarterly results when read in conjunction with the auditedconsolidated financial statements and notes thereto. (In thousands, except per share amounts):
Feb. 3,2007(2)
Oct. 28,2006
Jul. 29,2006
April 29,2006
Jan. 28,2006
Oct. 29,2005
Jul. 30,2005
April 30,2005
Fiscal 2006 Fiscal 2005Quarter ended(1)
Net sales . . . . . . . . . . . . . . . . . . . . . . . . . . $132,967 $ 64,457 $ 49,158 $74,680 $178,851 $ 76,389 $ 58,417 $84,329
Gross margin . . . . . . . . . . . . . . . . . . . . . . . 49,982 15,421 1,878 19,730 80,262 20,157 13,428 25,385
Operating income (loss) . . . . . . . . . . . . . . . . 12,867 (14,132) (25,323) (9,022) 40,477 (10,344) (14,721) (3,130)
Net income (loss) . . . . . . . . . . . . . . . . . . . . $ 11,964 $(14,057) $(24,502) $ (6,500) $ 41,714 $(11,716) $(13,993) $ (3,793)
Basic income (loss) per share:
Net income (loss) . . . . . . . . . . . . . . . . . . . . $ 0.31 $ (0.36) $ (0.63) $ (0.17) $ 1.07 $ (0.30) $ (0.36) $ (0.10)
Diluted income (loss) per share:
Net income (loss) . . . . . . . . . . . . . . . . . . . . $ 0.31 $ (0.36) $ (0.63) $ (0.17) $ 1.04 $ (0.30) $ (0.36) $ (0.10)
(1) The sum of the per share amounts for the quarters does not equal the totals for the year due to the applicationof the treasury stock method.
(2) The quarter ended February 3, 2007 is a fourteen-week quarter; all other quarters presented are thirteen-weekquarters.
Recently Issued Accounting Pronouncements
See Note 1, “Summary of significant accounting policies,” contained in our consolidated financial statements,for a full description of recent accounting pronouncements, including the respective expected dates of adoption andeffects on results of operations and financial condition.
39

Item 7A. Quantitative and Qualitative Disclosure About Market Risk
At February 3, 2007, we had cash and cash equivalents totaling $19.9 million. The effect of a 100 basis pointchange in interest rates would have an estimated $0.2 million pre-tax earnings and cash flow impact, assuming othervariables are held constant.
Our senior credit facility carries interest rate risk that is generally related to the LIBOR, the commercial paperrate or the prime rate. If any of those rates were to change while we were borrowing under the senior credit facility,interest expense would increase or decrease accordingly. As of February 3, 2007, there were no outstandingborrowings under the senior credit facility, $20.0 million outstanding on the Term B promissory note, and$3.8 million in outstanding letters of credit.
Item 8. Financial Statements and Supplementary Data
Consolidated financial statements required pursuant to this Item begin on page F-1 of this Form 10-K. Pursuantto the applicable accounting regulations of the Securities and Exchange Commission, we are not required to providesupplementary data.
Item 9. Changes in and Disagreements with Accountants on Accounting and Financial Disclosure
None.
Item 9A. Controls and Procedures
Evaluation of Disclosure Controls and Procedures
We have established and maintain disclosure controls and procedures that are designed to ensure that materialinformation relating to us and to our subsidiaries required to be disclosed by us in the reports that we file or submitunder the Securities Exchange Act of 1934 is recorded, processed, summarized, and reported within the timeperiods specified in the SEC’s rules and forms, and that such information is accumulated and communicated to ourmanagement, including our chief executive officer and chief financial officer, as appropriate to allow timelydecisions regarding required disclosure. We carried out an evaluation, under the supervision and with theparticipation of our management, including our chief executive officer and chief financial officer, of the effec-tiveness of the design and operation of our disclosure controls and procedures as of the end of the period covered bythis report. Based on that evaluation, the chief executive officer and chief financial officer concluded that ourdisclosure controls and procedures were effective as of the date of such evaluation.
Management’s Report on Internal Controls and Procedures
Our management is responsible for establishing and maintaining adequate internal control over financialreporting. Internal control over financial reporting is a process designed by, or under the supervision of, our chiefexecutive and chief financial officers and effected by our board of directors, management and other personnel toprovide reasonable assurance regarding the reliability of financial reporting and the preparation of financialstatements for external purposes in accordance with U.S. generally accepted accounting principles and includesthose policies and procedures that:
(i) pertain to the maintenance of records that in reasonable detail accurately and fairly reflect thetransactions and dispositions of our assets;
40

(ii) provide reasonable assurance that transactions are recorded as necessary to permit preparation offinancial statements in accordance with U.S. generally accepted accounting principles, and that our receiptsand expenditures are being made only in accordance with the authorizations of our management anddirectors; and
(iii) provide reasonable assurance regarding prevention or timely detection of unauthorized acquisition,use or disposition of our assets that could have a material effect on our financial statements.
Because of inherent limitations, internal control over financial reporting may not prevent or detect misstate-ments. Projections of any evaluation of effectiveness to future periods are subject to the risks that controls maybecome inadequate because of changes in conditions, or that the degree of compliance with policies or proceduresmay deteriorate.
Management assessed the effectiveness of our internal control over financial reporting as of February 3, 2007.In making this assessment, management used the criteria set forth by the Committee of Sponsoring Organizations ofthe Treadway Commission in Internal Control-Integrated Framework. Based on this assessment, our managementconcluded that our internal control over financial reporting was effective as of February 3, 2007.
Our independent registered public accounting firm, KPMG LLP, has issued an attestation report onmanagement’s assessment of our internal control over financial reporting. That report appears below.
41
Report of Independent Registered Public Accounting Firm
The Board of Directors and ShareholdersWilsons The Leather Experts Inc.:
We have audited management’s assessment, included in the accompanying report entitled “Management’sReport on Internal Control and Procedures,” that Wilsons The Leather Experts Inc. (the “Company”) maintainedeffective internal control over financial reporting as of February 3, 2007, based on criteria established in InternalControl — Integrated Framework issued by the Committee of Sponsoring Organizations of the TreadwayCommission (COSO). The Company’s management is responsible for maintaining effective internal control overfinancial reporting and for its assessment of the effectiveness of internal control over financial reporting. Ourresponsibility is to express an opinion on management’s assessment and an opinion on the effectiveness of theCompany’s internal control over financial reporting based on our audit.
We conducted our audit in accordance with the standards of the Public Company Accounting Oversight Board(United States). Those standards require that we plan and perform the audit to obtain reasonable assurance aboutwhether effective internal control over financial reporting was maintained in all material respects. Our auditincluded obtaining an understanding of internal control over financial reporting, evaluating management’sassessment, testing and evaluating the design and operating effectiveness of internal control, and performingsuch other procedures as we considered necessary in the circumstances. We believe that our audit provides areasonable basis for our opinion.
A company’s internal control over financial reporting is a process designed to provide reasonable assuranceregarding the reliability of financial reporting and the preparation of financial statements for external purposes inaccordance with generally accepted accounting principles. A company’s internal control over financial reportingincludes those policies and procedures that (1) pertain to the maintenance of records that, in reasonable detail,accurately and fairly reflect the transactions and dispositions of the assets of the company; (2) provide reasonableassurance that transactions are recorded as necessary to permit preparation of financial statements in accordancewith generally accepted accounting principles, and that receipts and expenditures of the company are being madeonly in accordance with authorizations of management and directors of the company; and (3) provide reasonableassurance regarding prevention or timely detection of unauthorized acquisition, use, or disposition of the company’sassets that could have a material effect on the financial statements.
Because of its inherent limitations, internal control over financial reporting may not prevent or detectmisstatements. Also, projections of any evaluation of effectiveness to future periods are subject to the risk thatcontrols may become inadequate because of changes in conditions, or that the degree of compliance with thepolicies or procedures may deteriorate.
In our opinion, management’s assessment that Wilsons The Leather Experts Inc. maintained effective internalcontrol over financial reporting as of February 3, 2007, is fairly stated, in all material respects, based on criteriaestablished in Internal Control — Integrated Framework issued by the Committee of Sponsoring Organizations ofthe Treadway Commission (COSO). Also, in our opinion, the Company maintained, in all material respects,effective internal control over financial reporting as of February 3, 2007, based on criteria established in InternalControl — Integrated Framework issued by the Committee of Sponsoring Organizations of the Treadway Com-mission (COSO).
We also have audited, in accordance with the standards of the Public Company Accounting Oversight Board(United States), the consolidated balance sheets of Wilsons The Leather Experts Inc. and subsidiaries as ofFebruary 3, 2007, and January 28, 2006, and the related consolidated statements of operations, shareholders’ equity,and cash flows for each of the fiscal years in the three-year period ended February 3, 2007, and our report datedMarch 30, 2007 expressed an unqualified opinion on those consolidated financial statements.
/s/ KPMG LLP
Minneapolis, MinnesotaMarch 30, 2007
42

Change in Internal Control Over Financial Reporting
There were no changes in the our internal control over financial reporting that occurred during our last fiscalquarter that have materially affected, or are reasonably likely to materially affect, our internal control over financialreporting.
Item 9B. Other Information
None.
PART III
Certain information required by Part III is incorporated by reference from our definitive Proxy Statement forthe 2007 Annual Meeting of Shareholders (the “Proxy Statement”), which will be filed with the Securities andExchange Commission pursuant to Regulation 14A within 120 days after February 3, 2007.
Except for those portions specifically incorporated in this Form 10-K by reference to our Proxy Statement, noother portions of the Proxy Statement are deemed to be filed as part of this Form 10-K.
Item 10. Directors, Executive Officers and Corporate Governance
Incorporated by reference in this Form 10-K is the information appearing under the headings “Election ofDirectors” and “Section 16(a) Beneficial Ownership Reporting Compliance” in our Proxy Statement. For infor-mation concerning executive officers and family relationships between any director or executive officer, seeItem 4A. “Executive Officers of the Registrant” in this Form 10-K.
In March 2004, we adopted a Code of Business Ethics and Conduct applicable to all associates and directors ofour company, including our chief executive officer, chief operating officer, chief financial officer, controller,treasurer, and other employees performing similar functions. A copy of the Code of Business Ethics and Conductwas filed as Exhibit 14.1 incorporated by reference to our 2004 Form 10-K. We intend to file on our Web site anyamendments to, or waivers from, our Code of Business Ethics and Conduct within four business days of any suchamendment or waiver. We intend to post on our Web site any amendments to, or waivers from, our Code of BusinessEthics and Conduct that apply to our principal executive officer, principal financial officer, principal accountingofficer, controller, and other persons performing similar functions promptly following the date of such amendmentor waiver. A copy of our Code of Business Ethics and Conduct is also available on our Web site(www.wilsonsleather.com).
Item 11. Executive Compensation
Incorporated by reference in this Form 10-K is the information appearing under the heading “ExecutiveCompensation” in our Proxy Statement.
Item 12. Security Ownership of Certain Beneficial Owners and Management and Related StockholderMatters
Incorporated by reference in this Form 10-K is the information appearing under the headings “SecurityOwnership of Principal Shareholders and Management” and “Equity Compensation Plan Information” in our ProxyStatement.
Item 13. Certain Relationships and Related Transactions, and Director Independence
Incorporated by reference in this Form 10-K is the information appearing under the headings “CertainRelationships and Related Transactions” and “Election of Directors — Board Matters and Meeting Attendance” inour Proxy Statement.
43

Item 14. Principal Accountant Fees and Services
Incorporated by reference in this Form 10-K is the information under the heading “Fees Paid to IndependentRegistered Public Accounting Firm” in our Proxy Statement.
PART IV
Item 15. Exhibits and Financial Statement Schedules
(a) Documents filed as part of this report:
1. Financial Statements:
Report of Independent Registered Public Accounting Firm
Consolidated Balance Sheets
Consolidated Statements of Operations
Consolidated Statements of Shareholders’ Equity
Consolidated Statements of Cash Flows
Notes to Consolidated Financial Statements
2. Financial Statement Schedule
3. Exhibits
The exhibit index attached to this report is incorporated by reference herein.
44

SIGNATURES
Pursuant to the requirements of Section 13 or 15(d) of the Securities Exchange Act of 1934, theregistrant has duly caused this report to be signed on its behalf by the undersigned, thereunto duly authorizedon March 30, 2007:
WILSONS THE LEATHER EXPERTS INC.(registrant)
By: /s/ MICHAEL M. SEARLES
Michael M. SearlesChairman and Chief Executive Officer
(principal executive officer)
By: /s/ STACY A. KRUSE
Stacy A. KruseChief Financial Officer and Treasurer
(principal financial and accounting officer)
Pursuant to the requirements of the Securities Exchange Act of 1934, this report has been signed belowon March 30, 2007 by the following persons on behalf of the registrant and in the capacities indicated:
/s/ MICHAEL M. SEARLES
MICHAEL M. SEARLES
Director
/s/ GAIL A. COTTLE
GAIL A. COTTLE
Director
/s/ MICHAEL T. COWHIG
MICHAEL T. COWHIG
Director
/s/ WILLIAM F. FARLEY
WILLIAM F. FARLEY
Director
/s/ PETER V. HANDAL
PETER V. HANDAL
Director
/s/ BRADLEY K. JOHNSON
BRADLEY K. JOHNSON
Director
/s/ MICHAEL J. MCCOY
MICHAEL J. MCCOY
Director
/s/ DAVID L. ROGERS
DAVID L. ROGERS
Director
/s/ R. TED WESCHLER
R. TED WESCHLER
Director
45

®This Page Intentionally Left Blank©

WILSONS THE LEATHER EXPERTS INC. AND SUBSIDIARIES
Index to Consolidated Financial Statements and Financial Statement Schedule
Page
Report of Independent Registered Public Accounting Firm . . . . . . . . . . . . . . . . . . . . . . . . . . . . . . . . . . F-2
Consolidated Balance Sheets as of February 3, 2007 and January 28, 2006 . . . . . . . . . . . . . . . . . . . . . . F-3
Consolidated Statements of Operations for the years ended February 3, 2007, January 28, 2006 andJanuary 29, 2005 . . . . . . . . . . . . . . . . . . . . . . . . . . . . . . . . . . . . . . . . . . . . . . . . . . . . . . . . . . . . . . . F-4
Consolidated Statements of Shareholders’ Equity for the years ended February 3, 2007, January 28,2006 and January 29, 2005 . . . . . . . . . . . . . . . . . . . . . . . . . . . . . . . . . . . . . . . . . . . . . . . . . . . . . . . . F-5
Consolidated Statements of Cash Flows for the years ended February 3, 2007, January 28, 2006 andJanuary 29, 2005 . . . . . . . . . . . . . . . . . . . . . . . . . . . . . . . . . . . . . . . . . . . . . . . . . . . . . . . . . . . . . . . F-6
Notes to Consolidated Financial Statements . . . . . . . . . . . . . . . . . . . . . . . . . . . . . . . . . . . . . . . . . . . . . F-7
Financial Statement Schedule:
Schedule II — Valuation and Qualifying Accounts . . . . . . . . . . . . . . . . . . . . . . . . . . . . . . . . . . . . . . . . F-27
F-1

Report of Independent Registered Public Accounting Firm
The Board of Directors and Shareholders,Wilsons The Leather Experts Inc.:
We have audited the accompanying consolidated balance sheets of Wilsons The Leather Experts Inc. andsubsidiaries as of February 3, 2007 and January 28, 2006, and the related consolidated statements of operations,shareholders’ equity and cash flows for each of the fiscal years in the three-year period ended February 3, 2007. Inconnection with our audits of the consolidated financial statements, we also have audited the financial statementschedule as listed in the accompanying index. These consolidated financial statements and financial statementschedule are the responsibility of the Company’s management. Our responsibility is to express an opinion on theseconsolidated financial statements and financial statement schedule based on our audits.
We conducted our audits in accordance with the standards of the Public Company Accounting Oversight Board(United States). Those standards require that we plan and perform the audit to obtain reasonable assurance aboutwhether the financial statements are free of material misstatement. An audit includes examining, on a test basis,evidence supporting the amounts and disclosures in the financial statements. An audit also includes assessing theaccounting principles used and significant estimates made by management, as well as evaluating the overallfinancial statement presentation. We believe that our audits provide a reasonable basis for our opinion.
In our opinion, the consolidated financial statements referred to above present fairly, in all material respects,the financial position of Wilsons The Leather Experts Inc. and subsidiaries as of February 3, 2007 and January 28,2006, and the results of their operations and their cash flows for each of the fiscal years in the three-year periodended February 3, 2007, in conformity with U.S. generally accepted accounting principles. Also in our opinion, therelated financial statement schedule, when considered in relation to the basic consolidated financial statementstaken as a whole, presents fairly, in all material respects, the information set forth therein.
As discussed in Notes 1 and 11 to the consolidated financial statements, the Company adopted the provisionsof Statement of Financial Accounting Standards No. 123 (Revised 2004), “Share-Based Payment,” on January 29,2006. As discussed in Notes 1 and 14, the Company adopted the provisions of Securities and Exchange CommissionStaff Accounting Bulletin No. 108, “Considering the Effects of Prior Year Misstatements when QuantifyingMisstatements in Current Year Financial Statements,” on January 29, 2006.
We have also audited, in accordance with the standards of the Public Company Accounting Oversight Board(United States), the effectiveness of Wilsons The Leather Experts Inc. and subsidiaries’ internal control overfinancial reporting as of February 3, 2007, based on the criteria established in Internal Control — IntegratedFramework issued by the Committee of Sponsoring Organizations of the Treadway Commission (COSO), and ourreport dated March 30, 2007 expressed an unqualified opinion on management’s assessment of, and the effectiveoperations of, internal control over financial reporting.
/s/ KPMG LLP
Minneapolis, MinnesotaMarch 30, 2007
F-2

WILSONS THE LEATHER EXPERTS INC. AND SUBSIDIARIES
CONSOLIDATED BALANCE SHEETS
(In thousands, except share and per share amounts)February 3,
2007January 28,
2006
ASSETSCURRENT ASSETS:
Cash and cash equivalents . . . . . . . . . . . . . . . . . . . . . . . . . . . . . . . . . . . . . . . . . . $ 19,909 $ 45,552
Accounts receivable, net of allowance of $71 and $76 in 2006 and 2005,respectively . . . . . . . . . . . . . . . . . . . . . . . . . . . . . . . . . . . . . . . . . . . . . . . . . . . 3,132 4,063
Inventories . . . . . . . . . . . . . . . . . . . . . . . . . . . . . . . . . . . . . . . . . . . . . . . . . . . . . 74,897 85,645
Prepaid expenses . . . . . . . . . . . . . . . . . . . . . . . . . . . . . . . . . . . . . . . . . . . . . . . . . 7,267 1,987
TOTAL CURRENT ASSETS . . . . . . . . . . . . . . . . . . . . . . . . . . . . . . . . . . . . . . 105,205 137,247
Property and equipment, net . . . . . . . . . . . . . . . . . . . . . . . . . . . . . . . . . . . . . . . . . . 38,890 41,045
Other assets, net . . . . . . . . . . . . . . . . . . . . . . . . . . . . . . . . . . . . . . . . . . . . . . . . . . . 1,250 1,576
TOTAL ASSETS . . . . . . . . . . . . . . . . . . . . . . . . . . . . . . . . . . . . . . . . . . . . . . . $145,345 $179,868
LIABILITIES AND SHAREHOLDERS’ EQUITYCURRENT LIABILITIES:
Accounts payable . . . . . . . . . . . . . . . . . . . . . . . . . . . . . . . . . . . . . . . . . . . . . . . . $ 14,337 $ 12,036
Accrued expenses . . . . . . . . . . . . . . . . . . . . . . . . . . . . . . . . . . . . . . . . . . . . . . . . 14,534 16,595
Income taxes payable . . . . . . . . . . . . . . . . . . . . . . . . . . . . . . . . . . . . . . . . . . . . . . 921 5,685
Deferred income taxes . . . . . . . . . . . . . . . . . . . . . . . . . . . . . . . . . . . . . . . . . . . . . 220 53
TOTAL CURRENT LIABILITIES . . . . . . . . . . . . . . . . . . . . . . . . . . . . . . . . . . 30,012 34,369
Long-term debt . . . . . . . . . . . . . . . . . . . . . . . . . . . . . . . . . . . . . . . . . . . . . . . . . . . . 20,000 20,000
Other long-term liabilities . . . . . . . . . . . . . . . . . . . . . . . . . . . . . . . . . . . . . . . . . . . . 16,832 17,445
TOTAL LIABILITIES . . . . . . . . . . . . . . . . . . . . . . . . . . . . . . . . . . . . . . . . . . . 66,844 71,814
COMMITMENTS AND CONTINGENCIES
SHAREHOLDERS’ EQUITY:
Common stock, $.01 par value; 150,000,000 shares authorized; 39,204,299 and39,087,652 shares issued and outstanding on February 3, 2007 and January 28,2006, respectively . . . . . . . . . . . . . . . . . . . . . . . . . . . . . . . . . . . . . . . . . . . . . . . . 392 391
Additional paid-in capital . . . . . . . . . . . . . . . . . . . . . . . . . . . . . . . . . . . . . . . . . . . . 136,441 133,853
Accumulated deficit . . . . . . . . . . . . . . . . . . . . . . . . . . . . . . . . . . . . . . . . . . . . . . . . (58,334) (26,201)
Accumulated other comprehensive income . . . . . . . . . . . . . . . . . . . . . . . . . . . . . . . . 2 11
TOTAL SHAREHOLDERS’ EQUITY . . . . . . . . . . . . . . . . . . . . . . . . . . . . . . . 78,501 108,054
TOTAL LIABILITIES AND SHAREHOLDERS’ EQUITY . . . . . . . . . . . . . . . . $145,345 $179,868
The accompanying notes are an integral part of these consolidated financial statements.
F-3

WILSONS THE LEATHER EXPERTS INC. AND SUBSIDIARIES
CONSOLIDATED STATEMENTS OF OPERATIONS
(In thousands, except per share amounts)
February 3,2007
January 28,2006
January 29,2005
For the years ended
NET SALES . . . . . . . . . . . . . . . . . . . . . . . . . . . . . . . . . . . . . . . . . . . $321,262 $397,986 $441,071
COST OF GOODS SOLD, BUYING AND OCCUPANCY COSTS . . . 234,251 258,754 299,713
Gross margin. . . . . . . . . . . . . . . . . . . . . . . . . . . . . . . . . . . . . . . . . . 87,011 139,232 141,358
SELLING, GENERAL AND ADMINISTRATIVE EXPENSES . . . . . . 110,159 112,877 129,240
DEPRECIATION AND AMORTIZATION. . . . . . . . . . . . . . . . . . . . . . 12,462 14,073 30,630
Operating income (loss) . . . . . . . . . . . . . . . . . . . . . . . . . . . . . . . . . . (35,610) 12,282 (18,512)
INTEREST EXPENSE, net . . . . . . . . . . . . . . . . . . . . . . . . . . . . . . . . . 1,862 3,156 7,427
Income (loss) from continuing operations before income taxes . . . . . (37,472) 9,126 (25,939)
INCOME TAX BENEFIT . . . . . . . . . . . . . . . . . . . . . . . . . . . . . . . . . . (4,377) (3,086) (2,183)
Income (loss) from continuing operations . . . . . . . . . . . . . . . . . . . . . (33,095) 12,212 (23,756)
INCOME FROM DISCONTINUED OPERATIONS, net of tax. . . . . . . — — 173
Net income (loss) . . . . . . . . . . . . . . . . . . . . . . . . . . . . . . . . . $ (33,095) $ 12,212 $ (23,583)
BASIC INCOME (LOSS) PER SHARE:Income (loss) from continuing operations . . . . . . . . . . . . . . . . . . . . . $ (0.85) $ 0.31 $ (0.76)
Income from discontinued operations . . . . . . . . . . . . . . . . . . . . . . . . — — 0.01
Basic income (loss) per share . . . . . . . . . . . . . . . . . . . . . . . . . . . . $ (0.85) $ 0.31 $ (0.75)
Basic weighted average common shares outstanding . . . . . . . . . . . 39,154 38,994 31,275
DILUTED INCOME (LOSS) PER SHARE:Income (loss) from continuing operations . . . . . . . . . . . . . . . . . . . . . $ (0.85) $ 0.30 $ (0.76)
Income from discontinued operations . . . . . . . . . . . . . . . . . . . . . . . . — — 0.01
Diluted income (loss) per share . . . . . . . . . . . . . . . . . . . . . . . . . . $ (0.85) $ 0.30 $ (0.75)
Diluted weighted average common shares outstanding . . . . . . . . . 39,154 40,767 31,275
The accompanying notes are an integral part of these consolidated financial statements.
F-4

WILSONS THE LEATHER EXPERTS INC. AND SUBSIDIARIES
CONSOLIDATED STATEMENTS OF SHAREHOLDERS’ EQUITY
(In thousands, except share amounts)
Shares Amount
Additionalpaid-incapital
Deferredcompensation
Accumulateddeficit
Accumulatedother
comprehensiveincome (loss)
Totalshareholders’
equityCommon stock
BALANCE, January 31, 2004 . . . . . . . . 20,807,706 $208 $100,633 $(701) $(14,788) $ 2 $ 85,354Net loss . . . . . . . . . . . . . . . . . . . . . . . — — — — (23,583) — (23,583)Other comprehensive income- foreign
currency translation adjustment . . . . . — — — — — 2 2
Comprehensive loss . . . . . . . . . . . . . . . — — — — — — (23,581)
Stock options exercised . . . . . . . . . . . . 15,600 — 62 — — — 62Shares issued under the Company’s
employee stock purchase plan . . . . . . 73,961 1 205 — — — 206Net restricted stock issued to
employees . . . . . . . . . . . . . . . . . . . . 38,087 — 103 (127) — — (24)Compensation expense for restricted
stock issued to employees . . . . . . . . . — — — 828 — — 828Private placement of common stock, net
of issuance costs . . . . . . . . . . . . . . . 17,948,718 180 32,100 — — — 32,280Joint venture distribution . . . . . . . . . . . — — — — (18) — (18)
BALANCE, January 29, 2005 . . . . . . . . 38,884,072 389 133,103 — (38,389) 4 95,107Net income. . . . . . . . . . . . . . . . . . . . . — — — — 12,212 — 12,212Other comprehensive income- foreign
currency translation adjustment . . . . . — — — — — 7 7
Comprehensive income . . . . . . . . . . . . — — — — — — 12,219
Stock options exercised . . . . . . . . . . . . 162,100 2 592 — — — 594Shares issued under the Company’s
employee stock purchase plan . . . . . . 41,480 — 158 — — — 158Joint venture distribution . . . . . . . . . . . — — — — (24) — (24)
BALANCE, January 28, 2006 . . . . . . . . 39,087,652 391 133,853 — (26,201) 11 108,054Cumulative effect of adjustment
resulting from adoption ofSAB No. 108, net of tax . . . . . . . . . . — — — — 962 — 962
BALANCE, January 28, 2006 asadjusted . . . . . . . . . . . . . . . . . . . . . . 39,087,652 391 133,853 — (25,239) 11 109,016Net loss . . . . . . . . . . . . . . . . . . . . . . . — — — — (33,095) — (33,095)Other comprehensive loss- foreign
currency translation adjustment . . . . . — — — — — (9) (9)
Comprehensive loss . . . . . . . . . . . . . . . — — — — — — (33,104)
Compensation expense for optionsissued to employees . . . . . . . . . . . . . — 2,267 — — — 2,267
Stock options exercised . . . . . . . . . . . . 44,040 — 128 — — — 128Shares issued under the Company’s
employee stock purchase plan . . . . . . 55,487 1 130 — — — 131Shares issued to non-employee
directors . . . . . . . . . . . . . . . . . . . . . 17,120 — 63 — — — 63
BALANCE, February 3, 2007 . . . . . . . . 39,204,299 $392 $136,441 $ — $(58,334) $ 2 $ 78,501
The accompanying notes are an integral part of these consolidated financial statements.
F-5
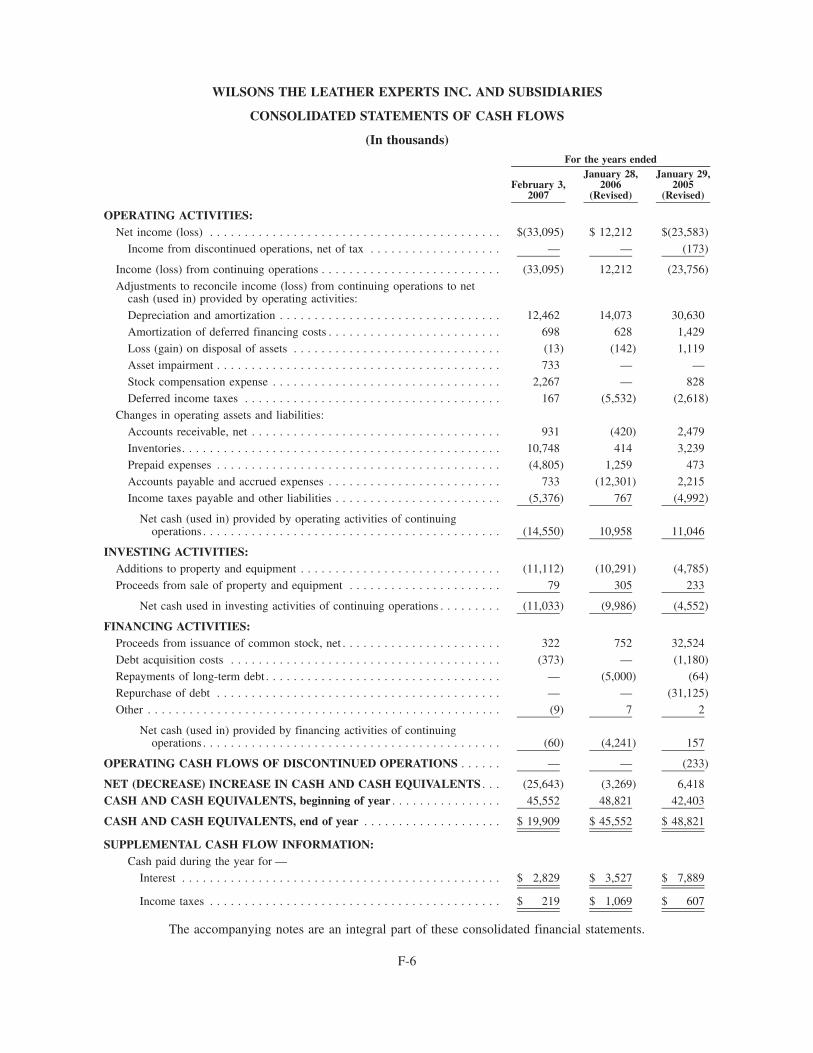
WILSONS THE LEATHER EXPERTS INC. AND SUBSIDIARIES
CONSOLIDATED STATEMENTS OF CASH FLOWS
(In thousands)
February 3,2007
January 28,2006
(Revised)
January 29,2005
(Revised)
For the years ended
OPERATING ACTIVITIES:Net income (loss) . . . . . . . . . . . . . . . . . . . . . . . . . . . . . . . . . . . . . . . . . . $(33,095) $ 12,212 $(23,583)
Income from discontinued operations, net of tax . . . . . . . . . . . . . . . . . . . — — (173)
Income (loss) from continuing operations . . . . . . . . . . . . . . . . . . . . . . . . . . (33,095) 12,212 (23,756)Adjustments to reconcile income (loss) from continuing operations to net
cash (used in) provided by operating activities:Depreciation and amortization . . . . . . . . . . . . . . . . . . . . . . . . . . . . . . . . 12,462 14,073 30,630Amortization of deferred financing costs . . . . . . . . . . . . . . . . . . . . . . . . . 698 628 1,429Loss (gain) on disposal of assets . . . . . . . . . . . . . . . . . . . . . . . . . . . . . . (13) (142) 1,119Asset impairment . . . . . . . . . . . . . . . . . . . . . . . . . . . . . . . . . . . . . . . . . 733 — —Stock compensation expense . . . . . . . . . . . . . . . . . . . . . . . . . . . . . . . . . 2,267 — 828Deferred income taxes . . . . . . . . . . . . . . . . . . . . . . . . . . . . . . . . . . . . . 167 (5,532) (2,618)
Changes in operating assets and liabilities:Accounts receivable, net . . . . . . . . . . . . . . . . . . . . . . . . . . . . . . . . . . . . 931 (420) 2,479Inventories. . . . . . . . . . . . . . . . . . . . . . . . . . . . . . . . . . . . . . . . . . . . . . 10,748 414 3,239Prepaid expenses . . . . . . . . . . . . . . . . . . . . . . . . . . . . . . . . . . . . . . . . . (4,805) 1,259 473Accounts payable and accrued expenses . . . . . . . . . . . . . . . . . . . . . . . . . 733 (12,301) 2,215Income taxes payable and other liabilities . . . . . . . . . . . . . . . . . . . . . . . . (5,376) 767 (4,992)
Net cash (used in) provided by operating activities of continuingoperations . . . . . . . . . . . . . . . . . . . . . . . . . . . . . . . . . . . . . . . . . . . (14,550) 10,958 11,046
INVESTING ACTIVITIES:Additions to property and equipment . . . . . . . . . . . . . . . . . . . . . . . . . . . . . (11,112) (10,291) (4,785)Proceeds from sale of property and equipment . . . . . . . . . . . . . . . . . . . . . . 79 305 233
Net cash used in investing activities of continuing operations . . . . . . . . . (11,033) (9,986) (4,552)
FINANCING ACTIVITIES:Proceeds from issuance of common stock, net . . . . . . . . . . . . . . . . . . . . . . . 322 752 32,524Debt acquisition costs . . . . . . . . . . . . . . . . . . . . . . . . . . . . . . . . . . . . . . . (373) — (1,180)Repayments of long-term debt . . . . . . . . . . . . . . . . . . . . . . . . . . . . . . . . . . — (5,000) (64)Repurchase of debt . . . . . . . . . . . . . . . . . . . . . . . . . . . . . . . . . . . . . . . . . — — (31,125)Other . . . . . . . . . . . . . . . . . . . . . . . . . . . . . . . . . . . . . . . . . . . . . . . . . . . (9) 7 2
Net cash (used in) provided by financing activities of continuingoperations . . . . . . . . . . . . . . . . . . . . . . . . . . . . . . . . . . . . . . . . . . . (60) (4,241) 157
OPERATING CASH FLOWS OF DISCONTINUED OPERATIONS . . . . . . — — (233)
NET (DECREASE) INCREASE IN CASH AND CASH EQUIVALENTS . . . (25,643) (3,269) 6,418CASH AND CASH EQUIVALENTS, beginning of year . . . . . . . . . . . . . . . . 45,552 48,821 42,403
CASH AND CASH EQUIVALENTS, end of year . . . . . . . . . . . . . . . . . . . . $ 19,909 $ 45,552 $ 48,821
SUPPLEMENTAL CASH FLOW INFORMATION:Cash paid during the year for —
Interest . . . . . . . . . . . . . . . . . . . . . . . . . . . . . . . . . . . . . . . . . . . . . . $ 2,829 $ 3,527 $ 7,889
Income taxes . . . . . . . . . . . . . . . . . . . . . . . . . . . . . . . . . . . . . . . . . . $ 219 $ 1,069 $ 607
The accompanying notes are an integral part of these consolidated financial statements.
F-6

WILSONS THE LEATHER EXPERTS INC. AND SUBSIDIARIES
NOTES TO CONSOLIDATED FINANCIAL STATEMENTS
February 3, 2007 and January 28, 2006
1 Summary of significant accounting policies
Nature of organization
Wilsons The Leather Experts Inc. (“Wilsons Leather” or “the Company”) a Minnesota corporation, is theleading specialty retailer of quality leather outerwear, accessories and apparel in the United States. At February 3,2007, Wilsons Leather operated 417 stores located in 45 states, including 287 mall stores, 116 outlet stores and 14airport locations. The Company supplemented its permanent stores with 118 and 102 temporary seasonal storesduring its peak selling season from October through January during fiscal years 2005 and 2004, respectively.Operation of the Company’s temporary seasonal stores was suspended in 2006 and for the foreseeable future, butmay be reconsidered in the future.
Basis of presentation
The accompanying consolidated financial statements include those of the Company and all of its subsidiaries.All material intercompany balances and transactions between the entities have been eliminated in consolidation. AtFebruary 3, 2007, Wilsons Leather operated in one reportable segment: selling leather outerwear, accessories andapparel. The Company’s chief operating decision-maker evaluates revenue and profitability performance on anenterprise basis to make operating and strategic decisions.
As more fully described in Note 2, “Reorganization and partial store liquidation,” on January 22, 2004, theCompany announced that it would liquidate up to 100 underperforming mall and outlet stores (subsequently revisedto 111 stores) and eliminate approximately 950 store-related positions. In addition, the Company announced theelimination of approximately 70 positions at their corporate headquarters in Brooklyn Park, Minnesota and theirdistribution center in Las Vegas, Nevada and the closure of their distribution center in Las Vegas, Nevada.
Fiscal year
The Company’s fiscal year ends on the Saturday closest to January 31. The periods that will end or have endedFebruary 2, 2008, February 3, 2007, January 28, 2006, and January 29, 2005, are referred to herein as fiscal years2007, 2006, 2005, and 2004, respectively. Fiscal years 2007, 2005 and 2004 are 52 week years. Fiscal 2006consisted of 53 weeks.
Use of estimates
The preparation of financial statements in conformity with U.S. generally accepted accounting principles(“GAAP”) requires management to make estimates and assumptions that affect the reported amounts of assets andliabilities and disclosure of contingent assets and liabilities at the date of the financial statements and the reportedamounts of revenues and expenses during the reporting period. Matters of significance in which management relieson these estimates relate primarily to the realizability of assets, such as accounts receivable, property andequipment, and inventories, and the adequacy of certain accrued liabilities and reserves. Ultimate results coulddiffer from those estimates.
Fair values of financial instruments
The carrying value of the Company’s current financial assets and liabilities, because of their short-term nature,approximates fair value.
Cash and cash equivalents
Cash equivalents consist principally of short-term investments with original maturities of three months or lessand are recorded at cost, which approximates fair value. The short-term investments consist solely of money market
F-7

funds. Interest income of $1.6 million, $0.9 million and $0.3 million in fiscal years 2006, 2005 and 2004,respectively, is included in interest expense, net in the accompanying statements of operations.
Inventories
The Company values its inventories, which consist primarily of finished goods held for sale that have beenpurchased from domestic and foreign vendors, at the lower of cost or market value, determined by the retailinventory method on the last-in, first-out (“LIFO”) basis. As of February 3, 2007 and January 28, 2006, the LIFOcost of inventories approximated the first-in, first-out cost of inventories. The inventory cost includes the cost ofmerchandise, freight, duty, sourcing overhead, and other merchandise-specific charges. A periodic review ofinventory quantities on hand is performed to determine if inventory is properly stated at the lower of cost or market.Factors related to current inventories such as future consumer demand, fashion trends, current aging, current andanticipated retail markdowns, and class or type of inventory are analyzed to determine estimated net realizablevalues. A provision is recorded to reduce the cost of inventories to the estimated net realizable values, if required.
Permanent markdowns designated for clearance activity are recorded at the point of decision, when utility ofinventory has diminished, versus the point of sale. Factors considered in the determination of permanent mark-downs include current and anticipated demand, customer preferences, age of the merchandise, and style trends. Thecorresponding reduction to gross margin is also recorded in the period that the decision is made.
Shrinkage is estimated as a percentage of sales for the period from the last inventory date to the end of the fiscalyear. Physical inventories are taken at least biannually for all stores and distribution centers and inventory recordsare adjusted accordingly. The shrink rate for the most recent physical inventory, in combination with current eventsand historical experience, is used as the accrual rate to record shrink for the next inventory cycle.
Any significant unanticipated changes in the factors noted above could have a significant impact on the valueof the Company’s inventories and its reported operating results.
Inventories consisted of the following (in thousands):
February 3,2007
January 28,2006
Raw materials . . . . . . . . . . . . . . . . . . . . . . . . . . . . . . . . . . . . . . $ 2,940 $ 2,040
Finished goods . . . . . . . . . . . . . . . . . . . . . . . . . . . . . . . . . . . . . . 71,957 83,605
Total . . . . . . . . . . . . . . . . . . . . . . . . . . . . . . . . . . . . . . . . . . . $74,897 $85,645
Property and equipment
The Company’s property and equipment consist principally of store leasehold improvements and store fixturesand are included in the “Property and equipment” line item in its consolidated balance sheets included in this report.Leasehold improvements include the cost of improvements funded by landlord incentives and lease costs during thepre-opening period of construction, renovation, fixturing, and merchandise placement (the “build-out” period).Prior to the third quarter of 2005, the Company capitalized rental costs incurred during the build-out period.Beginning with the third quarter of 2005, the Company has expensed all such build-out period rental costs pursuantto Financial Accounting Standards Board (“FASB”) Staff Position No. FAS 13-1 (“FSP FAS 13-1”). Leaseholdimprovements are recorded at cost and are amortized using the straight-line method over the lesser of the applicablestore lease term or the estimated useful life. The typical initial lease term for the Company’s stores is 10 years andthe estimated useful lives of the assets range from three to 10 years. Capital additions required for lease extensionssubsequent to initial lease term are amortized over the term of the lease extension. Computer hardware and softwareand distribution center equipment are amortized over three to five years and 10 years, respectively. Property andequipment retired or disposed of are removed from cost and related accumulated depreciation accounts. Main-tenance and repairs are charged directly to expense as incurred. Major renewals or replacements are capitalized after
F-8
WILSONS THE LEATHER EXPERTS INC. AND SUBSIDIARIES
NOTES TO CONSOLIDATED FINANCIAL STATEMENTS—(Continued)

making the necessary adjustment to the asset and accumulated depreciation accounts for the items renewed orreplaced.
Store closing and impairment of long-lived assets
The Company continually reviews its stores’ operating performance and assesses plans for store closures.Losses related to the impairment of long-lived assets are recognized when expected future cash flows are less thanthe asset’s carrying value. When a store is closed or when a change in circumstances indicates the carrying value ofan asset may not be recoverable, the Company evaluates the carrying value of the asset in relation to its expectedfuture cash flows. If the carrying value is greater than the expected future cash flows, a provision is made for theimpairment of the asset to write the asset cost down to its estimated fair value. In the fourth quarter of 2006, theCompany determined, based on its most recent sales projections for various markets in which Wilsons Leather hasstores, that the current estimate of the future undiscounted cash flows in certain of these markets would not besufficient to recover the carrying value of those markets’ mall store fixed assets. Accordingly, the Companyrecorded an impairment loss of $0.7 million in the fourth quarter of 2006 related to those mall stores’ assets. Suchassets were written down to fair-value less the expected disposal value, if any, of such furniture, fixtures andequipment. The Company determined that these assets had no fair value, as the majority of such assets relate toleasehold improvements and other store-specific fixtures and equipment. This impairment charge was recorded as acomponent of selling, general and administrative expenses. During 2005 and 2004, the Company’s impairmenttesting did not indicate any impairment and no such charge was recorded in either year. As discussed in Note 2,“Reorganization and partial store liquidation,” accelerated depreciation was recorded in 2004 for the liquidationstores throughout the term of the liquidation sale.
When a store under a long-term lease is to be closed, the Company records a liability for any lease terminationor broker fees at the time an agreement related to such closing is executed. At February 3, 2007 and January 28,2006, the Company had no amounts accrued for store lease terminations.
Debt issuance costs
Debt issuance costs are amortized on a straight-line basis over the life of the related debt. Accumulatedamortization amounted to approximately $4.0 million and $3.9 million at February 3, 2007 and January 28, 2006,respectively. Amortization expense is included in interest expense in the accompanying consolidated statements ofoperations.
Operating leases
The Company has approximately 418 noncancelable operating leases, primarily for retail stores, which expireat various times through 2017. These leases generally require the Company to pay costs, such as real estate taxes,common area maintenance costs and contingent rentals based on sales. In addition, these leases generally includescheduled rent increases and may include rent holidays. The Company accounts for these scheduled rent increasesand rent holidays on a straight-line basis over the initial terms of the leases, including any rent holiday periods,commencing on the date the Company can take possession of the leased facility. Resulting liabilities are recorded asshort-term or long-term deferred rent liabilities as appropriate. Rent expense for lease extensions subsequent to theinitial lease terms are also calculated under a straight-line basis to the extent that they include scheduled rentincreases or rent holidays. In addition, leasehold improvements funded by landlord incentives are recorded as short-term or long-term deferred rent liabilities as appropriate. These liabilities are then amortized as a reduction of rentexpense on a straight-line basis over the life of the related lease. Prior to the third quarter of 2005, the Companycapitalized rental costs incurred during the build-out period. Beginning with the third quarter of 2005, the Companyhas expensed all such build-out period rental costs pursuant to FSP FAS 13-1.
F-9
WILSONS THE LEATHER EXPERTS INC. AND SUBSIDIARIES
NOTES TO CONSOLIDATED FINANCIAL STATEMENTS—(Continued)

Revenue recognition
The Company recognizes sales upon customer receipt of the merchandise generally at the point of sale. TheCompany has historically recognized layaway sales in full upon final payment and delivery of the merchandise tothe customer. All customer payments prior to the final payment were recorded as customer deposits and included inaccrued expenses in the Company’s balance sheet. As of December 2006, the Company’s layaway program wasdiscontinued and all layaway sales had been recognized by fiscal year end. Revenue for gift card sales and storecredits is recognized at redemption. A reserve is provided at the time of sale for projected merchandise returns basedupon historical experience. The Company recognizes revenue for on-line sales at the time goods are received by thecustomer. An allowance for on-line sales is recorded for shipments in-transit at period end, as product is shipped tothese customers Free on Board destination. Revenue on sales to wholesale customers is recognized upon the transferof title and risk of ownership to such customers, which is generally upon shipment, as our standard terms are Free onBoard origin. Wholesale revenue is recorded net of trade-term discounts and estimated returns and allowances.Generally, there are no return rights other than those for merchandise that is defective or in breach of any expresswarranties. Wholesale revenues may be recognized post shipment if the contractual shipping or right-of-returnterms differ from the Company’s standard terms.
Store opening costs
Non-capital expenditures, such as advertising and payroll costs related to new store openings, are charged toexpense as incurred.
Advertising costs
Advertising costs included in selling, general and administrative expenses, are expensed when incurred.Advertising costs amounted to $9.0 million, $8.5 million and $8.4 million, in 2006, 2005 and 2004, respectively.Included in the Company’s balance sheet in “Prepaid expenses” are prepaid advertising costs of approximately$0.7 million and less than $0.1 million as of February 3, 2007 and January 28, 2006, respectively.
Income taxes
Income taxes are accounted for under the asset and liability method. Deferred tax assets and liabilities arerecognized for the future tax consequences attributable to differences between the financial statement carryingamounts of existing assets and liabilities and their respective tax bases and operating loss and tax creditcarryforwards. Deferred tax assets and liabilities are measured using enacted tax rates expected to apply totaxable income in the years in which those temporary differences are expected to be recovered or settled. The effecton deferred tax assets and liabilities of a change in tax rates is recognized in income in the period that includes theenactment date. In light of cumulative losses over the past five fiscal years, the Company believes this it is morelikely than not that the Company’s net deferred tax asset will not be realized. Accordingly, a full valuationallowance has been recorded against the Company’s net deferred tax assets.
Sales taxes
The Company presents sales taxes on a net basis in its consolidated financial statements. For all periodspresented, the Company’s sales are recorded net of applicable sales taxes.
Foreign currency translation
The functional currency for the Company’s foreign operations is the applicable foreign currency. Thetranslation from the applicable foreign currency to U.S. dollars is performed for balance sheet accounts usingthe current exchange rate in effect at the balance sheet date and for revenue and expense accounts using a weightedaverage exchange rate during the period. The gains or losses resulting from such translation are included in
F-10
WILSONS THE LEATHER EXPERTS INC. AND SUBSIDIARIES
NOTES TO CONSOLIDATED FINANCIAL STATEMENTS—(Continued)
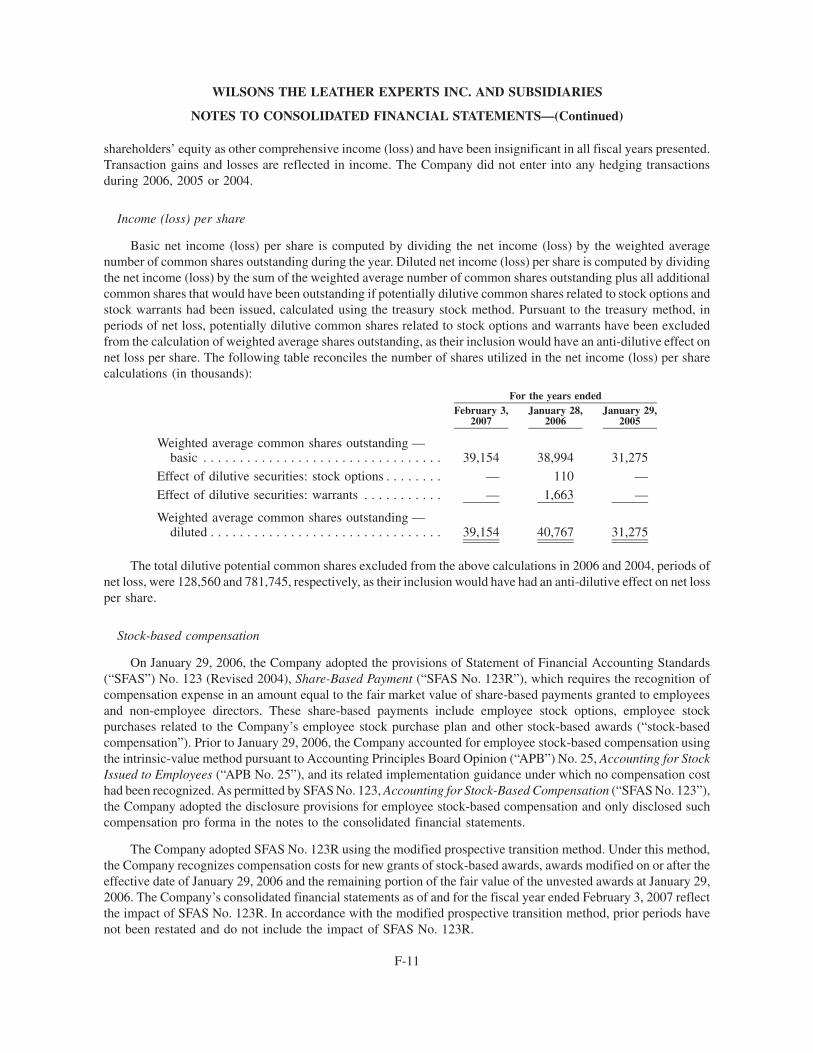
shareholders’ equity as other comprehensive income (loss) and have been insignificant in all fiscal years presented.Transaction gains and losses are reflected in income. The Company did not enter into any hedging transactionsduring 2006, 2005 or 2004.
Income (loss) per share
Basic net income (loss) per share is computed by dividing the net income (loss) by the weighted averagenumber of common shares outstanding during the year. Diluted net income (loss) per share is computed by dividingthe net income (loss) by the sum of the weighted average number of common shares outstanding plus all additionalcommon shares that would have been outstanding if potentially dilutive common shares related to stock options andstock warrants had been issued, calculated using the treasury stock method. Pursuant to the treasury method, inperiods of net loss, potentially dilutive common shares related to stock options and warrants have been excludedfrom the calculation of weighted average shares outstanding, as their inclusion would have an anti-dilutive effect onnet loss per share. The following table reconciles the number of shares utilized in the net income (loss) per sharecalculations (in thousands):
February 3,2007
January 28,2006
January 29,2005
For the years ended
Weighted average common shares outstanding —basic . . . . . . . . . . . . . . . . . . . . . . . . . . . . . . . . . 39,154 38,994 31,275
Effect of dilutive securities: stock options . . . . . . . . — 110 —
Effect of dilutive securities: warrants . . . . . . . . . . . — 1,663 —
Weighted average common shares outstanding —diluted . . . . . . . . . . . . . . . . . . . . . . . . . . . . . . . . 39,154 40,767 31,275
The total dilutive potential common shares excluded from the above calculations in 2006 and 2004, periods ofnet loss, were 128,560 and 781,745, respectively, as their inclusion would have had an anti-dilutive effect on net lossper share.
Stock-based compensation
On January 29, 2006, the Company adopted the provisions of Statement of Financial Accounting Standards(“SFAS”) No. 123 (Revised 2004), Share-Based Payment (“SFAS No. 123R”), which requires the recognition ofcompensation expense in an amount equal to the fair market value of share-based payments granted to employeesand non-employee directors. These share-based payments include employee stock options, employee stockpurchases related to the Company’s employee stock purchase plan and other stock-based awards (“stock-basedcompensation”). Prior to January 29, 2006, the Company accounted for employee stock-based compensation usingthe intrinsic-value method pursuant to Accounting Principles Board Opinion (“APB”) No. 25, Accounting for StockIssued to Employees (“APB No. 25”), and its related implementation guidance under which no compensation costhad been recognized. As permitted by SFAS No. 123, Accounting for Stock-Based Compensation (“SFAS No. 123”),the Company adopted the disclosure provisions for employee stock-based compensation and only disclosed suchcompensation pro forma in the notes to the consolidated financial statements.
The Company adopted SFAS No. 123R using the modified prospective transition method. Under this method,the Company recognizes compensation costs for new grants of stock-based awards, awards modified on or after theeffective date of January 29, 2006 and the remaining portion of the fair value of the unvested awards at January 29,2006. The Company’s consolidated financial statements as of and for the fiscal year ended February 3, 2007 reflectthe impact of SFAS No. 123R. In accordance with the modified prospective transition method, prior periods havenot been restated and do not include the impact of SFAS No. 123R.
F-11
WILSONS THE LEATHER EXPERTS INC. AND SUBSIDIARIES
NOTES TO CONSOLIDATED FINANCIAL STATEMENTS—(Continued)

SFAS No. 123R requires companies to measure the cost of stock-based awards based on the fair value of theaward at the date of grant. In measuring the value of stock-based compensation under SFAS No. 123R, or previouslyunder SFAS No. 123, the Company uses the Black-Scholes option pricing model to estimate the grant date fair valueof each stock-based award. The Company’s estimates of fair value are affected by the price of the Company’scommon stock, the nature of the share-based award and other complex and subjective variables including but notlimited to, expected term of the stock-based awards, the expected volatility of the Company’s stock price over theterm of the award and actual and projected employee stock option behavior.
The following weighted average assumptions were used in the Black-Scholes option pricing model to estimatethe grant date fair value of awards granted:
February 3,2007
January 28,2006
January 29,2005
For the years ended
Expected term (in years) . . . . . . . . . . . . . . . . . . . . 4.1 4.5 4.7
Expected volatility . . . . . . . . . . . . . . . . . . . . . . . . . 68.4% 69.5% 67.3%
Risk-free interest rate . . . . . . . . . . . . . . . . . . . . . . . 4.8% 3.9% 3.5%
Dividend yield . . . . . . . . . . . . . . . . . . . . . . . . . . . . 0.0% 0.0% 0.0%
Weighted average fair value of options granted . . . . $ 1.82 $ 3.35 $ 2.61
The weighted average expected term reflects the period of time for which options are expected to beoutstanding. That is, from grant date to expected exercise or other expected settlement. The Company’s calculationof expected term is based on historical experience of its option plans as well as expectations of future employeestock option behavior. The expected volatility of the Company’s stock price is based on the actual historicalvolatility over a period that is commensurate to the expected term of the option. The risk-free interest rate is basedon the average implied yield on U.S. Treasury instruments with a term approximating the expected term of theoption. The expected dividend yield is zero, as the Company has not declared a dividend in the past and the ability topay cash dividends in the future is limited by certain provisions in the Company’s senior credit facility.
The Company’s SFAS No. 123R fair value calculations are based on a single-option valuation approach andapplicable compensation cost is recognized on a straight-line basis over the vesting period of the stock-based award.A similar approach was taken for periods prior to January 29, 2006 under SFAS No. 123 for the required pro formadisclosures. In addition, the amount of stock-based compensation cost recognized during a period is based on thevalue of the portion of the awards that are ultimately expected to vest. SFAS No. 123R requires forfeitures to beestimated at the time of grant and revised, if necessary, in subsequent periods if actual forfeitures differ from thoseestimates. In the pro forma disclosures required under SFAS No. 123 for the periods prior to 2006, the Companyfactored estimated forfeitures as of the grant date into the compensation expense to be recognized. Pursuant toSFAS No. 123R, the stock-based compensation expense recognized in 2006 has been reduced for estimatedforfeitures. The estimated forfeiture rate is based on historical experience of the Company’s option plans and anyadjustment to the forfeiture rate in the future will result in a cumulative adjustment in the period that this estimate ischanged. Ultimately, the total compensation expense recognized for any given stock-based award over its vestingperiod will only be for those shares that actually vest.
Stock-based compensation expense recognized under SFAS No. 123R for 2006 totaled $2.3 million beforeincome taxes primarily for expenses related to employee stock options. All of the Company’s stock-basedcompensation is recognized as part of selling, general and administrative expenses. Had compensation cost forstock-based awards been determined and recorded consistent with SFAS No. 123 in prior years, the Company’s net
F-12
WILSONS THE LEATHER EXPERTS INC. AND SUBSIDIARIES
NOTES TO CONSOLIDATED FINANCIAL STATEMENTS—(Continued)

loss and basic and diluted net loss per share would have been the following pro forma amounts (in thousands, exceptper share amounts):
January 28,2006
January 29,2005
For the years ended
Net income (loss):As reported . . . . . . . . . . . . . . . . . . . . . . . . . . . . . . . . . . . . . . $12,212 $(23,583)
Stock based employee compensation expense included in netincome (loss) . . . . . . . . . . . . . . . . . . . . . . . . . . . . . . . . . . . — 828
Stock based employee compensation determined under fairvalue based method for all awards(1) . . . . . . . . . . . . . . . . . . (2,285) (2,987)
Pro forma income (loss) . . . . . . . . . . . . . . . . . . . . . . . . . . . . . $ 9,927 $(25,742)
Basic income (loss) per share:As reported . . . . . . . . . . . . . . . . . . . . . . . . . . . . . . . . . . . . . . $ 0.31 $ (0.75)
Stock based employee compensation expense included in netincome (loss) . . . . . . . . . . . . . . . . . . . . . . . . . . . . . . . . . . . — 0.03
Stock based employee compensation determined under fairvalue based method for all awards(1) . . . . . . . . . . . . . . . . . . (0.06) (0.10)
Basic pro forma income (loss). . . . . . . . . . . . . . . . . . . . . . . . . $ 0.25 $ (0.82)
Diluted income (loss) per share:As reported . . . . . . . . . . . . . . . . . . . . . . . . . . . . . . . . . . . . . . $ 0.30 $ (0.75)
Stock based employee compensation expense included in netincome (loss) . . . . . . . . . . . . . . . . . . . . . . . . . . . . . . . . . . . — 0.03
Stock based employee compensation determined under fairvalue based method for all awards(1) . . . . . . . . . . . . . . . . . . (0.06) (0.10)
Diluted pro forma income (loss) . . . . . . . . . . . . . . . . . . . . . . . $ 0.24 $ (0.82)
(1) For 2004, $1.1 million of pro forma expense was due to stock option acceleration from the private placementequity transaction that occurred in July of 2004. See Note 10, “Capital stock.”
For purposes of this pro forma disclosure, the value of the stock options was estimated using the Black-Scholesoption pricing model and amortized to expense over the options’ vesting periods. Pro forma disclosures for 2006 arenot presented, as the amounts are recognized in the consolidated financial statements.
In addition to the recognition of expense in the financial statements, under SFAS No. 123R, any excess taxbenefits received upon exercise of options are to be presented as financing activity inflow in the statement of cashflows. Prior to the adoption of SFAS No. 123R, all tax benefits resulting from the exercise of stock options wereincluded as operating cash flows. However, due to Wilsons Leather’s net operating loss carryforward position andthe valuation allowance recorded against the Company’s deferred tax assets, there is no cash flow effect for anyexcess tax benefits from stock option exercises for 2006. Excess tax benefits will be recorded when a deductionrealized for income tax purposes related to settlement of a stock-based award exceeds the compensation costsrecognized for financial reporting purposes.
New accounting pronouncements
In September 2006, the FASB issued SFAS No. 157, Fair Value Measurements (“SFAS No. 157”), which iseffective for fiscal years beginning after November 15, 2007 and for interim periods within those years. This
F-13
WILSONS THE LEATHER EXPERTS INC. AND SUBSIDIARIES
NOTES TO CONSOLIDATED FINANCIAL STATEMENTS—(Continued)
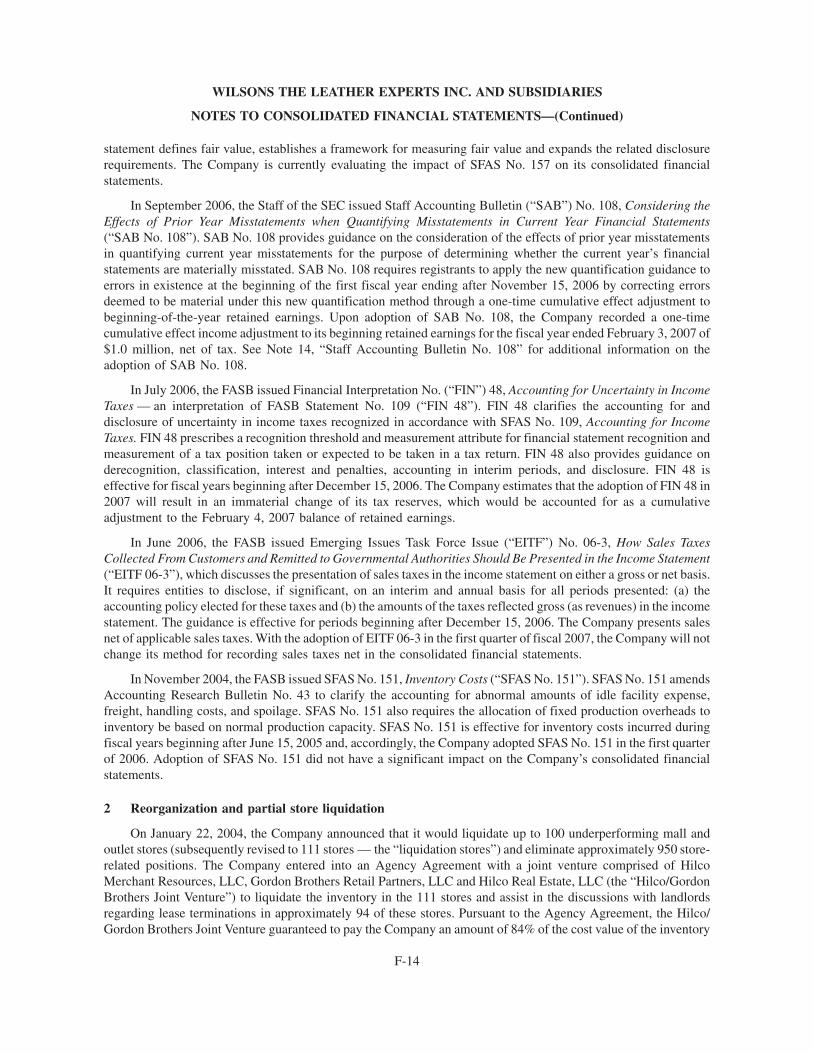
statement defines fair value, establishes a framework for measuring fair value and expands the related disclosurerequirements. The Company is currently evaluating the impact of SFAS No. 157 on its consolidated financialstatements.
In September 2006, the Staff of the SEC issued Staff Accounting Bulletin (“SAB”) No. 108, Considering theEffects of Prior Year Misstatements when Quantifying Misstatements in Current Year Financial Statements(“SAB No. 108”). SAB No. 108 provides guidance on the consideration of the effects of prior year misstatementsin quantifying current year misstatements for the purpose of determining whether the current year’s financialstatements are materially misstated. SAB No. 108 requires registrants to apply the new quantification guidance toerrors in existence at the beginning of the first fiscal year ending after November 15, 2006 by correcting errorsdeemed to be material under this new quantification method through a one-time cumulative effect adjustment tobeginning-of-the-year retained earnings. Upon adoption of SAB No. 108, the Company recorded a one-timecumulative effect income adjustment to its beginning retained earnings for the fiscal year ended February 3, 2007 of$1.0 million, net of tax. See Note 14, “Staff Accounting Bulletin No. 108” for additional information on theadoption of SAB No. 108.
In July 2006, the FASB issued Financial Interpretation No. (“FIN”) 48, Accounting for Uncertainty in IncomeTaxes — an interpretation of FASB Statement No. 109 (“FIN 48”). FIN 48 clarifies the accounting for anddisclosure of uncertainty in income taxes recognized in accordance with SFAS No. 109, Accounting for IncomeTaxes. FIN 48 prescribes a recognition threshold and measurement attribute for financial statement recognition andmeasurement of a tax position taken or expected to be taken in a tax return. FIN 48 also provides guidance onderecognition, classification, interest and penalties, accounting in interim periods, and disclosure. FIN 48 iseffective for fiscal years beginning after December 15, 2006. The Company estimates that the adoption of FIN 48 in2007 will result in an immaterial change of its tax reserves, which would be accounted for as a cumulativeadjustment to the February 4, 2007 balance of retained earnings.
In June 2006, the FASB issued Emerging Issues Task Force Issue (“EITF”) No. 06-3, How Sales TaxesCollected From Customers and Remitted to Governmental Authorities Should Be Presented in the Income Statement(“EITF 06-3”), which discusses the presentation of sales taxes in the income statement on either a gross or net basis.It requires entities to disclose, if significant, on an interim and annual basis for all periods presented: (a) theaccounting policy elected for these taxes and (b) the amounts of the taxes reflected gross (as revenues) in the incomestatement. The guidance is effective for periods beginning after December 15, 2006. The Company presents salesnet of applicable sales taxes. With the adoption of EITF 06-3 in the first quarter of fiscal 2007, the Company will notchange its method for recording sales taxes net in the consolidated financial statements.
In November 2004, the FASB issued SFAS No. 151, Inventory Costs (“SFAS No. 151”). SFAS No. 151 amendsAccounting Research Bulletin No. 43 to clarify the accounting for abnormal amounts of idle facility expense,freight, handling costs, and spoilage. SFAS No. 151 also requires the allocation of fixed production overheads toinventory be based on normal production capacity. SFAS No. 151 is effective for inventory costs incurred duringfiscal years beginning after June 15, 2005 and, accordingly, the Company adopted SFAS No. 151 in the first quarterof 2006. Adoption of SFAS No. 151 did not have a significant impact on the Company’s consolidated financialstatements.
2 Reorganization and partial store liquidation
On January 22, 2004, the Company announced that it would liquidate up to 100 underperforming mall andoutlet stores (subsequently revised to 111 stores — the “liquidation stores”) and eliminate approximately 950 store-related positions. The Company entered into an Agency Agreement with a joint venture comprised of HilcoMerchant Resources, LLC, Gordon Brothers Retail Partners, LLC and Hilco Real Estate, LLC (the “Hilco/GordonBrothers Joint Venture”) to liquidate the inventory in the 111 stores and assist in the discussions with landlordsregarding lease terminations in approximately 94 of these stores. Pursuant to the Agency Agreement, the Hilco/Gordon Brothers Joint Venture guaranteed to pay the Company an amount of 84% of the cost value of the inventory
F-14
WILSONS THE LEATHER EXPERTS INC. AND SUBSIDIARIES
NOTES TO CONSOLIDATED FINANCIAL STATEMENTS—(Continued)

at the liquidation stores, subject to certain adjustments. The Hilco/Gordon Brothers Joint Venture was responsiblefor all expenses related to the sale. The liquidation stores were selected based on strategic criteria, includingnegative sales and earnings trends, projected real estate costs, location, and financial conditions within the market.In addition, the Company announced that it would eliminate approximately 70 positions at its corporate head-quarters in Brooklyn Park, Minnesota and its distribution center in Las Vegas, Nevada, close its distribution centerin Las Vegas, Nevada and write off essentially all remaining assets located at its distribution centers in Maple Grove,Minnesota and Las Vegas, Nevada.
The Company recorded charges related to the restructuring and partial store liquidation of $27.4 million during2004 primarily related to the transfer of inventory to an independent liquidator in conjunction with the closing of theliquidation stores, lease termination costs, accelerated depreciation, asset write-offs related to store closings,severance, and other restructuring charges. In 2004, a total of $17.4 million and $13.8 million of these charges wererecorded in selling, general and administrative expenses and depreciation and amortization, respectively, aspartially offset by $3.8 million of gross margin earned on the liquidation sales. The liquidation sales were completedin April 2004 and as of May 1, 2004, all the liquidation stores had been closed. As of October 30, 2004, theCompany had successfully negotiated all of its lease terminations.
3 Discontinued operations
In November 2002, the Company liquidated its Travel Subsidiaries (El Portal Group, Inc., Bentley’s LuggageCorp. and Florida Luggage Corp.), which were presented as a discontinued operation. In 2004, the Companyrecorded $0.3 million in income from discontinued operations representing the reversal of the 2004 balance of thediscontinued operations liabilities, related to lease termination and store closing costs, that were no longer required.This resulted in $0.2 million in income from discontinued operations net of tax, or $0.01 net income per share. As ofFebruary 3, 2007 and January 28, 2006, there were no assets or liabilities related to the discontinued operations ofthe Company.
4 Other assets
Other assets consisted of the following (in thousands):
February 3,2007
January 28,2006
Debt issuance costs . . . . . . . . . . . . . . . . . . . . . . . . . . . . . . . . . . $ 5,219 $ 5,384
Less—Accumulated amortization . . . . . . . . . . . . . . . . . . . . . . . . (4,027) (3,867)
Debt issuance costs, net . . . . . . . . . . . . . . . . . . . . . . . . . . . . . . . 1,192 1,517
Other intangible assets, net . . . . . . . . . . . . . . . . . . . . . . . . . . . . . 58 59
Total . . . . . . . . . . . . . . . . . . . . . . . . . . . . . . . . . . . . . . . . . . . $ 1,250 $ 1,576
Other intangible assets are being amortized over periods of five to 15 years. Amortization expense related toother intangible assets for the year ended February 3, 2007 was insignificant. Future amortization expense for eachof the five succeeding fiscal years, based on the other intangible assets as of February 3, 2007, will be insignificant.
F-15
WILSONS THE LEATHER EXPERTS INC. AND SUBSIDIARIES
NOTES TO CONSOLIDATED FINANCIAL STATEMENTS—(Continued)

5 Accounts receivable
Accounts receivable consisted of the following (in thousands):
February 3,2007
January 28,2006
Trade receivables . . . . . . . . . . . . . . . . . . . . . . . . . . . . . . . . . . . . $2,359 $2,579
Other receivables . . . . . . . . . . . . . . . . . . . . . . . . . . . . . . . . . . . . 929 1,641
Total . . . . . . . . . . . . . . . . . . . . . . . . . . . . . . . . . . . . . . . . . . . 3,288 4,220
Less—Allowance for doubtful accounts . . . . . . . . . . . . . . . . . . . (71) (76)
Less—Deferred sales(1). . . . . . . . . . . . . . . . . . . . . . . . . . . . . . . . (85) (81)
Total . . . . . . . . . . . . . . . . . . . . . . . . . . . . . . . . . . . . . . . . . . . $3,132 $4,063
(1) Deferred in-transit e-commerce sales.
6 Property and equipment
Property and equipment consisted of the following (in thousands):
February 3,2007
January 28,2006
Equipment and furniture . . . . . . . . . . . . . . . . . . . . . . . . . . . . . . . $ 74,420 $ 75,250
Leasehold improvements . . . . . . . . . . . . . . . . . . . . . . . . . . . . . . 42,700 40,101
Total . . . . . . . . . . . . . . . . . . . . . . . . . . . . . . . . . . . . . . . . . . . 117,120 115,351
Less—Accumulated depreciation and amortization . . . . . . . . . . . (78,230) (74,306)
Net property and equipment . . . . . . . . . . . . . . . . . . . . . . . . . . $ 38,890 $ 41,045
7 Accrued expenses
Accrued expenses consisted of the following (in thousands):
February 3,2007
January 28,2006
Compensation and benefits . . . . . . . . . . . . . . . . . . . . . . . . . . . . . $ 5,137 $ 6,155
Taxes other than income taxes . . . . . . . . . . . . . . . . . . . . . . . . . . 2,002 2,759
Rent . . . . . . . . . . . . . . . . . . . . . . . . . . . . . . . . . . . . . . . . . . . . . 2,695 2,786
Other . . . . . . . . . . . . . . . . . . . . . . . . . . . . . . . . . . . . . . . . . . . . . 4,700 4,895
Total . . . . . . . . . . . . . . . . . . . . . . . . . . . . . . . . . . . . . . . . . . . $14,534 $16,595
8 Long-term debt
Long-term debt consisted of the following (in thousands):
February 3,2007
January 28,2006
Term B promissory note . . . . . . . . . . . . . . . . . . . . . . . . . . . . . . . $20,000 $20,000
Less: current portion . . . . . . . . . . . . . . . . . . . . . . . . . . . . . . . . . — —
Total long-term debt . . . . . . . . . . . . . . . . . . . . . . . . . . . . . . . . $20,000 $20,000
F-16
WILSONS THE LEATHER EXPERTS INC. AND SUBSIDIARIES
NOTES TO CONSOLIDATED FINANCIAL STATEMENTS—(Continued)

Term B promissory note and senior credit facility
General Electric Capital Corporation and a syndicate of banks have provided the Company with a senior creditfacility, as amended, that provides for borrowings of up to $135.0 million in aggregate principal amount, including a$20.0 million Term B promissory note and a $75.0 million letter of credit subfacility. The senior credit facilityexpiration is June 30, 2010, at which time all borrowings, including the Term B promissory note, become due andpayable.
The Term B promissory note is collateralized by the Company’s equipment. The remainder of the senior creditfacility is collateralized by the Company’s inventory, equipment, credit card and wholesale receivables, andsubstantially all other personal property. Through the third quarter of 2005, interest was payable on revolving creditborrowings at variable rates determined by the applicable LIBOR (seven to 30 days) plus 1.50%, or the prime rateplus 0.25% (commercial paper rate plus 1.50% if the loan is made under the “swing line” portion of the revolver).Commencing with the fourth quarter of 2005, interest was payable on revolving credit borrowings at variable ratesdetermined by the applicable LIBOR plus 1.25% to 1.75%, or the prime rate plus 0.0% to 0.5% (commercial paperrate plus 1.25% to 1.75% if the loan is made under the “swing line” portion of the revolver). With respect to the TermB promissory note, the interest rate in 2005 was the prime rate plus 4.0%, plus an additional 2.75% pursuant to aseparate letter agreement with General Electric Capital Corporation. On January 31, 2006, the Company executedanother letter agreement with General Electric Capital Corporation whereby the additional 2.75% was no longerapplicable. As of December 29, 2006, interest is payable on revolving credit borrowings at variable rates determinedby the applicable LIBOR plus 1.25% to 1.75%, or the prime rate plus 0.0% to 0.5% (commercial paper plus 1.25%to 1.75% if the loan is made under the “swing line” portion of the revolver). Interest is payable on the Term Bpromissory note at a variable rate equal to the LIBOR plus 4.0%. The applicable margins will be adjusted quarterlyon a prospective basis as determined by the previous quarters’ ratio of borrowings to borrowing availability. TheCompany pays monthly fees of 0.25% per annum on the unused portion of the senior credit facility, as defined, andper annum fees on the average daily amount of letters of credit outstanding during each month ranging from .625%to .875% in the case of trade letters of credit and from 1.25% to 1.75% in the case of standby letters of credit. Suchfees are subject to quarterly adjustment in the same manner as our interest rate margins. Prepayment of the Term Bpromissory note is payable only with the consent of the senior lenders. Any such prepayment would be subject to a1.0% prepayment fee if prepayment is made on or prior to June 30, 2008, and a 0.5% prepayment fee if prepaymentis made after June 30, 2008 but on or prior to June 30, 2009. After June 30, 2009, any remaining balance of the TermB promissory note is prepayable without penalty. The revolving credit portion of the senior credit facility is subjectto a 1.0% prepayment fee under most circumstances.
The senior credit facility contains certain restrictions and covenants, which, among other things, restrict theCompany’s ability to acquire or merge with another entity; make investments, loans or guarantees; incur additionalindebtedness; create liens or other encumbrances; or pay cash dividends or make other distributions. At February 3,2007, the Company was in compliance with all covenants related to the senior credit facility.
Wilsons Leather plans to use the senior credit facility for immediate and future working capital needs. TheCompany is dependent on the senior credit facility to fund working capital and letter of credit needs. Based on theCompany’s current 2007 plan, the Company believes that the borrowing capacity under its senior credit facility,together with cash on hand, current and anticipated cash flow from operations, and cost reductions associated withthe Company’s lower store count will be adequate to meet its working capital and capital expenditure requirementsthrough the first half of 2008. However, if the Company’s comparable store sales do not increase as planned in thesecond half of 2007, the Company expects that additional financing may be needed in 2008 in order to fund itsworking capital and capital expenditure requirements. Even if the Company’s performance during 2007 is on trackwith plan, the Company may also seek to obtain additional financing during 2007 for 2008 working capital needs aswell as the ability to accelerate implementation of its merchandise and brand acceptance strategies. The Company iscurrently exploring various financing strategies. There can be no assurance that additional financing would bepossible or could be obtained on terms favorable to the Company, or at all.
F-17
WILSONS THE LEATHER EXPERTS INC. AND SUBSIDIARIES
NOTES TO CONSOLIDATED FINANCIAL STATEMENTS—(Continued)

At February 3, 2007 and January 28, 2006, there were no borrowings under the revolving portion of the seniorcredit facility. At February 3, 2007 and January 28, 2006, there were $3.8 million and $4.3 million, respectively, inletters of credit outstanding. The Term B promissory note had a balance of $20.0 million on February 3, 2007 andJanuary 28, 2006.
As of February 3, 2007, annual debt maturities were as follows (in thousands):
2007 . . . . . . . . . . . . . . . . . . . . . . . . . . . . . . . . . . . . . . . . . . . . . . . . . . . . . . . . . $ —
2008 . . . . . . . . . . . . . . . . . . . . . . . . . . . . . . . . . . . . . . . . . . . . . . . . . . . . . . . . . —
2009 . . . . . . . . . . . . . . . . . . . . . . . . . . . . . . . . . . . . . . . . . . . . . . . . . . . . . . . . . —
2010 . . . . . . . . . . . . . . . . . . . . . . . . . . . . . . . . . . . . . . . . . . . . . . . . . . . . . . . . . 20,000
$20,000
9 Income taxes
The income tax benefit is comprised of the following (in thousands):
February 3,2007
January 28,2006
January 29,2005
For the years ended
Current
Federal . . . . . . . . . . . . . . . . . . . . . . . . . . . . . . . $(2,708) $ 1,551 $ (94)
State . . . . . . . . . . . . . . . . . . . . . . . . . . . . . . . . . (1,836) 895 537
Deferred . . . . . . . . . . . . . . . . . . . . . . . . . . . . . . 167 (5,532) (2,626)
Total . . . . . . . . . . . . . . . . . . . . . . . . . . . . . . . $(4,377) $(3,086) $(2,183)
Reconciliations between the benefit for income taxes and the amount computed by applying the statutoryfederal income tax rate are as follows (in thousands):
February 3,2007
January 28,2006
January 29,2005
For the years ended
Tax at statutory rate (35%) . . . . . . . . . . . . . . . . . . . $(13,115) $ 3,194 $(9,078)
State income taxes, net of federal benefit . . . . . . . . (3,075) 582 (1,249)
Change in valuation allowance . . . . . . . . . . . . . . . . 12,188 33 6,415
Adjustment of deferred tax balances . . . . . . . . . . . . 167 (5,565) 855
Adjustment of tax contingency reserves . . . . . . . . . (947) (1,571) 396
Other . . . . . . . . . . . . . . . . . . . . . . . . . . . . . . . . . . . 405 241 478
Total . . . . . . . . . . . . . . . . . . . . . . . . . . . . . . . . . $ (4,377) $(3,086) $(2,183)
During 2006, the Company released state tax reserves of $0.9 million due to expiration of statutes. During2005, in connection with the Internal Revenue Service’s examination and acceptance of the Company’s income taxreturns for the periods ended July 1997 through July 2003, the Company released federal tax reserves of$1.7 million. This reserve release was offset in part by 2005 state tax reserve increases.
F-18
WILSONS THE LEATHER EXPERTS INC. AND SUBSIDIARIES
NOTES TO CONSOLIDATED FINANCIAL STATEMENTS—(Continued)
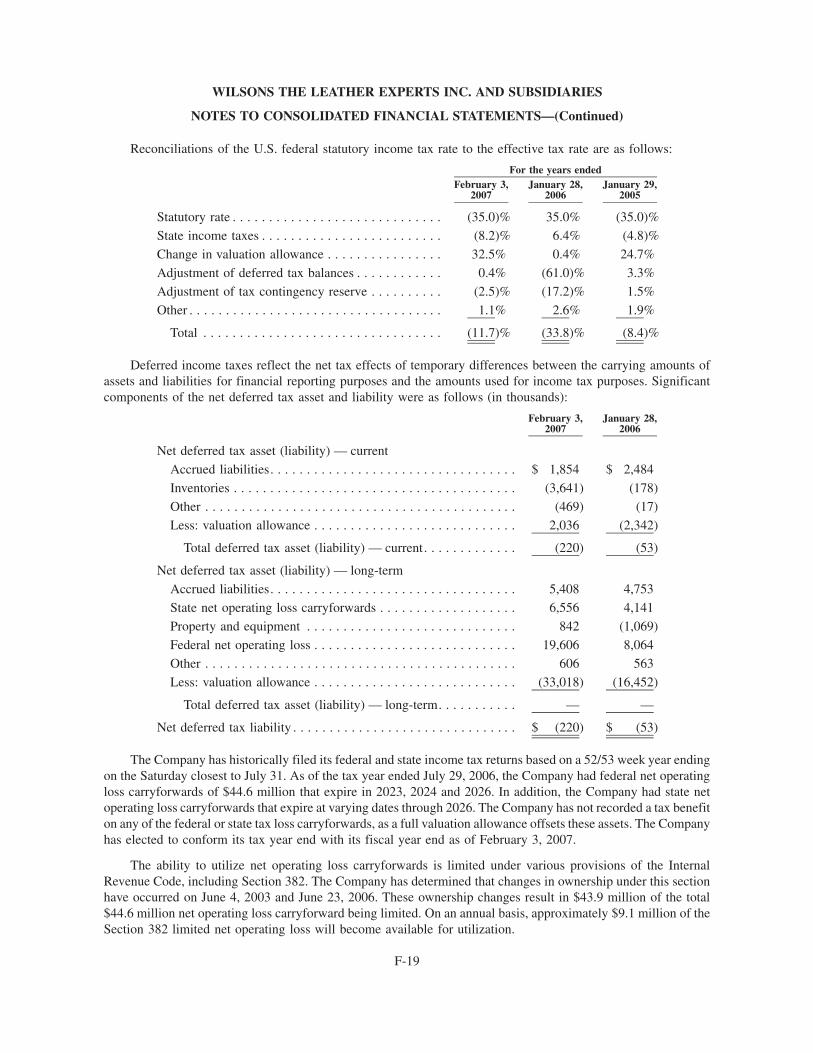
Reconciliations of the U.S. federal statutory income tax rate to the effective tax rate are as follows:
February 3,2007
January 28,2006
January 29,2005
For the years ended
Statutory rate . . . . . . . . . . . . . . . . . . . . . . . . . . . . . (35.0)% 35.0% (35.0)%
State income taxes . . . . . . . . . . . . . . . . . . . . . . . . . (8.2)% 6.4% (4.8)%
Change in valuation allowance . . . . . . . . . . . . . . . . 32.5% 0.4% 24.7%
Adjustment of deferred tax balances . . . . . . . . . . . . 0.4% (61.0)% 3.3%
Adjustment of tax contingency reserve . . . . . . . . . . (2.5)% (17.2)% 1.5%
Other . . . . . . . . . . . . . . . . . . . . . . . . . . . . . . . . . . . 1.1% 2.6% 1.9%
Total . . . . . . . . . . . . . . . . . . . . . . . . . . . . . . . . . (11.7)% (33.8)% (8.4)%
Deferred income taxes reflect the net tax effects of temporary differences between the carrying amounts ofassets and liabilities for financial reporting purposes and the amounts used for income tax purposes. Significantcomponents of the net deferred tax asset and liability were as follows (in thousands):
February 3,2007
January 28,2006
Net deferred tax asset (liability) — current
Accrued liabilities. . . . . . . . . . . . . . . . . . . . . . . . . . . . . . . . . . $ 1,854 $ 2,484
Inventories . . . . . . . . . . . . . . . . . . . . . . . . . . . . . . . . . . . . . . . (3,641) (178)
Other . . . . . . . . . . . . . . . . . . . . . . . . . . . . . . . . . . . . . . . . . . . (469) (17)
Less: valuation allowance . . . . . . . . . . . . . . . . . . . . . . . . . . . . 2,036 (2,342)
Total deferred tax asset (liability) — current. . . . . . . . . . . . . (220) (53)
Net deferred tax asset (liability) — long-term
Accrued liabilities. . . . . . . . . . . . . . . . . . . . . . . . . . . . . . . . . . 5,408 4,753
State net operating loss carryforwards . . . . . . . . . . . . . . . . . . . 6,556 4,141
Property and equipment . . . . . . . . . . . . . . . . . . . . . . . . . . . . . 842 (1,069)
Federal net operating loss . . . . . . . . . . . . . . . . . . . . . . . . . . . . 19,606 8,064
Other . . . . . . . . . . . . . . . . . . . . . . . . . . . . . . . . . . . . . . . . . . . 606 563
Less: valuation allowance . . . . . . . . . . . . . . . . . . . . . . . . . . . . (33,018) (16,452)
Total deferred tax asset (liability) — long-term. . . . . . . . . . . — —
Net deferred tax liability . . . . . . . . . . . . . . . . . . . . . . . . . . . . . . . $ (220) $ (53)
The Company has historically filed its federal and state income tax returns based on a 52/53 week year endingon the Saturday closest to July 31. As of the tax year ended July 29, 2006, the Company had federal net operatingloss carryforwards of $44.6 million that expire in 2023, 2024 and 2026. In addition, the Company had state netoperating loss carryforwards that expire at varying dates through 2026. The Company has not recorded a tax benefiton any of the federal or state tax loss carryforwards, as a full valuation allowance offsets these assets. The Companyhas elected to conform its tax year end with its fiscal year end as of February 3, 2007.
The ability to utilize net operating loss carryforwards is limited under various provisions of the InternalRevenue Code, including Section 382. The Company has determined that changes in ownership under this sectionhave occurred on June 4, 2003 and June 23, 2006. These ownership changes result in $43.9 million of the total$44.6 million net operating loss carryforward being limited. On an annual basis, approximately $9.1 million of theSection 382 limited net operating loss will become available for utilization.
F-19
WILSONS THE LEATHER EXPERTS INC. AND SUBSIDIARIES
NOTES TO CONSOLIDATED FINANCIAL STATEMENTS—(Continued)
In evaluating the Company’s ability to recover deferred tax assets, the Company has considered all availablepositive and negative evidence including: past operating results, the existence of cumulative losses in the mostrecent fiscal years, forecasts of future taxable income including the reversal of temporary differences, and theimplementation of feasible and prudent tax planning strategies. In light of cumulative losses over the past five fiscalyears, the Company believes that it is more likely than not that the Company’s net deferred tax asset will not berealized. Accordingly, a full valuation allowance has been recorded against the Company’s net deferred tax assets.Of the total valuation allowance, approximately $0.3 million will be allocated directly to equity if and when thatportion of the valuation allowance is reversed.
During 2005, the Company identified a tax planning strategy that allowed it to maintain a valuation allowanceon its net deferred tax assets inclusive of its tax basis LIFO reserve. Historically, the Company’s deferred taxliability related to its tax basis LIFO reserve was excluded when determining the amount of required valuationallowance. The result of this tax planning strategy was the recognition of a deferred tax benefit of $1.0 million in2005.
As discussed in Note 3, “Discontinued operations,” the Company liquidated its travel business in 2002. By theend of the fourth quarter of 2004, the Company determined that the accruals for store closing activities were nolonger required and included the remaining $0.3 million in income from discontinued operations, $0.2 million netof tax.
10 Capital stock
Private placement offering
On April 25, 2004, the Company entered into an agreement to issue 17,948,718 shares of the Company’scommon stock (the “Equity Financing”) to three institutional investors at a price of $1.95 per share. The transactionclosed on July 2, 2004, with gross proceeds before offering expenses of $35.0 million. As additional considerationfor the investors’ commitment, on April 25, 2004, the Company issued two million warrants exercisable for fiveyears to the investors upon signing the Equity Financing agreement, and at closing issued an additional two millionwarrants exercisable for five years, all at an exercise price of $3.00 per share of common stock. All four million ofthe warrants issued contain certain weighted average anti-dilution rights as defined in the Common Stock andWarrant Purchase Agreement. On July 9, 2004, the Company repurchased $22.0 million of the then outstanding111⁄4% Senior Notes with proceeds from the Equity Financing. The Company used $8.6 million of the proceeds fromthe Equity Financing to repay the balance of the 111⁄4% Senior Notes at maturity. The balance of the proceeds havebeen used for general working capital purposes.
The relative fair value of the warrants and common stock sold, determined using the Black-Scholes model, wasallocated within additional paid-in capital at closing. The Equity Financing qualified as a “change in control”pursuant to the Company’s equity compensation plans. As such, vesting was accelerated on all outstanding unvestedstock options and restricted stock as of July 2, 2004.
11 Employee stock benefit plans
Stock options
The Company has adopted the amended 1996 Stock Option Plan (the “1996 Plan”), the 1998 Stock OptionPlan (the “1998 Plan”) and the Amended and Restated 2000 Long Term Incentive Plan (the “2000 Plan”)(col-lectively the “Plans”), pursuant to which options to acquire an aggregate of 6,450,000 shares of its common stockmay be granted. As of February 3, 2007, the 1996 Plan had expired and no future awards may be granted under it. Inaddition, with the adoption of the 2000 Plan, no further grants are to be made under the 1998 Plan.
The Compensation Committee of the board of directors is responsible for administering the Plans and approvesgrants in connection therewith. The 2000 Plan provides that the Compensation Committee may grant incentive
F-20
WILSONS THE LEATHER EXPERTS INC. AND SUBSIDIARIES
NOTES TO CONSOLIDATED FINANCIAL STATEMENTS—(Continued)

stock options, non-qualified stock options, stock appreciation rights, non-vested shares (restricted stock), perfor-mance share awards, and other stock-based awards, and determine the terms and conditions of each grant. Alloutstanding stock options granted since the Company became a publicly held corporation have been granted at anoption price equal to the fair market value of the common stock on the date of grant and generally vest,cumulatively, on a prorated basis on the first, second and third anniversaries from the date of the grant and expirefive to 10 years from the date of grant. In addition, the stock options generally provide for accelerated vesting ifthere is a change in control (as defined in the Plans).
The following is a summary of stock option information, weighted average exercise prices and remainingcontractual life (in years) for the Company’s stock option plans:
Shares
WeightedAverageExercise
Price
WeightedAverage
RemainingLife Shares
WeightedAverageExercise
Price Shares
WeightedAverageExercise
Price
February 3, 2007 January 28, 2006 January 29, 2005As of and for the years ended
Outstanding, beginning of year . . 3,470,736 $ 6.79 2,427,222 $ 8.22 1,953,924 $10.16
Granted . . . . . . . . . . . . . . . . . 429,000 $ 3.20 2,513,000 $ 5.81 745,850 $ 4.52
Exercised . . . . . . . . . . . . . . . . (44,040) $ 2.92 (162,100) $ 3.66 (15,600) $ 3.96
Forfeited . . . . . . . . . . . . . . . . . (380,329) $ 5.52 (706,333) $ 5.65 (14,833) $ 6.74
Expired. . . . . . . . . . . . . . . . . . (753,120) $10.28 (601,053) $10.63 (242,119) $12.91
Outstanding, end of year . . . . . . . 2,722,247 $ 5.50 3.7 3,470,736 $ 6.79 2,427,222 $ 8.22
Exercisable, end of year . . . . . . . 1,122,283 $ 6.10 3.9 1,214,070 $ 8.82 1,852,222 $ 9.21
Available for grant, end of year . . 1,439,568 1,570,455 576,069
During 2006, the total intrinsic value of options exercised (the difference between the market price at exerciseand the price paid by optionees to exercise the option) was $32,815 and the total amount of cash received from theexercise of these options was $128,396. As of February 3, 2007, total unrecognized compensation costs related tounvested stock-based awards was $3.3 million, which is expected to be recognized over a weighted average vestingperiod of approximately 1.6 years.
F-21
WILSONS THE LEATHER EXPERTS INC. AND SUBSIDIARIES
NOTES TO CONSOLIDATED FINANCIAL STATEMENTS—(Continued)

The following table summarizes information about the weighted average remaining contracted life (in years),the weighted average exercise prices and the aggregate intrinsic value for stock options outstanding as of February 3,2007:
Range ofExercise Prices
Number ofOptions
WeightedAverage
RemainingLife
WeightedAverageExercise
PriceAggregate
Intrinsic ValueNumber of
Options
WeightedAverageExercise
PriceAggregate
Intrinsic Value
Options Outstanding Options ExercisableOptions Outstanding and Exercisable by Price Range as of February 3, 2007
$ 2.07 - $ 4.14 630,750 3.3 $ 3.28 $— 151,418 $ 3.36 $—
$ 4.14 - $ 6.21 1,865,235 3.8 $ 5.72 — 830,600 $ 5.63 —
$ 6.21 - $ 8.28 145,427 3.4 $ 6.72 — 59,430 $ 6.70 —
$ 8.28 - $10.34 8,928 1.4 $ 9.40 — 8,928 $ 9.40 —
$10.34 - $12.41 8,851 2.5 $11.15 — 8,851 $11.15 —
$12.41 - $14.48 8,550 3.5 $14.16 — 8,550 $14.16 —
$14.48 - $16.55 32,981 3.7 $16.03 — 32,981 $16.03 —
$16.55 - $18.62 2,325 3.4 $16.94 — 2,325 $16.94 —
$18.62 - $20.69 19,200 0.2 $19.92 — 19,200 $19.92 —
2,722,247 3.7 $ 5.50 $— 1,122,283 $ 6.10 $—
The aggregate intrinsic value in the preceding table represents the total pretax intrinsic value of in-the-moneystock options based on Wilsons Leather’s closing stock price of $1.96 as of February 3, 2007, which would havebeen received by the option holders had all such options been exercised as of that date. As of February 3, 2007,based on the weighted average exercise price, there were no outstanding in-the-money stock options.
A summary of the Company’s unvested stock options as of February 3, 2007 and changes during the year endedFebruary 3, 2007 is as follows:
Shares
WeightedAverage GrantDate Fair Value
Unvested, beginning of period . . . . . . . . . . . . . . . . . . . . . . . . 2,256,666 $3.28
Granted . . . . . . . . . . . . . . . . . . . . . . . . . . . . . . . . . . . . . . . 429,000 $1.82
Vested . . . . . . . . . . . . . . . . . . . . . . . . . . . . . . . . . . . . . . . . (705,373) $3.27
Forfeited . . . . . . . . . . . . . . . . . . . . . . . . . . . . . . . . . . . . . . (380,329) $3.19
Unvested, end of period . . . . . . . . . . . . . . . . . . . . . . . . . . . . . 1,599,964 $2.92
Non-vested shares and other stock-related awards
The Company can and has awarded non-vested share awards (restricted stock grants) to selected employeesunder the 2000 Plan. These non-vested share awards generally vested ratably over four years from the date of grant,subject to acceleration if certain performance targets were met. As of July 2004, all unvested outstanding non-vested share awards became vested due to a change in control pursuant to the Company’s Plans, defined above.There have been no non-vested share awards granted since that time. Under SFAS No. 123R, the fair value of anyfuture non-vested share awards will be estimated on the grant date based on the then current market value of theCompany’s stock and will be amortized to compensation expense on a straight-line basis over the related vestingperiod. The total number of non-vested share awards expected to vest will be adjusted by an estimated forfeiturerate.
F-22
WILSONS THE LEATHER EXPERTS INC. AND SUBSIDIARIES
NOTES TO CONSOLIDATED FINANCIAL STATEMENTS—(Continued)

Under the 2000 Plan, the Company may also issue other stock-based awards. Beginning with the Company’sAnnual Meeting of Shareholders held on June 1, 2006, each member of the Board of Directors who is not an officeror employee of the Company receives one-half of their $25,000 annual retainer in unrestricted shares of theCompany’s common stock. In the second quarter of 2006, 17,120 shares of the Company’s common stock wereissued as annual retainers. These fully vested shares were issued based on the $3.65 fair market value of theCompany’s common stock on the day preceding the Annual Meeting of Shareholders.
Employee stock purchase plan
The Company has an employee stock purchase plan (“ESPP”) that is qualified under Section 423 of theInternal Revenue Code of 1986. Employees are entitled to have payroll deductions withheld that are used topurchase company stock at a 15% discount at defined times during the year. The Company has allowed for625,000 shares of common stock to be purchased under the ESPP. As of February 3, 2007, 427,647 shares had beenissued under the plan and 197,353 were available for future issuance. Prior to January 29, 2006, under APB No. 25,the Company was not required to recognize stock-based compensation expense for the cost of stock options orshares issued under the ESPP. However, based on the provisions of the ESPP regarding purchase discounts, the planis deemed compensatory under SFAS No. 123R. As such, compensation expense is recognized for the fair value ofthe option features of the ESPP purchases subsequent to January 29, 2006. The ESPP fair value is estimated usingthe Black-Scholes option pricing model with applicable assumptions and input variables. Stock-based compen-sation expense recognized under SFAS No. 123R during 2006 related to the ESPP was insignificant.
12 401(k) profit sharing plan
The Company has a defined contribution 401(k) profit sharing plan for eligible employees, which is qualifiedunder Sections 401(a) and 401(k) of the Internal Revenue Code of 1986. Employees are entitled to make taxdeferred contributions of up to 30% of their eligible compensation, subject to annual IRS limitations. As ofJanuary 1, 2006, for employees who have worked more than one year, the Company matches 100% of contributions,up to a maximum of 3% of the employee’s eligible compensation and 50% of contributions up to the next 2% ofeligible compensation. These Company matching contributions are 100% vested when made. Prior to January 1,2006, for employees who had worked less than three years but more than one year, the Company matched 25% ofcontributions, up to a maximum of 4% of the employee’s eligible compensation and for employees who had workedmore than three years, the Company matched 50% of contributions, up to a maximum of 4% of the employee’seligible compensation. These Company matching contributions vest after three years of service or upon death of theemployee. Company contributions net of forfeitures were $0.5 million, $0.3 million and $0.0 million, in 2006, 2005and 2004, respectively. The Company may also, at its discretion, make a profit sharing contribution to the 401(k)plan for each plan year. The Company’s profit sharing contributions vest after five years. No profit sharingcontributions were made during the years 2004 through 2006.
13 Commitments and contingencies
Leases
The Company has noncancelable operating leases, primarily for retail stores, which expire through 2017. Alimited number of the leases contain renewal options for periods ranging from one to five years. These leasesgenerally require the Company to pay costs, such as real estate taxes, common area maintenance costs and
F-23
WILSONS THE LEATHER EXPERTS INC. AND SUBSIDIARIES
NOTES TO CONSOLIDATED FINANCIAL STATEMENTS—(Continued)

contingent rentals based on sales. Net rental expense for all operating leases, excluding real estate taxes andcommon area maintenance costs, was as follows (in thousands):
February 3,2007
January 28,2006
January 29,2005
For the years ended
Minimum rentals . . . . . . . . . . . . . . . . . . . . . . . . . . $36,755 $37,591 $38,667
Contingent rentals . . . . . . . . . . . . . . . . . . . . . . . . . 1,110 2,002 1,680
Total . . . . . . . . . . . . . . . . . . . . . . . . . . . . . . . . . $37,865 $39,593 $40,347
As of February 3, 2007, the future minimum net rental payments due under operating leases were as follows (inthousands):
Fiscal years ending:
2007 . . . . . . . . . . . . . . . . . . . . . . . . . . . . . . . . . . . . . . . . . . . . . . . . . . . . $ 33,343
2008 . . . . . . . . . . . . . . . . . . . . . . . . . . . . . . . . . . . . . . . . . . . . . . . . . . . . 30,107
2009 . . . . . . . . . . . . . . . . . . . . . . . . . . . . . . . . . . . . . . . . . . . . . . . . . . . . 27,522
2010 . . . . . . . . . . . . . . . . . . . . . . . . . . . . . . . . . . . . . . . . . . . . . . . . . . . . 23,464
2011 . . . . . . . . . . . . . . . . . . . . . . . . . . . . . . . . . . . . . . . . . . . . . . . . . . . . 17,407
Thereafter. . . . . . . . . . . . . . . . . . . . . . . . . . . . . . . . . . . . . . . . . . . . . . . . . 36,269
Total . . . . . . . . . . . . . . . . . . . . . . . . . . . . . . . . . . . . . . . . . . . . . . . . . $168,112
License agreements
The Company has entered into license agreements that provide for royalty payments ranging from 1.0% to17.0% of net sales or a flat dollar amount per unit purchased of the applicable licensed products. Future minimumroyalty payments required under these agreements are $0.6 million, $0.2 million, $0.1 million, and $0.1 million in2007, 2008, 2009, and 2010, respectively.
Litigation
In September 2005, the Company became aware of a kickback scheme involving its General Manager—Asiaand certain vendors. On October 4, 2005, the General Manager—Asia admitted that he had received kickbacks fromcertain vendors over a period of eight years aggregating nearly $4.0 million. The General Manager—Asia wasterminated and the Company’s Audit Committee and outside auditors were informed of the acknowledgedkickbacks and the termination. On October 14, 2005, the Company’s Audit Committee retained outside counsel,and outside counsel investigated the extent of the kickback scheme, whether other employees were involved in orhad knowledge of the kickbacks or similar arrangements and whether any violations of the Foreign CorruptPractices Act had occurred in connection with the kickback arrangements. The investigation by outside counsel didnot indicate that any employee other than the General Manager— Asia was involved in, or had previous knowledgeof, the kickback scheme or similar arrangements or that there were any violations of the Foreign Corrupt PracticesAct. The investigation also did not indicate that the magnitude of the kickbacks exceeded, or were less than, thenearly $4.0 million acknowledged by the former General Manager—Asia. Subsequent to his termination, theformer General Manager—Asia paid Wilsons Leather approximately $0.5 million, which was recorded as areduction of cost of sales in 2005. The acknowledged kickback arrangements did not have a material impact on theCompany’s previously issued financial statements.
The Company is involved in various other legal actions arising in the ordinary course of business. In theopinion of management, the ultimate disposition of these matters will not have a material adverse effect on theCompany’s consolidated financial position and results of operations.
F-24
WILSONS THE LEATHER EXPERTS INC. AND SUBSIDIARIES
NOTES TO CONSOLIDATED FINANCIAL STATEMENTS—(Continued)

Guarantees
As of February 3, 2007 and January 28, 2006, the Company had outstanding letters of credit of approximately$3.8 million and $4.3 million, respectively, which were primarily used to guarantee foreign merchandise purchaseorders. See Note 8, “Long-term debt.”
Gain contingency
In December 2006, the Company received $0.6 million from the VISA/MasterCard antitrust litigationsettlement concerning alleged wrongful inflation of interchange fees. The Company recorded a gain of $0.6 millionin the fourth quarter of 2006 related to these proceeds as a reduction of selling, general and administrative expenses.
14 Staff Accounting Bulletin No. 108
As discussed under New Accounting Pronouncements in Note 1, “Summary of significant accountingpolicies,” in September 2006, the SEC released SAB No. 108. The transition provisions of SAB No. 108 permitthe Company to adjust for the cumulative effect on retained earnings of errors relating to prior years deemed to beimmaterial under an income statement approach that are material under the balance sheet approach. The Companyadopted SAB No. 108 effective the beginning of the fiscal year ended February 3, 2007. In accordance withSAB No. 108, the Company has increased beginning retained earnings for fiscal 2006 by $1.0 million in theaccompanying consolidated financial statements for the items described below.
Accounting for rent expense
The Company adjusted its beginning retained earnings for fiscal 2006 related to a historical misstatement ofrent expense and prepaid rent as a result of the Company’s 52 or 53 week fiscal year. It was determined that theCompany had understated prepaid rent as of January 28, 2006, by $0.5 million as a result of using a calendar versusfiscal month end to determine rent expense. The Company has historically recorded rent expense and applicableprepaid rent balances on a monthly basis, expensing one-twelfth of the annual amount in each month. This methoddid not match the Company’s fiscal month ends. As a result, 2005 rent expense was overstated by a cumulative$0.5 million, net of tax, and the current asset of prepaid rent was understated by a corresponding amount.
Professional service fees
The Company adjusted its beginning retained earnings for fiscal 2006 related to a historical difference inaccounting for professional service fees. It was determined that the Company had overstated professional servicefees expense in the prior fiscal year by $0.5 million by accruing for fees related to the prior fiscal year that had notyet been incurred as of year end. The Company has historically accrued for annual professional service fees relatedto audit services and annual report preparation for a given fiscal year and expensed those fees ratably over theapplicable fiscal period as compared to expensing only those fees actually incurred in a given period. As a result,2005 professional service fees recorded in selling, general and administrative expenses was overstated by acumulative $0.5 million, net of tax, and other accrued expenses within current liabilities was overstated by acorresponding amount.
15 Revision of financial statements
In the third quarter of 2006, the Company determined that its presentation of certain investing activities withinits consolidated statement of cash flows had been misstated. Prior to that time, the amounts previously reported asbeing capitalized as “additions to property and equipment” included amounts accrued for and/or unpaid at period-end. As a result, “net cash used in investing activities”, “accounts payable and accrued expenses” and “net cash(used in) provided by operating activities” were misstated by an equivalent amount. These misstatements had noimpact on the Company’s net cash flow, consolidated statements of operations or balance sheets. A summary of the
F-25
WILSONS THE LEATHER EXPERTS INC. AND SUBSIDIARIES
NOTES TO CONSOLIDATED FINANCIAL STATEMENTS—(Continued)

effects of these changes on the Company’s consolidated statement of cash flows for 2005 and 2004 is presentedbelow (in thousands):
As previouslyReported Adjustments Revised
For the year ended January 28, 2006Accounts payable and accrued expenses. . . . . . . $(12,025) $(276) $(12,301)
Net cash provided by operating activities . . . . 11,234 (276) 10,958
Additions to property and equipment . . . . . . . . . (10,567) 276 (10,291)
Net cash used in investing activities . . . . . . . . (10,262) 276 (9,986)
For the year ended January 29, 2005Accounts payable and accrued expenses. . . . . . . $ 2,183 $ 32 $ 2,215
Net cash provided by operating activities . . . . 11,014 32 11,046
Additions to property and equipment . . . . . . . . . (4,753) (32) (4,785)
Net cash used in investing activities . . . . . . . . (4,520) (32) (4,552)
16 Sale/leaseback of headquarters facility
During June 2002, the Company entered into an agreement for the sale and leaseback of its corporateheadquarters and distribution center in Brooklyn Park, Minnesota, for net proceeds of $12.5 million. The initialterm of the lease is 15 years, with an option to renew for an additional five-year period. The agreement includes anoption for the Company to buy out the lease at the end of the tenth year for a price of $0.5 million. The lease isclassified as an operating lease in accordance with SFAS No. 13, Accounting for Leases.
The net book value of the building approximated $3.1 million and has been removed from the accounts. The$9.4 million gain on the sale has been deferred and the appropriate amounts properly classified under short- andlong-term liabilities. The short-term portion is included in “accrued expenses” and the long-term portion is includedin “other long-term liabilities” on the balance sheet. Payments under the lease approximated $1.4 million for thefirst year, with an annual increase of 2.5% each year thereafter.
17 Related-party transactions
In 2006, Richard Liu, Chairman of one of the Company’s major suppliers (Superior Holdings International,Ltd.), was a greater than 5% shareholder of the Company’s common stock. The Company purchased $5.9 million,$11.3 million and $10.8 million of products from Superior Holdings International, Ltd. during 2006, 2005 and 2004,respectively. As of February 3, 2007, there was no balance owed by the Company to Superior HoldingsInternational, Ltd. The Company believes that transactions with Superior Holdings International, Ltd. are onterms no less favorable to it than those obtainable in arm’s-length transactions with unaffiliated third parties.
18 Subsequent events
On February 12, 2007, the Company amended its senior credit facility. The senior credit facility was amendedto properly state the interest rate applicable to borrowings made under the “swing line” portion of the revolvingcredit facility (commercial paper rate plus 1.25% to 1.75%).
F-26
WILSONS THE LEATHER EXPERTS INC. AND SUBSIDIARIES
NOTES TO CONSOLIDATED FINANCIAL STATEMENTS—(Continued)

Schedule II
Balance atBeginningof Period
Charged toCosts andExpenses
Chargedto OtherAccounts Deductions
Balanceat End of
Period
AdditionsValuation and Qualifying Accounts
(In thousands)
Year ended January 29, 2005:Allowance for doubtful accounts deducted from
accounts receivable . . . . . . . . . . . . . . . . . . . . $88 $506 $— $(518) $76
Year ended January 28, 2006:Allowance for doubtful accounts deducted from
accounts receivable . . . . . . . . . . . . . . . . . . . . $76 $425 $— $(425) $76
Year ended February 3, 2007:Allowance for doubtful accounts deducted from
accounts receivable . . . . . . . . . . . . . . . . . . . . $76 $277 $— $(282) $71
F-27

Unless otherwise indicated, all documents incorporated herein by reference to a document filed with theSecurities and Exchange Commission pursuant to the Securities Exchange Act, as amended, are located under theSEC file number 0-21543.
EXHIBIT INDEXExhibit
No. Description Method of Filing
3.1 Amended and Restated Articles of Incorporation of Wilsons The LeatherExperts Inc. adopted June 16, 1998, as amended by the Articles ofAmendment dated February 17, 2000, and the Articles of Amendmentdated May 23, 2002.(1). . . . . . . . . . . . . . . . . . . . . . . . . . . . . . . . . . . . . . Incorporated by Reference
3.2 Restated Bylaws of Wilsons The Leather Experts Inc. as amended June 16,1998, January 25, 2000, May 23, 2002, and February 5, 2004.(2) . . . . . . . Incorporated by Reference
4.1 Specimen of common stock certificate.(3) . . . . . . . . . . . . . . . . . . . . . . . . Incorporated by Reference
4.2 Registration Rights Agreement dated as of May 25, 1996, by and amongCVS New York, Inc. (formerly known as Melville Corporation), WilsonsThe Leather Experts Inc., the Managers listed on the signature pagesthereto, Leather Investors Limited Partnership I and the Partners listedon the signature pages thereto.(4) . . . . . . . . . . . . . . . . . . . . . . . . . . . . . . Incorporated by Reference
4.3 Amendment to Registration Rights Agreement dated as of August 12, 1999,by and among Wilsons The Leather Experts Inc. and the Shareholders listedon the attachments thereto.(5) . . . . . . . . . . . . . . . . . . . . . . . . . . . . . . . . . Incorporated by Reference
4.4 Common Stock and Warrant Purchase Agreement, dated as of April 25,2004, by and among Wilsons The Leather Experts Inc. and the purchasersidentified on the signatory pages thereto (the “Purchase Agreement”).(6). . Incorporated by Reference
4.5 Registration Rights Agreement, dated as of April 25, 2004, by and amongWilsons The Leather Experts Inc. and the investors identified therein.(7). . Incorporated by Reference
4.6 Form of Warrant issued to the Purchasers named in the Purchase Agreementon April 25, 2004.(8) . . . . . . . . . . . . . . . . . . . . . . . . . . . . . . . . . . . . . . . Incorporated by Reference
10.1 Parent Guaranty dated as of May 25, 1996, by Wilsons The Leather ExpertsInc., Wilsons Center, Inc., Rosedale Wilsons, Inc. and River Hills Wilsons,Inc. in favor of General Electric Capital Corporation.(9) . . . . . . . . . . . . . Incorporated by Reference
*10.2 Corporate Leadership Team Incentive Plan, as amended.(10) . . . . . . . . . . Incorporated by Reference
*10.3 Wilsons The Leather Experts Inc. 401(k) Plan.(11). . . . . . . . . . . . . . . . . . Incorporated by Reference
10.4 Fifth Amended and Restated Credit Agreement dated as of December 29,2006, among Wilsons Leather Holdings Inc., General Electric CapitalCorporation, as Agent, Lender, Term Lender and Swing Line Lender,and the Credit Parties and Lenders signatory thereto.(12) . . . . . . . . . . . . . Incorporated by Reference
10.5 Store Guarantors’ Guaranty dated as of May 25, 1996, by Bermans TheLeather Experts, Inc., Wilsons House of Suede, Inc., Wilsons Tannery West,Inc., the Georgetown Subsidiaries that are signatories thereto and theIndividual Store Subsidiaries that are signatories thereto, in favor ofGeneral Electric Capital Corporation.(13) . . . . . . . . . . . . . . . . . . . . . . . . Incorporated by Reference
*10.6 Wilsons The Leather Experts Inc. Amended 1996 Stock Option Plan.(3). . Incorporated by Reference
10.7 Joinder Agreement dated as of May 24, 1999, by and between the StoreGuarantors that are signatories thereto and General Electric CapitalCorporation.(14) . . . . . . . . . . . . . . . . . . . . . . . . . . . . . . . . . . . . . . . . . . . Incorporated by Reference
10.8 Pledge Agreement dated as of May 24, 1999, by and between WilsonsLeather of Delaware Inc. and General Electric Capital Corporation,individually and as agent for the lenders signatory to the CreditAgreement.(15) . . . . . . . . . . . . . . . . . . . . . . . . . . . . . . . . . . . . . . . . . . . . Incorporated by Reference
10.9 Pledge Agreement dated as of May 24, 1999, between WilsonsInternational, Inc. and General Electric Capital Corporation, individuallyand as agent for the lenders signatory to the Credit Agreement.(16) . . . . . Incorporated by Reference

ExhibitNo. Description Method of Filing
10.10 Pledge Agreement dated as of May 25, 1996, between Wilsons The LeatherExperts Inc. and General Electric Capital Corporation, individually and asagent for the lenders signatory to the Credit Agreement.(17) . . . . . . . . . . Incorporated by Reference
10.11 Pledge Agreement dated as of May 25, 1996, between Wilsons Center, Inc.and General Electric Capital Corporation, individually and as agent for thelenders signatory to the Credit Agreement.(18). . . . . . . . . . . . . . . . . . . . . Incorporated by Reference
10.12 Pledge Agreement dated as of May 25, 1996, between Rosedale Wilsons,Inc. and General Electric Capital Corporation, individually and as agent forthe lenders signatory to the Credit Agreement.(19) . . . . . . . . . . . . . . . . . . Incorporated by Reference
10.13 Pledge Agreement dated as of May 25, 1996, between River Hills Wilsons,Inc. and General Electric Capital Corporation, individually and as agent forthe lenders signatory to the Credit Agreement.(20) . . . . . . . . . . . . . . . . . . Incorporated by Reference
10.14 Amendment No. 2 to Pledge Agreement dated as of July 31, 1997, betweenRiver Hills Wilsons, Inc. and General Electric Capital Corporation.(21) . . Incorporated by Reference
10.15 Joinder Agreement dated as of July 31, 1997, by and between WilsonsInternational Inc. and General Electric Capital Corporation.(22) . . . . . . . . Incorporated by Reference
10.16 Wilsons The Leather Experts Inc. 1998 Stock Option Plan.(23) . . . . . . . . Incorporated by Reference
10.17 Amended and Restated Security Agreement dated as of June 19, 2001, byand among Wilsons Leather Holdings Inc. and the other Grantors listed onthe signature pages thereto, in favor of General Electric CapitalCorporation, in its capacity as Agent for Lenders.(24) . . . . . . . . . . . . . . . Incorporated by Reference
10.18 Joinder Agreement dated as of October 31, 2000, by and between the StoreGuarantors that are signatories thereto and General Electric CapitalCorporation.(25) . . . . . . . . . . . . . . . . . . . . . . . . . . . . . . . . . . . . . . . . . . . Incorporated by Reference
10.19 Pledge Amendment dated as of October 31, 2000, by River Hills Wilsons,Inc.(26) . . . . . . . . . . . . . . . . . . . . . . . . . . . . . . . . . . . . . . . . . . . . . . . . . Incorporated by Reference
10.20 Pledge Agreement dated as of October 31, 2000, by and between WWT, Inc.and General Electric Capital Corporation, individually and as agent for thelenders signatory to the Credit Agreement.(27). . . . . . . . . . . . . . . . . . . . . Incorporated by Reference
*10.21 Wilsons The Leather Experts Inc. Amended and Restated 2000 Long TermIncentive Plan.(28) . . . . . . . . . . . . . . . . . . . . . . . . . . . . . . . . . . . . . . . . . Incorporated by Reference
10.22 Joinder Agreement dated as of April 13, 2001, by and between the StoreGuarantors that are signatory thereto and General Electric CapitalCorporation.(29) . . . . . . . . . . . . . . . . . . . . . . . . . . . . . . . . . . . . . . . . . . . Incorporated by Reference
10.23 Pledge Amendment, dated as of April 13, 2001, by WWT, Inc.(30) . . . . . Incorporated by Reference
10.24 Pledge Agreement, dated as of April 13, 2001, between Bentley’s LuggageCorp. and General Electric Capital Corporation, individually and as agentfor the lenders signatory to the Credit Agreement.(31) . . . . . . . . . . . . . . . Incorporated by Reference
10.25 Lease, IRET Properties Landlord to Bermans The Leather Experts, Inc.Tenant, dated June 21, 2002.(32) . . . . . . . . . . . . . . . . . . . . . . . . . . . . . . . Incorporated by Reference
*10.26 Wilsons The Leather Experts Inc. Employee Stock Purchase Plan, asamended.(33) . . . . . . . . . . . . . . . . . . . . . . . . . . . . . . . . . . . . . . . . . . . . . Incorporated by Reference
10.27 Joinder Agreement dated as of October 10, 2000, by and between WilsonsLeather Direct Inc. and General Electric Capital Corporation.(34) . . . . . . . Incorporated by Reference
*10.28 Form of Non-Statutory Stock Option Agreement (Director) pursuant to the1996 Stock Option Plan.(35) . . . . . . . . . . . . . . . . . . . . . . . . . . . . . . . . . . Incorporated by Reference
*10.29 Form of Non-Statutory Stock Option Agreement (Associate) pursuant to the1996 Stock Option Plan.(36) . . . . . . . . . . . . . . . . . . . . . . . . . . . . . . . . . . Incorporated by Reference
*10.30 Form of Non-Statutory Stock Option Agreement (Director) pursuant to the2000 Long Term Incentive Plan.(37) . . . . . . . . . . . . . . . . . . . . . . . . . . . . Incorporated by Reference
*10.31 Form of Non-Statutory Stock Option Agreement (Associate) pursuant to the2000 Long Term Incentive Plan.(38) . . . . . . . . . . . . . . . . . . . . . . . . . . . . Incorporated by Reference

ExhibitNo. Description Method of Filing
*10.32 Form of Restricted Stock Agreement (Associate) pursuant to the 2000 LongTerm Incentive Plan.(39) . . . . . . . . . . . . . . . . . . . . . . . . . . . . . . . . . . . . . Incorporated by Reference
*10.33 Employment Agreement, dated as of November 22, 2004, between theCompany and Michael M. Searles.(40) . . . . . . . . . . . . . . . . . . . . . . . . . . Incorporated by Reference
*10.34 Form of Non-Statutory Stock Option Agreement between the Company andMichael M. Searles.(41) . . . . . . . . . . . . . . . . . . . . . . . . . . . . . . . . . . . . . Incorporated by Reference
*10.35 Waiver and Modification, dated March 2, 2005, under EmploymentAgreement dated November 22, 2004, between Michael Searles and theCompany.(42) . . . . . . . . . . . . . . . . . . . . . . . . . . . . . . . . . . . . . . . . . . . . . Incorporated by Reference
*10.36 Amendment to Employment Agreement dated as of September 14, 2005, byand between Michael M. Searles and the Company.(43) . . . . . . . . . . . . . . Incorporated by Reference
10.37 Letter Agreement dated December 29, 2006, between Wilsons LeatherHoldings Inc. and General Electric Capital Corporation. . . . . . . . . . . . . Electronic Transmission
10.38 Second Amendment to Employment Agreement dated as of December 21,2006 by and between the Company and Michael M. Searles.(44) . . . . . . . Incorporated by Reference
10.39 Reaffirmation of Guaranty dated as of December 29, 2006 by Wilsons TheLeather Experts Inc., Wilsons Center, Inc., Rosedale Wilsons, Inc., RiverHills Wilsons, Inc. and the Store Guarantors listed on the signature pagesthereto in favor of General Electric Capital Corporation as Agent forLenders.(45) . . . . . . . . . . . . . . . . . . . . . . . . . . . . . . . . . . . . . . . . . . . . . . Incorporated by Reference
10.40 First Amendment to Fifth Amended and Restated Credit Agreement datedas of February 12, 2007, among Wilsons Leather Holdings Inc., GeneralElectric Capital Corporation, as Agent, Lender, Term Lender and SwingLine Lender, and the Credit Parties and Lenders signatory thereto. . . . . . Electronic Transmission
10.41 Offer Letter dated March 2, 2006 between Megan L. Featherston and theCompany. . . . . . . . . . . . . . . . . . . . . . . . . . . . . . . . . . . . . . . . . . . . . . . . Electronic Transmission
14.1 Code of Business Ethics and Conduct.(46) . . . . . . . . . . . . . . . . . . . . . . . . Incorporated by Reference
21.1 Subsidiaries of Wilsons The Leather Experts Inc. . . . . . . . . . . . . . . . . . Electronic Transmission
23.1 Consent of KPMG LLP . . . . . . . . . . . . . . . . . . . . . . . . . . . . . . . . . . . . . Electronic Transmission
31.1 Certification of Chief Executive Officer pursuant to Section 302 of theSarbanes-Oxley Act of 2002. . . . . . . . . . . . . . . . . . . . . . . . . . . . . . . . . Electronic Transmission
31.2 Certification of Chief Financial Officer pursuant to Section 302 of theSarbanes-Oxley Act of 2002. . . . . . . . . . . . . . . . . . . . . . . . . . . . . . . . . Electronic Transmission
32.1 Certification of Chief Executive Officer pursuant to Section 1350,Chapter 63 of Title 18, United States Code, as adopted pursuant toSection 906 of the Sarbanes-Oxley Act of 2002. . . . . . . . . . . . . . . . . . . Electronic Transmission
32.2 Certification of Chief Financial Officer pursuant to Section 1350,Chapter 63 of Title 18, United States Code, as adopted pursuant toSection 906 of the Sarbanes-Oxley Act of 2002. . . . . . . . . . . . . . . . . . . Electronic Transmission
* Management contract, compensating plan or arrangement required to be filed as an exhibit to this AnnualReport on Form 10-K.
(1) Incorporated by reference to the same numbered exhibit to the Company’s Report on Form 10-Q for thequarter ended May 4, 2002.
(2) Incorporated by reference to the same numbered exhibit to the Company’s Report on Form 10-K for the fiscalyear ended January 29, 2005.
(3) Incorporated by reference to the same numbered exhibit to Amendment No. 1 to the Company’s RegistrationStatement on Form S-1 (333-13967) filed with the Commission on December 24, 1996.
(4) Incorporated by reference to Exhibit 4.8 to the Company’s Registration Statement on Form S-1 (333-13967)filed with the Commission on October 11, 1996.
(5) Incorporated by reference to the same numbered exhibit to the Company’s Report on Form 10-K for the fiscalyear ended January 29, 2000, filed with the Commission.
(6) Incorporated by reference to Exhibit 4.1 to the Company’s Current Report on Form 8-K dated April 26, 2004.
(7) Incorporated by reference to Exhibit 4.2 to the Company’s Current Report on Form 8-K dated April 26, 2004.
(8) Incorporated by reference to Exhibit 4.3 to the Company’s Current Report on Form 8-K dated April 26, 2004.
(9) Incorporated by reference to Exhibit 10.8 to the Company’s Report on Form 10-Q for the quarter endedAugust 2, 1997, filed with the Commission.
(10) Incorporated by reference to Exhibit 10.1 to the Company’s Current Report on Form 8-K, filed with theCommission on September 19, 2005.
(11) Incorporated by Reference to Exhibit 10.3 to the Company’s Report on Form 10-K for the fiscal year endedFebruary 2, 2002, filed with the Commission.
(12) Incorporated by reference to Exhibit 10.1 to the Company’s Current Report on Form 8-K, filed with theCommission on January 5, 2007.
(13) Incorporated by reference to Exhibit 10.10 to the Company’s Report on Form 10-Q for the quarter endedAugust 2, 1997, filed with the Commission.
(14) Incorporated by reference to Exhibit 10.3 to the Company’s Report on Form 10-Q for the quarter ended May 1,1999, filed with the Commission.
(15) Incorporated by reference to Exhibit 10.4 to the Company’s Report on Form 10-Q for the quarter ended May 1,1999, filed with the Commission.
(16) Incorporated by reference to Exhibit 10.5 to the Company’s Report on Form 10-Q for the quarter ended May 1,1999, filed with the Commission.
(17) Incorporated by reference to Exhibit 10.21 to Amendment No. 4 to the Company’s Registration Statement onForm S-1 (333-13967) filed with the Commission on May 27, 1997.
(18) Incorporated by reference to Exhibit 10.22 to Amendment No. 4 to the Company’s Registration Statement onForm S-1 (333-13967) filed with the Commission on May 27, 1997.
(19) Incorporated by reference to Exhibit 10.23 to Amendment No. 4 to the Company’s Registration Statement onForm S-1 (333-13967) filed with the Commission on May 27, 1997.
(20) Incorporated by reference to Exhibit 10.24 to Amendment No. 4 to the Company’s Registration Statement onForm S-1 (333-13967) filed with the Commission on May 27, 1997.
(21) Incorporated by reference to Exhibit 10.6 to the Company’s Report on Form 10-Q for the quarter endedAugust 2, 1997, filed with the Commission.
(22) Incorporated by reference to Exhibit 10.7 to the Company’s Report on Form 10-Q for the quarter endedAugust 2, 1997, filed with the Commission.
(23) Incorporated by reference to Exhibit 10.1 to the Company’s Current Report on Form 8-K, filed with theCommission on June 2, 2005.
(24) Incorporated by reference to Exhibit 10.2 to the Company’s Report on Form 8-K filed with the Commission onJune 25, 2001.
(25) Incorporated by reference to Exhibit 10.4 to the Company’s Report on Form 10-Q for the quarter endedOctober 28, 2000, filed with the Commission.
(26) Incorporated by reference to Exhibit 10.5 to the Company’s Report on Form 10-Q for the quarter endedOctober 28, 2000, filed with the Commission.
(27) Incorporated by reference to Exhibit 10.6 to the Company’s Report on Form 10-Q for the quarter endedOctober 28, 2000, filed with the Commission.
(28) Incorporated by reference to Exhibit 99.1 to the Company’s Registration Statement on Form S-8 (333-109977)filed with the Commission on October 24, 2003.
(29) Incorporated by reference to Exhibit 10.1 to the Company’s Report on Form 10-Q for the quarter ended May 5,2001, filed with the Commission.
(30) Incorporated by reference to Exhibit 10.2 to the Company’s Report on Form 10-Q for the quarter ended May 5,2001, filed with the Commission.

(31) Incorporated by reference to Exhibit 10.3 to the Company’s Report on Form 10-Q for the quarter ended May 5,2001, filed with the Commission.
(32) Incorporated by reference to Exhibit 10.2 to the Company’s Report on Form 10-Q for the quarter endedAugust 3, 2002, filed with the Commission.
(33) Incorporated by reference to Exhibit 10.2 to the Company’s Report on Form 10-Q for the quarter ended May 3,2003, filed with the Commission.
(34) Incorporated by reference to Exhibit 10.33 to the Company’s Report on Form 10-K for the year endedFebruary 3, 2001, filed with the Commission.
(35) Incorporated by reference to Exhibit 10.4 to the Company’s Report on Form 8-Q for the quarter ended July 31,2004.
(36) Incorporated by reference to Exhibit 10.5 to the Company’s Report on Form 8-Q for the quarter ended July 31,2004.
(37) Incorporated by reference to Exhibit 10.6 to the Company’s Report on Form 8-Q for the quarter ended July 31,2004.
(38) Incorporated by reference to Exhibit 10.1 to the Company’s Report on Form 10-Q for the quarter endedOctober 30, 2004.
(39) Incorporated by reference to Exhibit 10.8 to the Company’s Report on Form 8-Q for the quarter ended July 31,2004.
(40) Incorporated by reference to Exhibit 10.1 to the Company’s Report on Form 8-K filed with the Commission onNovember 24, 2004.
(41) Incorporated by reference to Exhibit 10.2 to the Company’s Report on Form 8-K filed with the Commission onNovember 24, 2004.
(42) Incorporated by reference to Exhibit 10.73 to the Company’s Report on Form 10-K for the year endedJanuary 29, 2005.
(43) Incorporated by reference to Exhibit 10.2 to the Company’s Report on Form 8-K filed with the Commission onSeptember 19, 2005.
(44) Incorporated by reference to Exhibit 10.1 to the Company’s Current Report on Form 8-K, filed with theCommission on December 28, 2006.
(45) Incorporated by reference to Exhibit 10.1 to the Company’s Current Report on Form 8-K, filed with theCommission on January 5, 2007.
(46) Incorporated by reference to Exhibit 14.1 to the Company’s Report on Form 10-K for the year endedJanuary 31, 2004.

®This Page Intentionally Left Blank©

®This Page Intentionally Left Blank©

COR PORATE I N FOR MATION
CORPORATE HEADQUARTERS7401 Boone Avenue NorthBrooklyn Park, MN 55428763.391.4000
CORPORATE COUNSELFaegre & Benson LLP90 South Seventh Street2200 Wells Fargo CenterMinneapolis, MN 55402
INDEPENDENT REGISTEREDPUBLIC ACCOUNTING FIRMKPMG LLP90 South Seventh Street4200 Wells Fargo CenterMinneapolis, MN 55402
TRANSFER AGENT AND REGISTRARWells Fargo Shareowner Services161 North Concord ExchangeSouth Saint Paul, MN 55075800.468.9716
FORM 10-KForm 10-K fi led with theSecurities and Exchange Commissionis available without chargeupon written request.Requests should be sent to:Wilsons Leather7401 Boone Avenue NorthBrooklyn Park, MN 55428Attention: Chief Financial Offi cer
ANNUAL MEETINGAnnual Meeting of Shareholderswill be held at 10:00 amon Thursday, June 7, 2007at the Northland Inn7025 Northland DriveBrooklyn Park, MN 55428
STOCK EXCHANGE LISTINGListed on the NASDAQ Global MarketSM
Trading Symbol: WLSN
BOAR D OF D I R ECTOR S
MICHAEL M. SEARLESChairman and Chief Executive Offi cerWilsons Leather
GAIL A. COTTLERetired Executive Vice President Nordstrom Inc.and President NordstromProduct Group; Retail Consultant
MICHAEL T. COWHIGRetired President of Global Technicaland Manufacturing Operations,Procter and Gamble Co., Gillette GBU The Gillette Company
WILLIAM F. FARLEYFounder andChief Executive Offi cerLivingston Capital
PETER V. HANDALChairman, President andChief Executive Offi cerDale Carnegie & Associates, Inc.
BRADLEY K. JOHNSONSenior Vice President,Chief Financial Offi cer and Chief Administrative Offi cerRecreation Equipment, Inc. (REI)
MICHAEL J. MCCOYRetired Executive Vice Presidentand Chief Financial Offi cerHormel Foods Corporation; Consultant
DAVID L. ROGERSPrivate Investor and Retail Consultant
R. TED WESCHLERManaging PartnerPeninsula Capital Advisors, LLC
DIRECT REGISTRATION OF WILSONS LEATHER SHARESAs a Wilsons Leather shareholder, your shares can be held in electronic or book-entry form rather than certifi cate form through the Direct Registration System (“DRS”). With DRS, Wells Fargo Shareowner Services holds the shares electronically in an account in your name. You can move shares between the Company’s records and the broker-dealer of your choice. DRS gives you full ownership of your shares without the risk of holding certifi cates, which are subject to loss, theft or damage. You retain full ownership of the shares and continue to receive all shareholder communications, such as annual reports and proxy voting materials. You can also receive your account balance via telephone. You may convert the paper certifi cates you currently hold to book-entry shares at any time, and any future transfers or issuances of shares will be issued in book-entry form unless you specifi cally request a stock certifi cate. If your shares are held in street name through a broker-dealer and you are interested in participating in DRS, you may have your broker-dealer transfer the shares to Wells Fargo Shareowner Services electronically through DRS. For more information on this service, contact Wells Fargo Shareowner Services at 800.468.9716.
WILSONS LEATHER

WILSONS LEATHER
WWW.WILSONSLEATHER.COM
7401 BOONE AVENUE NORTH
BROOKLYN PARK, MN 55428
763.391.4000