Comparison of soil microbial community catabolic diversity - SciELO

ARD-A153 844 A PROGRAM FOR STUDY OF SKELETAL MUSCLE CATABOLISM /FOLLOWING PHYSICAL TRAUMA(U) HARVARD UNIV CAMBRIDGE MAD N WILMORE 81 SEP 82 DAMD17-8i-C-i2@i
UNCLASSIFIED F/G 6/16 UL
MEEMEEEEEEEEEEEEEEEIII
llll__l

r -. . . -- e - , - - - - .e w ' - ;" -- - " '-'-" -s-->. " - ° ."-- --.--- " .... "
%..%'-2
3. 40 j2.0
111.8
, o2
MICROCOPY RESOLUTION TEST CHARTNATIONAL BUREAU OF STANDARDOS 1963-A
S'9°

AAD
* 00
I-nA PROGRAM FOR STUDY OF SKELETAL MUSCLE
CATABOLISM FOLLOWING PHYSICAL TRAUMA
ANNUAL SUMMARY REPORT(August 1981-September 1982)
Douglas W. Wilmore, M.D.Associate Professor of SurgeryDepartment of SurgeryHarvard Medical School and theBrigham and Women's Hospital75 Francis Street - T .CBoston, Massachusetts 02115 ELECTEI
~MAY 20 983
September 1, 1982Mw
Supported by United States Army Medical Researchand Development Command, Fort Detrick, Frederick,Maryland 21701-5012.
Contract No. DAMDI17-81-C-1201
Harvard University, Camdrige, Massachusetts 02138
DOD Distribution Statement: Approved for public
release; distribution unlimited.
L-.j
*-The findings in this report are not to be construed as an officialDepartment of the Army position unless so designated by other
- authorized documents.
85 4IL J)
SECURITY CLASSIFICATION OF THIS PAGE Dataen D.1. Enteed)REPORT DOCUMENTATION PAGE READ INSTRUCTIONSBEFORE COMPLETING FORM
1. REPORT NUMBER "2. GOVT ACCESSION NO. 3. RECIPIENT'S CATALOG NUMBER
;:K-: (' 4. TITLE (and Subettle) S. TYPE OF REPORT & PERIOD COVERED
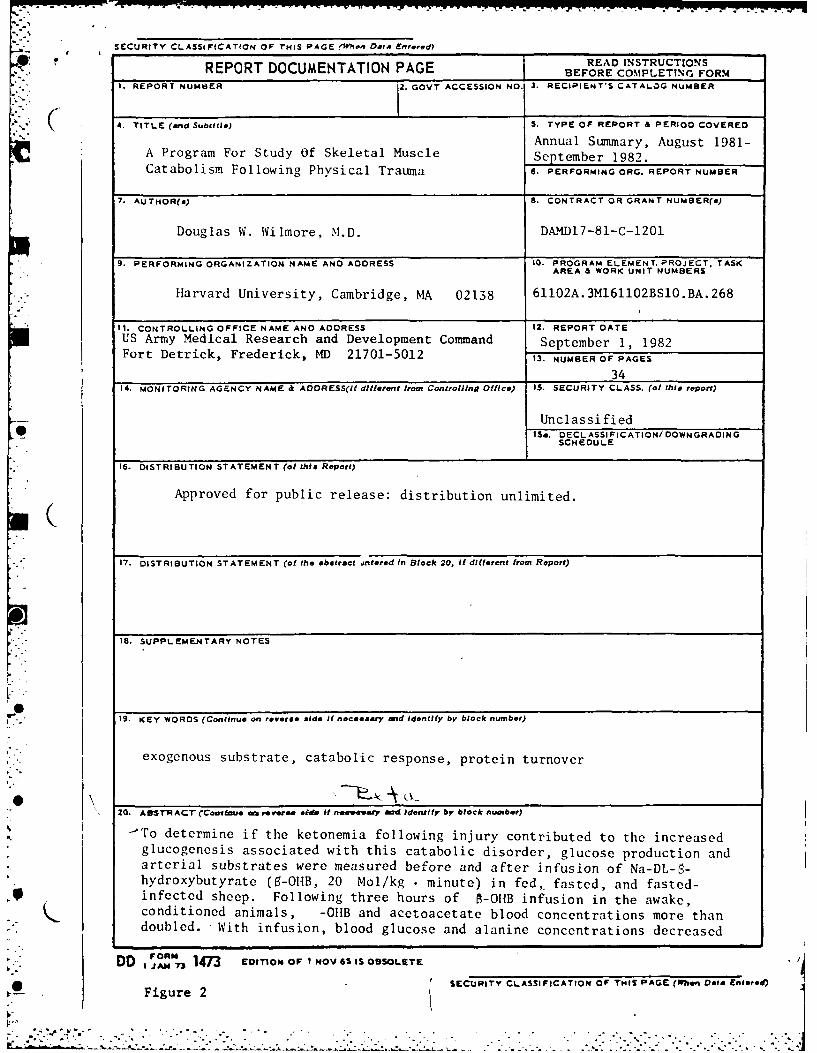
Annual Summary, August 1981-A Program For Study Of Skeletal Muscle September 1982.Catabolism Following Physical Trauma 6. PERFORMING ORG. REPORT NUMBER
7. AUTHOR(@) 8. CONTRACT OR GRANT NUMBER(&)
Douglas W. Wilmore, M.D. DAMD7-81-C-1201
9. PERFORMING ORGANIZATION NAME AND ADDRESS 10. PROGRAM ELEMENT. PROJECT. TASKAREA & WORK UNIT NUMBERS
Harvard University, Cambridge, MA 02138 61102A.3MI61102BS10.BA.268
I . CONTROLLING OFFICE NAME AND ADDRESS 12. REPORT DATEUS Army Medical Research and Development Command September 1, 1982Fort Detrick, Frederick, MD 21701-5012 13. NUMBEROFPAGES
__,_3414. MONITORING AGENCY NAME & AOORESS(If different froam Controfling Office) 15. SECURITY CLASS. (of this report)
Unclassified:e_ 15se. DECL ASSI FIC ATION/OOWNGRADIN G
SCHEDULE
* 16. DISTRIBUTION STATEMENT (of this Report)
Approved for public release: distribution unlimited.
17. DISTRIBUTION STATEMENT (of the abstract intered In Block 20, It different from Report)
IS. SUPPLEMENTARY NOTES
19. KEY WORDS (Continue on reverse side It necessary md identify by block number)
exogenous substrate, catabolic response, protein turnover
020. A&ST'RACT rCaolzue ' r erm *ids Itf ".weary acd identify by block number)
'To determine if the ketonemia following injury contributed to the increasedglucogenesis associated with this catabolic disorder, glucose production andarterial substrates were measured before and after infusion of Na-DL-s-hydroxybutyrate (a-OHB, 20 Mol/kg • minute) in fed,. fasted, and fasted-infected sheep. Following three hours of B-OI1B infusion in the awake,conditioned animals, -O1B and acetoacetate blood concentrations more thandoubled. With infusion, blood glucose and alanine concentrations decreased
DD O" 1473 EDITION OF I NOV 65 IS OBSOLETE •1
Figure 2 SECURITY CLASSIFICATION OF THIS PAGE (When Date Enered)
i" " *.' -': " " " " " " '" " " " . . .. .. . .

SECURITY CLASSIFICATION OF THIS PAGE(WI?.n Data Entered)
20.
'in the fed and fasted sheep but not in the fasted-infected group. Glucose
production fell significantly, from 10.ll±+.33 wMol/kg • min to 8.44±1 05 inthe fed animals, and from 5.05±0.28 to 4.11±0.33 in the fasted group.>Glucoseproduction was unaffected by- 0IIB infusion in the fasted-infected animals.(9.50±1.83 versus 9.11±1.44). -The accelerated rate of glucose production
in sheep following infection is not a consequence of the hypoketonemic stateassociated with sepsis.
-To determine the effect of the endorphine system on post-traumatic/septicmetabolic responses, Naloxone (2 mg, I.V.) was administered to four sheep,before and after infection. In these normotensive animals, no major
alteration in substrate concentration was noted. The endorphine systemdoes not appear to exert major metabolic regulatory effects in this model.
.Q
Accession 'or
DTIC TABUnannounced []Justif'ication
~ij By -70 Distributiol/.
[ Availability Codes
[i'"t ! Special
tO I
r
b PTIS -R.&
kA& I
S"" ' .U . '" C SI IC ATIO N O F- T IS ". "-l D" " '
... . . . . . , .. . ... . .. -'.° - _ .: _- _._ _-;i .Z,- .- l i ,' i d .~ii- , -lh s " ,, -0i'ati -'

'-1-
SUMMARY
To determine if the ketonemia following injury contributed tothe increased glucogenesis associated with this catabolic disorder,glucose production and arterial substrates were measured before andafter infusion of Na-DL-8-hydroxybutyrate ($-OHB, 20 pMol/kg • min)in fed, fasted, and fasted-infected sheep. Following three hours ofi-OHB infusion in the awake, conditioned animals, -OHB and aceto-acetate blood concentrations more than doubled. With infusion, bloodglucose and alanine concentrations decreased in the fed and fastedsheep but not in the fasted-infected group. Glucose production fellsignificantly from 10.11±1.33 uMol/kg - min to 8.44±1.05 in the fedanimals, and from 5.05±0.28 to 4.11±0.33 in the fasted group. Glucoseproduction was unaffected by -OHB infusion in the fasted-infectedanimals (9.50±1.83 versus 9.11±1.44). The accelerated rate of glucoseproduction in sheep following infection is not a consequence of thehypoketonemic state associated with sepsis.
To determine the effect of the endorphine system on post-traumatic/septic metabolic responses, Nalpxone (2 mg, I.V.) wasadministered to four sheep, before and after infection. In thesenormotensive animals, no major alteration in substrate concentra-tion was noted. The endorphine system does not appear to exertmajor metabolic regulatory effects in this model.
4
[
[
-2-
FOREWORD
In conducting the research described in this report, the inves-tigator(s) adhered to the "Guide for Laboratory Animal Facilitiesand Care", as promulgated by the Committee on the Guide for LaboratoryAnimal/Resources, National Academy of Sciences-National Research Council.
'~~~~~~~~~~..." ................ "" ."..'"-.."... ......... "" ................... ""...-".""". . _. . '

-3-
TABLE OF CONTENTS
I.PROGRESS TO DATE
A. THE EFFECTS OF KETONE BODY ADMINISTRATION ON GLUCONEOGENESISAND PROTEIN CATABOLISM, AND MEDIATION OF PROTEIN SPARING WITHKETONE INFUSION. 4-15
B. EFFECT OF ENDORPHINE BLOCKADE ON THE POST-TRAUMATIC-SEPTICSHEEP METABOLISM. 16-18
I.REFERENCES 19-21
II.APPENDICES
A. TABLES I-VI 22-27
B. FIGURES 1-3 28-31.. ,. . .

-4-
A. THE EFFECTS OF KETONE BODY ADMINISTRATION ON GLUCONEOGENESISAND PROTEIN CATABOLISM, AND MEDIATION OF PROTEIN SPARING WITHKETONE INFUSION.
INTRODUCTION
Following a variety of stresses, hyperglycemia and increasedgluconeogenesis usually occur.1 With the stress of infection 2,3
or injury 4 the serum concentrations of -OHB and AcAc remain low,even during caloric deprivation. It has been hypothesized that thefailure to develop hyperketonemia during these stress states iscausally related to the accelerated proteolysis and increase glucoseproduction that characterize the metabolic responses following major
5,6injury and severe infection. ' In this study, we examined therelationship among ketosis, glucose production, and protein catabolismin the fed, fasted, and fasted-infected state. Infusion of exogenousketones ( -OHB) into fed and fasting animals suppressed glucoseproduction, but this did not occur in the non-ketotic infected animals.
METHODS AND MATERIALS
Sheep were selected as the experimental model because of themajor contributions of long chain and ketone acids to energy pathwaysduring fasting with or without pregnancy. 7,8 In addition, anextensive data base describing ruminant metabolism is available,and methodology for performing similar studies has been described?,1 0
Because ruminants do not absorb glucose from the gastrointestinaltract, they constantly produce new glucose, primarily in the liverfrom glucose precursors arising from the rumin in the fed state ormobilized from substrate stores during fasting. 11 Conditioned,non-pregnant, non-lactating ewes or rams of mixed breeds, weighing24-38 kilograms were studied. The non-sheared animals were housedindoors in the individual pens in constant temperature (23'C) with anintermittent light cycle (lights on approximately 12 hours duringthe day and off at night). The pens were cleaned in the morningof each day, and at noon the sheep were fed generous portions of hayand molasses-coated mixed grains (Omolene , Ralston Purina Co.,St. Louis, MO). Water and a salt lick were always available.
- .". C'- t.. . U f .X .... . t - - - - - - . -

-5-
At least 10 days prior to an experiment the animals wereanesthetized (sodium pentobarbitol, Abbott Laboratories, NorthChicago, Ill., administered intravenously, 20-30 mg/kg), preparedfor a sterile operative procedure, a small groin incision made,and catheters (polyethylene tubing O.D. 2.80 mm with silastic tips)directed into the distal aorta and inferior vena cava via thefemoral vessels. In 6 animals laparotomy was performed and anadditional cathetcr was inserted into a branch of the mesentericvein and directed into the portal vein. The tip of this catheterwas placed at the porta hepatis, as previously described.1 1
The distal ends of the catheters were tunneled subcutaneously tothe flank and exteriorized via a stab wound. The groin incisionwas closed and a blunt tip needle fitted with an intermittentinjection cap (Jelco®, Jelco Laboratories, Raritan, NJ) glued toeach exteriorized catheter. The needles were supported and pro-tected on the flank by adjesive tape placed around the girth.Procaine penicillin (Wyeth Laboratories, Inc., Philadelphia, PA,600,000 units) was given intramuscularly, In the postoperativeperiod the animals were weighed daily, the catheters irrigated withsaline, and rectal temperature monitored. The sheep studied inthe protocols requiring prolonged infusions were conditioned bytransporting them to the laboratory in a small, portable restraintpen where they remained in the study environment for two to fourhours per day. After four to six such training periods, theanimals were accustomed to the laboratory and personnel. Usuallythe sheep were conditioned and studied in pairs.
Soft tissue infection was established by implanting two10xlO cm gauze sponges contaminated with canine fecal flora intothe thigh muscle and subcutaneous tissue of one leg 12 This wasaccomplished by anesthetizing the animal (intravenous thiopentol,Abbott Laboratories, North Chicago, Ill., 20-30 mg/kg), shavinga small area of the non-catheterized hindlimb, and making a 6-8 cmskin incision on the lateral aspect of the thigh. Sharp dissectiunwas carried down through subcutaneous fat and fascia, and themuscle fibers were split using blunt dissection. One gauze spongecontaining approximately 15 grams of fecal residue was placed deepwithin the muscle and the fascia tightly closed, utilizing 3-0nylon suture. A second contaminated sponge was placed in thesubcutaneous pocket and the skin tightly closed. Procain penicillin
• .):- . ,,t / . T" . . ., . .. .- .. . " " ... .." "" " ° " "' "
-6-
(600,000 units) was given intramuscularly at the time of operation.This antibiotic was administered in this manner based on previousreports of beneficial effects on survival with penicillin adminis-tration to ruminants with contaminated extremity wounds.
1 3
While developing this infected sheep model, we found that theadministration of the anesthetic alone, anesthesia plus the implan-tation of sterile gauze sponges, or anesthesia plus contaminationwith a smaller innoculum did not produce clinical or biochemicalresponses associated with soft tissue infection. We quantitated thebacteria in the innoculum and attempted to define dose responses toinfection, but the biochemical alterations were highly variable toknown quantities of bacteria. Hence, we utilized this model whichmost consistently provided both clinical and biochemical alterationsto infection, but usually did not cause overwhelming sepsis and death.For example, of the 24 animals infected during this entire study,two died, both on the second day following infection. These twoanimals were eliminated from the study. All others survived for atleast 6 days until sacrifice or operative drainage of the infectedleg. Serial blood cultures obtained daily from the arterial catheteryielded at least one positive blood culture on the second to thefourth days following infection in all 8 infected animals cultured.The bacteremia subsequently cleared with resolution and drainage cfthe soft tissue infection. E. coli, Pseudomonas aeruginosa, andKlebsiella, all gram negative organisms, were identified in theblood cultures. Serial blood cultures in five control animals didnot grow microorganisms. For the purposes of this study then, wehave simply classified animals as "infected" and compared them withnon-infected sheep.
Post-operatively, the animals were allowed free access to waterand salt, but no feed. On the first day post-infection, swellingand tenderness were present in the infected limb, and the animalswere frequently hemo-concentrated. In some animals, physiologicsaline (500 ml) was given intravenously on that day only, to restorethe hematocrit towards pre-infection levels. When required, fluidwas administered after the morning measurements were performed.Thirty-six to forth-eight hours after operation all animals weredrinking water. Throughout the post-infection period, metabolicsubstrate, body weight, and rectal temperature were monitored daily.
• "L'. . - T . - . ." -" ' : ." . . --. ". ' ' .'T . .'' T
° .' " : T : ' T - '

-7-
Studies of Glucose Production
Preliminary studies demonstrated that established infection infed animals resulted in a rapid reduction of food intake; spontaneousfeeding resumed with resolution of the infection. Because of thevariation in energy intake with infection, fed animals were infectedas previously described and then fasted for the subsequent three days.The metabolic response of these animals (fasted-infected) was comparedto non-infected, three-day fasted sheep. Measurements were also made
.- in normal but previously catheterized fed sheep. In this last groupof fed animals, food was removed from their pens the evening before theglucose turnover study.
On the morning of the glucose turnover study, the animals weretransported to the laboratory and allowed to rest for at least onehour in the restraint pens. A primed constant infusion of D(6- 3H(N))glucose (New England Nuclear, Boston, MA) was delivered into the venouscatheter by a constant infusion pufnp (Harvard Apparatus Company, Inc.,Millis, MA); a prime of 1.5 mci/kg was given followed by an infusionof 20 nci/kg • minute. After allowing one hour to reach isotopicsteady state, samples were drawn from the arterial catheter at IS-minute intervals over the next hour for determination of glucose specificactivity and concentrations of glucose, S-OHB, and AcAc. During thelast withdrawal, samples were also taken for whole blood alanine,lactate, pyruvate, blood gases and p1, and plasma free fatty acids.Blood pressure was monitored throughout the study by a transducer(Stratham) attached to the arterial line and pressure recorded on aSanborn Recorder (770 series). Rectal temperature was measured at theend of each study.
Infusion of Beta-Hydroxybutyrate
To determine if a causal relationship existed between glucoseproduction and elevated blood ketone concentrations, animals from thefed, fasted, and fasted-infected groups were studied before and afteran acute elevation in the -OHB. In addition to the fasted controlgroup, fed animals were also selected for this study because theydemonstrated low concentrations of ketones and rates of glucose produc-tion comparable to the fasted-infected group. Moreover, the fastedanimals were already ketotic, and infusing a comparable quantity of.-OHB into these sheep elevated -OIIB concentrations above levelsusually observed during fasting alone.

-8-
At the end of the glucose turnover protocol outlined above(short term studics), the tritiated glucose infusion was continuedand sodium DL- -OHB (Sigma Chemical Co., St. Louis, MO) infused.The 3-OIB was prepared in a manufacturing pharmacy where the compoundwas dissolved in sterile water and the solution passed through a 0.22micron membrane filter (Millipore Corporation, Bedford, MA), theconcentration being varied to give a delivery rate of 65 ml ofsolution per hour and 20 AMol of 3-OHB/kg body weight • minute via aninfusion pump (IMED Corporation, San Diego, CA). All solutions weretested for bacterial growth and pyrogenicity before infusion. No-OHB prime was given. After two hours of -OHB infusion, the samples
for glucose specific activity and arterial substrates were obtainedat 15-minute intervals as outlined in the glucose turnover protocol.The effect of 3-OHB infusion was studied in 11 fed, 8 three-dayfasted, and 9 fasted-infected animals.
To evaluate the effects of a-OHB infusion on insulin elaboration,three fed and four fasted-infected animals with previously implantedportal vein catheters were studied. Additional blood samples weredrawn from the arterial and portal venous catheter for insulin deter-minations at the end of the control and infusion periods.
To evaluate the effects of sodium infusion and/or alkalosisassociated with 3-OHB administration, sodium bicarbonate (1 mEq/ml)was substituted for the OHB and infused at a rate of 0.82 ml/minutein two fed and two fasted-infected animals. The same sampling protocolwas followed as the 3-OMB infusion protocol previously described.
In all of the investigations outlined above, no animal was sub--jected to an infusion study on more than one occasion every 10 days.No more than 80 ml of whole blood were required for any individualstudy. After all fasting studies, at least 10 days of recovery wereallowed before re-study. After hindlimb infection, the animal wasdropped from the study.

-9-
Chemical .\nalysis
All samples were immediately chiled in their respective collectingtubes. Samples of whole blood were placed into tubes containing oxylateand fluoride and analyzed in duplicate for glucose concentration bythe glucose oxidase/peroxide method (Sigma Chemical Co.,- ).14 -OI1B,AcAc, and alanine were precipitated with 3.3 M perchloro-acetic acid andanalyzed in duplicate by the methods of Williamson and Mellanby. 14
Plasma free fatty acids were measured using the method of Dole,1 5 andblood lactates and pyruvates by the Bohringer techniques. 1 4 Insulinwas determined by the immunoassay method of Soeldner.
1 6
Tritiated glucose specific activity was determined by first precipi-tating plasma proteins with barium hydroxide and zinc sulfate (Somugin)and pass-ng the supernatant througfr an anion-exchange column (AmberliteIRA 400 CP, Mallinckrodt Chemical Corporation, St. Louis, MO). Theelutant was evaporated to dryness in a vacuum oven and re-dissolved inI ml of water and 10 ml Aquasol. Emission was counted on a Searle MarkIll liquid scintillation spectrophotometer. Plasma and elutant glucoseconcentrations were determined in triplicate on a Beclran glucose analyzer.An infusate sample from each experiment was diluted and also counted.Hematocrits were determined in triplicate and arterial blood gasesmeasured using a Corning Model #168 pH and Medical Blood Gas Analyzer.
Details for the calculation of glucose turnover have been describedby Steele. In all cases, an equilibrium in glucose specific activitywas achieved. In this situation, the rate of glucose turnover isdetermined by dividing the isotope infusion rate by the specific activity.We have tested the accuracy of this approach in dogs in which all sourcesof endogenous glucose production were removed. In the steady statesituation, the isotopic technique enabled the determination of the rateof appearance of unlabeled glucose within a maximum error of 5%.18 Themethod has been applied successfully in sheep by Bergman and associates.
1 9
All group values are expressed as mean ± standard error of the mean anddifferences between groups were determined using unpaired t-tests andanalyses of variance. The effect of B-OHB infusion was determined bycomparing control and infusion data using paired t-tests. The level ofsig)nificance selected was p < 0.05.
" . . . . . . .... .
0
-10-
Studies of Glucose Production
Body temperature and arterial substrate concentrations in thefed sheep were similar to measurements obtained during the initialperiod of the longitudinal studies presented in last year's AnnualReport. The responses to three days of fasting were similar tothose noted on day 3 of the longitudinal fasting experiment previouslydescribed. When the infected animals studied on the third day of fastwere compared to three-day fasted, non-infected controls there was asignificant elevation in body temperature and blood lactate andpyruvate levels (Table I). With infection there was a significantdecrease below fasting controls in concentrations of -OHB, AcAc,and alanine. There was no difference in blood glucose concentrationsbetween these two groups, but blood glucose in fasted and fasted-infected animals was significantly below levels observed in the fedsheep. There was no difference between the three groups in arterialhematocrit, pH, or partial pressure of oxygen or carbon dioxide.
In all animals, an isotopic plateau in glucose specific activitywas achieved (for representative examples see Figure 1). The condi-tion of the animal did not affect the ability to achieve isotopicsteady state. Therefore, the use of the steady state Steele equationwas justified. Glucose production in the fed animals was 10.2±2.9Alol/kg • min or approximately 3.3 g/hour in a 30-kg animal. With
fasting, glucose production fell significantly to 5.56±2.22 PMol/kg - min,levels which were 40%-50% below those observed during feeding. Theserates of glucose production are comparable to previous reports ofglucose kinetics in fed and fasted sheep. In contrast to the fastedcontrol animals, glucose production in the fasted-infected sheep waselevated to 9.5±1.11 pfol/kg • min, indistinguishable from rates observedin fed animals. In spite of the elevated glucose production rates in theinfected sheep, blood glucose concentrations were comparable to thoseobserved in fasted animals.
Effect of Beta-Hydroxybutyrate Infusion
To determine the interrelationship between elevated blood ketoneconcentrations and the rate of glucose production, a-OHB was infusedinto animals from the three groups previously described. The initialarterial blood substrate concentrations (Table I) were similar in allthree groups to levels previously reported (see last year's Annual Report).
e

-7F-
With the infusion of S-OHB, blood concentrations of this ketoacidrose to near plateau levels in the third hour (Figure 2). In thefed and fasted-infected animals these concentrations were comparableto levels observed during fasting alone. In the fasted animals withelevated basal blood ketones, -OHB concentrations rose above 2 mM/L.
In the fed animal4, -O0HB infusion resulted in an elevation ofblood AcAc, and a fall in levels of blood glucose and alanine (TableII). Lactate levels remained unchanged. With -OHB infusion infasting sheep, concentrations of arterial substrate were altered in asimilar manner; AcAc increased, glucose and alanine decreased, andlactate did not change. However, similar responses were not observedin the fasted-infected animals. With S-OHB infusion, blood concentra-tions of 8-OHB and AcAc rose to levels similar to those observed inthe fed group (Figure 2, Table II)." However, during -OHB infusionthere were no alterations in concentration of blood glucose, lactateor alanine.
With -OHB infusion, glucose production was significantly reducedin the fed sheep from 10.11±1.33 to 8.44±1.05 pMol/kg • min (p < 0.01)and in the fasted animals from 5.OS±0.28 to 4.11±0.33 pMol/kg • min
(p < 0.01). In contrast, glucose production was not altered in thefasted-infected animals (9.50±1.83 versus 9.11±l.44jaMol/kg - min, NS bypaired t-test). The reduction of glucose production in the fed andfasted sheep was not large (approximately 15%-20%), although inhibitionoccurred in all animals of these two groups. 8-OHB infusion into thefasted-infected animals did not lower glucose production to levelsobserved in the fasted animals (approximately 5 pMol/kg • min), and,in fact, even a modest inhibitory effect of ketone infusion on glucoseproduction was not observed. The direction of change of blood glucoseconcentrations following the 8-OHB infusion correlated with thealterations in glucose production rate in these three groups of animals;concentrations and production fell in the fed and fasted groups andneither changed in the fasted-infected group.
Arterial concentrations of insulin were comparable in the fedand fasted-infected animals studied (11±2 pU/ml versus 12±1), andthese concentrations did not change with a-OHB infusion (12±1 and11±1). Portal insulin concentrations were elevated above arteriallevels in the two groups of animals (16±2 and 20±2), and did not changesignificantly with a-0HB infusion (18±3 and 15±2).
..

-12-
To determine if the effects observed werc due to alterations in
sodium load or an elevation in p1l associated with the Na-DL-O-OHB
infusion, 20 similar studies were performed in two fed and two fasted-
infected sheep, with sodium bicarbonate infused rather than 6-OHB.
Similar blood pH and pCO, alterations occurred with infusion (Table III),
but no consistent alterations were observed in glucose turnover or
arterial substrate concentrations (Table IV).
DISCUSSION
Infected animals Fasted for three days did not develop ketosis,
as demonstrated by the short term studies. On the third day, however,
glucose production rates were elevated above those observed in fasting
controls; glucose turnover was comparable to that found in the fed
9animals. Because of the previous relationship between ketosis and rate
of glucose production observed in the fed and fasted animals, we tested
the hypothesis that the failure of glucose production to fall during
fasting in the fasted-infected animals resulted from the failure of the
ketogenic response. While a-OHB infusion reduced blood concentrations
of glucose and alanine and diminished rates of glucose production in
fed and fasted animals, these effects were not observed in fasted-infected
animals. In other words, the development of ketosis with B-OHB infusion
in the fasted-infected animals did not result in metabolic alterations
which allowed these animals to be comparable to non-infected, fasted
controls. That is, these metabolic responses to trauma/infection were
not dependent on the hypoketonemic state.
Why should the infusion of exogenous B-OHB suppress the glucose
production rate in fed and fasted sheep and fail to elicit this effect
in infected animals? One explanation would be that infection interferes
with ketone disposal or intracellular metabolism of this substrate. This
appears not to be the case, for blood concentrations of 6-OHB rose to
similar levels in the fed and fasted-infected animals during comparable
rates of -OHB infusion. This suggests that the fasted-infected animals
were clearing the a-OHB from the bloodstream at rates comparable to thoseobserved in the fed animals.
One indication of -OIIB utilization is its conversion to AcAc. In
this regard, the concentrations of AcAc were comparable in both the fed
and fasted-infected animals during the B-OHB infusion. Thus, it appears
there is no impairment in tissue uptake of the a-OIIB or its conversion to
AcAc in the fasted-infected animals.
7
...0

-13-
Another explanation for the lack of e-OHB glucosuppressive effectin infected animals would be that -OHB is ineffective as a substrate todiminish net skeletal muscle proteolysis or conserve glucose utilizedin the central nervous system. In these studies, the concentrations ofalanine, quantitatively the most important gluconeogenic amino acidprecursor, decreased in the fed and fasted animals during ketone infusion,but did not change in the fasted-infected animals. Alterations in bloodalanine concentrations may reflect an effect of -OHB on skeletal muscleamino acid release, as suggested by Sherwin. 20 Studies in our laboratorysupport this hypothesis; B -OHB infusion decreased alanine and glutamineefflux from the hindquarter of fed sheep by approximately 50%, whileexerting minimal effects on hindquarter nitrogen release from animalswith front limb infection (Table V). In these same experiments, uptakeof -OHB across the hindquarter was comparable in both groups of animals.Because the mechanisms which accelerate net skeletal muscle proteolysisduring infection are unknown, the exact role of -OHB in the proteinbiochemistry in control and infected sheep remains to be elucidated.Moreover, the contribution of exogenous B-OHB as an alternate fuel forthe central nervous system of the sheep is unknown.
Other investigators have reported that infusion of ketonesstimulates insulin elaboration;20 ,Z1 insulin serves as the signalfor decreasing proteolysis and gluconeogenesis. Insulin release isoften blunted by a variety of stresses,22 and the lack of insulinelaboration to -0HB infusion in the fasted-infected sheep would accountfor the observed results. However, arterial and portal venous insulinconcentrations were similar in the basal state and did not increase ineither group during the ketone infusion, suggesting that insulin did notplay this regulatory role in these experiments. Changes in other gluco-regulatory hormones such as glucagon and catecholamines may have beeninvolved in eliciting the observed responses. However, changes in tissueresponsiveness to hormones in stress states make the physiologicalsignificance of static concentrations of these hormones difficult tointerpret. 2
1 In addition, the role of endogenous pyrogen on theseresponses is unknown.
We feel that the effects of B-OHB infusion could not be explainedsolely by the effects of this substrate on energy metabolism. Thequantity of energy administered via the infused -OHB is relativelysmall when compared to the overall energy demands of the animal, andprobably accounts for less than 5% of the basal metabolic requirements.In another set of experiments we infused 1/60th the dose of 6-OHBreported in this study into three fasted animals. S-OHB concentrationrose minimally from 0.79±0.04 mM/L to 0.95±0.06, and AcAc concentrationswere 0.13±0.01 versus 0.14±0.01 post-infusion. However, in all three
U

-14-
animals, blood glucose concentration decreased from 2.50±0.10 to 2.18±0.07mM/L, glucose production rate fell (6.33±0.17 to 5.35±0.27 uMol/kg . min),and blood alanine was reduced (0.13±0.01 to 0.11±0.02 mM/b). These altera-tions occurred in a quantitative way similar to those changes observed duringthe larger dose infusions reported in this study. These data suggest that8-OHB serves as an important regulatory signal in the fasting, non-infected state which either directly or indirectly influences glucoseproduction.
However, the acute effect of the 3-OHB infusion on glucose productionwas not major; in the fed and fasted animals, glucose production ratesdecreased only 15%-20%. Moreover, in the time frame of these infusionstudies, glucose production in the fed animals was not reduced to therate observed in the fasting animals, despite comparable blood concentra-tions of ketoacids. It may, therefote, not be unexpected that thismoderate inhibitory effect of B-OHB on glucose production in fed orfasted animals fails to exert a demonstrable effect in infected sheep,for this stress state is characterized by major systemic stimuli whichfavor increased gluconeogenesis.1 Similar competition between systemicstimulatory and local inhibitory regulation of glucose production has beendemonstrated in an infected, small animal model, 24 with major systemicstimulatory effects dominating. In the small animal model, a sustainedincrease in glucose production was observed in vivo, but the hepaticgluconeogenic capacity of the liver was decreased in vitro. This suggeststhat minor inhibitory influences which affect glucose production in vitroare over-ridden by stronger in vivo factors such as hormonal stimuli.These same systemic influences may affect glucose regulation in ourinfected animals and, hence, over-ride the minimal inhibitory effect ofketone acids on glucose production. Whatever the mechanism of -OHBinduced glucose sparing in the fed and fasted states, it appears clearthat the accelerated rate of gluconeogenesis is not a consequence ofthe hypoketonemic state associated with infection.
This concept is important, for the hypothesis has been advancedthat the catabolism associated with the stress of infection and injuryis a consequence of failure of ketoadaptation. It has been suggested thatdietary manipulation or the administration of exogenous ketoacids 6(or substrates with ketogenic potential) be utilized to diminish thesecatabolic responses. However, the metabolic responses to injury andinfection appear stimulated by hormones which favor gluconeogenesis and
proteolysis. This same hormonal environment most probably accounts

-15-
for the blunted ketogenic response observed in these stress states.When dietary carbohydrate is restricted, some stressed patients maydevelop hyperketonemia, but in control studies this metabolic eventappears to have minimal impact on the catabolic response to injury.In addition, these sheep studies demonstrate that the exogenousadministration of S-OHB has no impact on glucose production followinginfection. These data then do not support the hypothesis that themetabolic responses to stress are related to a failure to develop thehyperketonemic state. Further research should be directed toward anunderstanding of the mediators of these catabolic states so that thesemediators may be altered in order to modulate catabolic responses.
0
0
r:
-16-
B. EFFECT OF ENDORPHINE BLOCKADE ON THE POST-TRAUMATIC-SEPTIC1SHEEP METABOLISM.
The endorphine system plays a major role in the hypotensionassociated with systemic injury and sepsis. The activity of thissystem on the metabolic response to injury/infection has not beendetermined. The purpose of this study was to utilize the injured-infected sheep model to evaluate alterations in metabolism follow-
ing blockade of the endorphine system.
METHODS AND MATERIALS
Four conditioned sheep with chronic implanted arterial cannulaswere studied. The initial investigation was carried out followingovernight withdrawal of food. The animals had free access to waterand a salt lick during this time. The animals were housed in smallrestraint pens in the laboratory. After an hour of acclimatizationto the study area, three basal samples were drawn at 15-minuteintervals for substrate determinations. Naloxone (2 mg I.V.) wasthen administered, and blood was taken for analysis at 15-minuteintervals for the next one hour.
Several days later the animals were anesthetized and soft tissueinfection of the hindlimb created as previously described. Theanimals were then fasted for three days and subsequently re-studiedas outlined above.
Blood chemical analysis was carried out as previously describedfor determination of glucose, lactate, pyruvate, a-hydroxybutyrate,acetoacetate, alanine, and free fatty acids. Because of the smallsample size, statistical evaluation was carried out by non-parametricanalysis. An increase or decrease in substrate concentration wasdetermined by analyzing all data points to see if a statisticallysignificant slope in the plot of concentration versus time could beobtained.
[7

-17-
RESULTS
The fed sheep weighed 32.75 kg on the morning of study.Average rectal temperature was 102.8°F. Initial concentrationsof blood substrates were similar to those concentrations previouslyobserved in previously studied fed animals. With Naloxone adminis-tration, no alterations in concentrations of glucose, a-hydroxybutyrate,acetoacetate, alanine, pyruvate or free fatty acids were noted. Theonly significant change observed was a fall in lactate concentrationthat occurred with time (see Figure 3).
With fasting and infection the four animals lost weight to28.75±1.2 kg. Body temperature was 104.8°F at the time of study,but remained stable throughout the study period. No fluctuationswere noted after Naloxone administration. Differences betweengroups in blood substrate concentration were consistent with observa-tions made in the previous study. The administration of Naloxone didnot alter concentrations of glucose, -hydroxybutyrate, acetoacetate,alanine, lactate, ,'yruvate, or free fatty acids (Table VI).
No clinical effect of Naloxone administration was observed ineither group; no changes in vital signs or body temperature occurredduring the study period.
DISCUSSION
Naloxone administration does not appear to affect substratemetabolism in the injured-infected state when hypotension is notpresent. Representative examples of substrates representing metabolismof carbohydrate, lipid, and amino acids were monitored serially withtime, and no change was observed in the fasted-infected animals withNaloxone administration. It should be realized, however, that theseanimals were not hypotensive and were not in shock. Metabolic changessuch as correction of acidosis and reduction in lactic acid andpyruvate elevations may have occurred with restoration of perfusionhad the animals demonstrated hypotension. Under the conditions ofstudy (high flow sepsis) no changes associated with treatment occurred.
In contrast to the fasted-infected sheep, one major change wasobserved in the control animals. With the administration of Naloxonethere was a fall of blood lactate from 0.8 mllol to 0.35 mMol. All fouranimals demonstrated this alteration.
S

p -18-
In the fed animals, lactate is generated in the rumin and ismaintained at elevated concentrations. Lactate falls to low levelsduring fasting when the ruiinal contents diminish. One speculationis that Naloxone administration alters visceral bloodflow, and hencethis would affect ruminal absorption and/or hepatic lactate extrac-tion. However, ketone bodies are also absorbed from the rumin in thefed state, and no change was observed in their concentration followingNaloxone administration. Therefore, the precise cause of this concen-tration change remains unknown.
Previous investigations have demonstrated that substrate turnoveris closely correlated with concentration change, and hence when noalteration is observed in concentration one can state with reasonableassurance that turnover rate has not changed. We feel, then, thatthese studies fail to demonstrate a change in alteration of metabolismof the substrates studied; Naloxone does not appear to exert majormetabolic regulatory effects in normotensive, injured/infected animals.
-0- .- -- ' ! 7 ., .i ii i; i . - - - "
. . . " " " "S . . , =,, ' . i "4' - " " " " "

-19-
REFERENCES
1. Wilmore DW, Goodwin CW, Aulick LH, Powanda MC, Mason AD Jr,Pruitt BA Jr. Effect of injury and infection on visceralmetabolism and circulation. Ann Surg 192:491-504, 1980.
2. Neufeld HA, Pace JA, White FE. The effect of bacterialinfections on ketone concentrations in rat liver and bloodand on free fatty acid concentrations in rat blood.Metabolism 25:877-884, 1976.
3. Wannemacher RW Jr, Pace JG, Beall FA. Role of the liver inregulation of ketone body production during sepsis. J ClinInvest 64:1565-1572, 1979.
4. Birkhahn Rif, Long CL, Fitkin DL, Busnardo AC, Geiger JW,Blakemore WS. A comparison of the effects of skeletaltrauma and surgery on the ketosis of starvation in man.J Trauma 21:513-518, 1981.
5. Blackburn GL. Lipid metabolism in infection. Am J Clin Nutr30:1321-1332, 1977.
6. Border JR, Cheniger R, McMenamy RH. Multiple system organfailure: muscle fuel deficit with visceral protein malnu-trition. Surg Clin NA 56:1147-1167, 1976.
7. Bergman EN, Kon K. Acetoacetate turnover and oxidation ratesin ovine pregnancy ketosis. Am J Phys 206:449-452, 1964.
8. Bergman EN, Kon K, Katz ML. Quantitative measurements ofacetoacetate metabolism and oxidation in sheep. Am J Phys203:658-662, 1963.
9. Blaxter KL. The Energy Metabolism of Ruminants. London:Hutchinson, 1967.
10. Blunt \!. The Blood of Sheep. Composition and Function.New York: Springer-Verlag, 1975.
6
r', • • . j . ,-:. • °,,o-- . , . °i J > .

.,. N_
-20-
11. Katz ML, Bergman EN. Hepatic and portal metabolism ofglucose, free fatty acids, and ketone bodies in thesheep. Am J Phys 216:953-960, 1969.
12. Heimrick AS, Thal AP. Mechanisms for the high circulatoryrequirements in sepsis and septic shock. Ann Surg 170:677-695, 1969.
13. Mansberger AR, Ochsner EWA, Jacob S, Oppenheimer JH,Gillette RW. A new preparation for the study ofexperimental shock from massive wounds. II. Evalua-tion of various therapeutic regimens with specialreference to the role of antibiotics, fluid replace-ment, and debridemeat. Surgery 43:708-720, 1958.
14. Bergmeyer HU, Bernt E. Determination with glucose oxidaseand peroxidase. In: HU Bergmeyer (ed.), Methods ofEnzymatic Analysis. Second English Edition. New York:Academic Press Inc, 1974. Pp.1205-1215.
15. Dole VP, Meinertz H. Microdetermination of long-chainfatty acids in plasma and tissue. J Biol Chem 235(9):2595-2599, 1960.
16. Soeldner JS, Slone D. Critical variables in the radio-immunoassay of serum insulin using the double antibodytechnique. Diabetes 14:771-779, 1965.
17. Steele R. Influence of glucose loading and of injectedinsulin on hepatic glucose output. Ann NY Acad Sci82:420-430, 1959.
18. Allsop JR, Wolfe RR, Burke JF. The reliability of rates ofglucose appearance in vivo calculated from constant tracerinfusions. Biochem J 172:407-416, 1978.
19. Bergman EN, Brockman RP, Kaufman CF. Glucose metabolism inruminants: comparison of whole-body turnover with productionof gut, liver, and kidneys. Fed Proc 33:1849-1854, 1974.
20. Fery F, Balasse EO. Differential effects of sodium acetoacetateacetoacetic acid infusions on alanine and glutamine metabolismin man. J Clin Invest 66:323-331, 1980.

-21-
21. Sherwin RS, Hendler RS, Felig P. Effect of ketone infusionon amino acid and nitrogen metabolism in man. J ClinInvest 55:1382-1390, 1975.
22. Porte D Jr, Robertson RP. Control of insulin secretion bycatecholamines, stress, and the sympathetic nervous system.Fed Proc 32:1792-1796, 1973.
23. Black PR, Brooks DC, Bessey PQ, Wolfe RR, Wilmore DW. Mechanismsof insulin resistance following injury. Ann Surg. In press.
24. Wolfe RR, Burke JF. Glucose and lactate metabolism in experi-mental shock. Am J Phys 235:R219-R227, 1978.

wwT t171T 71 T 7
-22-
TABLE I
CHARACTERI1ST ICS, SUBSTRATE CONCENTRATIONS, AND GLUCOSE TURNOVERRATES IN FED, THREE-DAY FASTED, AND FASTED-INFECTED SHEEP
DESCRIBED IN THEff SHORT-TERM STUDIES(MEAN ±S.E.)
FastedFasted Infected
Fed 3-Days 3-Days
N 16 15 13
Weight (kg) 30.9±1.9 28.8±1.1 29.0±2.0
Rectal Temperature (0C) 39.7±0.1 39.3±0.1 40.7±0.1*
Blood Glucose (mM/L) 3.28±0.11* 2.33±0.06 2.44±0.11
Lactate (i\/)0.60±0.11 0.31±0.03 0.83±0.15
Pyruvate (m%/L) 0.09±0.01 0.06±0.01 0.10±0.01
2-OHB (mM/L) 0. 31±0.06* 0.77±0.06 0.44±0.07*
AcAc (nPI/L) 0.03±0.01 0.10±0.01 0.06±0.01*
Alanine (mM%/L) 0.17±0.01~ 0.13±0.01 0.08±0.01
Glucose Production 10.20±2.9 5.56±2.22 9.50±1.11(,,iNo1/kg - iue
Difrn*hnfsep<.5
4 Different than fasted, p <0.05.
Different than fasted-infected, p <0.05.
(Differences determined by analysis of variance.)

K. -23-
(-A C) - ' C DC CAN C - C
1) +1 +1 +1 1 +1 +1 +1 +1
00 tn a)0
t- tnL LO24-J o) *n C) 00
0 +1 I +I +1I +I + I +1 I + 1 +t4- r- . Lo) N t)~ C 0) c0Q) N 1 C C tn Ln' 00 CD
Cl4 CD 0 4 C C C
W4
-i CD C tn C) C
cc ) C C C CC4J I + I +I + I I + I +I + I + I
CAc C Cl cq r -I C) C)>1 < * 'T C) M -)~-Z LL M 00>tn)C C c; C;
C)'-
LU ) ' C: C \C) 00 C
0 - 0 CD C) C C) CD C) C iU '4-4 +1 1 +1 +1 I +1 +1 +1 +1
- CL C00 ' -4 C V
.2 n/ +1 C C C Q V
Cc r ell4 LI) 11) -4 p
-4 C C C -C C
I +1 +1 +1 +1 +1 +1 +1 +1- 4+j
U tn 'nC Cc C C;
F- o C)-
LI 0- C- C 1' ' C
C) * ') * 10
0 +1 1 +1- +1 +1 +1 + 1 +1 +1* F- '0 \O ~ Ntj r- C-) cc
0c "T * 0 00 * *
CC)
00w 4-J-
0 C)
C) n 0 -0C)OC 0~ *H4-4
F-. 4)a., -J C .,AC)3 "T.1 *0 M -.
4-) =-- u-' 0 Q0 41 =
-jW- 4. 0
00)
m ca -e .L m . - -

-24-
00- 4
0 00
+1 +1 +1
z 0 ~tnr ~ c
Ott,) tn~ 0.-
0 < C.4 +1 +1003 t\J rn0 t
0 E-4 Ln Lfn
N. N 00 00m
Ln U
01 m d* C
r-O r 00 m -V
Lf~ Ito
* N- .4 V)
0l 00 0c'a 0 C Lfl

* -25-
1<t U) 00O
C4 n 0 N ) 0D
4-4
C)J
UZIz
.. 1 0.. U) 1 ) Z- .-co 0) C; r4
Ciit
F-
M~on 0 .
00a
-1 0 0 )
0 a 0 r- 4
4-4
W C) N V4%0

-26-
+1 +1
0r 0
L.p 4 -4 p1 p1 +1 +1
-D 00
+1 E+1 +1 +
00 D 0D0C V4 N (Nr C
oZ 0 1+ 1+
-H cfl .4'
a)z +1 + +1 +4- 0- 0 0L 1
a) lu
14-4 ~ 4.J K4 K4

- -27-
TABLE VI
EFFECTS OF NALOXONE ADMINISTRATION (2 mg I.V.)ON BLOOD SUBSTRATE CONCENTRATIONS
(MEAN ±S.E.M.)
"tNormal" SubstrateConcentration Initial Final Concentration
For Sheep Conceptration -(1 Hr. Post-Admin.)
Control
Glucosemg1 ml) 57±3 45±2 46±2
-OHB (xnM/L) 0.46±0.08 0.42±0.02 0.43±0.02
Acetoacetate(mM/L) 0.04±0.01 0.02±0.01 0.03±0.01
Alanine (mM/L) 0.18±0.02 0.20±0.02 0.19±0.1
10-Lactate (mM/L) 0.69±0.15 0.80±0.20 0.35±0.17
Pyruvate (mM/L) - 0.07±0.01 0.08±0.01
Free Fatty Acids(mhq/L) 684±93 553±48 656±111
* - infected
* Glucose(mg/l00 ml) 40±1 42±4 38±3
a-OHB (mM/L) 0.46±0.05 0.37±0.14 0.38±0.15
Acetoacetate(mM/L) 0.05±0.01 0.03±0.01 0.02±0.01
Alanine (mM/L) 0.08±0.01 0.08±0.01 0.07±0.01
Lactate (mM/L) 0.89±0.15 1.38±0.41 1.25±0.58
0 Pyruvate (mM/L) -- 0.11±0.02 0.10±0-03
Free Fatty Acids(mEq/L) 722±86 645±84 585±24

-28-
Figure 1: Representative examples of glucose specific activityin fasted (0-0), fed (1-1), and fasted and infectedsheep (A-A). The isotope infusion rates in the threeexperiments were 46,065, 47,864, and 39,130 dpm/kg min,respectively.
Figure 2: The effect of -OHB infusion on substrate concentrationsin fed, fasted, and fasted-infected sheep.
Figure 3: Substrate concentration before and after Naloxoneadministration (mean-±SEN). Naloxone was administeredat time 0.
.. •..

-29-
,. Figure 1
GLUCOSE SPEC/F/C ACTIV/TYdpm x O 3/pmo/
0s N\ '
\ I I I"
0
CD(r\)
CD
C,
£."9
4: .- - . : . - . . .
,. . . "''% 4 - - i . ' ' . . i

-30-- Figure 2
d8-OH BUTYRATE
INFUSION
A-OH BUTYRATE CONC.
*, tI -TI
2.4 TT 4
2.0 IllI.
1.6 I
mM/L , .21,
0.8 T ,-- I /
l
0.4
ACETOACETATE CONC.0.30-0.20-
mM/L - -.,
S0.10
0 * "Fedx Fasted
3.5 BLOOD GLUCOSE 0 Fosted-Infected
3.0mM/L
2.5- -" - I" --- "
I I
75 90 105 120 255 276 285 300
EXPERIMENTAL TIME IN MINUTES
. ..
. . * .. . . . . . . . .

-31-Figure 3
tc. _ _____0 Fed Controls0 0 Fasted-Infected
BLOOD GLUCOSE
45
to 40
35p.4 s-OH Butyrate
S 0.40
p0.35 0,
0.25 ALANINE
0.20
0.15
- 0.10
0 _ 0 _ 0 - 0
0.05
1.5AT
1.25
1.0 0
0.75 ~-
0.5
-45 -30 -15 0 +15 +30 +45 +60
Time in Minutes I.
E ,, FILMED
-I 6-85
°' DTIC1.