Willingness to Pay to Prevent Water and Sanitation-Related ...
29
Willingness to Pay to Prevent Water and Sanitation-Related Diseases Suffered by Slum Dwellers and Beneficiary Households: Evidence from Chittagong, Bangladesh Mohammad Nur Nobi * Abstract: A majority portion of the slum people is involved in service sectors. The city dwellers are somehow dependent on the services of those people. Pure drinking water and hygiene is a significant concern in the slums. Because of the lack of these two items, the slum people are getting sick, which causes the interruption to their services. In addition, they can transmit the diseases they suffer from to the service receiver. With these aims, this study endeavors to explore the willingness to pay of the households who receive the services of the slum people using the mixed-method techniques. Under this technique, 265 households were surveyed through face-to-face interviews, and 10 KIIs were conducted with slum people. The study's findings suggest that the households showed their willingness to pay for the improvement of the water and sanitation facilities in the slums. However, the KIIs findings show that the slum people are not willing to pay for the improvement as they claim that government should finance the project of improving water and sanitation facilities in the slums. * Professor, Department of Economics, University of Chittagong, Bangladesh and Ph.D. student, Northern Illinois University, USA. Email: [email protected]. Acknowledgement The author is grateful to Research and Publication Cell of the University of Chittagong, Chittagong, Bangladesh for providing financial support to conduct this research.
Transcript of Willingness to Pay to Prevent Water and Sanitation-Related ...

Willingness to Pay to Prevent Water and Sanitation-Related Diseases Suffered
by Slum Dwellers and Beneficiary Households: Evidence from Chittagong,
Bangladesh Mohammad Nur Nobi*
Abstract:
A majority portion of the slum people is involved in service sectors. The city dwellers are
somehow dependent on the services of those people. Pure drinking water and hygiene is a
significant concern in the slums. Because of the lack of these two items, the slum people are
getting sick, which causes the interruption to their services. In addition, they can transmit the
diseases they suffer from to the service receiver. With these aims, this study endeavors to
explore the willingness to pay of the households who receive the services of the slum people
using the mixed-method techniques. Under this technique, 265 households were surveyed
through face-to-face interviews, and 10 KIIs were conducted with slum people. The study's
findings suggest that the households showed their willingness to pay for the improvement of
the water and sanitation facilities in the slums. However, the KIIs findings show that the slum
people are not willing to pay for the improvement as they claim that government should finance
the project of improving water and sanitation facilities in the slums.
* Professor, Department of Economics, University of Chittagong, Bangladesh and Ph.D. student,
Northern Illinois University, USA. Email: [email protected].
Acknowledgement
The author is grateful to Research and Publication Cell of the University of Chittagong, Chittagong,
Bangladesh for providing financial support to conduct this research.

Willingness to Pay to Prevent Water and Sanitation-Related Diseases Suffered
by Slum Dwellers and Beneficiary Households: Evidence from Chittagong,
Bangladesh
1. Introduction
The slum and city are integrated part of a modern life. In Chittagong 0.36 million people
live in the 1814 slums (Daily Star, 2009). The percentage of the slum people is about 18.31
of the total population in Chittagong (New Age Metro, 2005). In the slums, 50% of
population has energy intake of < 1805 kcal / person / day which means they are living with
extreme poverty. Moreover, 11% of the children are affected by diarrhea and malnutrition,
and children and women are high proportion in the slum (BNHS, 2002), which reflects the
bad health condition of the slum people.
These slum people are involved with various important service sectors; such as domestic
works, rickshaw pulling, day labour, garment works, cleaning and many others self-
employments sectors (Daily stars, 2009). As a result, the city dwellers depend on the
services of the slum’s people to maintain and enjoy the happiness in their lives (Alam,
Sultan, and Afrin, 2010. But, very often the slum people get affected by some disease like
gastric pain, dysentery, skin diseases, diarrhea, pain, general weakness and yellow fever
etc. because of the water and sanitation-induced problems in the slum (Sabur and Sarkar,
1998). Sometimes they had to embrace with the death because of these diseases. Lack of
safe water is a cause of this whereas water related diseases are responsible for 24% of all
deaths (Water aid /internet). The effect of water and sanitation-induced diseases of the slum
dwellers can be divided into direct and indirect effects. Direct effect can be measured by
adding up their averting activities cost, mitigating activities cost and loss of income in terms
of opportunity cost. But being affected by disease, the slum people have two indirect effects
to the society. First one is the loss of society’s production or welfare as the labour supply
(by these service people) decreases because of their illness, and the second one is the
transmission of diseases to the other people who come into the touch of them for enjoying
the services of them.
So, the diseases that domestic workers suffer due to polluted water and unhygienic
sanitation negatively affects the society by reducing their services and spreading out the
diseases to others. This is why, to avoid the loss of society’s wellbeing and not to allow the
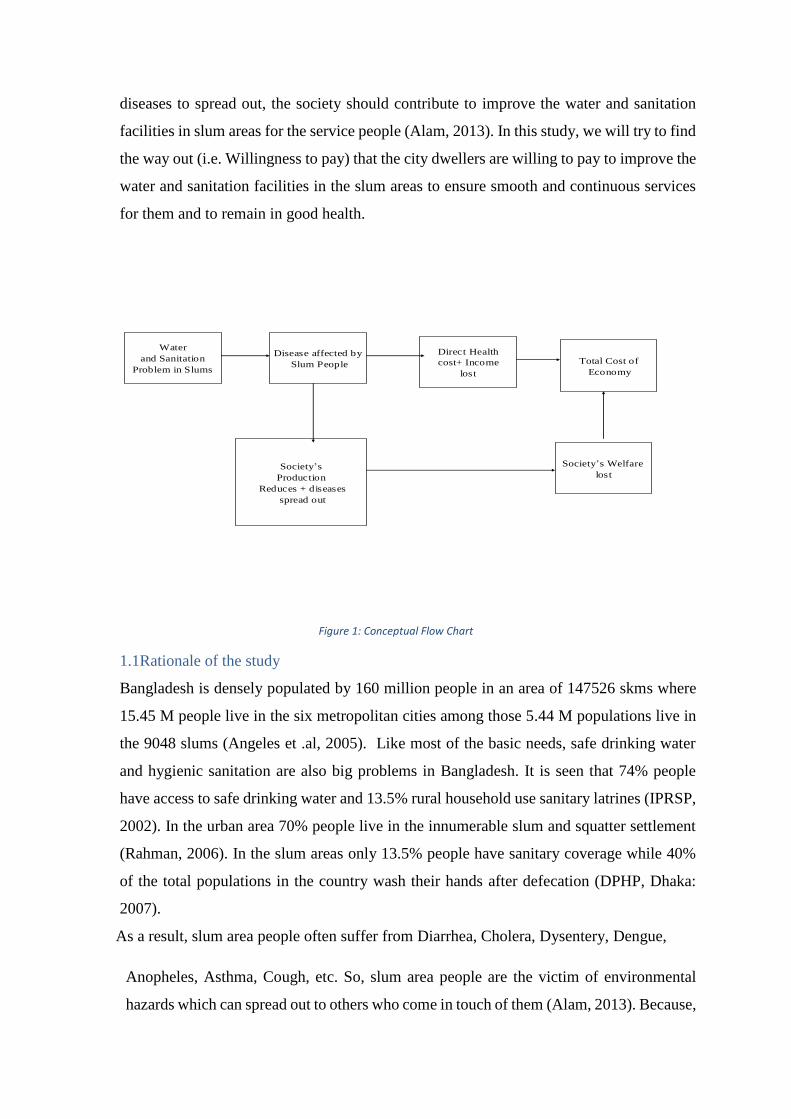
diseases to spread out, the society should contribute to improve the water and sanitation
facilities in slum areas for the service people (Alam, 2013). In this study, we will try to find
the way out (i.e. Willingness to pay) that the city dwellers are willing to pay to improve the
water and sanitation facilities in the slum areas to ensure smooth and continuous services
for them and to remain in good health.
Water and
Sanitation
Problems in
Slum area
Water
and Sanitation
Problem in Slums
Disease affected by
Slum People
Direct Health
cost+ Income
lost
Society’s
Production
Reduces + diseases
spread out
Society’s Welfare
lost
Total Cost of
Economy
Figure 1: Conceptual Flow Chart
1.1Rationale of the study
Bangladesh is densely populated by 160 million people in an area of 147526 skms where
15.45 M people live in the six metropolitan cities among those 5.44 M populations live in
the 9048 slums (Angeles et .al, 2005). Like most of the basic needs, safe drinking water
and hygienic sanitation are also big problems in Bangladesh. It is seen that 74% people
have access to safe drinking water and 13.5% rural household use sanitary latrines (IPRSP,
2002). In the urban area 70% people live in the innumerable slum and squatter settlement
(Rahman, 2006). In the slum areas only 13.5% people have sanitary coverage while 40%
of the total populations in the country wash their hands after defecation (DPHP, Dhaka:
2007).
As a result, slum area people often suffer from Diarrhea, Cholera, Dysentery, Dengue,
Anopheles, Asthma, Cough, etc. So, slum area people are the victim of environmental
hazards which can spread out to others who come in touch of them (Alam, 2013). Because,

the urban dwellers enjoy the services of the slum dwellers, especially by women in
domestic works and male in rickshaw pulling, day labour and many other services. An
Indian study opined that the slum people are prone to suffer from waterborne diseases like
typhoid and cholera, cancer and HIV/AIDS (Drishti, 2018).
Children in the slum are found to be affected by the acute diarrhea because of the lack of
proper sanitation facilities and pure and clean water (Hauque et. al., 2003). They also
found providing pure drinking water can avoid the infection as parent or families are taking
care of the children.
Alam et al. (2013) have studied on the faculties of the slums in Rajshahi city. They have
reported that most of the households (58%) mentioned jaundice as the water contaminated
diseases in the slums. Then after the second visible diseases in the slums is diarrhea (48%)
followed by dysentery (33%) and typhoid (24%).
Democracy Watch (2014) has conducted a research work among the slum dwellers in
Dhaka city, where the findings show that the percentage of people washing their hands
after using toilet and before eating is very low. It also found that most of the slum dwellers
are habituated to use hanging latrines. This study has disclosed the fact that most of the
slum dwellers suffer from water- borne diseases, like typhoid, diarrhea, and chronic
dysentery. This study has identified that the slum people do not understand properly that
use of poor sanitation system and infection of diseases has causal relationship.
According to Bangladesh Bureau of Statistics (2015) a considerable number (45.21%) of
slum people depend on the water supplied by the authority which shows that the slum-
living people have poor access to clean water, as the piped water are not pure and hygienic
in most of the cases. It also reported that 42.19% slum dwellers are used to have
unhygienic toilets. (bdnews24.com, 2015)
A 2009 baseline survey by Human Development Research Centre shows that majority of
slum people are aware of hygiene rules and regulations but hardly could they maintain those
rules and thus maintaining hygiene is very low. This survey showed that only 1%
respondents said that they wash their hands before eating and 13 % said that wash their
hands after wiping a child’s bottom. Female in the slums are main victims of unhygienic
lifestyle because of cooking, child care, cleaning the household, and for menstrual (Human
Development Research Centre, 2009).

Chittagong, the second largest city in Bangladesh is situated in the south eastern area of the
country. The total population of the city is around 4 million where more than 3.6 lakhs
(0.36 million) people live in the slum areas. In 1996, the numbers of slums in Chittagong
were 186 where 1, 88,839 people lived in 45,143 households. It is also found that only
5.86% slum people have sanitary toilet then (BBS, 1996). The Daily Star (2017) also has
published a documentary which stated that a lot of people still live in the slums in
Chittagong. According to a survey conducted by Chittagong City Corporation published in
Daily Star states that more than two hundred slums are located in Chittagong. These slums
are populated by 10 lakhs people living scattered in the city. Unfortunately, the slums are
deprived of basic facilities like water, electricity, and sanitation. The report has also
included a case from one of the populated slums in Dewanhat. The case stated that there
were only four to five toilets for more than two thousand people which depicts the adverse
scenario of the slum dwellers in the city (Daily Star, 2017)
In contrast, in 2005 the number of slums reached to 1814 where 18.31 % of total
populations of the city live in the slum areas (New Age Metro/ internet).
According to Angeles et. al. (2009) the number population in Chittagong city is 4,133,014
where 1,465,028 people live in 1814 slums (Table 1).
Table 1: Some Characteristics of Slum in Bangladesh
Name of the city No. of Slums Slum’s populations % of slums population
as city populations
Dhaka 4966 3420521 37.4
Chittagong 1814 1465028 35.4
Khulna 520 188442 19.5
Rajshahi 641 156793 32.5
Barisal 351 109705 30.1
Sylhet 756 97675 27.1
Source: Angeles et al., 2009 (International Journal of Health Geographic)
Though the people living in slums have poor access to basic services (i.e. pure drinking
water and hygienic sanitary), they are usually involved with some important service sectors
which are essential for the city dwellers (Alam, 2013; Alam and Hossain, 2018). About

79% of the working people of the slums are involved in informal service sectors in 15
different profession (Chowdhury, 1989). If the slum dwellers suffer from the water and
sanitation induced illness, it will ultimately affect the city dweller’s utility through the
services they receive by the slum people. Almost 19% slum people are involved in rickshaw
pulling and about 23% are involved in kitchen in hotels & restaurant and in domestic works
(Alam, Sultan, and Afrin, 2010; Chowdhury, 1989). Therefore, because of the dependency
of the city dwellers on the slum people, this study aims to explore whether the city dwellers
are willing to pay to improve the water and sanitation problems in the slums for the
betterment of their own utility function.
The findings of the study can be used to provide guidelines for the policy makers, non-
governmental organizations (NGO’s) and development partners to take proper initiatives.
It can help them to undertake water and sanitation projects in slum areas considering the
economic importance of these problems.
Moreover, the Delhi Summit on water and sanitation, 2008 has declared the inevitability of
ensuring safe water and sanitation for 1000 million people of the eight South Asian
countries by 2012. Being a founder member of the South Asian Regional Cooperation
(SARC), Bangladesh has given priority on safe water and sanitation facilities. Therefore,
the findings of this study has huge policy implication that could be helpful in framing the
targeted policy of ensuring water and sanitation facilities in the country.
1.2 Hypothesis /Research Question:
The hypothesis of this study is, the access to safe water and hygienic sanitation decreases
disease for slum people which will lead a social net gain (reducing negative externality) to
the households who receive the services of the slum people.
1.3 Aims and Objective of the Research
The broader objective of this study is, how much the urban people (Society) are willing to
pay to reduce the water and sanitation problems in slum areas which make negative
externality to them? However, the specific objectives of the study are as follows:
i) To analyze the negative externality of water and sanitation induced health problems of
slum people to the society in terms of welfare loss.
ii) To estimate the impacts of the factors that motivate Willingness to Pay (WTP) of the
households who are dependent on the services of the slum people; and
ii) To suggest policy guidelines and recommendations for improving the water &
sanitation-induced health problems in the slum areas.
1.4 Organization of the Study
The remaining sections of the study have been organized as follows; section 2 presents the
literature review. Section 3 presents methodology and Methods. Section 4 of this study
analyzes the results and discussions. Section 5 is the concluding remarks and limitations of
this study and finally the references have been articulated.
2. Literature Review:
There are many studies that broadly focus on the issue under consideration. Most relevant
among them are reviewed below:
Lack of pure drinking water and sanitation problems in the slums in Bangladesh is well
known to everyone that is supported by various studies (Alam, 2013; Alam and Hossain
2018). Ruma (2009) studied that South Asia (especially Bangladesh) is in sanitation
problems. In this region 1000 million people live in high risk and about 0.50 million
children death is caused by diarrhea and 250 million people are affected by water and
unhealthy sanitation-based diseases.
In addition to sanitation-based diseases, the slum people in Bangladesh also suffer from
environmental hazards which may spread out and may cause serious health damages to
other people. Alam (2013) concluded that slum area people are suffering from
environmental hazards that may be spread out to the other people comes in touch of them
as it is almost clear that beneficiary people of the urban area are enjoying happiness by dint
of the services of the slum area people and these disease and externalities of the slum people
have to be suffered by the urban beneficiary people.
Uddin, et.al (2006) found that people in the slum area suffer from the lack of health care
more than the other people in Bangladesh. In the slums about 70% mothers suffer from
malnutrition and anemia and less than 40% of the population has access to the basic health
care.

Mostafa, et.al (2006) showed that situation of women in the slum area is more worsening
than that of main stream women where only 24% working women has access to safe
drinking water. Those who use ponds water do not boil water it and most of them use
traditional unhygienic latrines though 30% of women use proper hygienic latrines. Thus,
they suffer by Diarrhea, Gastric Ulcer. Anemia, Cough, etc.
Alam (2005) aimed to work on the situation on water and sanitation in slums of Dhaka,
Bangladesh. In the study, he intends to find out the parents (slum Households) willingness
to pay to avert diarrhea attacks to their children originated by polluted drinking water and
unhygienic sanitation. However, the willingness to pay of the slum people is very low and
therefore problems associated with water and sanitation is deteriorating. Alam (2013) and
Islam (1994) found the similar result in their study and concluded that the situation of water
and sanitation, and environmental concerns in slums of Dhaka is worsening due to low
willingness to pay.
Chowdhury (1989) found that slum people were 208000 in 1989 in Chittagong city area
where 79% of all working people are self-employed and mostly involved in informal
service sector in 15 different professions. 19% of them involved in rickshaw pulling and
almost 23% are involved in kitchen in hotel, restaurants and domestic works. Among them
32% working people are female. He concluded that 19 people use one latrine and use
polluted water for washing and bathing. As a result Diarrhea and Malaria are common
diseases in the slum areas.
National Surveillance Project (NSP) Bulletin, No.9 (2002) emphasized on better food
security health services and sanitation facilities for urban poor people in Bangladesh. Both
for humanitarian and economic reasons it involved Government of Bangladesh, NGO’s and
donor agencies.
Nam and Son (2004) studied on household demand for improved water services in Ho Chi
Minh City. They compared between contingent valuation and choice modeling estimate.
Dwight, et. al. (2005) estimated the economic burden from illness associated by coastal
water pollution in recreation area of California, U.S.A
The reviewed studies show that no specific study on water and sanitation induced diseases
and their external affect has been conducted at national level and also in regional level in
Bangladesh. Therefore, a significant study gap remains in this areas. With this
consideration, this study endeavors to explore the water and sanitation-induced diseases in
the slums and their indirect effects to the city dwellers in terms of their willingness to pay
(WTP).
3. Methods and Methodology
3.1 Data
The study is based on primary data. There are two types of data which have been collected
from two groups of the people. First, the housemaid who work in various households are
considered the first group of the respondents of this study. The data from this group has
been collected through Key Informant Interviews (KIIs). A total of 10 KIIs were collected
from two densely populated slums in Chittagong. The first one is located at Bogarbil (6
KIIs) and the second one is located at Sholoshahar (4 KIIs). With a well-structured KII
guidelines, the respondents were asked several questions on their socio-economic
background, condition of water and sanitation facilities in the slums, its impact on their
health and their willingness to pay for the provision of proper water and sanitation facilities.
The second group of the respondents are the households where slum women work as
housemaid. The primary data has been collected from households in the city area. Houses
where slum women work is considered as the hub of external effect of the housemaid.
Various areas of the Chittagong Metropolitan have been considered as the study areas of
this study. The targeted population of this study is the household who depend on the
housemaid for their services. The initial plan of the data collection was to select 10 dwellers
from each of the targeted slums including male and female to assess the health problems
induced by water and sanitation problems. Then the households or the working places
where the selected persons work will be systematically selected as the sample unit. In case
of selection of an area as slum, the city corporation’s directory has been considered to avoid
ambiguity. From both of the sample unit personalized interviews was conducted to collect
required information. But, after the spread out of Corona Pandemic, most of the services
were shut-down and in person interviews based on selection of the occupation was
impossible. Therefore, the study focused to a specific occupation; services of the
housemaid. Finally, sample data has been collected from households who employ women
of the slums for assisting their households’ chores. The data collection was based on a well-
structured questionnaire interviews. A group of data enumerators with knowledge of

research methodology and proper training of interviewing the respondents have been
employed for two weeks. The details of the primary survey data is presented in Table 2.
Table 2: Area wise sample distribution
Serial Area Frequency %
1 Agrabad Neighborhood 46 17.76
2 Andarkilla Neighborhood 26 10.07
3 Bahaddarhat-Chandgaon Neighborhood 20 7.73
4 Chawkbazar- Bakalia Neighborhood 29 11.19
5 Bibirhat Neighborhood 21 8.11
6 Halishahar Neighborhood 29 11.20
7 Khulshi Neighborhood 22 8.49
8 Lalkhan Bazar Neighborhood 22 7.34
9 Nasirabad Neighborhood 26 9.65
10 New Market and Kotowali Neighborhood 19 6.95
Total 260 100
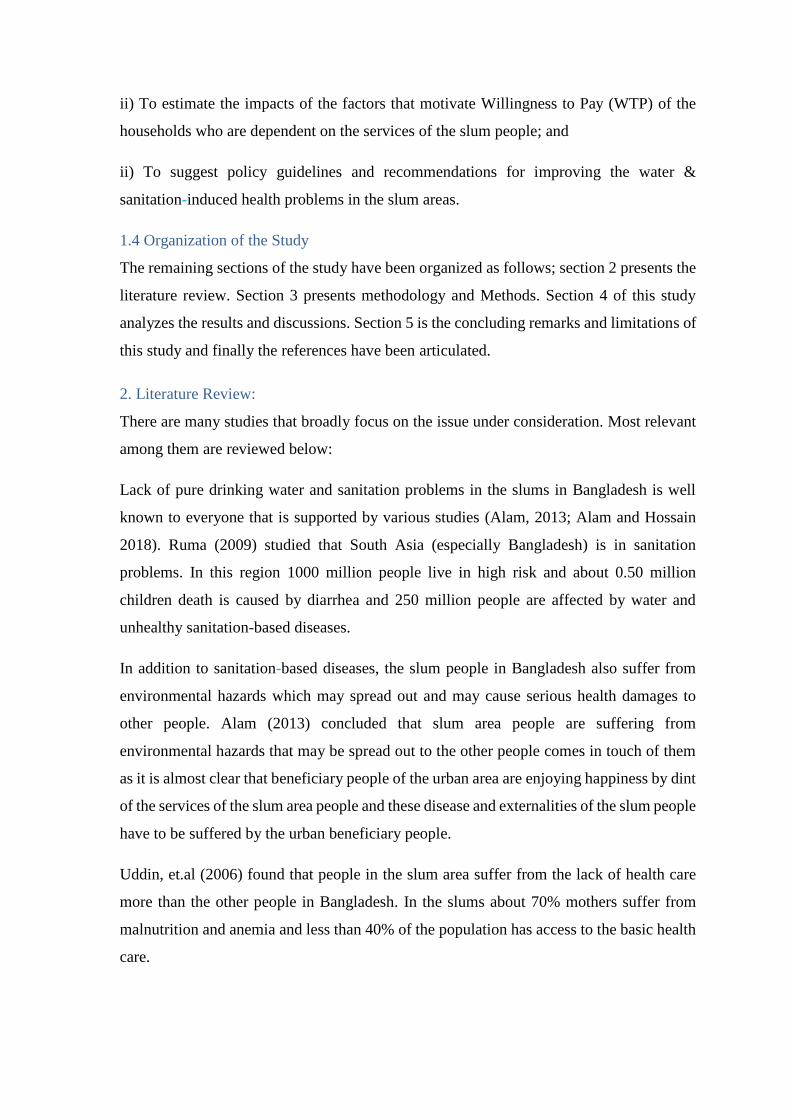
The enumerators have collected the data using face-to-face interview technique. For each
of the data GPS coordinates have been collected by which it is possible to see how evenly
data was collected from the city (Figure 2). These coordinates also explain that the data is
representative of the city dwellers as the spread of the data is wider.
They also have observed the respondents attitude as a means of participatory approach.
Since the data has been collected during January-February 2021, the enumerators maintain
the proper guidelines of social distancing, wear mask and interviewed the respondents
staying outside of the houses/flats. The initial number of sample size was 200, but with
careful observation of the various stratum the final sample stands for 260. The details of
the data collection is shown in Table 2 above.

Figure 2: Study Area Map
3.2 Econometric Model
This study will use the Contingent Valuation Method (CVM) to investigate whether a
household is willing to pay (WTP) to avoid the water and sanitation induced diseases or not.
In this regard, what factors motivate households to show their willingness to pay will be
identified. In addition, if they want to pay, how much they will be willing to pay will also be
estimated. The WTP tool is a widely used indirect stated preference tool in economics. With
the help of WPT of the city dwellers, this study will state the probable contribution to improve
the water and sanitation facilities in the slums as a social responsibility to improve the quality
of lives of the slum people which will in turn produce benefit for households. The cost of poor
water and sanitation facilities in the slums that affect people’s health function or utility
functions are estimated through the damages people suffer both by directly and indirectly. The
direct and indirect health effects of the water and sanitation induced diseases are estimated
through the following ways:
3.2.1 Direct effect:
The direct effects of water and sanitation induced problems in slum area can be measured by
their Willingness to Pay (WTP) of the slum people. The direct effect of the water and sanitation

induced problems is borne by the slum households and therefore increases their sick days. If a
sick day arises, it reduces their earnings which is their direct loss. Therefore, the slum people
were asked about their willingness to pay. In the WTP question they were asked ‘how much
they will pay not to be sick or to avoid the probability of being sick’. The underlying
methodology of the direct effect of the water and sanitation induced diseases can be understood
by following health production function:
The health production function of the working people (slum people) is;
)1(),,,( HMADSS
Here, S=Sick days, D =Disease, A=Averting Activity, M=Mitigating Activity, H=Household
Characteristics. In addition, the diseases function could be expresses as,
Disease Function; D = (WL, SL, A, Aw) ---------------------------------------- (2)
WL= Lack of access to safe water, SL= Lack of Proper sanitation facilities, Aw=Awareness.
These equations are determining the utility function of the slum households. Thus, maximizing
the slum household’s utility function is an objective function which they will try to maximize
using the constraint of money income;
Utility Function: U= (X, L , S ; H)--------------------------------- (3)
Subject to: I+ Pw (T-L-S) = X + Pa. A + Pm. M ---------------- (4)
Here Pw refers price/wage of the working time, T refers total time (Month/day), and L refers
leisure. Now, solving these equation system, we can find the values of A. M and S which can
help to assess the direct cost of water and sanitation induced diseases. The direct cost is thus
the maximum willingness to pay of the households to avoid the diseases that reduces their
utility in terms of monetary value, such as,
WTP= Pw (ds /dD) +Pa (A*/ D) + Pm ((P*/ D)- (U/ S)/. dS /dD ------- (5)
And solving the equation we find the value of A, M, S which can help us to assess the direct
cost of illness of the slum people.
3.2.2 Indirect effects
Society is the ultimate sufferer of the water and sanitation induced diseases in the slums in
the city. As the city dwellers depend on the slums people for various services, they are
sufferer through the services. Therefore, to avert the indirect effects or the external effects of
the diseases that slum dwellers suffer can be measured in two ways.

First of all, the effect which is marketable, that is reduction in society’s production or utility
due to the shortage of labour supply from the slum dwellers can be measured by Surplus
Method. That is, to avoid the external effect the society will pay the amount equivalent to what
they loss due to reduction of the labours from the slum dwellers.
Secondly, the effect which is not marketable, that is if the presence of the sick workers (service
provider, especially domestic workers) affects the household. If any member of the households
get sick (service receiver) they must spend money to get cure. Therefore, how much the service
receiver is prepared to pay in order to prevent sickness (with the presence of the slum people)
will be estimated by the Willingness to Pay (WTP) approach (Alam, 2013; Alam and Hossain
2018). That is to maintain their utility or welfare; the society will pay to improve the water and
sanitary facilities in the slum areas. Here WTP of the households/service receivers depend on
their ages, Sex (male or female; dichotomous variable), financial condition of the respondent,
level of education, occupation of the respondents, and types of workers (full time/part time)
etc. The empirical model is assumed to follow the logistic model. In a logistic is defined as
follows:
)6(1
ln 21
ii
i
ii uX
P
PL
Here, Li stands for log of odd ratios, Pi for probability, Xi is a vector of the explanatory
variables and ui is error term. The Li (log of odd ratio) is linear in parameters which could be
estimated as,
)7().........()........( 11 kk xxfxxYP
Here Y is a binary variable (Equation 7) and Y=1 stands for households’ willingness to pay for
avoidance of external effects of the slum people and Y=0 refers otherwise. Here f refers
logistic distribution function (Science Direct, 2021). This logistic distribution function
transforms the regression into the interval of 0 and 1. The logit model can be further defined
as,
)8()))...............1((log 221101 kkk xxxxxYPit
Now, following equation 8 above, the empirical model of this study stands as follows;

)9()ker
))............1((log
5432110
1
sWorofTypesOccupationIncomeFamilyEducationSex
xxWTPPit k
Here WTP refers willingness to pay, Sex is a dummy variable (1= female and 0= otherwise).
Education refers the years of schooling which is also a binary variable. The value of education
equal to 1 denotes that the respondents have 12 years and above schooling. Family income is a
quantitative variable which refers the monthly total family income of the respondents.
Occupation is another dummy variable whereas it value equal to 1 refers that the respondent is
a housewife and zero for others. Types of workers is used to identify whether the worker is a
full-time (Types of workers = 1) workers or part-time worker (Types of workers = 0).
4. Results and Discussion The result of this study has been summarized in two sections; descriptive and quantitative. In
the descriptive section summary of the findings of the two respondent groups have been
presented. In first sub-section of the descriptive finding, the Key Informant Interviews were
summarized with the qualitative matrix. In the second sub-section of the descriptive analysis
the findings of the survey of the households (city dwellers) have been summarized as
descriptive statistics. Finally, the empirical findings of the study has been summarized in the
quantitative section.
4.1 Findings of the Key Informant Interviews
As mentioned earlier, there were 10 KIIs. The KIIs were chosen from two slums in Chittagong.
The respondents of the KIIs are the group of the population who suffers from the water and
sanitation induced diseases in the slums. These respondents are providing services as
housemaids to the city dwellers. Almost all respondents were married accept one. They are
working at households to support their families. The major occupation of the husbands of the
respondents were rickshaw pulling, day labors, and small traders. In case of the respondents
living premises (slums), all women are working either in garment factories or in the households
as housemaid to support their families. The reasons that the respondents mention for doing
housemaid job are death of the husband, sickness of the husband and poverty.

Table 3: Major findings of KIIs
Therefore, they are relying on their income from this service to support their food costs,
accommodation and others relevant costs as an assistance to their husband to maintain the life
and livelihood. About 20% respondents were found to be involved as housemaid after the
pandemic spread out. 90% respondents replied that they have other family members who do
KIIs Cleaning
the slums
Quality
of
water
Facilities
of
drinking
water
Toilet
facilities
Common
diseases
Want
improvement
Who will
pay
KI-1 Cleans
regularly
good
water
Good
drinking
water
1 bath
room for 2
families
Fever and
cold
Yes
government
KI-2 Cleans but
not
regularly.
It’s stench.
deep
tube-
well, far
better
Deep tube-
well water
Wash
hands
fever,
joundis No land owner
KI-3
Cleans
regularly Good same water
2 bath
room for
30
individuals
Fever and
cold No
self but 10
taka/month
KI-4 Cleans but
stench.
Don’t clean
regularly
No good
water same water
3 bath
room for 8
families/
25 persons
fever,
jondis Yes government
KI-5 Cleans one
after
another day
motor
water
collect
when motor
starts
3
bathrooms
for 25
families
fever and
cold Yes
Self but 10
taka/month
KI-6 Cleans but
not
regularly. It
remains
stench.
Good
water and
stay all
time same water
yes, 8
families,
45 person
use 2
toilets
Fever and
cold Yes
Self and 50-
100/month
KI-7 Cleans but
not
regularly. It
remains
stench.
motor
water,
very red
with high
iron
iron water
boil and
drink Yes Fever Yes
Don’t want
to pay
KI-8 Cleans
regularly Good clean water Yes
fever and
cold Yes
Don’t want
to pay
(poverty)
KI-9 Cleans
sometimes Not good
polluted
water
1 for 30
families
fever and
cold Yes
Self but 10
taka/month
KI-10
Cleans
sometimes
but stench.
deep
tube-well
water and
stay long
clean with
alum
3 family
use 1
toilet, no
water
facilities
fever and
cold Yes
Don’t want
to pay
(poverty)

the same job. Almost all respondents were found to work as part-time and their average income
was 4000 taka. The major findings of the KIIs have been summarized through the qualitative
matrix in Table 3 above.
From Table 3, it is seen that slums are cleaned but not a regular basis and thus stench remains
there. In terms of water supply, the respondents replied that they have good water supply and
it is mostly from deep tube-well. Some areas are iron is mixed with the water and respondents
need to take extra measure like cleaning with alum. The toilet facilities in the slums are very
poor. 8-25 families’ 2-3 toilets which are cleaned weekly. Moreover, there is no water facilities
in the toilets. The most common diseases in the slums were reported as fever, cold and joundis.
The respondents want the improvement of the water and sanitation facilities in the slums but
they don’t want to pay for it. Only 2-3 out of 10 respondents showed their willingness to pay
but very negligible amount. The main argument they have is their poverty. Secondly, they
demand it to be provided by the government. The rationale of the respondents not to show their
willingness to pay for the improvement is not having financial loss as salary cut by the
households where they work. Therefore, for being sickness has no opportunity cost to the
respondents.
4.2 Descriptive Statistics
Descriptive statistics shows reliability and representativeness of the data with its population.
Various properties of the data has been depicted in this section to see how representative and
reliable the sample data with the population.
4.2.1 Age of the Respondents
Table 4 below shows the age distribution of the respondents. As shown in the table the middle
age group has the highest representation in the sample. Age group 26-30 to 46-50 has about
72% representation in the sample which shows that experienced and elderly population of the
society have been included in the sampling. These groups of people can take proper decision
based on their experiences and observation.

Table 4: Age distribution of the respondents
Age group Frequency %
20-25 19 7.57
26-30 40 15.95
31-35 39 15.29
36-40 40 15.94
41-45 40 15.94
46-50 28 10.76
51-55 27 10.38
56-66 18 6.92
4.2.2 Gender
Gender is an important characteristics of the society. Gender distribution (Table 4) of this study
shows that about 85% respondents were female whereas 15% respondents were male. The
gender distribution shows that it is discriminatory as women participation is dominating.
Table 5: Gender distribution
But it is not unlikely since women are maintaining the household chores and therefore they are
the best observers of the research problem. Thus, the gender participation is representative of
the society considering.
4.2.3 Educational Qualification
The educational qualification of the respondents has been summarized in Table 5 below. Out
of six categories of the education most of the respondents were found to have an
undergraduate degree which is counted about 27.31%. After the graduate HSC and SSC got
the highest level of education, respectively.
Table 6: Educational Background
Level of education Frequency %
Below SSC 9 4%
SSC 43 19.54%
HSC 56 25.45
Graduate 71 27.31
Doctor 3 1.36%
Master 38 17.27%
Total 220 100%
Sex No. %
Female 222 85.38
Male 38 14.62
Total 260 100%
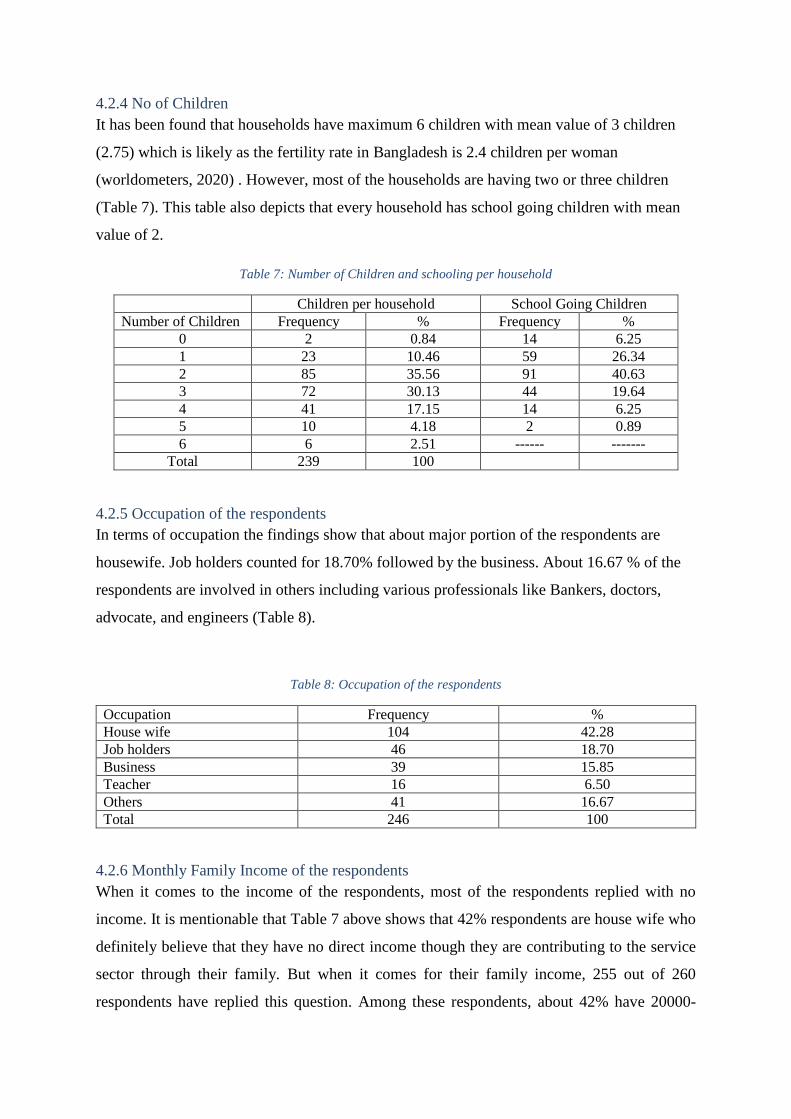
4.2.4 No of Children
It has been found that households have maximum 6 children with mean value of 3 children
(2.75) which is likely as the fertility rate in Bangladesh is 2.4 children per woman
(worldometers, 2020) . However, most of the households are having two or three children
(Table 7). This table also depicts that every household has school going children with mean
value of 2.
Table 7: Number of Children and schooling per household
Children per household School Going Children
Number of Children Frequency % Frequency %
0 2 0.84 14 6.25
1 23 10.46 59 26.34
2 85 35.56 91 40.63
3 72 30.13 44 19.64
4 41 17.15 14 6.25
5 10 4.18 2 0.89
6 6 2.51 ------ -------
Total 239 100
4.2.5 Occupation of the respondents
In terms of occupation the findings show that about major portion of the respondents are
housewife. Job holders counted for 18.70% followed by the business. About 16.67 % of the
respondents are involved in others including various professionals like Bankers, doctors,
advocate, and engineers (Table 8).
Table 8: Occupation of the respondents
Occupation Frequency %
House wife 104 42.28
Job holders 46 18.70
Business 39 15.85
Teacher 16 6.50
Others 41 16.67
Total 246 100
4.2.6 Monthly Family Income of the respondents
When it comes to the income of the respondents, most of the respondents replied with no
income. It is mentionable that Table 7 above shows that 42% respondents are house wife who
definitely believe that they have no direct income though they are contributing to the service
sector through their family. But when it comes for their family income, 255 out of 260
respondents have replied this question. Among these respondents, about 42% have 20000-
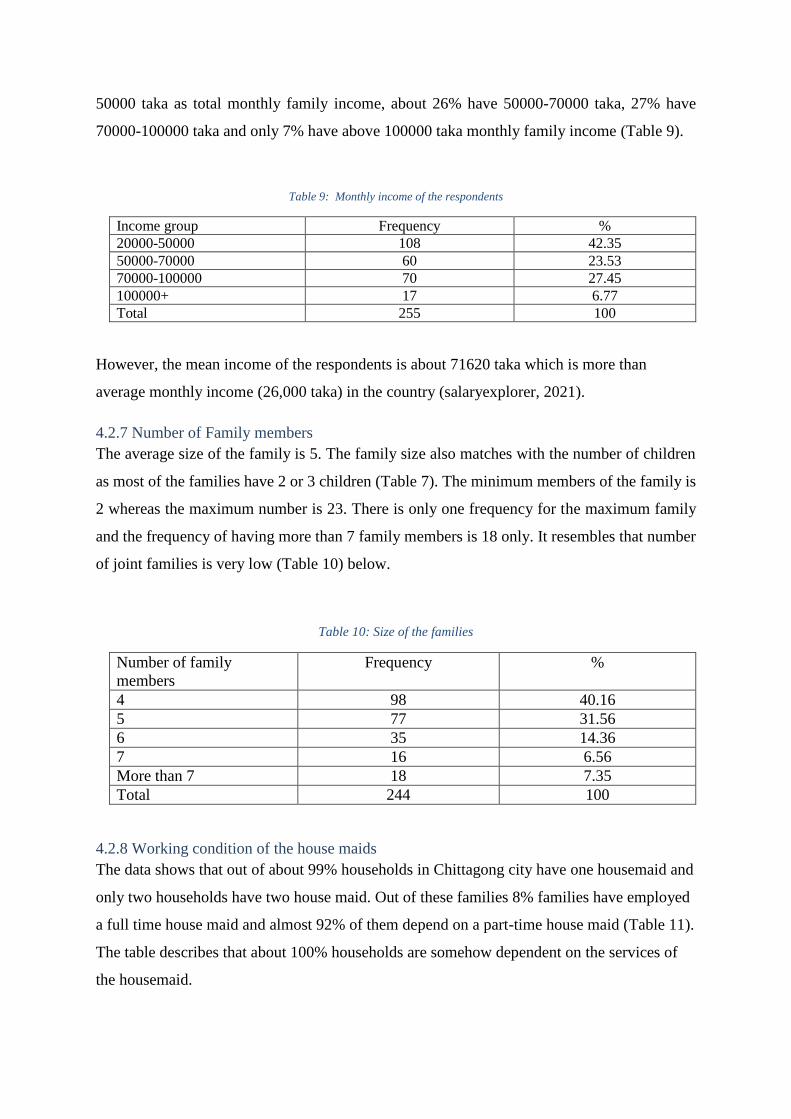
50000 taka as total monthly family income, about 26% have 50000-70000 taka, 27% have
70000-100000 taka and only 7% have above 100000 taka monthly family income (Table 9).
Table 9: Monthly income of the respondents
Income group Frequency %
20000-50000 108 42.35
50000-70000 60 23.53
70000-100000 70 27.45
100000+ 17 6.77
Total 255 100
However, the mean income of the respondents is about 71620 taka which is more than
average monthly income (26,000 taka) in the country (salaryexplorer, 2021).
4.2.7 Number of Family members
The average size of the family is 5. The family size also matches with the number of children
as most of the families have 2 or 3 children (Table 7). The minimum members of the family is
2 whereas the maximum number is 23. There is only one frequency for the maximum family
and the frequency of having more than 7 family members is 18 only. It resembles that number
of joint families is very low (Table 10) below.
Table 10: Size of the families
Number of family
members
Frequency %
4 98 40.16
5 77 31.56
6 35 14.36
7 16 6.56
More than 7 18 7.35
Total 244 100
4.2.8 Working condition of the house maids
The data shows that out of about 99% households in Chittagong city have one housemaid and
only two households have two house maid. Out of these families 8% families have employed
a full time house maid and almost 92% of them depend on a part-time house maid (Table 11).
The table describes that about 100% households are somehow dependent on the services of
the housemaid.

Table 11: Working statistics of the housemaid
Type of housemaid Frequency %
Full time 22 8.46
Part time 238 91.54
Total 260 100
The full time housemaid are employed for 24 hours indeed as they are staying with the
households. The data shows that full time workers are working minimum 6 hours to maximum
24 hours, according to the respondents. However, the average working hours for full time house
maid are found to be 22 hours though the maximum frequency (20) for working hours of the
house maid is 24.
Table 12: Wage distribution of the Full time workers
Monthly wages Frequency %
Below 3000 4 18.18
3000-4000 10 45.45
5000-7000 6 27.27
Overall cost 2 9.09
Total 22 100
According to the respondents, most of the full time house maid get a monthly wages of 3000-
4000 taka. It also includes their three times food and clothes. About quarter of the house maid
receive a highest wages of 5000- 7000 taka only (table 12).
In contrast, the part-time house maid work from 30 minutes (minimum) to 12 hours (maximum)
with the average of 2.39 hours in a day in the households. Table 13 shows that most of the part
time house maid work for 2-3 hours daily (56.17%).
Table 13: Working hours of the part time house maid
Working hours Frequency %
Less than 2 hours 69 29.36
2-3 hours 132 56.17
4-5 hours 22 9.36
6-12 hours 14 5.95
Total 235 100

The minimum wages of the part time house maid is reported as of taka 500 whereas the
maximum wage is 6000 taka with an average of 2067 taka. Table 14 below shows the
distribution of the wages of the part time house maid. It also shows that most of the house maid
(48.5%) receive below 2000 taka followed by 2000-3000 taka (41.2%).
Table 14: Wages of the part time house maid
Wages Frequency %
Below 2000 113 48.49%
2000-3000 96 41.20%
3000+ to 6000 23 9.87%
Total 233 100%
The respondents also replied that most of the households employ the house maid for cleaning
the houses and washing the clothes (50.38%). On top of this 20% respondents replied that they
require the house maid including for managing all household chores. Below 10% respondents
replied that they depend on the house maid for cooking also. Only 4% respondents rely on the
house maid for taking care of children. According to the respondents (88%) the house maid are
staying outside of the residence that is they are providing these services from their own living
arrangement. About 20% households reported that their housemaid stay in rented house but
they did not mention any specific place. However, 14% households reported that their
housemaid live in the Bogarbil; which is reported as the largest slum in the city. About 106
respondents replied the question on their knowledge about the living condition of the
housemaid.
Table 15: Working tenure of the current housemaids
Tenure Frequency %
Less than 6 months 99 38.08
Less than 1 year 46 17.69
1-3 years 78 30.00
More than 5 years 22 8.46
More than 10 years 15 5.77
Total 260 100

And those who replied, 49% opined that they know about the living condition of the
housemaids. It states that less than 25% of total respondents know about the living condition
of their housemaid only. About 38% respondents replied that their current housemaid is
working for less than 6 months and less than one years it is 18%. However, a good number
(30%) of respondents replied that the current housemaid is working for 1 – 3 years (Table 15).
4.2.9. Ownership of houses
Majority of the respondents (about 66%) are living in a rented house whereas one third of
them are living in own house/ apartment (Table 16). A few portion of the respondents were
found to be stayed in government quarters.
Table 16: Ownership of houses
Housing types Frequency %
Rented 170 65.89
Own 83 32.17
Government apartment 5 1.94
Total 258 100
Those who live in the rented houses, the average house rent per month they pay is about
15300 taka. Though the average monthly house rent is about 15000 taka but it ranges
between 7000 to 30000 taka.
4.2.10. Households sickness and willingness to pay
When respondents were asked to mention whether any member of their family suffered from
any infectious diseases after the current housemaids were employed, about 98% respondents
replied that none of their family members became sick after the current housemaid was
employed. Diseases they suffered were corona virus infection and diarrhea. In response to a
question on knowledge of housemaid on water and sanitation, about 73% respondents replied
that they believe that the housemaid has enough knowledge on water and sanitation. Almost
all respondents have replied that the housemaid drink pure drinking water, boiled water or
WASA supplied water. They also opined that the housemaid wash the hand with soap and their
housing premises are clean. Surprisingly, there came a controversial response from the
respondents which is they have taken any measures if the housemaid had no knowledge about
water and sanitation, and it shows 29% respondents replied that they have taken any measures.

Table 17: Willingness to Pay Questions
Items Yes (%) No (%) Total
Suffered from diseases (%) 1.98 98.02 100
Aware about the knowledge of housemaid 72.97 27.03 100
Have taken any measures 29.11 70.89 100
Know that housemaid knowledge on water and sanitation
may affect them
89.53 10.47 100
With this knowledge, have taken measures 53.91 46.09 100
Will support the government if any measure is taken to
provide water and sanitation facilities in the slums
98.46 1.64 100
Willingness to pay fees 56.86 43.14 100
The measures they have taken were reported as awarded her to be clean, drink boiled or pure
water, wash hands before entering to the houses, maintain sanitation etc. Among the
respondents about 90% know that housemaids’ knowledge about water and sanitation can
affect the households, and thus to make sure that knowledge about 54% of the respondents
have taken further measures. The action they have taken were also awareness building on using
proper sanitation, drinking pure water and practicing cleanliness. In this regard, most of the
respondents (98.65) have shown their willingness to support the government if the government
takes any measures to provide pure drinking water and sanitation facilities in the slums and
living arrangements of the workers. In support of voting the government on the previous
facilities, about 57% respondents have agreed to pay fees to the government or the city
corporation if they take any measures. Those who wanted to pay fees to the government or the
city corporation, were divided into paying the fees in monthly, annually, and as lump sum
(Table 18).
Table 18: Payment Vehicles and amount
Way of payment Frequency % Mean amount (Tk.)
Monthly 50 39.37 133.67
Yearly 39 30.71 414.86
Lump sum 36 28.35 448.55
Others 2 1.58 -------
Total 127 100

About 39.37 of the respondents agreed to pay by month while 31.71% expressed their views
to pay annually, and 28.38% respondents wished to pay a lump sum amount. The mean fees
that the respondents agreed to pay is about 134 taka per month, 414.86 taka per annum and
448.55 taka as lump sum. However, the average payment that the respondents are willing to
pay is about 412 taka irrespective of their payment vehicles.
In contrast, some respondents haven’t showed their willingness to pay as they believe that it
is the responsibility of the government (41.07%), responsibility of the city corporation (8%)
and responsibility of both government and City Corporation (50.86%).
The respondents were also asked to mention their monthly medical costs of the family and it
shows that on average per household’ medical/ treatment costs move around 5000 taka.
Surprisingly the standard deviation of the mean value of medical costs is very high (15911)
as the individual family costs varies most frequently. This costs ranges from 200 taka to
250000 taka per month.
After asking the per households medical/treatment costs, with another hypothetical scenario,
they were asked whether they will pay the fees/charges if the realize that the implementation
of a water and sanitation project in the slums reduces the medical costs of them.
Table 19: Households’ willingness to pay after any project is taken
Households willingness to pay Total
Vehicles Yes (%) Average amount (if yes) Didn’t mention
amount
No
Monthly 16.47 162 Taka ----
Yearly 17.80 332 Taka ----
Lump sum 39.62 337 Taka ----
73.90 4.41% 26.10 100
In response to this question, 73.90% respondents showed their willingness to pay for the
water and sanitation project in the slums.

But, when they were asked how they want to contribute the fees/charges, only 69.46%
respondents replied this question. Table 19 shows that among 39.62 % of the respondents
wanted to contribute as lump sum amount followed by yearly payment (17. 80%). On an
average respondents wanted to pay 337 taka as lump sum amount to improve the water and
sanitation facilities in the slums. Of course, 100% of the respondents replied that they believe
that raising social awareness in this regard is very essential.
4.3 Empirical Estimation
In this section the estimated results have been summarized based on equation 9 in section 3.2.2.
The estimated results are shown in Table 20 below. To have the most precise estimation, 4
different models have been estimated and in all the estimation sex and education are found to
be significant below 10% level of significance. All other variables are statistically insignificant.
Though the coefficients are statistically insignificant, signs of the coefficients of the variables
are theoretically consistent. For example, the coefficient of sex is 0.67 (in model 2) which is
also statistically significant at 5% level refers that the female respondents are 0.67 times more
likely to pay for the water and sanitation project (if it is taken at all) in the slums. Similarly,
the coefficient of education 0.388 (in model 1) denotes that respondents who has 12 years and
more schooling are more likely to pay (has willingness to pay) for the water and sanitation
facilities in the slums for the slum people who provides services to the households. But the
coefficient of the education is not statistically significant below 10%. The estimations show
that the p-value of the most of the coefficients of the explanatory variables are close to 0.2.
Table 20: Estimated Results
Coefficients Model 1 Model 2 Model 3 Model 4
Constant -0.790**
(-1.76)
-0.755
( -1.69)
-0.678
(-1.50)
-1.918**
(-1.97)
Sex 0.547
(1.41)
0.671*
(1.83)
0.66*
(1.79)
0.66*
(1.79)
Education 0.388
(1.43)
0.340
(1.28 )
0.333
(1.25)
0.333
(1.25)
Family income 0.000003
(1.09)
0.000003
(1.11)
0.000003
(1.07)
0.000003
(1.07)
Occupation 0.283
(0.99)
- - -
Full day/part time - - -0.62
(-1.35)
0.62
(1.35)
Prob > chi2 0.132 0.132
0.112 0.112
The chi2 value is also close to be significant about 10% level, especially model 3 and model 4.
Therefore, the estimated results could be accepted as it can provide some idea about the
households’ willingness to contribute for the development of the living condition of the slum
people as an effort to avoid the external health affect.
5. Conclusion and limitations
Supply of pure drinking water, usable water, and proper sanitation facilities are not well
provided in the slums in Bangladesh. As a result, due to this limitation, the slum people may
be infected by the diseases associated with water and sanitation problems. Because of the
dependency on the slum people, the city dwellers are at risk of contamination of these diseases.
Therefore, this study explores the willingness to pay for households who depend on the slum
area's services. The respondents, on average, have agreed that water and sanitation facilities in
the slums are deplorable, and therefore the housemaids who provide services to the households
may not maintain hygiene. They may also be carriers of various diseases. Most of the
respondents believe it, and thus many of them (56.86%) have shown their willingness to pay.
Respondents who disagreed on willingness to pay claimed it was paid by the government or
local government authority like City Corporation. A similar opinion was also discovered from
the KIIs with the slum people, who demanded that the government pay for these services. They
argue that they hardly manage their livelihood and thus could not pay additional fees to the
government.
Most interestingly, most of the KIIs opined that they do not suffer very much from water and
sanitation-induced diseases, and therefore, they do not have much concern. However, this study
has several limitations; firstly, a similar empirical estimation (like table 17) was projected to
assess the direct effect by collecting the quantitative survey from the slum people. However, it
has not been possible for the wide-spreading pandemic situation for the lack of data. In this
context, the KIIs were conducted to summarize the findings as a proxy. Secondly, the
estimation for indirect effect was not robust as most of the coefficients were statistically
insignificant. Despite all these limitations, this study has explored some critical findings that
could help policymakers. This study suggests the following recommendations;
(i) Government should provide good water and sanitation facilities to the slums so that their
living condition improve. The implementation of this facility may reduce the government cost
of free treatment in government hospitals.

(ii) In households where slum women work as a housemaid, they may be asked to contribute
to the implementation cost of the water and sanitation facilities, and
(iii) Society can contribute to managing this facility as a social and moral obligation because
of dependency on the slum dwellers for their services.
With the recommendations as mentioned above and limitations, this study also recommends
further robust studies in the similar topic so that both direct and indirect costs of water and
sanitation borne diseases could be identified and respective policies could be framed for the
upliftment of the unprivileged people of the society who live in the slums of the city.

References 1. Alam, M.Z., Rahman, M.A., and Firoz, M.A.A., 2013. Water Supply and Sanitation
Facilities in Urban Slums: A Case Study of Rajshahi City Corporation Slums. American
Journal of Civil Engineering and Architecture.
2. Alam, M. (2013). A Probit Estimation of Urban Bases of Environmental Awareness:
Evidence from Sylhet City, Bangladesh. Development Compilation (2013), 9(01).
3. ALAM, M. M., & HOSSAIN, M. K. (2018). POLICY OPTIONS ON SUSTAINABLE
RESOURCE UTILIZATION AND FOOD SECURITY IN HAOR AREAS OF
BANGLADESH: A THEORETICAL APPROACH. International Journal of Social,
Political and Economic Research, 5(1), 11-28.
4. Alam, M. M., Sultan, M., & Afrin, S. Analyzing Growth and Dynamics of Service Sector
Economy.
5. Angeles, G., Lance, P., Barden-O'Fallon, J., Islam, N., Mahbub, AQM., and Nazem, N.I.,
2009. The 2005 census and mapping of slums in Bangladesh: design, select results and
application. International Journal of Health Geography, 8 (32).
6. Bangladesh Nutritional and Health Surveillance in Urban Slums in Chittagong (Feb
2001-Jan 2002)
7. Bangladesh Bureau of Statistics, 1999. Census of Slum areas and Floating Population. P-
XIII
8. Chowdhury, I.U. (BKH 1989). Problems of Squatter Settlement in Bangladesh: A case
Study of Chittagong City. Web accessed on 5 February 2020.
9. Drishti, 2018. India’s Failure To Address Its Urban Slum Problem. Available at
https://www.drishtiias.com/daily-updates/daily-news-editorials/India%E2%80%99s-
failure-to-address-its-urban-slum-problem. Date accesses on 18 June, 2021.
10. Democracy Watch, 2014. Health Problems of Women Living in Slums: A Situation
Analysis of Three Selected Slums in Dhaka City.
11. Human Development Research Centre, 2009
12. Mostafa, S, et.el, 2007 ‘Situation Analysis of Labour contracting Society’s Women in
Laxmipur’ Rural Development.
13. Nasrin, M., 2007. Women and Environment: Our Society and Gender acquaintance
(Transalated from Bengali), Development Steps, Vol-5.
14. New AGE Metro, Oct 4, 2005. www.newagebd.com
15. Rahman, A. and Mozumder, P., 2002. Environmental Poverty Linkages in Bangladesh
Perspective: Need for Sustainable Development. Bangladesh Journal of Political
Economy, Vol. XVI, No.1
16. Rahman, Z., 2006. Urban Housing Settlement in Dhaka City: An Empirical Study.
Bangladesh Journal of Resource and Development. V-III/ N-I.
17. Ruma, S., 2009. South Asia in Sanitation Problems. The Daily Nayadiganta (January 2,
2009).
18. Internet/BRAC, blog: Bangladesh: Sidr Survivors begin to rebuild their lives.
19. Sabur, M.A & Sarkar, K.H., 1998. Health Problems and Health Care-Seeking Behaviour
in Urban Slums in Bangladesh. April-May 1998/ Internet
20. Salararyexplorer, 2021. Available at http://www.salaryexplorer.com/salary-
survey.php?loc=18&loctype=1#:~:text=A%20person%20working%20in%20Banglades
h%20typically%20earns%20around,other%20benefits.%20Salaries%20vary%20drastic
ally%20between%20different%20careers.
21. Science Direct, 2021. Available at https://www.sciencedirect.com/topics/economics-
econometrics-and-finance/logit-model. Date accessed on 17 June, 2021.
22. Uddin, M. et.al, 2006. Food Fortification: A Case for Bangladesh Public Health.
Bangladesh Journal of Resource and Development. V-III/ N-I.
23. Water Aid: www.wateraid.org. Date accesses on 6 May, 2021
24. Worldometer, 2020. Avaiable at
https://www.worldometers.info/demographics/bangladesh-demographics/. Date
accessed 13 June, 2021