Will a greater investment in renewables lead to more jobs in Europe?
19
Will a greater investment in renewables lead to more jobs in Europe? T T H H E E I I M M P P A A C C T T O O F F R R E E N N E E W W A A B B L L E E S S O O N N E E M M P P L L O O Y Y M M E E N N T T A A N N D D E E C C O O N N O O M M I I C C G G R R O O W W T T H H A A l l t t e e n n e e r r P P r r o o g g r r a a m m m m e e - - D D i i r r e e c c t t o o r r a a t t e e G G e e n n e e r r a a l l o o f f E E n n e e r r g g y y o o f f t t h h e e E E u u r r o o p p e e a a n n C C o o m m m m i i s s s s i i o o n n ( ( ( T T T R R R E E E N N N ) ) ) Background The EU Member States are encouraging renewables deployment as an alternative, indigenous energy source with low environmental impacts - making the renewable energy industry one of Europe's fastest growing sectors. Recently, policy makers have started to recognise the additional economic benefits that renewables can provide, in particular their potential to generate employment. But how can we quantify these employment effects? To understand them in more detail, the European Commission launched a major EU- wide study in 1998. This study, carried out under the ALTENER programme and an initiative of EUFORES, was designed to answer the key question: WILL A GREATER INVESTMENT IN RENEWABLES LEAD TO MORE JOBS IN EUROPE? The study provides comprehensive information about the employment created as a result of investment in renewable energy technologies, and will be of practical interest to many different groups, including: · POLICY-MAKERS and other decision-makers - who need to understand the relationship between investment in renewable energy and employment; · THE ENERGY INDUSTRY - the study provides comparative data on employment created per unit of energy output; · REGIONAL AND LOCAL AUTHORITIES - since new renewable energy developments make a significant contribution to the local economy; · INVESTORS IN NEW ENERGY TECHNOLOGIES - as the renewable energy market expands both in the EU and world-wide; · THE GENERAL PUBLIC - to raise awareness about the wider benefits of increased deployment of renewable energy technologies.
Transcript of Will a greater investment in renewables lead to more jobs in Europe?

Will a greater investment in renewables lead to more
jobs in Europe?
TTTHHHEEE IIIMMMPPPAAACCCTTT OOOFFF RRREEENNNEEEWWWAAABBBLLLEEESSS OOONNN EEEMMMPPPLLLOOOYYYMMMEEENNNTTT AAANNNDDD EEECCCOOONNNOOOMMMIIICCC GGGRRROOOWWWTTTHHH AAAlllttteeennneeerrr PPPrrrooogggrrraaammmmmmeee ---
DDDiiirrreeeccctttooorrraaattteee GGGeeennneeerrraaalll ooofff EEEnnneeerrrgggyyy ooofff ttthhheee EEEuuurrrooopppeeeaaannn CCCooommmmmmiiissssssiiiooonnn
(((TTTRRREEENNN)))
Background The EU Member States are
encouraging renewables deployment as an alternative, indigenous energy
source with low environmental impacts - making the renewable energy industry one of Europe's fastest growing sectors. Recently,
policy makers have started to recognise the additional economic
benefits that renewables can provide, in particular their potential to
generate employment. But how can we quantify these
employment effects? To understand them in more detail, the European Commission launched a major EU-
wide study in 1998. This study, carried out under the ALTENER programme and an initiative of
EUFORES, was designed to answer the key question:
WILL A GREATER INVESTMENT IN RENEWABLES LEAD TO MORE JOBS
IN EUROPE?
The study provides comprehensive information about the
employment created as a result of investment in renewable energy
technologies, and will be of practical interest to many different groups,
including: · POLICY-MAKERS and other decision-makers - who need to
understand the relationship between investment in renewable energy and
employment; · THE ENERGY INDUSTRY - the study
provides comparative data on employment created per unit of
energy output; · REGIONAL AND LOCAL
AUTHORITIES - since new renewable energy developments make a
significant contribution to the local economy;
· INVESTORS IN NEW ENERGY TECHNOLOGIES - as the renewable energy market expands both in the
EU and world-wide; · THE GENERAL PUBLIC - to raise
awareness about the wider benefits of increased deployment of renewable
energy technologies.

1
Headlines The renewable energy industry is one of Europe’s fastest growing sectors, as Member States encourage renewables deployment as an alternative, indigenous energy source with low environmental impacts. Policy makers now recognise that there are also additional economic benefits from renewables, especially in terms of the potential for employment creation and the development of a strong export industry. This report summarises the findings from an EU-wide study into the impacts of renewable energy on employment in Europe to 2020. Key findings are as follows: • Energy produced from renewable sources is predicted to increase by a factor of about 2.4,
from a base of 440 TWh in 1995 to 1,066 TWh by 2020. The modelling predicts increases in the capacity and output of all the renewable energy technologies studied, and in all Member States. These predictions also represent an increase in the overall proportion of final energy consumption in the EU provided by renewables1 from 4.3% in 1995 to 8.2% by 2020.
• The modelling predictions estimate that this increase in energy provided from renewable
sources can result in the creation of over 900,000 new jobs by 2020. 385,000 jobs are predicted to be created by 2020 from provision of renewable energy, and a further 515,000 jobs from biomass fuel production. This increase takes account of the direct, indirect and subsidy effects on employment, and jobs displaced in conventional energy technologies.
• Jobs gains are greatest from biomass technologies - both in the biomass energy industry and
in fuel supply - however all technologies show long-term net job creation. • Renewable energy technologies are in general more labour intensive than conventional
energy technologies, in delivering the same amount of energy output. • Jobs displaced as a result of subsidies to support renewable energy deployment are
significantly less than corresponding job gains (both direct and indirect impacts) elsewhere in the economy.
• Job gains are greatest in the agriculture and manufacturing industrial sectors. The
conventional energy supply industry is predicted to lose less than 2% of its work force by 2020 as a consequence of the shift to a greater use of energy from renewable sources.
• All technologies generate a net increase in jobs during the construction phase. For some
technologies however there are net employment losses during the operational phase. • Employment creation occurs in all Member States. Germany, France and Italy have the
greatest absolute employment increases, whilst Denmark, Greece and Austria achieve the highest proportional increase relative to the size of their labour force.
The results from the study will be of practical interest to many different groups, including policy makers, the renewable energy industry, regional and local authorities, investors, and will help to raise general awareness about the employment benefits from renewable energy technologies.
1 Excluding large hydro, geothermal, wave and tidal energy which were not included in the analysis.

2
Introduction The rationale for the promotion of renewable energy technologies in the EU has focused around their potential contribution to energy security and the environment. Increasingly, however, there is a realisation that the widespread deployment of renewable energy technologies has the potential to offer additional benefits, such as improved industrial competitiveness and the development of a strong export industry, regional development and the creation of employment, especially in more remote areas. Agricultural regions in particular can benefit from stimulation of biomass industries to halt the decline in jobs, by encouraging a switch from traditional food crop production to non-food biomass production. The European Commission in its White Paper and Action Plan on Renewable Energy Sources in 1997 proposed an objective to double the contribution of renewable energy in Europe by 2010, to 12% of gross inland consumption. The Campaign for Take-Off, launched in 1999, presents detailed priorities for initiatives to achieve this objective. The rationale for the Action Plan is driven not only from the environmental dimension, but also recognises the important economic, employment and social benefits that an increase in renewable energy use can bring. A number of studies have looked at the impact of renewable energy on patterns of employment - these have generally investigated the effects of renewables either at the individual technology level, or in a specific region or country. Most studies have generally focused on the direct employment benefits from renewable energy; i.e. they considered jobs at the plant level, and/or in manufacturing and associated industries. However, such studies have not generally identified the implications on employment from a subsequent decrease in energy used from conventional sources; nor have they considered the economic impacts of the (sometimes considerable) levels of subsidy provided to renewables on the rest of the economy. There is therefore a need to provide quantitative information to policy makers involved with renewable energy and interested in its impact on the wider economy - for example, what kind of impacts occur, in terms of jobs/GWh output or jobs/MW installed, as a result of investment in renewable energy? Renewable energy is now recognised as an important mainstream industry, and as such it must therefore compete with other sectors for public and private investment. A detailed understanding of the economic benefits provided from renewable energy is important for decision-makers in national, regional and local planning. To this end, a study was carried out during 1998-9, to evaluate and quantify the employment and economic benefits of renewable energy in the EU. The study, funded by the European Commission through the ALTENER programme, was initiated by EUFORES and carried out by a consortium of organisations led by ECOTEC Research & Consulting Ltd.

3
The Challenge The study set out to answer the question:
“Will an investment in renewables lead to more jobs and economic growth?” A complete analysis of employment impacts from renewable energy needs to take account of the jobs created both directly and indirectly as more renewable plant are manufactured, installed and operated. It should also consider the jobs displaced in conventional (fossil or nuclear) energy plant, or jobs lost because of subsidies provided to renewables that could otherwise fund employment in other sectors of the economy. This type of analysis had not been carried out before at the EU level. One of the principal objectives of the study was therefore to develop a methodology that could calculate the economic and employment impacts of investment in new renewable energy technologies. This methodology could then be combined with an existing energy model predicting future penetration levels of renewables in the EU, to determine the impacts of an increase in renewable energy on employment.
The Approach Methodology development The methodology developed during the study takes a two-stage approach to calculating the employment effects from renewable energy:
• Stage 1: Projecting the future energy market, and the market share of renewable energy to 2020. This modelling uses the SAFIRE 2 energy model to predict the levels of market penetration for the various renewable energy technologies, and the resulting displacement of conventional energy technologies. Any gains in employment or economic development achieved through an increase in renewable energy will be offset by corresponding changes - and in particular losses - in the conventional energy industries as energy supplied from these industries is displaced by energy from renewables.
• Stage 2: Estimating the economic and employment impact of the market changes. An input-output model (termed the RIOT model - Renewables enhanced Input-Output Tables) was developed for the study, to calculate employment impacts. This in turn is based on the calculation of production functions that represent the value of inputs (including employment) from the various industrial sectors of the economy needed to produce a unit of energy, for different energy technologies (both renewable and conventional).
2 SAFIRE (Strategic Assessment Framework for Rational Use of Energy) is an established model, which analyses the impact of different modes of energy consumption, the introduction and spread of energy technologies, and energy policies on a number of indicators. It was used as the basis for the development of the TERES and TERES II modelling projects - TERES II formed the basis of the development of the targets presented in the EC’s White Paper on Renewable Energy Sources.

4
The outputs from the RIOT model are presented in terms of net impacts, i.e. taking account of employment displaced in conventional energy technologies. The analysis separates out direct, indirect and subsidy impacts: • Direct impacts are defined as effects within the energy industry (for the renewable and
conventional power and heat technologies) or in the agriculture industry (for the renewable fuel technologies)
• Indirect effects are impacts elsewhere in the economy induced by changes in the purchasing activities of the renewable and conventional energy technologies.
• Subsidy impacts arise when Government or price subsidies artificially support the renewable energy technology. As a result consumers have less to spend elsewhere in the economy.
Combining these two models, the study approach is able to predict, for a specific policy scenario, the subsequent employment and economic impacts. These can be expressed as the ratios of net additional employment per unit of capacity, for different renewable technologies. Employment effects are measured in Full Time Equivalents (FTEs). The number of FTE working in the economy is calculated from adding full-time workers to part-time and seasonal workers weighting the latter two according to how many hours a year they work. The definition of a full time worker is usually someone that works more than 30 hours a week all year round. The RIOT analysis relates only to domestic employment in the 15 Member States generated as a consequence of new domestic renewable energy plant or biomass fuel supply. Any additional employment created as a consequence of exports is not included. In addition, domestic employment in the manufacturing of renewable energy plant is modified to take account wherever possible of imports of technologies. However, the subsequent employment benefits generated as a result of export sales within the EU have not been included in the results presented here. To do this would require a detailed knowledge of the patterns of trade between EU countries, and in particular the relative contributions of each country to total EU export (i.e. non-domestic) sales of renewable energy goods and services. This level of trade information was not readily available for many of the renewable energy technologies studied.
Policy scenario The policy scenario used for the study was based on the ‘best practice’ scenario from TERES II, which takes account of measures and policies in support of renewable energy development in all the Member States. The SAFIRE model’s data inputs were then reviewed and updated to reflect changes in individual country policies, technology costs etc., since TERES II was completed. The base year for the study was 1995. Three time periods were considered for the study, 2005, 2010 and 2020, with the following investment scenario for the three time periods:
• Short term: During the first time period, up to 2005, it is considered that renewable energy will still require investment support. Renewables continue to be supported by similar renewable energy programmes to those that are implemented throughout Europe today. These provide a range of subsidies from direct capital subsidies through to fixed rate income per kWh for the output of renewable energy.

5
• Medium term: During the second time period, from 2005 to 2010, a European wide carbon tax or equivalent tax is implemented. The level of taxation is determined at a national level to reflect the costs of pollution and climate change and internalise them in the price of energy. It is assumed that a minimum European level for the tax will be set. However, the implementation will be determined by an extension of national policies already implemented in the area of environmental taxation.
• Long term: In the third time period, to 2020, convergence of renewable energy prices and conventional energy prices occurs. This is due to the combination of policies of government support, up to 2005 and internalisation of external costs, up to 2010. Thus by 2020, no new subsidies are predicted from the SAFIRE model, however there are still residual subsidy effects evident as a result of long term government support programmes.
Data collection To support the methodological approach, all project partners carried out a comprehensive programme of data collection. Firstly, information was collected to update the SAFIRE model’s input tables for each of the EU15 Member States. These updates incorporated changes and developments in national policies on energy and agriculture (subsidies, taxes, price support mechanisms, etc.), revised technology costs, and any national plans or targets proposed for renewable energy penetration levels. Secondly, the RIOT methodology uses a comprehensive set of production functions for each of the energy technologies in each of the 15 Member States. Data was collected on employment, and spending on goods and services, for renewable and conventional energy installations in the Member States. Secondary data was also collected on the energy market, prices and subsidies relating to renewable energy in each Member State. These production functions were completed for key country / technology combinations where the technology is (or is expected to) make a significant impact in terms of energy penetration. For the remaining technologies in each country, data from an appropriate production function developed for another country were used. All data compiled related to either the construction and installation (C&I) or the operation and maintenance (O&M) phase of the plant. Similar datasets were also compiled for the appropriate conventional energy technologies - combined heat and power, power generation, and heat. Technologies and biomass fuels studied: The renewable energy technologies and biomass fuels included in the study are described as follows: Wind energy - electricity generated from wind turbines. Most wind turbines are built on land (onshore), but there is increasing interest in exploiting offshore wind energy. Solar energy - can be harnessed using photovoltaic (PV) panels, which generate electricity directly. Solar thermal collectors are used for heating. In the future, an increasing amount of electricity may also be generated from solar thermal sources (solar thermal electricity). Biomass - can be used to produce heat, electricity or biofuels for use in vehicles, through combustion, gasification or anaerobic digestion of a range of fuels, including forestry residues, agricultural wastes and energy crops, and solid and liquid industrial and municipal wastes. Small-scale hydro electricity (<10 MW) is produced by the natural flow of water through turbines installed in small river courses.

6
Large-scale hydro, wave, tidal and geothermal were excluded from the study, as was passive solar. Production functions for three principal forms of conventional (fossil or nuclear) energy technologies were also compiled: Conventional CHP; Conventional power generation; Conventional heating. Most of the graphs and tables in this report present the results separately for each of the renewable energy technologies studied, and where appropriate for the different biomass fuels. However, where appropriate data are combined for the following technologies: Solar thermal = solar thermal heat + photovoltaic + solar thermal electric Wind = onshore wind + offshore wind Biomass = all biomass energy transformation technologies Biomass fuels = all biomass fuels, i.e. energy crops + forestry residues + agricultural wastes
Results - renewable energy to 2020 • The SAFIRE model predicts an increase in energy produced from renewable sources by a
factor of about 2.4, from a base of 440 TWh in 1995 to 1,066 TWh by 2020, for the specified investment and subsidy scenario.
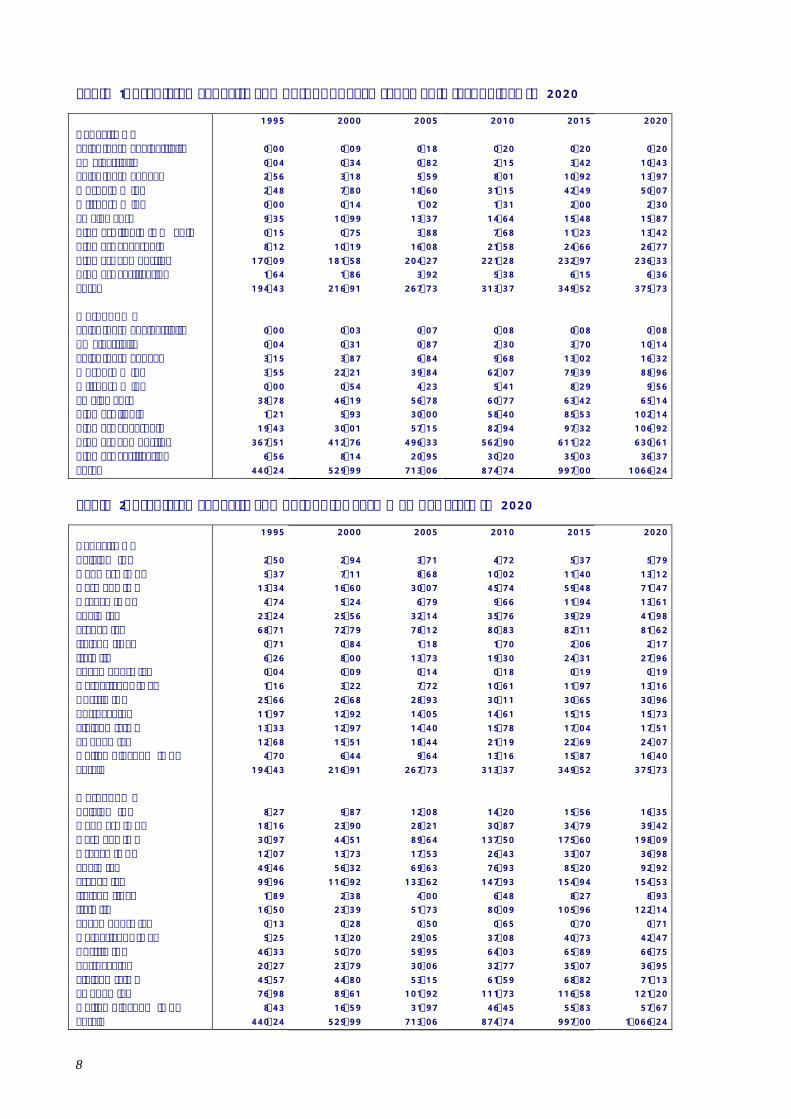
The energy predictions provided by the SAFIRE model are presented in Figure 1 and Table 1. These show the predicted capacity in GW and energy production in TWh, for each of the renewable energy technologies. • The SAFIRE model predicts increases in the capacity and output of all the renewable energy
technologies studied. The largest overall increase comes from biomass sources, especially from biomass combustion and anaerobic digestion of liquid wastes, providing electricity, heat and co-generation outputs. Total biomass capacity is predicted to increase from 180 GW in 1995 to 876 GW by 2020. Most of this increase occurs in the biomass combustion technology, however the model also predicts 102 TWh generated from liquid biofuels by 2020 (equivalent to about 10,400 million litres). The proportion of renewable energy provided from biomass sources declines, from 90% of the total output in 1995 to 82% by 2020. Much of this is due to the rapid increase in wind energy capacity, which is predicted to expand 20-fold by 2020, to 50,000 MW. The total installed capacity of photovoltaic cells in the EU is predicted to increase 100 times by 2010 and nearly 300 times by 2020, to 14 GW. The newly emerging technologies offshore wind and biomass gasification are predicted to increase in capacity and output, particularly during the period 2010 to 2020. These increases are very dependent on the level of support given through national policies, particularly subsidy support in the short term in countries such as Denmark (offshore wind) and the Netherlands (photovoltaics). • The SAFIRE outputs show an increase in energy produced from renewable sources in all
Member States. Figure 2 and Table 2 show the predicted renewable energy capacities and outputs for each of the 15 Member States over the 25 year period of the modelling study.

7
All Member States show an increase in renewable energy capacity and output, with increases in output between 1995 to 2020 of between 1.4-8. Germany, Italy and France show the greatest total increase in new renewable energy production, with an additional 167 TWh predicted for Germany. The Netherlands and the UK are predicted to increase their renewable energy production by 8 and 6.8 times, to 42 and 58 TWh respectively. Member States such as Spain, Austria, Finland and Sweden, which in 1995 were already generating a high proportion of their total energy from renewable sources, also show increases in renewable energy generation of up to 44 TWh by 2020. Figure 1: SAFIRE predictions of capacity and output from renewable energy technologies to 2020, for each renewable energy technology
Figure 2: SAFIRE predictions of capacity and output from renewable energy technologies to 2020, for each Member State
15 MS Capac i ty (GW) - SAF IRE
0
50
100
150
200
250
300
350
400
1995 2000 2005 2010 2015 2020
Belgium (B) Denmark (DK) Germany (D) Greece (GR) Spain (E)France (F) Ireland (IRL) Italy (I) Luxembourg (L) Netherlands (NL)Austr ia (A) Portugal (P) Finland (FIN) Sw eden (S) United Kingdom (UK)
1 5 M S O u t p u t ( T W h ) - S A F I R E
0
200
400
600
800
1,000
1,200
1995 2000 2005 2010 2015 2020
Belgium (B) Denmark (DK) Germany (D) Greece (GR) Spain (E)France (F) Ireland (IRL) Italy (I) Luxembourg (L) Netherlands (NL)Austr ia (A) Portugal (P) Finland (FIN) Sw eden (S) United Kingdom (UK)
8
Table 1: Predicted capacity and output of each renewable technology to 2020
1995 2000 2005 2010 2015 2020 Capacity GW Solar thermal electricity 0.00 0.09 0.18 0.20 0.20 0.20 PV electricity 0.04 0.34 0.82 2.15 3.42 10.43 Solar thermal heat 2.56 3.18 5.59 8.01 10.92 13.97 Onshore Wind 2.48 7.80 18.60 31.15 42.49 50.07 Offshore Wind 0.00 0.14 1.02 1.31 2.00 2.30 Small Hydro 9.35 10.99 13.37 14.64 15.48 15.87 Biomass liquid (GW eq.) 0.15 0.75 3.88 7.68 11.23 13.42 Biomass anaerobic 8.12 10.19 16.08 21.58 24.66 26.77 Biomass combustion 170.09 181.58 204.27 221.28 232.97 236.33 Biomass gasification 1.64 1.86 3.92 5.38 6.15 6.36 Total 194.43 216.91 267.73 313.37 349.52 375.73 Output TWh Solar thermal electricity 0.00 0.03 0.07 0.08 0.08 0.08 PV electricity 0.04 0.31 0.87 2.30 3.70 10.14 Solar thermal heat 3.15 3.87 6.84 9.68 13.02 16.32 Onshore Wind 3.55 22.21 39.84 62.07 79.39 88.96 Offshore Wind 0.00 0.54 4.23 5.41 8.29 9.56 Small Hydro 38.78 46.19 56.78 60.77 63.42 65.14 Biomass liquid 1.21 5.93 30.00 58.40 85.53 102.14 Biomass anaerobic 19.43 30.01 57.15 82.94 97.32 106.92 Biomass combustion 367.51 412.76 496.33 562.90 611.22 630.61 Biomass gasification 6.56 8.14 20.95 30.20 35.03 36.37 Total 440.24 529.99 713.06 874.74 997.00 1066.24
Table 2: Predicted capacity and output for each Member State to 2020
1995 2000 2005 2010 2015 2020 Capacity GW Belgium (B) 2.50 2.94 3.71 4.72 5.37 5.79 Denmark (DK) 5.37 7.11 8.68 10.02 11.40 13.12 Germany (D) 13.34 16.60 30.07 45.74 59.48 71.47 Greece (GR) 4.74 5.24 6.79 9.66 11.94 13.61 Spain (E) 23.24 25.56 32.14 35.76 39.29 41.98 France (F) 68.71 72.79 78.12 80.83 82.11 81.62 Ireland (IRL) 0.71 0.84 1.18 1.70 2.06 2.17 Italy (I) 6.26 8.00 13.73 19.30 24.31 27.96 Luxembourg (L) 0.04 0.09 0.14 0.18 0.19 0.19 Netherlands (NL) 1.16 3.22 7.72 10.61 11.97 13.16 Austria (A) 25.66 26.68 28.93 30.11 30.65 30.96 Portugal (P) 11.97 12.92 14.05 14.61 15.15 15.73 Finland (FIN) 13.33 12.97 14.40 15.78 17.04 17.51 Sweden (S) 12.68 15.51 18.44 21.19 22.69 24.07 United Kingdom (UK) 4.70 6.44 9.64 13.16 15.87 16.40 Total: 194.43 216.91 267.73 313.37 349.52 375.73 Output TWh Belgium (B) 8.27 9.87 12.08 14.20 15.56 16.35 Denmark (DK) 18.16 23.90 28.21 30.87 34.79 39.42 Germany (D) 30.97 44.51 89.64 137.50 175.60 198.09 Greece (GR) 12.07 13.73 17.53 26.43 33.07 36.98 Spain (E) 49.46 56.32 69.63 76.93 85.20 92.92 France (F) 99.96 116.92 133.62 147.93 154.94 154.53 Ireland (IRL) 1.89 2.38 4.00 6.48 8.27 8.93 Italy (I) 16.50 23.39 51.73 80.09 105.96 122.14 Luxembourg (L) 0.13 0.28 0.50 0.65 0.70 0.71 Netherlands (NL) 5.25 13.20 29.05 37.08 40.73 42.47 Austria (A) 46.33 50.70 59.95 64.03 65.89 66.75 Portugal (P) 20.27 23.79 30.06 32.77 35.07 36.95 Finland (FIN) 45.57 44.80 53.15 61.59 68.82 71.13 Sweden (S) 76.98 89.61 101.92 111.73 116.58 121.20 United Kingdom (UK) 8.43 16.59 31.97 46.45 55.83 57.67 Total: 440.24 529.99 713.06 874.74 997.00 1,066.24

9
• These predictions also represent an increase in the overall proportion of final energy
consumption in the EU provided by renewables (excluding large hydro, geothermal, wave and tidal energy which were not included in this study) from 4.3% in 1995 to 8.2% by 2020.
Total energy demand in the EU is rising over the period of the study, therefore it is important to assess the relative contribution made by renewable energy towards total energy demand. Table 3 presents the contribution of the renewable energy predicted through the SAFIRE modelling with the predicted total demand for energy in the EU, to 2020, as given by the European Commission’s Energy to 2020 study3. Total final energy demand is predicted to rise by 25% by 2020, but SAFIRE predicts that an increasing proportion of this demand will be met from renewable energy sources. Table 3: The contribution of SAFIRE’s predictions of renewable energy output towards total final energy demand in the EU
1995 2005 2010 2020 Total final energy demand1 (TWh) 10,350 11,375 11,950 12,950 Renewable energy output2 (TWh) 4403 713 875 1,066
Proportion from renewable sources (%)
4.3 6.3 7.3 8.2
1 From European Energy to 2020. 2 SAFIRE model - excluding large hydro, geothermal, wave and tidal energy 3 EUROSTAT data
Results - employment from renewables • The overall impact on employment from the predicted increase in renewable energy
penetration is a net increase in jobs throughout the EU. This increase takes account of the direct, indirect and subsidy effects on employment, and jobs displaced in conventional energy technologies.
Figure 3 shows the net employment predicted to be created as a consequence of the increase in energy generated from renewable sources. Data relating to the Figure are given in Table 4. The overall number of net additional jobs predicted to be created from the 1995 base year by 2020 is 385,000 (full time equivalents, FTE) jobs. In addition, a further 515,000 jobs are predicted to be created as a consequence of investment in biomass fuel production - from agricultural and forestry residues, and from energy crops. The total number of jobs predicted to be created by 2020 from renewable energy technologies together with biomass fuel provision is therefore 900,500.
3 Energy in Europe: European Energy to 2020. European Commission, 1996.

10
Figure 3: Impact on employment Table 4: Impact on employment (new net FTE employment relative to base in 1995) (data for Figure 3)
Year: 2005 2010 2020 Solar thermal heat 4,590 7,390 14,311 PV 479 -1,769 10,231 Solar thermal electric 593 649 621 Wind onshore 8,690 20,822 35,211 Wind offshore 530 -7,968 -6,584 Small hydro -11,391 -995 7,977 Bio anaerobic 37,223 70,168 120,285 Bio combustion 15,640 27,582 37,271 Bio gasification 78,524 96,026 117,151 Liquid biofuels 10,900 32,369 48,709 Energy crops 33,527 56,472 79,223 Forest residues 133,291 139,421 147,170 Agricultural waste 140,823 220,645 288,971 Total 453,418 660,812 900,546 Total excluding Fuels 145,777 244,274 385,182 Total Fuels 307,641 46,538 515,364
(Fuels = Energy crops + forest residues + agricultural waste) • Jobs gains are greatest from biomass technologies - both in the biomass energy industry and
in fuel supply - however all technologies show long-term net job creation. The vast majority of employment is created in biomass technologies, together with biomass fuel provision. By 2020, biomass use for power, heat or biofuels is predicted from SAFIRE to have the potential to create 323,000 jobs, together with the further 515,000 jobs through provision of fuel as energy crops, forestry or agricultural wastes. Note that the analysis has assumed that expansion of biological fuel sources occurs without displacing employment in conventional agriculture and forestry4. Other technologies generate more modest levels of employment, with onshore wind the greatest number at 35,000 by 2020. Solar photovoltaics and small hydro both show job losses in the early years as a consequence of larger levels of subsidy, but both show net gains in employment by 2020. These lower levels of employment are a consequence of their lower penetration predicted compared with biomass technologies, as well as their lower overall FTE/MW employment ratio. Offshore wind has a negative impact on employment to 2020, mainly because of the higher levels of subsidy still received by this technology. • Renewable energy technologies are in general more labour intensive than conventional
energy technologies, in delivering the same amount of energy output. The production functions compiled for individual renewable and conventional energy technologies give an indication of the relative employment levels for the different technologies at the individual
4 The rationale for this is that there is still widespread overproduction of many agricultural products due to price subsidies from consumers and export subsidies from the CAP even though significant areas of land are in set-aside. The political reality of how an increase in energy crop production can be brought about within the framework of CAP and international trade agreements has not been considered within this study.
New NET jobs (FTE) - RIOT
0
100.000
200.000
300.000
400.000
500.000
600.000
700.000
800.000
900.000
1995 2000 2005 2010 2015 2020
ST PV SE WN WF SH BA BC

11
plant level, for both construction and installation (C&I) and operation and maintenance (O&M). Employment data for the O&M of biomass fuel provision were also compiled. Table 5 gives production functions for all technologies and fuels (including conventional technologies as a range of values), weighted to reflect the relative contribution of each production function towards total EU capacity or output from the technology, calculated using the SAFIRE capacity and output data. Table 5: Production functions weighted averages, for direct employment in C&I and O&M (excludes solar thermal electricity)
Year: 1995 2005 2010 2020 Range Construction and installation : FTE/MEURO
Solar thermal heat 4.70 6.31 6.40 6.51 Solar photovoltaic 5.94 3.53 6.97 5.38 Wind offshore 7.64 7.79 7.48 6.71 Wind onshore 5.57 4.64 6.06 6.07 Hydro small scale 4.84 5.12 5.17 5.21 Biomass liquid 6.08 6.08 6.08 6.08 Biomass anaerobic 4.09 7.33 7.99 8.31 Biomass combustion 4.15 4.29 4.41 4.52 Biomass gasification 6.26 6.17 6.11 5.93 Fuel production energy crops 11.05 11.05 11.05 11.05 Fuel production forest residues - - - - Fuel production agricultural wastes - - - - Conventional CHP 2.3 - 5.7 Conventional power 4.2 - 13.0 Conventional heating 3.5 - 15.9 Operation and maintenance : FTE/GWh
Solar thermal heat 0.26 0.27 0.26 0.25 Solar photovoltaic 0.22 0.54 0.44 0.40 Wind offshore 0.22 0.21 0.22 0.22 Wind onshore 0.15 0.15 0.14 0.14 Hydro small scale 0.08 0.08 0.09 0.09 Biomass liquid 0.86 0.86 0.86 0.86 Biomass anaerobic 0.19 0.22 0.24 0.24 Biomass combustion 0.08 0.08 0.08 0.08 Biomass gasification 0.09 0.09 0.09 0.10 Fuel production energy crops 0.42 0.42 0.42 0.42 Fuel production forest residues 0.10 0.10 0.10 0.10 Fuel production agric. wastes 0.36 0.36 0.36 0.36 Conventional CHP 0.02 - 0.06 Conventional power 0.01 - 0.1 Conventional heating 0.01 - 0.06 • Jobs displaced as a result of subsidies to support renewable energy deployment are
significantly less than corresponding job gains (both direct and indirect impacts) elsewhere in the economy.
To an extent, and more so in the earlier years, subsidies are required to enable renewables to compete in the market with conventional energy sources. However, even when allowance is made for jobs that would have been created from alternate deployment of these subsidies (consumers buying other goods, Governments investing in alternative public services) renewables were still found to generate net jobs relative to conventional energy sources they displace. Figure 4 show the RIOT methodology’s predictions of direct, indirect and subsidy impacts of investment in renewables on employment to 2020. The largest employment increases arise from

12
direct employment impacts, i.e. jobs in C&I or O&M at the renewable energy plant, which increase from 305,000 new jobs by 2005 to 549,000 by 2020. Indirect employment, principally jobs in manufacturing, also increases, from 209,000 new jobs by 2005 to 413,000 by 2020. The greatest number of jobs displaced through subsidies occurs by 2010, where about 72,000 jobs are predicted to be displaced in other sectors of the economy. However, by 2020 these job losses have declined somewhat to 62,000, reflecting the steady decline in the amount of new subsidy made available to renewables.

13
Figure 4: Direct, indirect and subsidy impacts on employment (new net FTE employment relative to base in 1995) • Job gains are greatest in the agriculture and manufacturing industrial sectors. The
conventional energy supply industry is predicted to lose less than 2% of its work force by 2020 as a consequence of the shift to a greater use of energy from renewable sources.
Table 6 shows the RIOT predictions of the impacts of investment on employment in the major industrial sectors in the EU. From a base level of the total EU workforce in 1995 of about 147 million, the input-output analysis shows that the majority of job gains or losses occur in only a few sectors, particularly in agriculture, the energy supply industry, and various manufacturing sectors (abbreviated as Agric, Fuel and AgMach/MetProd respectively in the table). By 2020, the analysis shows a 7% increase in the number of people employed in the agriculture sector, engaged in the production, harvesting and supply of biomass fuels. By contrast, the conventional energy supply industry loses less than 2% of its work force by 2020 as a consequence of the shift to a greater use of energy from renewable sources. The RIOT analysis also defines a separate “Renewable energy manufacturing” sector (RET in the table), which in 1995 was estimated to comprise about 38,000 jobs. By 2020 this sector is predicted to expand to nearly 194,000 jobs. These jobs were adjusted (reduced) for each Member State and each technology to take account of imports; however there is no associated increase to this sector if the Member State has a significant export industry to other Member States. As a consequence, the number of jobs estimated in domestic renewable energy manufacturing should be viewed as an under-estimate, especially for countries with a well-established export industry.
-100,000 0 100,000 200,000 300,000 400,000 500,000 600,000
2005
2010
2020
Direct Indirect Subsidy

14
Table 6: Impacts on employment in the major industrial sectors (new net FTE employment relative to base in 1995) Industrial sectors: 1995 (base) 2005 2010 2020 Agric 7,663,157 288,453 407,421 512,874 Fuel 2,071,698 -21,188 -30,485 -34,444 RET 38,555 92,610 135,890 193,572 Metals 1,218,483 4,569 5,944 7,721 Miner 1,363,741 510 1,460 2,898 Chem 1,787,736 8,771 15,347 23,318 MetProd 2,826,240 19,151 22,285 26,436 AgMach 3,124,353 22,049 32,173 43,393 OffMach 738,776 84 196 401 ElecGood 3,001,134 10,384 14,849 24,399 TranspEq 2,857,927 8,557 12,640 17,167 Food 4,330,754 701 1,865 3,611 Textile 3,484,848 -788 -229 730 Paper 2,355,824 783 1,540 2,698 Plast 1,302,986 979 1,594 2,388 OthMan 3,283,655 323 1,383 3,238 Constr 9,807,506 5,231 9,055 14,979 Distrib 22,132,257 7,330 15,422 26,411 Cater 6,587,631 -58 408 1,707 LandTran 3,888,948 -2,139 -552 3,874 WaterTran 592,627 -157 128 470 OthTran 2,064,931 2,278 3,995 5,785 Communic 2,067,455 1,454 2,206 3,110 BankIns 4,702,649 10,119 15,064 20,579 OthMrk 25,402,640 8,250 14,359 22,497 NonMkt 28,730,936 -14,838 -23,146 -29,270 Total Industry 147,427,447 453,418 660,812 900,546 • All technologies generate a net increase in jobs during the C&I phase. For some
technologies however there are net employment losses during the O&M phase. The solar technologies (photovoltaic and solar thermal) and wind (on- and off-shore) in particular generate net positive employment from C&I (see Table 7). However, many renewable technologies, such as hydro, only require low levels of maintenance, hence their net employment from O&M can be negative. This is particularly apparent for employment predictions to 2005 and 2010 where additional jobs are lost from subsidies. In contrast, a large amount of labour is needed to operate a biomass plant, and to collect and deliver the biomass fuel to the plant, hence the FTE in O&M for both of these operations are highly positive, for the short, medium and long term scenario predictions. Table 7: Employment created in C&I and in O&M (new net FTE employment relative to base in 1995) FTE C&I FTE O&M Total FTE (C&I + O&M) 2005 2010 2020 2005 2010 2020 2005 2010 2020 Solar thermal 2,645 4,681 9,628 2,538 3,357 5,304 5,183 8,039 14,932 Solar PV 1,134 1,671 11,105 -655 -3,441 -874 479 -1,769 10,231 Wind 11,925 17,983 21,315 -2,705 -5,129 7,312 9,220 12,855 28,627 Small Hydro 699 1,501 2,248 -12,091 -2,496 5,728 -11,391 -995 7,977 Biomass 2,687 4,703 7,107 139,600 221,441 316,309 142,287 226,145 323,415 Biomass Fuels (O&M only)
307,641 416,538 515,364 307,641 416,538 515,364
Total 19,090 30,541 51,404 434,328 630,271 849,142 453,418 660,812 900,546

15
• Employment creation occurs in all Member States. Germany, France and Italy have the greatest absolute employment increases, whilst Denmark, Greece and Austria achieve the highest proportional increase relative to the size of their labour force.
The total employment creation predicted by the RIOT model for each of the 15 Member States is shown in Table 8. Overall, around 20% of the EU’s predicted employment creation from new renewable energy plant will come from Germany, and a further 15% from France. Italy will also contribute significantly by 2020. Employment creation in Denmark from renewables is predicted to be nearly 3% of the country’s total labour force by 2020 (Figure 5). Greece, Austria, Finland and Portugal all have predicted job creation levels higher than 1% of their total labour force, compared with the EU-wide average value of 0.6% of the labour force. Table 8: Employment creation in the 15 Member States (new net FTE employment relative to base in 1995)
Year: 2005 2010 2020 Belgium (B) 4,040 4,605 6,936 Denmark (DK) 58,758 64,546 73,539 Germany (D) 81,282 134,618 183,759 Greece (GR) 17,311 46,385 83,470 Spain (E) 37,389 44,971 84,397 France (F) 87,018 126,832 135,164 Ireland (IRL) 4,446 7,981 11,184 Italy (I) 21,405 66,201 132,077 Luxembourg (L) 353 353 353 Netherlands (NL) 13,306 5,901 8,464 Austria (A) 55,746 59,980 62,182 Portugal (P) 26,778 38,116 47,473 Finland (FIN) 20,695 26,071 30,592 Sweden (S) 15,437 19,098 22,583 United Kingdom (UK) 9,453 15,155 18,373 Total: 453,418 660,812 900,546
Figure 5: Contribution of renewables towards total employment by 2020 (% of total labour force)
0.00% 0.50% 1.00% 1.50% 2.00% 2.50% 3.00%
B DK D GR E F IRL I L NL A P FIN S UK EU15

16
Next Steps This study has enabled an assessment to be made of the overall impacts of renewables on employment in Europe. The approach was based on a sound understanding of the policy and technical factors influencing the likely development of renewable energy into the next century, combined with the compilation of a comprehensive data set of energy production functions. Overall, the results have shown that the development of renewable energy of the order calculated will generate net employment benefits, with some 385,000 net jobs generated, and an additional 515,000 jobs generated in the provision of biomass fuel supply, as a consequence of the levels of penetration predicted to 2020. The results occur as a consequence of the higher labour intensity of renewable energy technologies compared with conventional energy technologies; the reduction in imports and a higher multiplier and the utilisation of currently inefficiently used resources for biomass production. The study has provided a robust methodology that has been peer reviewed, for use with other policy scenarios, and as a basis for further examination of the economic benefits from investment in renewable energy. This methodology begins the process of redefining statistical analyses and data procedures, necessary to measure the renewable energy industry as a mainstream component of the EU economy. The study provides information about the employment created as a result of investment in renewable energy technologies, and will be of practical interest to many different groups, including: • Policy-makers and other decision-makers - who need to understand the relationship between
investment in renewable energy and employment; • The energy industry - the study provides comparative data on employment created per unit of
energy output; • Regional and local authorities - since new renewable energy developments make a significant
contribution to the local economy; • Investors in new energy technologies - as the renewable energy market expands both in the EU
and world-wide; • The general public - to raise awareness about the wider benefits of increased deployment of
renewable energy technologies.

17
The Project Team European Commission ALTENER II Programme, DG Energy Fax: +32 2 295 5852 E-mail: [email protected] ECOTEC Research & Consulting Ltd (Project Co-ordinator) 28-34 Albert Street Birmingham B4 7UDUK Fax: +44 121 616 3699 E-mail: [email protected] Energy for Sustainable Development Ltd Overmoor Farm Neston Corsham SN13 9TZ UK Fax: +44 1225 812103 E-mail: [email protected] EUFORES Rue de Trévires 99 L-2628 Luxembourg Fax: +34 91 383 3159 E-mail: [email protected]
Forum für Zukunftsenergien e.V. Godesberger Allee 90 D-53175 Bonn Germany Fax: +49 228 959 5550 E-mail: [email protected] IDAE Paseo de la Castellana 95 planta 21 28046 Madrid Spain Fax: +34 91 555 1389 E-mail: [email protected] Observ'ER Rue de l' Université 146 75007 Paris France Fax: +33 1 44 18 00 36 E-mail: [email protected] O Ö Energiesparverband Landstrasse 45 A-4020 Linz Austria Fax: +43 732 6584 4283 E-mail: [email protected]
This project was supported through the European Commission’s ALTENER Programme, contract number 4.1030/E/97/009.

TTThhheee TTTeeeccchhhnnnooolllooogggiiieeesss
PPPrrrooojjjeeecccttt PPPaaarrrtttnnneeerrrsss
European Commission ALTENER II Programme, D.G. Energy
Fax: 322 295 5852 - E-mail: [email protected]
Forum für Zukunftsenergien e.V. (Germany) Fax: 49 228 959 5550
E-mail: [email protected]
ECOTEC Research and Consulting Ltd (UK) (Project Co-ordinator)
Fax: 44 121 616 3699 E-mail: [email protected]
IDAE (Spain) Fax: 34 91 555 1389 E-mail: [email protected]
ESD Ltd (UK) Fax: 44 1225 812103 - E-mail: [email protected]
Observ’ER (France) Fax: 33 1 44 18 00 36 - E-mail: [email protected]
EUFORES (Luxembourg) Fax: 34 91 383 3159 - E-mail: [email protected]
O. Ö. Energiesparverband (Austria) Fax: 43 732 6584 4283 - E-mail: [email protected]
THE EXCUTIVE SUMMARY OF THIS STUDY IS AVAILABLE AT
http://www.eufores.org/Employment.htm
WIND ENERGY electricity generated from wind turbines. Most wind turbines are built on land (onshore), but there is increasing interest in exploiting offshore wind energy.
SOLAR ENERGY can be harnessed using Photovoltaic (PV) panels, which generate electricity directly. Solar thermal collectors are used for heating. In the future, an increasing amount of electricity may also be generated from solar thermal sources (solar thermal electricity).
BIOMASS - can be used to produce heat, electricity or biofuels for use in vehicles, through combustion, gasification or anaerobic digestion of a range of fuels, including forestry residues, agricultural wastes and energy crops.
SMALL-SCALE HYDRO electricity (<10 MW) is produced by the natural flow of water through turbines installed in small river courses.
How was the study carried out?The study takes a two-stage approach to calculating
the effects of renewable energy on employment: P Using the SAFIRE(*) model, ENERGY PREDICTIONS
were made for three time periods with the following scenario:
SHORT TERM -to 2005- with renewables still needing investment support (subsidies).
MEDIUM TERM -to 2010- by which time carbon or energy taxes will be implemented.
LONG TERM -to 2020- by which time there is convergence of renewable energy prices with conventional energy prices P The EMPLOYMENT IMPACTS of this energy scenario
were then calculated using an input-output model, RIOT (Renewable Input Output Table) developed specifically for the study. The analysis calculates net employment values, which include direct impacts - jobs in the energy industry or in the agriculture industry (for the biomass fuel technologies), and indirect impacts - jobs created elsewhere in the economy. It also takes account of jobs lost in other sectors (especially in the conventional energy sector) and the effect of subsidies on overall economic and employment effects. The analysis focuses on employment from trade in domestic (EU) markets, so takes account of the effect of imports, but does not consider jobs created by the manufacture of exports. P The consequences of both models have been further
analysed by correlating their output and finding out significant ratios, such as employment per unit of energy produced or per unit of installed capacity.
(*) SAFIRE (Strategic Assessment Framework for Rational Use of Energy) is an established model, developed by Energy for
Sustainable Development Ltd, which analyses the impact of different modes of energy consumption, the introduction and
spread of energy technologies, and energy policies on a number of indicators. It was used as the basis for the development of the
targets presented in the EC's White Paper on RES.