Wildlife Protection Recommendations for Wind Energy ... · i Wildlife Protection Recommendations...
72
i Wildlife Protection Recommendations for Wind Energy Development in Wyoming Approved By Wyoming Game and Fish Commission November 17, 2010 Much interest has been expressed in developing wind resources in Wyoming to provide renewable energy to western states, particularly California. The Wyoming Game and Fish Department (WGFD) is aware of nearly 30 new wind projects which are expected to seek regulatory approval in the next few years and we expect many additional proposals as new transmission projects enter the regulatory process. The Wyoming Infrastructure Authority, in conjunction with transmission developers, is currently studying a conceptual design capable of collecting as much as 12,000 megawatts (MWs) of new electric generation within the state. The majority of this new generation is expected to come from wind turbines. Currently, only about 1,000 MWs of wind-generated electricity is produced in the state. The recommendations contained in this document are the result of a decision by the Wyoming Game and Fish Commission (WGFC) to address the need to protect wildlife resources while wind energy is developed in the state. The recommendations are a proactive step toward balancing Wyoming’s desire to provide renewable energy to out- of-state consumers while affording adequate protection of the state’s wildlife resources from activities associated with development of a wind industry. APPLICABILITY Ultimately, the authority to make land management decisions and approve individual wind projects rests with regulatory and surface management agencies other than WGFC and WGFD, based on principals of multiple use and sustained yield set forth by the Federal Land Policy and Management Act and the National Forest Management Act or based on impact avoidance and mitigation as set forth in the Wyoming Industrial Information and Siting Act and other state and county statutes and regulations. Neither WGFC or WGFD have regulatory authority to impose any of the recommendations contained in this document – our role is strictly consultative. Most wind projects constructed in Wyoming, regardless of land ownership, will require a permit from the Wyoming Industrial Siting Council (WISC). W.S. 35-12-110 (b) requires WGFD to provide information and recommendations to the WISC regarding the impacts of industrial facilities (including wind projects, collector systems, etc.) subject to WISC jurisdiction and a specific recommendation as to whether the WISC should issue a permit. WGFD will use these recommendations as the basis of our consultative obligation to the WISC and in furthering our cooperating agency responsibilities under the National Environmental Policy Act (NEPA). These recommendations will also provide consistency during review of wind projects within WGFD. Except for Best Management Practice (BMP) 4, applicants may suggest site-specific alternative proposals for achieving the objectives of the BMPs outlined in Appendix A. The WGFD will
Transcript of Wildlife Protection Recommendations for Wind Energy ... · i Wildlife Protection Recommendations...

i
Wildlife Protection Recommendations for Wind Energy Development in Wyoming
Approved By Wyoming Game and Fish Commission November 17, 2010
Much interest has been expressed in developing wind resources in Wyoming to provide renewable energy to western states, particularly California. The Wyoming Game and Fish Department (WGFD) is aware of nearly 30 new wind projects which are expected to seek regulatory approval in the next few years and we expect many additional proposals as new transmission projects enter the regulatory process. The Wyoming Infrastructure Authority, in conjunction with transmission developers, is currently studying a conceptual design capable of collecting as much as 12,000 megawatts (MWs) of new electric generation within the state. The majority of this new generation is expected to come from wind turbines. Currently, only about 1,000 MWs of wind-generated electricity is produced in the state. The recommendations contained in this document are the result of a decision by the Wyoming Game and Fish Commission (WGFC) to address the need to protect wildlife resources while wind energy is developed in the state. The recommendations are a proactive step toward balancing Wyoming’s desire to provide renewable energy to out-of-state consumers while affording adequate protection of the state’s wildlife resources from activities associated with development of a wind industry.
APPLICABILITY
Ultimately, the authority to make land management decisions and approve individual wind projects rests with regulatory and surface management agencies other than WGFC and WGFD, based on principals of multiple use and sustained yield set forth by the Federal Land Policy and Management Act and the National Forest Management Act or based on impact avoidance and mitigation as set forth in the Wyoming Industrial Information and Siting Act and other state and county statutes and regulations. Neither WGFC or WGFD have regulatory authority to impose any of the recommendations contained in this document – our role is strictly consultative. Most wind projects constructed in Wyoming, regardless of land ownership, will require a permit from the Wyoming Industrial Siting Council (WISC). W.S. 35-12-110 (b) requires WGFD to provide information and recommendations to the WISC regarding the impacts of industrial facilities (including wind projects, collector systems, etc.) subject to WISC jurisdiction and a specific recommendation as to whether the WISC should issue a permit. WGFD will use these recommendations as the basis of our consultative obligation to the WISC and in furthering our cooperating agency responsibilities under the National Environmental Policy Act (NEPA). These recommendations will also provide consistency during review of wind projects within WGFD. Except for Best Management Practice (BMP) 4, applicants may suggest site-specific alternative proposals for achieving the objectives of the BMPs outlined in Appendix A. The WGFD will

ii
consider the applicant's proposals as we develop project-specific recommendations if the applicant can demonstrate that the alternative proposal would achieve the same level of protection outlined in the Appendix A Best Management Practices (BMPs). Because it is prudent to be as comprehensive as possible within this document, all of these recommendations (including the best management practices and monitoring recommendations) will not be applicable to all wind projects in the state and are intended to be applied based on specific characteristics of a project site determined during pre-construction surveys and in consultation with WGFD. Early consultation with WGFD is the best means available for developers to determine which recommendations are appropriate for their project area. Project developers should consult with the WGFD at least two years prior to submitting permit applications so that appropriate studies can be conducted and site-specific recommendations can be developed. Failure to consult with WGFD early will result in delays making specific recommendations to other agencies with regulatory authority.
PURPOSE AND USE OF THIS DOCUMENT
The major purposes of this document are to provide recommendations for: 1) collecting baseline data prior to turbine siting to avoid potential conflicts with wildlife; 2) construction and operations monitoring; and 3) mitigating impacts to affected wildlife. These recommendations apply to all lands within the state. This document provides guidance under the WGFC’s Mitigation Policy (WGFC 2008) and supports the WGFC’s Mission of “Conserving Wildlife – Serving People.” This document provides advanced disclosure of potential wildlife-related concerns, and suggests BMPs, planning considerations including avoidance, monitoring, research and mitigation opportunities wind developers and regulatory and land management agencies can incorporate into project siting, design, construction and operations to conserve wildlife. The recommendations should be applied based on site-specific characteristics of each project area through early consultation with WGFD. Maps of crucial big game winter ranges, sage-grouse habitat (including sage-grouse core areas), priority watersheds, and other important habitats are available from WGFD. These recommendations were prepared by WGFD staff who reviewed and incorporated pertinent literature to identify and describe reasonably foreseeable impacts to wildlife resources (refer to literature cited). A number of studies have examined effects of wind energy operations on selected species primarily birds and bats. However, there is a large gap in known information for most other species. Where appropriate WGFD gathered and interpreted information for most other species. Where appropriate, WGFD gathered and interpreted information on disturbances and activities which we believe to be comparable to those associated with wind development. While we recognize the amount of disturbances (i.e. total land disturbance), types of facilities (i.e. producing wellhead, drill rig) and intensity of activities (i.e. level of operational traffic) associated with other types of development may be more or less than those associated with wind development, the response of wildlife to those other types of development provide a reasonable means

iii
of understanding how wildlife may react to the types of disturbances and activities associated with wind development. For example, we consulted studies of wildlife responses to oil and gas development, surface mining, humans on foot, ATVs, construction activities, roads, noise levels, etc. to generally understand and predict how wildlife would react to disturbance and activities associated with wind developments. The WGFD believes this approach, when combined with best professional judgment and field experience of WGFD biologists, affords a reasonable basis for impact avoidance, mitigation, monitoring and management recommendations contained in this document.
The state of knowledge regarding potential consequences of wind development to wildlife resources is limited. As such, we recognize and fully expect that new research, much of it likely conducted in Wyoming, will lead to the need to modify these recommendations. We welcome this new research and commit to maintaining these recommendations as a ‘living document” that reflects our current understanding of the response of all the state’s wildlife to wind development. We encourage input that may improve future revisions. Please direct comments to the Wind Recommendations Chairman, Scott Gamo, Wyoming Game and Fish Department, 5400 Bishop Boulevard, Cheyenne, WY 82006.

iv
TABLE OF CONTENTS
Statement Of Principal .................................................................................... 1 Introduction .................................................................................................... 1
Review Of Wind Development Impacts To Wildlife ..................................... 2
Bats ...................................................................................................... 2 Passerines And Raptors ........................................................................ 4 Greater Sage-Grouse And Sharp-Tailed Grouse .................................. 7 Migratory Waterfowl, Waterbirds And Shorebirds ............................ 10 Big Game ............................................................................................ 12 Small Mammals ................................................................................. 13 Amphibians And Reptiles................................................................... 14
Management Concerns ................................................................................ 15
Aquatic Concerns ......................................................................................... 15
Literature Cited ............................................................................................ 17
Appendix A - - Wind Energy Best Management Practices ......................... 31
Appendix B -- Coordination/Consultation With Private Landowners & Wind Developers, Site Selection, Baseline Data Collection & Monitoring Recommendations For Wind Development, Reclamation, And Mitigation Practices ........................................................................................................ 35
Site Selection ...................................................................................... 36 Baseline Data And Monitoring Bats ................................................................................................ 38 Passerines And Raptors .................................................................. 45
Sage-Grouse.................................................................................... 48 Big Game ........................................................................................ 49 Amphibians ..................................................................................... 49 Reptiles ........................................................................................... 53 Aquatic Considerations ................................................................. 57
Reclamation ........................................................................................ 66
Mitigation .......................................................................................... 66 Appendix C – Acroynms .............................................................................. 67

v
TABLES Table 1: Pre and Post Construction Bat Survey ............................... 42 Table 2: WGFD Recommended Diurnal Raptor Survey Dates ....... 45 Table 3: Amphibians and Reptiles-Species Specific Monitoring .... 53 Table 4: SGCN Fish Species .......................................................... 64
FIGURES Figure 1: Decision Tree for Amphibian Monitoring ....................... 49 Figure 2: Decision Tree for Reptile Monitoring ............................. 52 Figure 3: Decision Tree for Progressive Channel Monitoring ........ 57

1
STATEMENT OF PRINCIPLE 1 2
Potential and documented impacts of wind energy development on wildlife are a concern for 3 wildlife population and habitat managers. In addition to the potential associated direct and 4 indirect impacts from wind energy projects, development creates additional cumulative impacts 5 on the landscape. Already, Wyoming has experienced impacts upon its wildlife populations 6 from oil, natural gas, coal bed methane, coal, trona and other extractive industries. Large-scale 7 wind development, pipelines, transmission and collector lines, potential oil shale development, 8 and other intensive land uses can further industrialize and fragment the landscape across 9 Wyoming resulting in site-specific and cumulative impacts to wildlife. 10 11 If public and private lands are to remain in a condition that sustains wildlife and outdoor 12 recreation, it is imperative that all forms of energy be developed with the least possible 13 disturbance and that the integrity and functionality of important habitat areas be maintained. 14 This document provides recommendations to achieve these goals for wind development through 15 a variety of project planning, siting, design, monitoring and mitigation considerations. 16 17
INTRODUCTION 18 19 Wind energy is an important component in the nationwide effort to reduce the effects of global 20 warming associated with carbon-based fuels. Wind development in the U.S. increased by 46% 21 in 2007, and at the end of 2007 the U.S. had the second highest cumulative wind generation 22 capacity globally. This rate of development is expected to accelerate, as U.S. energy policy 23 emphasizes reduction of carbon emissions. The Federal Advisory Committee on Wind (FAC) 24 concluded that wind-generated electrical energy, from a global warming perspective, has 25 environmental benefits including to wildlife. 26 27 Wind energy development produces electricity without air pollution, greenhouse gas emissions, 28 significant water consumption, mining, drilling, refining, waste storage and other problems 29 associated with many traditional forms of energy generation – all of which may result in benefits 30 to wildlife. The U.S. Department of Energy (DOE) estimates that a single 1.5 MW wind turbine 31 displaces 2700 metric tons of CO2 per year compared with the current U.S. average utility 32 carbon-based fuel mix. Due to these advantages, wind is expected to play an increasingly 33 important role in meeting the Nation's energy needs in the coming years. 34 35 In July 2003, the U.S. Fish and Wildlife Service (USFWS) issued “Voluntary Interim Guidelines 36 to Avoid and Minimize Wildlife Impacts from Wind Turbines.” The Department of the Interior 37 also convened a 22 member Wind Turbine Guidelines Federal Advisory Committee (FAC), 38 which reached consensus on a set of draft recommendations aimed at minimizing the impacts of 39 land-based wind farms on wildlife and its habitat. The interim guidelines are not mandatory 40 requirements in Bureau of Land Management (BLM) land use plan decisions. Until the 41 Secretary determines the applicability of final FAC guidelines for the Department of the Interior 42 (DOI) agencies, the USFWS interim guidelines are only to be used as a general guide to assist 43 the BLM in siting decisions and the design of pre-construction surveys, mitigation measures, and 44 post-construction monitoring for individual projects. WGFD has reviewed the FAC draft 45

2
document and has developed our recommendations to fall within the broad guidelines contained 46 within the latest version (Version 6, 2010). 47 48
REVIEW OF WIND DEVELOPMENT IMPACTS TO WILDLIFE 49 50 Wind development is an intensive, industrial-scale use of the land surface. Individual wind 51 project boundaries vary in size ranging from just a few turbines on a few hundred acres upwards 52 to 1000 or more turbines distributed across 80,000 to 100,000 or more acres. With current 53 technology, individual turbines typically generate in the range of 1.5-2.5 MWs. Towers range 54 from 212 to over 260 ft tall with blade sweeps of 328 ft to over 400 ft above ground level. 55 Generally, tower height increases as generating capacity of individual turbines increase. Wind 56 projects require a road network to facilitate access for construction and turbine maintenance. In 57 addition, power lines (aboveground or buried) provide for the collection of electricity generated 58 at individual turbines and delivery to substations. Collector lines connect substations at wind 59 project sites to transmission hubs. All associated infrastructure has the potential to affect 60 wildlife and habitat. 61 62 Wyoming has enviable diversity and abundance of wildlife. The state contains large expanses of 63 relatively intact native ecosystems that provide the buffer necessary for animals to spatially 64 accommodate natural or man-caused changes to their habitat. The WGFD considers loss of 65 habitats and concurrent fragmentation of habitats as the principal concern when we evaluate 66 potential perturbations to the landscape and the effect on wildlife species. Cumulative impacts, 67 fragmentation of habitats, direct and indirect impacts all contribute to declines in species habitats 68 and numbers. Although maintenance or improvement of habitat function is paramount in crucial 69 habitats (crucial big game ranges, core sage grouse areas, etc.), the future functionality of these 70 crucial habitats and the wildlife they support is dependent on maintaining adequate habitat 71 connectivity across the state to ensure crucial habitat components within the state are not isolated 72 from other crucial habitats through habitat fragmentation and construction of barriers. From this 73 perspective, the WGFD has approached wind development as another potential impact on the 74 state’s habitat capacity which is necessary to sustain wildlife found in Wyoming. The following 75 sections provide greater detail of some of the potential conflicts with wildlife species and wind 76 development in Wyoming. The Appendices outline our recommended approach to identifying, 77 understanding and ultimately avoiding and minimizing the potential detrimental effects of wind 78 projects on many of the wildlife species in Wyoming. Coordination with the USFWS’s 79 Wyoming Ecological Services Field Office, is also important for all wind development and can 80 help ensure compliance with Federal laws. 81 82 BATS 83 84 Wind energy developments can impact resident and migratory bats depending on site location 85 and the species that are present. Four types of impacts are anticipated: 1) direct mortality due to 86 collisions with turbines; 2) direct mortality resulting from rapid decompression of lungs due to 87 changes in atmospheric pressure caused by bats passing through the rotating turbine blades; 3) 88 indirect impacts due to displacement of bats from preferred feeding, roosting, and mating areas; 89 and 4) indirect impacts due to alteration of migratory pathways. Additional research is required 90 to further determine impacts to bats. 91
3
There is concern that impacts to bats from wind turbines are underestimated (Arnett 2006, Kunz 92 et al. 2007a, Arnett et al. 2008). Because bats are small, nocturnal, and cryptic, bats are often 93 overlooked during carcass searches, making it difficult to assess mortality accurately. Moreover, 94 until recently, mortality surveys were aimed primarily at assessing the impacts to avian species 95 and often failed to incorporate adequate methods to locate bats into their study design. As such, 96 these early efforts likely underestimated impacts to bats. Researchers have hypothesized that the 97 abundance of North American bats could be significantly reduced within the next 10 years if 98 efforts are not undertaken to minimize turbine impacts to bats (Kunz et al 2007b). 99
100 Of the 18 bat species found in Wyoming. Almost half have been identified in turbine-related 101 mortality assessments conducted throughout the U.S. (Johnson 2005, Arnett et al. 2008). Most 102 of the turbine-related bat fatalities tend to occur in August and September, which appears to 103 coincide with the migration of several species. Most of the bats killed by turbines tend to have 104 similar life history characteristics (Johnson 2005, Arnett et al. 2008). Although all bats may 105 have some level of susceptibility to turbine-caused mortality, in studies conducted to date, tree 106 roosting bats, eastern red bat (Lasiurus borealis), hoary bat (Lasiurus cinereus), and silver-haired 107 bat (Lasionycteris noctivagans) comprise the majority of carcasses located during ground 108 searches and appear to be most susceptible (Johnson 2005, Kunz et al 2007b, Cryan and Brown 109 2007,). Other species that are known to be susceptible are the big brown bat (Eptesicus fuscus), 110 Brazilian free-tailed bat (Tadarida brasiliensis), eastern pipistrelle (Pipistrelle subflavus), little 111 brown bat (Myotis lucifugus), northern long-eared myotis (Myotis septentrionalis) (Johnson 112 2005). Hester and Grenier (2005) provide a complete list of bats known to occur in Wyoming 113 and their ditribution. 114
115 Bat mortalities are not always the result of collisions. Researchers have recently discovered that 116 collisions with wind turbines only accounted for about half of all mortalities at a wind energy 117 facility in south-western Alberta, Canada. Necropsies of bats located during ground carcass 118 searches revealed that nearly 90% of all bat mortalities included internal hemorrhaging caused 119 by rapid decompression due to negative pressures created by rotating turbine blades (Baerwald et 120 al. 2008). Known as Barotrauma, this internal hemorrhaging was reported to be the proximate 121 cause of death for all bats that showed no external signs of fatal injuries. 122
123 Why bats are susceptible to fatality from turbines is poorly understood. Cryan and Brown (2007) 124 hypothesized that turbines may be mimicking features on the landscape that bats are attracted to 125 and may serve as rendezvous sites for migration or mating. Kunz et al. (2007b) developed an 126 additional eleven hypotheses that could explain the reasons why insectivorous bats have fatal 127 interactions with turbines. Cryan and Barclay (2009) have recently separated existing 128 hypotheses into proximal and ultimate causes. 129
130 “Linear corridor hypothesis. Wind energy development facilities constructed along forested 131 ridgetops create clearings with linear landscapes that are attractive to bats. 132 133 Roost attraction hypothesis. Wind turbines attract bats because they are perceived as potential 134 roosts. 135 136 Landscape attraction hypothesis. Bats feed on insects that are attracted to the altered landscapes 137 that commonly surround wind turbines. 138 139

4
Low wind velocity hypothesis. Fatalities of feeding and migrating bats are highest during 140 periods of low wind velocity. 141 142 Heat attraction hypothesis. Flying insects upon which bats feed are attracted to the heat 143 produced by nacelles of wind turbines. 144 145 Acoustic attraction hypothesis. Bats are attracted to audible and/or ultrasonic sound produced 146 by wind turbines. 147 148 Visual attraction hypothesis. Nocturnal insects are visually attracted to wind turbines. 149 150 Echolocation failure hypothesis. Bats cannot acoustically detect moving turbine blades or 151 miscalculate rotor velocity. 152 153 Electromagnetic field disorientation hypothesis. Wind turbines produce complex 154 electromagnetic fields, causing bats to become disoriented. 155 156 Decompression hypothesis. Rapid pressure changes cause internal injuries and/or disorient bats 157 while foraging or migrating in proximity to wind turbines. 158 159 Thermal inversion hypothesis. Thermal inversions create dense fog in cool valleys, 160 concentrating both bats and insects on ridge tops.” 161 162
Preliminary information suggests that the fatalities of bats at wind energy development facilities 163 may be predictable events following certain weather patterns (Cryan and Brown 2007, Arnett et 164 al. 2008). Hoary bat migrations appear to be predictable events following nights with high cloud 165 cover, low wind, and low barometric pressure. Other studies in the eastern U.S. support the 166 conclusions of Cryan and Brown (2007) and reported that fatalities were higher on nights with 167 light winds (Arnett et al. 2005, Arnett et al. 2008). Overcast nights and low barometric pressures 168 are also consistent with observed migration patterns for passerine birds (Alerstam 1990), 169 suggesting that both birds and bats migrate under similar conditions coinciding with the passage 170 of cold fronts. 171 172 PASSERINES AND RAPTORS 173 174 An estimated 33,000 birds are killed annually in the U.S. by wind turbines and, according to a 175 study by Smallwood (2007), this estimate may be biased low. This number contributes to 176 cumulative impacts of all bird collision mortality in the U.S., e.g. collisions with 177 telecommunications towers, collisions with moving vehicles, and collisions with structures. Out 178 of the 33,000 birds killed annually, 26,600 are killed in California alone due to the sheer number 179 of turbines and certain outdated turbine designs that are in place (Erickson et al. 2001). Outside 180 of California, approximately 1.83 birds are killed per turbine per year (corrected for searcher 181 efficiency and carcass loss to scavenging) (Erickson et al. 2001). As the number and height of 182 wind turbines increase across the U.S., there may be a corresponding increase in the number of 183 annual bird mortality figures (Mabey and Paul 2007). 184
185 Direct impacts to birds themselves include injuries or fatalities from collisions during flight with 186 wind turbine rotor blades, monopoles, power lines, guy wires, and other related structures (Kunz 187 et al. 2007a, Winegrad 2004). Most species of birds are at risk of collisions, although studies 188 have shown that specific groups of birds in particular habitats, under certain weather conditions, 189

5
or in large densities are more at risk than others, including raptors, migrating birds, wading birds, 190 and waterfowl (Becker et al. 1999, Erickson et al. 2001, Rugge et al. 2003, Kingsley and 191 Whittam 2007, Kuvlesky et al. 2007). 192
193 The design, placement, and layout of wind turbines can determine the vulnerability of birds to 194 collisions, especially where species are more likely to collide with structures due to relative 195 abundance, behavior, topography, and linkage with specific habitats (Erickson et al. 2002, 196 Hoover and Morrison 2005, Kuvlesky et al. 2007, Rugge et al. 2003). For example, additional 197 impacts to raptors are created when turbines are sited on steep slopes and hillsides, in canyons 198 and draws, on ridge crests and peaks within canyons, and when rock piles that attract prey 199 species are located near turbines (Hoover and Morrison 2005, Kingsley and Whittam 2003, 200 Smallwood and Thelander 2004). Grassland birds that engage in aerial displays during 201 courtship, such as the long-billed curlew, upland sandpiper, vesper sparrow, horned lark, 202 chestnut-collared longspur, and McCown’s longspur, have a greater risk of colliding with rotor 203 blades that occur within a male’s territory (Ehrlich et al. 1988, IDNR 2007, Fellows and Jones 204 2009). 205 206 Based on relative abundance, passerines comprise the majority of fatalities from wind turbines 207 with newer designs (taller towers with larger rotor blades and slower rotor speeds), with the peak 208 of fatalities occurring during migration (Erickson 2004). Migrants that funnel through a 209 concentrated migration corridor or along landforms such as ridges, steep slopes, and valleys are 210 more at risk of collisions if turbines also occur in these areas (Kingsley and Whittam 2003, 211 IDNR 2007). Most night migrants fly between 300-2,000 feet (91-610 m), so the risk of 212 collision is expected to increase as tower height and rotor diameter increase and tip speed 213 decreases (Kerlinger 2004, Smallwood and Thelander 2004, Morrison 2006). Collision mortality 214 estimates vary from site to site throughout the U.S. and are presently not thought to have a 215 impact on populations of passerines (Erickson et al. 2002); however, bird collision fatalities from 216 wind projects constructed in bird migration routes and corridors remain a justifiable concern 217 (Erickson et al. 2005). Collision mortality of raptors, however, may impact populations due to 218 the longer life span and lower reproductive potential of raptors compared to passerines 219 (Kuvlesky et al. 2007). The most common fatalities of raptors at the Altamont Pass Wind 220 Resource Area in California include the red-tailed hawk, burrowing owl, American kestrel, and 221 golden eagle (Orloff and Flannery 1992, Thelander and Rugge 2000, Smallwood et al. 2007). 222 The relative abundance of these species being struck by wind turbines was disproportionate to 223 their frequency of fatality. Some species are apparently more susceptible than others to the risks 224 posed by wind turbines (Thelander and Rugge 2000). 225
226 Direct impacts due to habitat loss, modification, and fragmentation from land use changes 227 associated with wind development may render sites unsuitable for birds and may have the 228 greatest adverse impacts to bird communities (Kuvlesky et al. 2007). Long-term impacts are 229 caused by the cumulative footprint of the turbine towers, roads, power lines, and supporting 230 infrastructure that removes or alters habitat, which displaces birds from preferred habitat, shifts 231 birds to less desirable habitat, and causes birds to avoid impacted areas (Rugge et al. 2003, 232 Smallwood and Thelander 2004, Strickland 2004). 233
234

6
Grassland songbirds are very sensitive to disturbance and fragmentation of grassland habitat and 235 vertical structures within grassland habitat, particularly area-sensitive species such as the 236 grasshopper sparrow, dickcissel, and bobolink that require large expanses of intact habitat 237 (Leddy et al. 1999, Nicholoff 2003, IDNR 2007, ). Studies have shown that habitat use by 238 grassland passerines and prairie grouse was lower in study plots containing wind turbines than in 239 study plots without turbines (Leddy et al. 1999, Johnson et al. 2000), with the actual distance 240 depending on the species, and likely ranging from <330 feet (<100 m) to 2 miles (3 km) 241 (Strickland 2004). In other studies, differences in breeding density for grassland species in 242 relation to proximity to wind turbines varied by species, with some species appearing to be more 243 sensitive to the turbines than others (O’Connell and Piorkowski 2006). 244
245 Research conducted in sagebrush-steppe habitat with dirt roads and a low volume of traffic 246 showed that density of sagebrush obligate birds was reduced by 39-60% within a 328-foot (100 247 m) buffer around roads (Ingelfinger and Anderson 2004). This study raises concern about the 248 impacts of roads created during industrial developments and the possibility that the presence of 249 obligate species and area-sensitive species may decline if the habitat they require is removed or 250 compromised. Roads are a direct cause of habitat loss and fragmentation, thereby reducing both 251 habitat quantity and quality. An increase in roads will also increase bird-vehicle collisions and 252 reduce native plant biodiversity by facilitating the introduction and spread of invasive plants and 253 noxious weeds (Erickson et al. 2005, Kuvlesky et al. 2007). 254
255 Indirect impacts occur when habitat and landscape alterations disrupt foraging behavior, 256 activities associated with breeding, and migration patterns (Kunz et al. 2007a). Studies have 257 reported displacement effects that range from approximately 250-2,600 feet (75-800 m) away 258 from wind turbines (Leddy et al. 1999, Strickland 2004). Large wind projects may also create a 259 barrier along migration paths or between foraging and roosting areas, causing a behavioral shift 260 in birds, avoidance of habitats associated with and adjacent to wind projects, and an increase in 261 the amount of energy expended during movements (Winegrad 2004, Drewitt and Langston 262 2006). Birds may avoid habitat at and surrounding wind projects due to the presence of 263 continuous motion and constant noise. Although not well studied, reports suggest that changes 264 in wildlife behavior and habitat use may occur in response to shadow flicker, which is caused by 265 sunlight passing through the rotating blades of wind turbines (IDNR 2007). Passerines that 266 occur in open habitats may be most affected, as the rapidly moving shadow may resemble the 267 flight of an aerial predator, causing both behavioral changes and an increased stress level (IDNR 268 2007). 269
270 Excessive or continuous noise can interfere with the vocal communication of birds, particularly 271 during the breeding season (March through July for most raptors and April through July for most 272 passerines). It is important to note that not all turbines are in operation 24 hours a day. 273 Therefore, for the purpose of this document, “continuous noise” is noise that occurs while these 274 facilities are in operation or while any residual noise is occurring (e.g. power lines). In addition, 275 for the purpose of this document, “excessive noise” is noise that is detected by the listener above 276 ambient noise levels (Rogers et al. 2006). Birds that rely on vocal cues to attract and retain 277 mates and defend territories can be particularly sensitive to noise. Continuous noise produced by 278 turbine engines and rotor blades and noises associated with substations, power lines, and routine 279 maintenance (e.g. vehicular traffic, motorized equipment) may adversely affect territory 280
7
selection and defense, foraging and fledging success, song learning, and dispersal (Nicholoff 281 2003). Excessive noise can also produce stress in individual birds, resulting in avoidance of 282 impacted areas and lower population densities within impacted areas. The effects of continuous 283 noise on bird communities are greatest where noise levels exceed 50 dBA; however, even 284 moderate noise levels of 40 to 50 dBA may negatively impact bird communities (Nicholoff 285 2003). 286
287 Both direct and indirect impacts from wind development can contribute to increased mortality of 288 birds; changes in food availability; nesting, roosting, and staging site availability; and an 289 increased risk of predation (NRC 2007). These impacts can also result in a reduction in nesting 290 density in a developed site, behavioral changes such as avoidance or abandonment of preferred 291 habitat, and occupancy of marginal habitat. Ultimately, facility size and design and the areas in 292 which turbines and other infrastructure are located will dictate the degree of impact that wind 293 projects have on birds. 294 295 GREATER SAGE-GROUSE AND SHARP-TAILED GROUSE 296 297 In Wyoming, some of the most economically attractive wind development sites are often within 298 native shrub or grassland ecosystems inhabited by greater sage-grouse (Centrocercus 299 urophasianus), plains sharp-tailed grouse (Tympanuchus phasianellus jamesi) or Columbian 300 sharp-tailed grouse (T.p. columbianus). Wind development alters site characteristics through 301 placement of tall structures (towers and power lines) and road networks (Braun 2006 and others). 302 Prairie grouse did not evolve with these types of features in their environment. Older turbine 303 designs produced noise levels well above the threshold of 49 dBA known to impact breeding 304 birds (Ingelfinger 2001, Nicholoff 2003). For example, overall noise levels measured during a 305 moderate wind day at the Altamont Pass Wind Energy Project were about 70 dBA (Dooling 306 2002). New turbine designs produce less noise. Turbines also produce motion and project 307 moving shadows onto the ground. These types of habitat alterations may cause impacts to prairie 308 grouse and a variety of other wildlife adapted to treeless environments. Sage-grouse were 309 determined to be “warranted but precluded” for listing under the federal Endangered Species 310 Act by the USFWS (March 2010) and Columbian sharp-tailed grouse have been petitioned for 311 listing twice. 312 313 Several planning documents and environmental analyses have noted that peer-reviewed studies 314 specific to prairie grouse are lacking and additional research is needed to determine if anticipated 315 impacts are occurring and to what degree (USFWS 2003, Manville 2004, Governor’s Sage-316 Grouse Conservation Team 2004, Sharp 2005, Strickland 2005, Stiver et al 2006:5-1, Southwest 317 Wyoming Sage-grouse Working Group 2007:38, Bates Hole/Shirley Basin Sage-grouse Working 318 Group 2007:74). Mabey and Paul (2007) observed, “The most common studies about the impact 319 of wind facilities on birds in grassland and shrub-steppe habitats document mortality at specific 320 facilities. This is not unexpected; most studies are commissioned by wind energy companies to 321 determine potential and actual mortality to satisfy regulatory concerns. Thus far, regulators seem 322 to be concerned primarily, if not exclusively, with mortality. A much smaller set of studies 323 document behavioral responses (e.g., changes in flight behavior) or effects on breeding bird 324 density or distribution.” Strickland (2004:34) stated, “Indirect loss of habitat may occur from 325 birds’ behavioral responses to development, such as avoiding wind plant facilities and areas 326

8
surrounding them. Long-term habitat impacts result from the construction of relatively 327 permanent structures that remove habitat for the life of a project and from birds avoiding habitat 328 disturbed by a wind farm and not habituating (i.e., becoming accustomed) to wind farm 329 features.” Strickland (2005) recommended a Before-After Control-Impact (BACI) sampling 330 design to evaluate non-fatality impacts when it is possible to collect pre-construction data. 331 332 Although wildlife resource agencies have identified a critical need to conduct studies 333 documenting avoidance effects and changes in population demographics associated with wind 334 development, such studies have not been widely done. This is particularly problematic for sage-335 grouse, which are highly sensitive to disturbances and habitat modifications. 336 337 Due to the lack of specific wind related research, studies of other developments involving similar 338 infrastructure components and disturbances provide some insight into the impacts of wind 339 development on prairie grouse (Manville 2004, Strickland 2004, Sharp 2005). For example, 340 studies examining the impacts of roads, power lines, communication towers, and noise in natural 341 gas fields are relevant in ascertaining how native prairie grouse are likely to respond to wind 342 development. Movement and noise associated with turbines and road traffic, in particular, are 343 expected to cause some level of avoidance based on similar avoidance effects observed at large-344 scale natural gas development (see Lyon 2000; Lyon and Anderson 2003). But specific research 345 is needed to identify these effects. 346 347 Anticipated impacts of wind development specifically include: collisions with turbine blades, 348 fences, guy wires, power lines, and vehicles; behavioral avoidance and habitat fragmentation; 349 auditory and visual disturbance; increased predator access; poaching; spread of invasive weeds; 350 and increased fire frequency (Leddy et al. 1999, USFWS 2003, Connelly et al. 2004, Manville 351 2004, Sharp 2005, Schroeder et al. 2006). Impacts from power lines include: behavioral 352 avoidance, habitat fragmentation, collisions, and increased predator access (Aldridge 1998, 353 Braun 1998, Connelly et al. 2000, Boisvert 2002, Braun et al. 2002, Hagen 2003, Wolfe et al. 354 2003a, 2003b, Pitman 2003, Connelly et al. 2004, Hagen et al. 2004, Patten et al. 2005 and 355 Hoffman and Thomas 2007). Lacking specific research, it is prudent to expect that industrial-356 scale wind development will have impacts on both sage-grouse and sharp-tailed grouse primarily 357 due to habitat alterations and behavioral avoidance. However, direct mortalities from collisions 358 are not expected to be a problem if turbines are sited outside major movement corridors. 359 360 Collisions between fowl-like birds and turbines are less common than collisions involving other 361 species, especially passerines and bats. Summarizing the results of 5 studies in the U.S. outside 362 California, Erickson et al. (2001:37) reported 4.0% of birds killed in collisions with wind 363 turbines were fowl-like species. Three of the studies reported no mortality of fowl-like species, 364 one reported 5.5% of the birds killed were fowl-like species and an Oregon facility reported 25% 365 of the birds killed were fowl-like species. Strickland (2008) found that, relative to their 366 abundance, game birds comprised 11% of the fatalities analyzed nationwide. Braun (cited in 367 Manville 2004) believed sage-grouse could avoid collisions with turbines due the large size and 368 visibility of these structures. Most prairie grouse typically fly below the sweep of turbine blades. 369 However, WGFD biologists have observed sage-grouse flying at fairly high elevations above 370 ground when moving long distances. The potential for grouse to collide with turbine blades 371 should not be discounted if turbine strings and power lines are located within migratory 372

9
pathways between habitats used on a daily or seasonal basis. In addition, collisions with barbed 373 wire fences are fairly common and potential for collisions with guy wires and power lines is 374 recognized by several authors (Connelly and Braun 1997, Becker et al. 1999, Schroeder et al. 375 1999, Connelly et al. 2004, Manville 2004, Connelly 2005, Braun 2006, Stemler 2007). 376 377 Several studies have also documented a “shadow flicker” effect resulting from the projection of 378 moving turbine shadows onto the ground, roads, or buildings (Nielsen 2003, DWEA 2003, 379 Hotker et al. 2006:24, National Research Council 2007, Hewson 2008). There is speculation that 380 this “flicker” effect may resemble avian predators and disturb grouse and other small prey 381 species that are sensitive to avian predation from overhead. Specific research examining this 382 issue is needed. 383 384 Impacts to sage-grouse and sharp-tailed grouse from wind development have not been 385 specifically studied, but information from other energy studies lend some insight. For prairie 386 grouse, there is a considerable body of literature describing impacts of roads, power lines, and 387 natural gas wells. Roads with light traffic (1-12 vehicles/day) were correlated with less 388 successful nesting by sage-grouse hens (Lyon 2000). Light traffic near leks may also reduce 389 nest-initiation rates and increase distances hens move from leks during nest-site selection (Lyon 390 and Anderson 2003). In addition, Braun (1998) determined habitat use by sage-grouse was 391 impacted by power lines up to a distance of at least 600 m. Other studies have indicated little or 392 no impact from power lines. In Montana habitat selection was modeled for three sage-grouse 393 populations in Beaverhead County based on a radio telemetry study involving 45 male sage-394 grouse during the summers of 2001 to 2005. One of the parameters used in the model was 395 distance to the nearest power line. However, the distance to power line variable was not found to 396 be associated with sage-grouse habitat selection, suggesting that presence of transmission lines 397 did not affect habitat selection by the male sage-grouse monitored during this study (Wisinski 398 2007). 399 400 Recent studies have determined that sage-grouse leks are impacted by nominal levels of natural 401 gas development equating to 1 well pad/mi2 within 2 miles, and are highly impacted when 402 development exceeds 2-3 well pads/mi2 (Naugle et al. 2006, Walker et al. 2007, Doherty 2008, 403 Walker 2008, Doherty et al. 2008, Naugle et al. in press). Wind developments typically contain 404 much higher densities of tall structures that are associated with motion and shadow flicker. 405 406 Concerns exist that wind development will cause significant adverse impacts to sage-grouse and 407 sharp-tailed grouse if they are sited in habitats that are important to those species. After a wind 408 farm was build in alpine habitat, in Austria, five years of monitoring data on black grouse 409 (lyrurus tetrix) populations showed a decrease in their population (Zeiler, Hubert P, 410 Granschachner-Berger, Veronika. 2009). Naugle et al. (in press) has described the mechanism 411 of this impact: “Recent research shows that sage-grouse populations decline when cumulative 412 impacts of development negatively affect reproduction or survival (Aldridge and Boyce 2007), 413 when birds behaviorally avoid infrastructure in one or more seasons (Doherty el al. 2008), or 414 both (Lyon and Anderson 2003; Holloran 2005; Kaiser 2006). Behavioral avoidance of energy 415 development reduces the distribution of sage-grouse and may result in population declines if 416 density-dependence or habitat suitability lowers survival or reproduction in displaced birds 417 (Holloran and Anderson 2005; Aldridge and Boyce 2007). Adult female sage-grouse in Canada 418

10
led their young into the Manyberries Oil Field where succulent forbs were abundant, but despite 419 this attraction, the oil field was a population sink where risk of chick mortality increased 1.5 420 times for each additional well visible within 1 km of the brood (Aldridge and Boyce 2007). In 421 the Powder River Basin, sage-grouse were 1.3 times less likely to use otherwise suitable winter 422 habitats that have been developed for coal bed methane (12 wells/4 km²), and differences were 423 most pronounced in high quality winter habitat with abundant sagebrush cover (Doherty et al. 424 2008). However, current research (G. Johnson, Pers. comm.) has documented the current use of 425 sage grouse leks within one mile of an established wind project after 2 years of construction. 426 Continued long-term persistence of these leks still needs to be evaluated to account for lag 427 affects (Holloran 2005). 428 429 Plains sharp-tailed grouse may be somewhat more adaptable to changes in their environment 430 than are sage-grouse. Nebraska Game & Parks Commission staff has been monitoring greater 431 prairie chicken and sharp-tailed grouse leks near the Ainsworth Wind Energy Facility. All 13 432 leks have been active each of the three years since construction, and the number of birds on the 433 leks has remained stable. These leks are 0.3-1.59 miles from the nearest turbine (avg. = 0.66 434 miles) (Nebr. GPC, Pers. comm.). Baydack and Hein (1987) found that male sharp-tailed 435 grouse continued to display on leks when confronted with several types of experimental 436 disturbance treatments. However, female sharp-tailed grouse were not observed on any lek 437 during disturbance treatments. Sensitivity of females may limit reproductive success at lek sites 438 exposed to disturbance. Others have documented this disturbance mechanism among female 439 sage-grouse in an area of natural gas development (Lyon 2000, Lyon and Anderson 2003). In 440 addition, yearling male sage-grouse were recruited onto disturbed leks at a lower rate than on 441 undisturbed leks (Braun 1986; Kaiser 2006; Walker 2008), resulting in a time lag between the 442 onset of disturbance and the ability to detect an impact (Walker 2008). 443 444 Several researchers and managers have recommended set-back distances to protect leks and other 445 important habitats from disturbances caused by development. Set-back distances are intended to 446 buffer the disturbance reaching the lek and surrounding habitat in order to maintain effective 447 habitat conditions. The distances vary depending on whether the goal is to simply minimize 448 disturbance to the lek itself, or to also protect nesting and brood-rearing habitats that are 449 associated with the lek. These recommendations and research findings provide additional 450 insights regarding the distances at which wind development is expected to adversely affect 451 prairie grouse. 452 453 MIGRATORY WATERFOWL, WATERBIRDS, AND SHOREBIRDS 454 455 Wind developments may impact migratory game birds and waterbirds depending on site location 456 and species that are present. As with other bird species, three types of impacts are anticipated: 1) 457 direct mortality due to collisions with turbines, power lines, and meteorological towers; 2) 458 displacement of migratory birds from preferred feeding, resting, or nesting areas; and 3) 459 alteration of migratory pathways. 460 461 Waterfowl typically fly at heights and distances that put them at risk for collisions (Mabey and 462 Paul 2007). Erickson et al. (2001) reported 78% of the carcasses found in 31 studies of wind 463 projects were passerine species. However, wetland-associated species comprised the second 464

11
largest category of collision mortalities and included waterfowl (5.3%), waterbirds (3.3%), and 465 shorebirds (0.7%). Projects with sources of open water near turbines (e.g., San Gorgonio, 466 California, and Buffalo Ridge, Minnesota) have the highest documented waterfowl mortality, 467 with 10 to 20% of all fatalities consisting of waterfowl and shorebirds (BLM 2005:5-63). In 468 addition, collisions with power lines are an important source of mortality for several species of 469 waterbirds (Fiedler and Wissher 1980, Crivelli et al.1988, Morkill and Anderson 1991, Pacific 470 Flyway Study Committee 2002, Manville 2005, Rubolini et al. 2005). 471 472 Weather can increase the incidence of collisions with tall structures, in particular with regard to 473 nocturnal migrants (Mabey and Paul 2007:103). For example, most Trumpeter Swan (Cygnus 474 buccinator) collisions with power lines and fence wires occurred during winter fogs (Banko 475 1960). Presence of fog at wetlands with high waterfowl densities contributes to waterfowl 476 mortality associated with power lines (Andersen-Harild and Block 1972). The same concern 477 would likely apply to wind turbines if they are sited near wetlands. 478 479 The potential for avian collisions was a major issue prior to construction of the Forward Energy 480 Wind Project near the Horicon National Wildlife Refuge in Wisconsin (USFWS 2004). 481 Ultimately, the project sponsor was required to set all wind turbines back at least 2 miles from 482 the refuge property boundary (Public Service Commission of Wisconsin 2005:19). 483 484 Displacement of waterfowl from wind development has been investigated in coastal regions of 485 Europe where this is considered to have a greater impact on birds than collision mortality 486 (Strickland 2004). Studies suggest most displacement involves migrating, resting and foraging 487 birds. Displacement distances range from 75 to 800 m away from turbines (Strickland 2004). 488 Sea ducks including long-tailed duck (Clangula hyemalis), common eider (Somateria 489 mollissima), and common scoter (Clangula hyemalis) are particularly vulnerable to turbine 490 impacts (Gill et al. 1996; Langston and Pullan 2003; Garthe and Hüppop 2004; Stewart et al. 491 2007:6). Krijgsveld (2007) also reported pochards (Aythya ferina), mergansers (mergus spp.) 492 and goldeneyes (Bucephala clangula) were disturbed by an operating wind project in the 493 Netherlands, although several other species did not appear to be affected. 494 495 Waterbirds and waterfowl may avoid feeding in areas near wind turbines (IDNR 2007, Kingsley 496 and Whittam 2003); however, in areas near wetlands or other areas of waterfowl concentration, 497 these birds are at more risk of collision when entering and departing the area (IDNR 2007). 498 Although shorebirds have a lower risk of collisions with turbines due to the height at which they 499 migrate, wind turbines located near shorebird feeding and staging area can be detrimental during 500 takeoff and landing, particularly if birds are disturbed and forced to flee (Kingsley and Whittam 501 2003). Turbine design, including height, blade length, rotor tip speed, blade appearance to birds, 502 and the presence and type of lighting, also plays a role in collision risk (Kuvlesky et al. 2007). 503 504 In addition to displacement, wind turbines can have a barrier effect, causing waterfowl, wading 505 birds, and shorebirds to alter migration paths considerable distances (Noer et al. 2000, Percival 506 2001, Bruns et al. 2002, Christensen et al. 2002, Langstron and Pullan 2002). Krijgsveld (2007) 507 made the following observation in the Netherlands: “Water birds were found to avoid the wind 508 energy development on a large scale when the turbines were moving. During turbine operation, 509 the number of flight movements outside the wind farm was much greater (85% during the day, 510

12
75% during the night) than flights through the wind farm. Waterbirds made long deflective 511 flights to avoid the wind farm when the turbines were moving … When turbines were not 512 moving, birds cut through the wind farm.” 513 514 Although these studies were done predominantly within coastal regions, it is reasonable to 515 anticipate similar effects on waterfowl and other wetland-associated species if turbines are sited 516 within or near freshwater marshes, streams, and lakes. 517 518 BIG GAME 519 520 The effects of wind energy development on large ungulates are largely unknown. There has 521 been little research completed on the subject to date, although ongoing monitoring and research 522 in Wyoming is expected to begin to provide information within the next few years. 523 524 Direct ungulate habitat loss from wind energy development surface disturbance may be relatively 525 small as turbines and roads typically constitute only a small percentage of the development area. 526 However, indirect habitat impacts, those affecting use of undisturbed and adjacent portions of the 527 project area by ungulates may be much larger. For instance, habitat security, an important factor 528 in determining use of habitats by many big game species, may be compromised. 529 530 Estimates from the Foote Creek Rim Project in Wyoming suggest that long-term surface 531 disturbance was 0.7-1.0 acres per turbine, or 0.4-0.7 acres per MW (Strickland 2004). Although 532 actual disturbance associated with wind turbines and their associated roads and other 533 infrastructure is relatively small, indirect impacts may affect much larger areas. Consequently, 534 the potential exists to displace big game species from important seasonal habitats particularly 535 crucial winter ranges. In addition, if displacement does occur additional impacts could include a 536 loss of connectivity between necessary seasonal habitats including migration routes, parturition 537 areas and important summer ranges all of which provide essential habitat components to 538 maintain big game populations across Wyoming. The lack of connectivity may fragment 539 habitats, resulting in a decrease in the quality and attractiveness of remaining patches of habitat 540 in areas adjacent to infrastructure (Berger et al. 2006). 541
542 Wyoming is home to the largest number of pronghorn antelope in the U.S. (and the world as they 543 are a distinct North American species). Current estimates are at 526,000 (WGFD 2009 Annual 544 Report). Pronghorn primarily inhabit open landscapes comprised of sagebrush steppe or 545 grassland habitat types. These areas often coincide with economically attractive wind. Mule 546 deer also use these landscapes for year round habitat or as seasonal winter ranges. Potential 547 impacts to pronghorn and mule deer include direct and indirect habitat loss, displacement, and 548 cumulative impacts associated with other nearby energy development. 549
550 Pronghorn and mule deer have been observed to maintain populations in developed areas such as 551 surface coal mines (Segerstrom 1982, Medcraft and Clark 1986, Gamo and Anderson 2002). 552 Others (Sawyer et al. 2006) have found mule deer remain, but at reduced populations, in 553 response to natural gas development. Sawyer et al. (2006) and Berger et al. (2006) found that 554 mule deer and pronghorn exhibited avoidance behavior of gas development areas or selected 555 habitats away from development. Wind projects also have road networks, other infrastructure 556
13
and human activity; however, the impact may be different as wind projects generally require 557 fewer roads, less operational traffic, and different types (and sizes) of permanent structures. 558 559 It is difficult to predict the impact of wind development in Wyoming to big game species. There 560 is a need for research, as has occurred with oil and gas development, to identify and assess the 561 impacts of wind development and determine appropriate mitigation for these species. 562
563 To date there has been one single study performed on the direct effect of wind development on 564 elk (Walter et. al. 2006). This study found that elk were displaced from wind development 565 activities during construction but after construction was completed less displacement was noted. 566 However, caution is warranted in applying the results of this study to large free-roaming elk 567 herds found in Wyoming as Walter’s study was performed on a non-migratory herd of elk in 568 southwestern Oklahoma. This herd was adjacent to a very large high-fenced wildlife refuge. 569 The fence limited their movement to those habitats behind the fence, which were away from the 570 wind development activities. This herd also inhabited an area of many small tract-private 571 agricultural lands that are intersected by road systems and residential developments. These elk 572 were likely more habituated to human presence than Wyoming elk would be and likely do not 573 accurately represent the majority of Wyoming’s elk herds. 574
575 In other published literature (Perry and Overly 1977, Rost and Bailey 1979, Lyon 1983) elk have 576 been demonstrated to be highly sensitive to disturbance from vehicle traffic and will actively 577 avoid roads. Many of these studies evaluated elk response to logging or other forest use 578 activities. The network of roads that is constructed for wind projects in elk habitat could 579 displace elk depending upon the amount of human activity. Increased human activity, often 580 associated with roads, can displace elk, resulting in increased movements and associated 581 energetic costs (Rumble et al. 2006). 582
583 Another big game species potentially affected by wind development in Wyoming is bighorn 584 sheep. Some lands near bighorn sheep populations have been leased for wind development in 585 the Laramie Range. Bighorns often inhabit relatively treeless ridges or mountainsides 586 (Gionfriddo and Krausman 1986). During winter bighorns can be found on windswept ridges 587 foraging in areas with less snow (Tilton and Willard 1982). As with elk, bighorns are sensitive 588 to human activity and have more strict requirements in habitat needs (Smith et al. 1991). There 589 is currently a lack of information specific to the potential effects of wind development on 590 bighorn sheep but it is WGFD’s experience that they are one of the more disturbance-sensitive 591 big game species. 592 593 SMALL MAMMALS 594 595 Impacts to small mammals from wind development are largely unknown and will likely vary 596 depending on site location and species present. Several types of impacts could potentially occur, 597 however others not yet identified are also possible: 1) mortality due to ground-disturbing 598 activities; 2) displacement of small mammals from preferred feeding areas; 3) disturbance due to 599 “shadow flicker”; 4) disturbance due to noise; 5) loss of burrows and escape cover; and 6) injury 600 and mortality due to vehicle collisions. 601
602

14
Information describing impacts of wind development to small mammals is lacking. Both 603 individuals and populations could be impacted both positively and negatively. Except in the case 604 of rare species (such as the Wyoming pocket gopher, Preble’s meadow jumping mouse, etc.), 605 impacts to small mammals are often perceived as minimal and of lower priority when compared 606 to other more conspicuous species, such as avian or volant mammals. Although small mammals 607 are unlikely to collide with turbines, they are vulnerable to surface disturbing activities and 608 colliding with vehicles. The construction of turbines and associated infrastructure is likely to 609 have localized impacts on populations and individuals and the impacts will vary depending on 610 the species life history (e.g., semi-fossorial, body size, diet, etc), abundance, and habitat 611 requirements. Additional data is needed. 612 613 AMPHIBIANS AND REPTILES 614
615 In general, information regarding the affects of wind energy development on Wyoming’s 616 herpetofauna is lacking. It has been shown that reptile and amphibian species are affected by 617 energy development differently based upon unique characteristics of its life history (Hampton et 618 al. 2010, Smolensky 2008). However, there is no clear trend on generalized impacts. Permanent 619 bodies of water, wetlands, ephemeral pools, and playas are of particular concern because 620 amphibians are highly dependent on water to complete their lifecycle (aquatic tadpole or larval 621 phase). Any natural or human-caused loss of water on the landscape during the larval period 622 could negatively affect amphibian populations. This effect could be exacerbated with successive 623 years of water loss. While we understand that wind turbines would not typically be constructed 624 in areas important to amphibian life cycles, we remain concerned that without adequate pre-625 construction surveys, roads, buried power lines and other ancillary facilities could be constructed 626 in habitats important to amphibians and that localized, long-term population impacts may occur. 627 We are also concerned that off-site transport of sediment from construction sites may adversely 628 affect the quality of habitats important to amphibians. 629 630 Amphibian road mortality may increase during specific times of year based upon species-specific 631 breeding chronology. Spring breeding migrations and summer post-metamorphic emergence, 632 result in amphibian congregations which could result in locally significant mortality events if 633 these congregations were located on or near roads or other ground-disturbing activities. It is 634 particularly important that data be collected for amphibians and habitats, particularly for those 635 species which are considered Species of Greatest Conservation Need (SGCN) in the State 636 Wildlife Action Plan, to ensure that impacts are minimized. 637 638 As with amphibians, specific information regarding the effects of wind energy development on 639 reptiles is also lacking. While development could increase basking opportunities for many 640 reptiles, adverse effects could occur to daily routines from human presence, surface disturbance, 641 traffic, and noise. Many reptile species are dependent on rocky outcroppings or accessible 642 geologic features for hibernation, and thus, it is suggested that these features be avoided to 643 ensure the integrity of hibernacula (overwintering areas or dens). 644
645

15
MANAGEMENT CONCERNS 646 647 In addition to concerns about wind development on the impacts of wildlife and habitat are issues 648 associated with the management of game species within development areas. Population 649 management requires the use of hunting as a tool for managing species at population levels 650 acceptable for sportsmen and sportswomen as well as trying to meet the needs of private 651 landowners whose lands contribute to available habitat for wildlife. Development of wind 652 energy on public land creates potential access, and public use concerns while development on 653 private land has the potential for restricting public access open in the past, particularly for 654 hunting. Maintaining hunter access to formerly available lands that are developed for wind 655 energy is vital to enable WGFD to successfully manage game populations and the habitats upon 656 which they depend, to maintain the quality of the hunting experience in Wyoming, and to reduce 657 subsequent overcrowding of remaining public areas used by hunters. 658 659 Access to public land in Wyoming will not immediately be affected by the development of wind. 660 To close access to public land Federal land management agencies would be required to institute 661 an official closure, which would consist of issuing a public notice with a comment period. This 662 includes access for hunting. However, access on private land would be dependent upon the lease 663 agreement between the wind developer and the private landowner. The WGFD recognizes the 664 rights of private landowners and will respect the decisions they make regarding access to their 665 lands. However, no-hunting stipulations due to the presence of wind development on lands 666 whose owners typically provided access, would severely impact the ability of WGFD to control 667 wildlife populations. In addition, WGFD is committed to working with private landowners, wind 668 developers, local law enforcement and land management agencies to help minimize and report 669 damage to wind turbines or meteorlogical towers caused by vandals with firearms. 670 671
AQUATIC CONCERNS 672 673
A common assumption is that aquatic wildlife impacts are unlikely to be associated with wind 674 projects. In many cases, that assumption would be correct. For example, wind turbines are often 675 placed on the highest possible topographic features in a project area to access stronger and 676 steadier winds found at higher elevations. As a result, turbines are rarely located in low spots 677 where permanent or ephemeral riparian habitats usually occur. Furthermore, the aridity of 678 Wyoming’s climate, combined with the rarity of riparian habitats, creates a reduced potential for 679 impacts to aquatic habitats relative to other regions with more precipitation. 680
681 Currently, there is a relatively small body of research on the effects of wind development on 682 aquatic habitats. This can be partially explained by the relatively few potential wind/aquatic 683 conflicts that have been identified at wind projects in the past and the recent nature of wind 684 development proposals. However, there is much information on the impacts of roads and pads 685 and culverts, associated with various forms of development, on how water runs off the landscape 686 and how sediment is mobilized and delivered to watercourses. The combination of runoff 687 changes and sediment delivery changes, associated with any project, has the potential to modify 688 the aquatic habitat characteristics of stream channels. 689
690

16
Aquatic habitat changes may occur if roads and pads affect the infiltration rate of water, by 691 increasing the velocity and quantity of water running across the landscape, and potentially 692 increasing erosion and sediment deposition into nearby waterways. When erosion occurs, stream 693 channels respond to the increased sediment supply by adjusting their pattern (sinuosity) and 694 dimensions. These changes may result in decreased pool depths, decreased riffle area, less 695 diversity in channel substrate and increased lateral instability marked by eroding banks. These 696 changes along with direct effects from increased sediment loading can affect macro invertebrate 697 populations and diversity and decrease fish habitat. A common impact is a decrease in gravel 698 and cobble used by spawning fish. 699
700

17
LITERATURE CITED 701 702 Aldridge, C. L. 1998. Status of the sage-grouse (Centrocercus urophasianu urophasianus) in 703
Alberta. Alberta Environmental Protection, Wildlife Management Division, and Alberta 704 Conservation Association, Wildlife Status Report No. 13, Edmonton. 23 pp. 705
706 Aldridge, C.L. and M.S. Boyce. 2007. Linking occurrence and fitness to persistence: habitat-707
based approach for endangered greater sage-grouse. Ecological Applications. 17(2):508–708 526. 709
710 Alerstam T, 1990. Bird migration. Cambridge: Cambridge University Press. 711 712 Alldredge, M. W., K. H. Pollock, and T. R. Simons. 2006. Estimating detection probabilities 713
from multiple-observer point counts. The Auk 123 (4):1172-1182. 714 715 Andersen-Harild, P. and D. Block. 1972. Birds killed by overhead wires in some localities in 716
Denmark. Dansk Ornithology Foren. Tidsskr. 67:15-23 (based on review of abstract; paper in 717 Danish). 718
719 APLIC [Avian Power Line Interaction Committee]. 1994. Mitigating bird collisions with power 720
lines: the state of the art in 1994, Edison Electric Institute, Washington D.C. 721 722 AAPPLLIICC [[AAvviiaann PPoowweerr LLiinnee IInntteerraaccttiioonn CCoommmmiitttteeee]]). 2006. Suggested Practices for Avian 723
Protection on Power Lines: The State of the Art in 2006. Edison Electric Institute, 724 Washington, D.C. 725
726 Arnett, E.B., W.K. Brown, W.P. Erickson, J.K. Fiedler, B.L. Hamilton, T.H. Henry, A. 727
Jain, G.D. Johnson, J. Kerns, R.R. Kolford, C.P. Nicholson, T.J. O’Connell, M.D. 728 Piorkowski, and R.D. Tankersley, Jr.. 2008. Patterns of fatality of bats at wind 729 energy facilities in North America. Journal of Wildlife Management 72:61-78. 730
731 Arnett, E.B., W.P. Erickson, J. Kerns, and J. Horn. 2005. Relationships between bats and wind 732
turbines in Pennsylvania and West Virginia: an assessment of fatality search protocols, 733 patterns of fatality, and behavioral interactions with wind turbines. Final Report. Prepared 734 for the Bats and Wind Energy Cooperative, by Bat Conservation International, Austin, TX. 735 June 2005 [online]. Available: http://www.batcon.org/wind/BWEC2004finalreport.pdf. 736
737 Arnett, E.B. 2006. A preliminary evaluation on the use of dogs to recover bat fatalities at wind 738
energy facilities. Wildlife Society Bulletin 34:1440-1445. 739 740 Arnett, E.B., M. Schirmacher, M. Huso and J.P. Hays. 2009. Effectiveness of Changing Wind 741
Turbine Cut-in Speed to reduce bat fatalities at wind facilities. An annual report submitted to 742 the Bats and Wind Energy Cooperative. Bat Conservation International. Austin, TX. 743
744 Arnett, E.B., W.P. Erickson, J. Kerns, and J. Horn. 2005. Relationships between bats and wind 745
turbines in Pennsylvania and West Virginia: an assessment of fatality search protocols, 746

18
patterns of fatality, and behavioral interactions with wind turbines. Final Report. Prepared 747 for the Bats and Wind Energy Cooperative, by Bat Conservation International, Austin, TX. 748 June 2005 [online]. Available: http://www.batcon.org/wind/BWEC2004finalreport.pdf. 749 750
Arnett, E.B., W.K. Brown, W.P. Erickson, J.K. Fiedler, B.L. Hamilton, T.H. Henry, A. 751 Jain, G.D. Johnson, J. Kerns, R.R. Kolford, C.P. Nicholson, T.J. O’Connell, M.D. 752 Piorkowski, and R.D. Tankersley, Jr.. 2008. Patterns of fatality of bats at wind 753 energy facilities in North America. Journal of Wildlife Management 72:61-78. 754
755 Baerwald, E.F., G.H. D’Amours, B.J. Klug, and R.M.R. Barclay. 2008. Barotrauma is a 756
significant cause of bat fatalities at wind turbines. Current Biology 18:695-696. 757 758 Baerwald, E.F., J. Edworthy, M. Holder and R.M.Barclay. 2009. A Large-Scale Mitigation 759
Experiment to Reduce Bat Fatalities at Wind Energy Facilities. Journal of Wildlife 760 Management 73(7): 1077-1081. 761
762 Banko, W. E. 1960. The trumpeter swan: its history, habits, and population in the United States. 763
U.S. Fish and Wildlife Service, Washington, D.C., USA. 764 765 Bates Hole/Shirley Basin Sage-grouse Working Group. 2007. Bates Hole/Shirley Basin Sage-766
grouse Conservation Plan. 99pp. 767 768 Baxter G. T. and M. D. Stone. 1985. Amphibians and Reptiles of Wyoming. Wyoming Game 769
and Fish Department, Cheyenne WY. 2nd Edition. Pp: 1-137. 770 771
Baydock, R.K., and D.A. Hein. 1987. Tolerance of sharp-tailed grouse to lek disturbance. 772 Wildl. Soc. Bull. 15:545-539. 773
774 Becker, P.S., W.P. Erickson, G.D. Johnson, K. Kronner, M.D. Strickland, and S. Orloff. 1999. 775
Baseline Avian Use and Behavior at the CARES Wind Plant Site, Klickitat County, 776 Washington, Final Report NREL/SR-500-26902. National Renewable Energy laboratory, 777 Golden, CO. 778
779 Berger, J., K. M. Berger, and J. Beckman. 2006. Wildlife and energy development: Pronghorn 780
of the Upper Green River Basin – Year 2 Summary. Wildlife Conservation Society, Bronx, 781 New York. 782
783 BLM (United States Bureau of Land Management). 2005. Final Programmatic Environmental 784
Impact Statement on Wind Energy Development on BLM-Administered Lands in the 785 Western United States. U.S. Dept. of Interior, Bureau of Land Management. Washington 786 D.C. 787
788 Boisvert, J.H. 2002. Ecology of Columbian sharp-tailed grouse associated with Conservation 789
Reserve Program and reclaimed surface mine lands in northwestern Colorado. Thesis. 790 University of Idaho, Moscow, ID. 791
792

19
Braun, C. E. 1986. Changes in sage-grouse lek counts with advent of surface coal mining. 793 Proceedings: Issues and Technology in the Management of Impacted Western Wildlife, 794 Thorne Ecological Institute 2:227-231. 795
796 Braun, C.E. 1998. Sage-grouse declines in western North America: What are the problems? 797
Proceedings of the Western Association of State Fish and Wildlife Agencies. 78:139-156. 798 799 Braun, C.E. 2006. A Blueprint for Sage-grouse Conservation and Recovery. Grouse, Inc. 800
Tucson, AZ. 42pp. 801 802 Braun, C.E., O.O. Oedekoven, and C.L. Aldridge. 2002. Oil and gas development in Western 803
North America: effects of sagebrush steppe avifauna with particular emphasis on sage-804 grouse. Transactions 67th North American Wildlife and Natural Resources Conf.:337-349. 805
806 Bruns, E., A. Andersson, and S-E. Thor. 2002. Environmental issues of offshore wind farms. 807
Summary of IEA R&D Wind, Topical Expert Meeting No. 40. September 2002, Husum, 808 Germany. 6 pp. 809
810 Buckland, S. T., R. E. Russell, B. G. Dickson, V. A. Saab, D. G. Gorman, and W. M. Block. 811
2009. Analyzing designed experiments in distance sampling. Journal of Agricultural, 812 Biological and Environmental Statistics 14:432-442. 813
814 Christensen, T.K., I. Clausager, and I.K. Petersen. 2002. Status report of seabird surveys at 815
Horns Rev, 2000-2001. National Environmental Research Institute, Ministry of Environment 816 and Energy, Dept. Coastal Zone Ecology, Denmark. 22 pp. 817
818 Collins, J. and G. Jones. 2009. Differences in bat activity in relation to bat detector height: 819
implications for bat surveys at proposed wind farms. Acta Chiropterologica 11:343:350. 820 821 Connelly, J.W. 2005. Prairie Grouse and Elevated Structures: An Environmental Planning 822
Challenge. Pages 41-43 in S.S. Schwartz (ed). Onshore Wildlife Interactions with Wind 823 Developments: Research Meeting V – Proceedings. Landsdowne, VA. 824
825 Connelly, J,W, and C.E. Braun. 1997. Long-term changes in sage grouse Centrocercus 826
urophasianus populations in western North America. Wildlife Biology 3(3/4):229–234. 827 828 Connelly, J.W., M.A. Schroeder, A.R. Sands, and C.E. Braun. 2000. Guidelines to manage sage-829
grouse populations and their habitats. Wildlife Society Bulletin 28(4):967-985. 830 831 Connelly, J.W., S.T. Knick, M.A. Schroeder, and S.J. Stiver. 2004. Conservation assessment of 832
greater sage-grouse and sagebrush habitats. Western Association of Fish and Wildlife Agencies. 833 Cheyenne, WY. 610 pp. 834
835 Crivelli, J., H. Jerrentrup, and T. Mitchev. 1988. Electric power lines: a cause of mortality in 836
Pelecanusc rispus Bruch, a world endangered bird species. Col. Waterbirds 11:301-305. 837 838

20
Cryan, P. M., and A.C. Brown. 2007. Migration of bats past a remote island offers clues 839 toward the problem of bat fatalities at wind turbines. Biological Conservation 139:1-840 11. 841
842 Cryan, P.M., and R.M.R. Barclay. 2009. Causes of bat fatalities at wind turbines: 843
Hypotheses and Prediscitons. Journal of Mammalogy 90:1330-1340. 844 845 DOI (Department of Interior). DRAFT. Wind Turbine Guideline Advisory Committee 846
Recommendations. 2010 ver. 6. 847 848 Doherty, K.E. 2008. Sage-grouse and energy development: integrating science with 849
conservation planning to reduce impacts. PhD Dissertation. University of Montana, 850 Missoula. 851
852 Doherty K.E., D.E. Naugle, B.L. Walker, and J.M. Graham. 2008. Greater sage-grouse winter 853
habitat selection and energy development. Journal of Wildlife Management 72(1):187–195. 854 855 Dooling, R. 2002. Avian Hearing and the Avoidance of Wind Turbines. NREL/TP-500-30844. 856
National Renewable Energy Laboratory, Golden, Colo. 857 858 Drewitt, A. L., and R. H. W. Langston. 2006. Assessing the impacts of wind farms on birds. 859
Ibis 148:29-42. 860 861 DWEA (Danish Wind Energy Association). 2003. Shadow Casting from Wind Turbines. Danish 862
Wind Energy Association, Copenhagen, Denmark [online]. 863 http://www.windpower.org/en/tour/env/shadow/index.htm 864
865 Ehrlich, P. R., D. S. Dobkin, and D. Wheye. 1988. The Birder’s Handbook: A Field Guide to 866
the Natural History of North American Birds. Simon and Schuster, Inc., New York, NY. 867 785pp. 868
869 Erickson, W., G. Johnson, M. Stickland, D. Young, Jr., K. Sernka, and R. Good. 2001. Avian 870
Collisions with Wind Turbines: A Summary of Existing Studies and Comparisons to Other 871 Sources of Avian Collision Mortality in the United States. Washington, DC: Resolve, Inc. 872 August 2001 [online]. 873 http://www.west-inc.com/reports/avian_collisions.pdf 874
875 Erickson, W., G. Johnson, D. Young, D. Strickland, R. Good, M. Bourassa, K. Bay, and K. 876
Sernka. 2002. Synthesis and Comparison of Baseline Avian and Bat Use, Raptor Nesting 877 and Mortality Information from Proposed and Existing Wind Developments. Prepared by 878 Western EcoSystems Technology, Inc., Cheyenne, WY, for Bonneville Power 879 Administration, Portland, OR. December 2002. 880
881 Erickson, W. 2004. Bird fatality and risk and new generation wind projects. Pages 29-33 in 882
Proceedings of the Wind Energy and Birds/Bats Workshop: Understanding and Resolving 883

21
Bird and Bat Impacts. Washington, D.C. May 18-19, 2004. Prepared by RESOLVE, Inc., 884 Washington, D.C., Susan Savitt Schwartz, editor. 885
886 Erickson, W.P., G.D. Johnson, and D.P. Young. 2005. A summary and comparison of bird 887
mortality from anthropogenic causes with an emphasis on collisions. Pages 1029-1042 in 888 Bird Conservation Implementation and Integration in the Americas: Proceedings of the 889 Third International Partners in Flight Conference: March 20-24, 2002, Asilomar, CA, C.J. 890 Ralph and T.D. Rich, editors. General Technical Report PSW-GTR-191. Albany, CA: U.S. 891 Department of Agriculture Forest Service, Pacific Southwest Research Station. June 2005. 892
893 Ernst C. H. and E. M. Ernst. 2003. Snakes of the United States and Canada. Smithsonian 894
Institution Press. Washington D.C. Pp: 1-668. 895 896 Fellows, S. D., and S. L. Jones. 2009. Status Assessment and Conservation Action Plan for the 897
Long-billed Curlew (Numenius americanus). U.S. Department of Interior, Fish and Wildlife 898 Service, Biological Technical Publication, FWS/BTP-R6012-2009, Washington, D.C. 899
900 Fiedler, G., and A . Wissner. 1980. Freileitungen als tödliche Gefahr für Weißstörche (Ciconia 901
ciconia). Ökol. vögel. (Ecol. Birds) 2:59-109. 902 903 Frost, D. 2009. The use of ‘flight diverters’ reduces mute swan Cygnus olor collision with 904
power lines at Abberton Reservoir, Essex, England. Conservation Evidence 5:83-91. 905 906 Gamo, R. S. and S. H. Anderson. 2002. Use of reclaimed minelands by pronghorn and mule 907
deer. Interm. J. Sciences. 8:213-222. 908 909 Garthe, S., and O. Hüppop. 2004. Scaling possible adverse effects of marine wind farms on 910
seabirds: developing and applying a vulnerability index. Journal of Applied Ecology 911 41:724–734. 912
913 Gill, J.P., M. Townsley, and G.P. Mudge. 1996. Review of the impacts of wind farms and other 914
aerial structures on birds. Scottish Natural Heritage Review 21, Scottish Natural Heritage, 915 Edinburgh, UK. 916
917 Gionfriddo, J. P. and P. R. Krausman. 1986. Summer habitat use by mountain sheep. J. Wildl. 918
Manage. 50:331-336. 919 920 Governor’s Sage-Grouse Conservation Team. 2004. Greater Sage-grouse Conservation Plan for 921
Nevada and Eastern California. Reno, N V. 108pp. 922 923 Hagen, C.A. 2003. A demographic analysis of lesser prairie-chicken populations in southwestern 924
Kansas: survival, population viability, and habitat use. Ph.D. Dissertation, 925 926 Hagen, C.A., B.E. Jamison, K.M. Giesen, and T.Z. Riley. 2004. Guidelines for managing lesser 927
prairie-chicken populations and their habitats. Wildlife Society Bulletin 32(1):69-82. 928 929

22
Hammerson G. 1999. Amphibians and Reptiles of Colorado. University Press of Colorado & 930 Colorado Division of Wildlife. Niwot, CO. 2nd edition. Pp:1 - 484. 931
932 Hampton P. M., N. B. Ford, and K. Herriman. 2010. Impacts of Active Oil Pumps and Deer Feed 933
Plots on Amphibian and Reptile Assemblages in a Floodplain. The American Midland 934 Naturalist, 163: Pp 44-53. 935
936 Harrelson, C.C., C.L. Rawlins and J.P. Potyondy. 1994. Stream Channel Reference Sites: An 937
Illustrated Guide to Field Technique. Gen. Tech. Rep. RM245. Rocky Mountain Forest and 938 Range Experiment Station. 939
940 Hester, S.H. and M. B. Grenier. 2005. A conservation plan for bats in Wyoming. Wyoming 941
Game and Fish Department, Nongame Program, Lander, WY. Available: 942 http://gf.state.wy.us/downloads/pdf/wybcp_ver1.0.pdf (Accessed 2/5/09). 943
944 Hewson, T. 2008. Wind Power Siting Issues Overview. PowerPoint Presentation at National 945
Association of Attorney Generals: Wind Energy Facility Siting Issue Panel. Center of New 946 Hampshire Radisson Energy Ventures Analysis Inc Arlington Virginia. 947
948 Hoffman, R.W. and A.E. Thomas. 2007. Columbian Sharp-tailed Grouse (Tympanuchus 949
phasianellus columbianus): a technical conservation assessment. USDA Forest Service, 950 Rocky Mountain Region. 132pp. 951
952 Holloran, M.J. 2005. Greater sage-grouse (Centrocercus urophasianus) population response to 953
natural gas field development in western Wyoming. PhD Dissertation. Univ. WY, Laramie. 954 223pp. 955
956 Holloran, M. J., and S. H. Anderson. 2005. Greater sage-grouse population response to natural 957
gas field development in western Wyoming: are regional populations affected by relatively 958 localized disturbance? Transactions of the North American Wildlife and Natural Resources 959 Conference 70:In Press. 960
961 Hötker, H., Thomsen, K.-M. & H. Jeromin (2006): Impacts on biodiversity of exploitation of 962
renewable energy sources: the example of birds and bats - facts, gaps in knowledge, demands 963 for further research, and ornithological guidelines for the development of renewable energy 964 exploitation. Michael-Otto-Institut im NABU, Bergenhusen. 965
http://www.lpo.fr/etudes/eolien/doc/englische20windkraftstudie.pdf 966 967 Hoover, S.L., and M.L. Morrison. 2005. Behavior of red-tailed hawks in a wind turbine 968
development. J. Wildlife Manage. 69(1):150-159. 969 970
Illinois Department of Natural Resources (IDNR). 2007. The Possible Effects of Wind Energy 971 on Illinois Birds and Bats. Report of the Illinois Department of Natural Resources to 972 Governor Rod Blagojevich and the 95th Illinois General Assembly. June 2007. 18 pp. 973
974

23
Ingelfinger, F.M., and S. Anderson. 2004. Passerine Response to Roads Associated With 975 Natural Gas Extraction in a Sagebrush Steppe Habitat. Western North American Naturalist 976 64(3):385-395. 977
Inglefinger, F.M. 2001. The effects of natural gas development on sagebrush steppe passerines 978 in Sublette County, Wyoming. M.S. Thesis, University of Wyoming, Laramie. 110pp. 979
980 Johnson, G.D. 2005. Review of bat mortality at wind-energy developments in the 981
United States. Bat Research News 46:45-49. 982 983 Johnson, G.D., D.P. Young, Jr., W.P. Erickson, C.E. Derby, M. D. Strickland, R.E. Good, and 984
J.W. Kern. 2000. Final Report: Wildlife Monitoring Studies for the Seawest Windpower 985 Project, Carbon County, Wyoming 1995-1999. Western EcoSystems Technology, Inc., 986 Cheyenne, WY. 195pp. 987
988 Johnson, G.D., W.P. Erickson, M.D. Strickland, M.F. Shepherd, and D.A. Shepherd. 989
2000. Avian Monitoring Studies at the Buffalo Ridge, Minnesota Wind Resource 990 Area: Results of a 4-Year Study. Prepared by WEST, Inc., Cheyenne, WY, for 991 Northern States Power Company, Minneapolis, MN. September 22, 2000. 992
993 Kaiser, R. C. 2006. Recruitment by greater sage-grouse in association with natural gas 994
development in western Wyoming. Thesis, University of Wyoming, Laramie, Wyoming. 91 995 pp. 996
997 Kerlinger, P. 2004. Prevention and mitigation of avian impacts at wind power facilities. Pages 998
84-85 in Proceedings of the Wind Energy and Birds/Bats Workshop: Understanding and 999 Resolving Bird and Bat Impacts. Washington, D.C. May 18-19, 2004. Prepared by 1000 RESOLVE, Inc., Washington, D.C., Susan Savitt Schwartz, editor. 1001
1002 Kerns, J., W.P. Erickson and E.B. Arnett. 2005. Bat and Bird Fatality at Wind Energy Facilities 1003
in Pennsylvania and West Virginia. Pages 24-95 in E.B. Arnett, ed. Relationships Between 1004 Bats and Wind Turbines in Pennsylvania and West Virginia: an Assessment of Bat Fatality 1005 Search Protocols, Patterns of Fatality, and Behavioral Interactions with Wind Turbines. A Final 1006 Report Submitted to the Bats and Wind Energy Cooperative. Bat Conservation International, 1007 Austin, TX. Available: http://www.batsandwind.org/main.asp?page=products 1008
1009 Kingsley, A., and B. Whittam. 2003. Wind turbines and birds, a guidance document for 1010
environmental assessment. Phase 3 draft report prepared by Bird Studies Canada for 1011 Canadian Wildlife Service, Gatineau, Quebec. 79pp 1012
1013 Kingsley, A., and B. Whittam. 2007. Wind Turbines and Birds, a Guidance Document for 1014
Environmental Assessment. Report prepared by Bird Studies Canada for Canadian Wildlife 1015 Service, Gatineau, Quebec. 52pp. 1016
1017 Krijgsveld, K. 2007. Effects of modern wind turbines on birds: results of field studies on 1018
collision victims & nocturnal flight patterns in the Netherlands. Pages 41-43 in S.S. 1019 Schwartz (ed). Proceedings of the NWCC Wildlife Workgroup Research Planning Meeting VI. 1020

24
San Antonio, TX November 14-15, 2006. Prepared for the Wildlife Workgroup of the National 1021 Wind Coordinating Collaborative by RESOLVE, Inc., Washington, DC. 138pp. 1022 1023
Kunz, T.H., W. B. Arnett, B.M. Cooper, W.P. Erickson, R.P. Larkin, T. Mabee, M.L. 1024 Morrison, M.D. Strickland, and J.M. Szewczak. 2007a. Assessing impacts of wind-1025 energy development on nocturnally active birds and bats: a guidance document. 1026 Journal of Wildlife Management 71:2449-2486. 1027 1028
Kunz, T.H., E.B. Arnett, W.P. Erickson, A.R. Hoar, G.D. Johnson, R.P. Larkin, M.D. Strickland, 1029 R.W. Thresher, and M.D. Tuttle. 2007b. Ecological impacts of wind energy development on 1030 bats: questions, research needs, and hypotheses. Frontiers in Ecology and the Environment 1031 5:315-324. 1032
1033 Kuvlesky, W.P., Jr., L.A. Brennan, M.L. Morrison, K.K. Boydston, B.M. Ballard, and F.C. 1034
Bryant. 2007. Wind energy development and wildlife conservation: challenges and 1035 opportunities. Journal of Wildlife Management 71(8)2487-2498. 1036
1037 Langston, R.H.W., and J.D. Pullan. 2002. Windfarms and birds: an analysis of the effects of 1038
windfarms on birds, and guidance on environmental assessment criteria and site selection 1039 issues. Convention on the Conservation of European Wildlife and Natural Habitats, Standing 1040 Comm., December 2-5, 2002, T-PVS/ Inf (2002) 30 revised. 37 pp. 1041
1042 Langston, R.H.W., and J.D. Pullan. 2003. Windfarms and birds: an analysis of windfarms on 1043
birds, and guidance on environmental assessment criteria and site selection issues. Royal 1044 Society for Protection of Birds/Report by BirdLife International to the Council of Europe 1045 (Bern Convention), Council of Europe Report T-PVS/Inf (2003) 12. 1046
1047 Lannoo M. (editor). 2005. Amphibian Declines The Conservation Status of United States 1048
Species. University of California Press. Berkeley and Los Angelas, CA. Pp:1-1094. 1049 1050 Leddy, K.L., K.E. Higgins, and D.E. Naugle. 1999. Effects of wind turbines on upland nesting 1051
birds in Conservation Reserve Program grasslands. Wilson Bull. 111(1): 100-104. 1052 1053 Lyon, A.G. 2000. The potential effects of natural gas development on sage-grouse 1054
(Centrocercus urophasianus) near Pinedale, Wyoming. M.S. Thesis, University of 1055 Wyoming, Laramie. 121pp. 1056
1057 Lyon, A. G. and S.H. Anderson. 2003. Potential gas development impacts on sage-grouse nest 1058
initiation and movement. Wildlife Society Bulletin 31(2):486-491. 1059 1060 Lyon, L. J. 1983. Road density models describing habitat effectiveness for elk. J. For. 81:592-1061
595, 615. 1062 1063 Mabey, S., and E. Paul. 2007. Critical literature review: impact of wind energy and related 1064
human activities on grassland and shrub-steppe birds. The National Wind Coordinating 1065 Collaborative, RESOLVE Inc., Washington, DC. 183pp. 1066
1067
25
Manville, A.M., II. 2004. Prairie grouse leks and wind turbines: U.S. Fish and Wildlife Service 1068 justification for a 5-mile buffer from leks; additional grassland songbird recommendations. 1069 Briefing Paper. Division of Migratory Bird Management, USFWS, Arlington, VA, peer-1070 reviewed briefing paper. 17 pp. 1071
1072 Manville, A.M., II. 2005. Bird Strikes and Electrocutions at Power Lines, Communication 1073
Towers, and Wind Turbines: State of the Art and State of the Science – Next Steps Toward 1074 Mitigation. USDA Forest Service Gen. Tech. Rep. PSW-GTR-191. 1075
1076 Medcraft, J. R. and W. R. Clark. 1986. Big game habitat use and diets on a surface mine in 1077
northeastern Wyoming. J. Wildl. Manage. 50:135-142. 1078 1079 Morkill, A.E., and S.H. Anderson 1991. Effectiveness of marking powerlines to reduce sandhill 1080
crane collisions. Wildl. Soc. Bull. 19:442-449. 1081 1082 Morrison, M.L. 2006. Bird Movements and Behaviors in the Gulf Coast Region: Relation to 1083
Potential Wind Energy Developments. National Renewable Energy Laboratory NREL/SR-1084 500-39572, Golden, CO. 1085
1086 National Research Council. 2007. Environmental Impacts of Wind Energy Projects. Report 1087
prepared for the Council on Environmental Quality. The National Academic Press. 1088 Washington, D.C. 376pp. 1089
1090 Naugle, D.E., B.L. Walker, and K.E. Doherty. 2006. Sage-grouse population response to coal-1091
bed natural gas development in the Powder River Basin: interim progress report on region-1092 wide lek-count analysis. University of Montana, Missoula. 10pp. 1093
1094 , K.E. Doherty, B.L. Walker, M.J. Holloran, and H.E. Copeland. In press. Greater sage-1095
grouse and energy development in western North America. Studies in Avian Biology. 1096 1097 Nicholoff, S. H., compiler. 2003. Wyoming Bird Conservation Plan, Version 2.0. Wyoming 1098
Partners In Flight. Wyoming Game and Fish Department, Lander, WY. 1099 1100 Nielsen, A. 2003. Shadow Flicker Briefing. Prepared for Zilkha Renewable Energy, Portland, 1101
OR, by Wind Engineers, Inc. November 20, 2003 [online]. 1102 http://www.efsec.wa.gov/wildhorse/apl/Exhibits PDF/E09_Shadow Flicker Briefing 1103 Memo.pdf 1104
1105 Noer, H., T.K. Christensen, I. Clausager, and I. Krag. 2000. Effects on birds of an offshore 1106
wind park at Horns Rev: Environmental impact assessment. Ministry of Environment and 1107 Energy, National Environmental Research Inst., Dept. of Coastal Zone Ecology, Denmark. 1108 Elsamprojekt A/S 2000. 1109
1110 1111

26
O’Connell, T. J., and M. D. Piorkowski. 2006. Sustainable Power Effects Research on Wildlife: 1112 Final Report of 2004‐2005 Monitoring at the Oklahoma Wind Energy Center. Technical 1113 report submitted by Oklahoma State University, Department of Zoology for FPL Energy, 1114 Stillwater, OK. 1115
1116 Orloff, S., and A. Flannery. 1992. Wind Turbine Effects on Avian Activity, Habitat Use, and 1117
Mortality in Altamont Pass and Solano County Wind Resource Areas, 1989-1991. Final 1118 Report. P700-92-001. Prepared for Planning Departments of Alameda, Contra Costa and 1119 Solano Counties and the California Energy Commission, Sacramento, CA, by BioSystems 1120 Analysis, Inc., Tiburon, CA. March 1992. 1121
1122 Pacific Flyway Study Committee. 2002. Pacific Flyway implementation plan for the Rocky 1123
Mountain population of Trumpeter Swans. Portland (OR):U.S.Fish and Wildlife Service, 1124 Migratory Bird Management Office. 27 p. 1125
1126 Parker J. M. and S. H. Anderson. 2007. Ecology and Behavior of the Midget Faded Rattlesnake 1127
(Crotalus oreganus concolor) in Wyoming. Journal of Herpetology. Vol. 41. No. 1. pp 41-51. 1128 1129 Patten, M.A., D.H. Wolfe, E. Shochat, and S.K. Sherrod. 2005. Habitat fragmentation, rapid 1130
evolution, and population persistence. Evolutionary Ecology Research 7: 235–249. 1131 1132 Percival, S.M. 2001. Assessment of the effects of offshore wind farms on birds. ETSU 1133
W/13/00565/REP, DTI/Pub URN 01/1434. 66 pp. 1134 1135 Perry, C., and R. Overly. 1977. Impacts of roads on big game distribution in portions of the 1136
Blue Mountains of Washington, 1972-1973. Appl. Res. Sect. Bull. 11. Wash. Game Dept. 1137 Olympia. 39pp. 1138
1139 Pitman, J.C. 2003. Lesser prairie-chicken nest site selection and nest success, juvenile gender 1140
determination and growth, and juvenile survival and dispersal in southwestern Kansas. M.Sc. 1141 Thesis, Division of Biology, College of Arts and Sciences, Kansas State Univ. 169 pp. 1142
1143 Public Service Commission of Wisconsin. 2005. Application of Forward Energy LLC for a 1144
Certificate of Public Convenience and Necessity to Construct a Wind Electric Generation 1145 Facility and Associated High Voltage Electric Transmission Facilities, to be Located in 1146 Dodge and Fond du Lac Counties: Final Decision. Docket 9300-CE-100. 47pp + 1147 Appendices. 1148
1149 Reynolds, R. T., J. M. Scott, and R. A. Nussbaum. 1980. A variable circular plot method for 1150
estimating bird numbers. Condor. 82:309-313. 1151 1152 Rogers, A.L., J.F. Manwell, and S. Wright. 2002. Wind Turbine Acoustic Noise. Prepared by 1153
Renewable Energy Research Laboratory, University of Massachusetts, Amherst. June 1154 (amended January 2006). 1155
1156

27
Rosgen, D. 1996. Applied River Morphology. Wildland Hydrology, 11210 N County Rd 19, Fort 1157 Collins, CO. 1158
1159 Rosgen, D. 2006, Watershed Assessment of River Stability and Sediment Supply (WARSSS). 1160
Wildland Hydrology, 11210 N County Rd 19, Fort Collins, CO. 1161 1162 Rosgen, D. 2008. River Stability Field Guide. Chapter 2. Wildland Hydrology, 11210 N County 1163
Rd 19, Fort Collins, CO. 1164 1165 Rost, G. R., and J. A. Bailey. 1979. Distribution of mule deer and elk in relation to roads. J. 1166
Wildl. Mange. 43:634-641. 1167 1168 Rubolini, D., M. Gustin, G. Bogliani, and R. Garavaglia. 2005. Birds and powerlines in Italy: an 1169
assessment. Bird Conserv. Int. 15:131–145. 1170 1171 Rugge, L., K.S. Smallwood, and C.G. Thelander. 2003. Bird Risk Behaviors and Fatalities at 1172
the Altamont Pass Wind Resource Area. NREL/SR-500-33829. BioResource Consultants, 1173 Ojai, CA. 1174
1175 Rumble, M. A., L. Benkobi, and R. S. Gamo. 2005. Elk responses to humans in a densely 1176
roaded area. Interm. J. Sciences. 11: 10-24 1177 1178 Sawyer, H. R. M. Nielson, F. Lindzey, and L. L. McDonald. 2006. Winter habitat selection of 1179
mule deer before and during development of a natural gas field. J. Wildl. Manage. 70:396-1180 403. 1181
Schroeder MA, JR Young, and CE Braun. 1999. Sage Grouse (Centrocercus urophasianus). In 1182 The Birds of North America, No. 425, A Poole and F Gill (eds). The Birds of North America, 1183 Inc., Philadelphia, Pennsylvania. 1184
1185 Schroeder, M., C. Braun, and J. Connelly. 2006. Effects of Wind Power on Sage-Grouse. 1186
PowerPoint Presentation. Wildlife Workgroup Research Meeting VI. November 14-16, 1187 2006. San Antonio, Texas 1188
1189 Segerstrom, T. B. 1982. Effects of an operational coal mine on pronghorn antelope. M.S. 1190
Thesis, Montana State Univ., Bozeman. 68pp. 1191 1192 Sharp, L. 2005. Information Review: Habitat Impacts of Wind Power on Sage-grouse. Pages 1193
45-47 in S.S. Schwartz (ed). Proceedings of the Onshore Wildlife Interactions with Wind 1194 Developments: Research Meeting V. Lansdowne, VA November 3-4, 2004. Prepared for 1195 the Wildlife Subcommittee of the National Wind Coordinating Committee. Resolve, Inc. 1196 Washington, DC. 120 pp. 1197
1198 Smallwood, K. S. 2007. Estimating wind turbine-caused bird mortality. Journal of Wildlife 1199
Management 71(8):2781-2791. 1200 1201

28
Smallwood, K.S., and C.G. Thelander. 2004. Developing Methods to Reduce Bird Mortality in 1202 the Altamont Pass Wind Resource Area. Final Report. P500-04-052. Prepared for 1203 California Energy Commission, Public Interest Energy Research Program, Sacramento, CA, 1204 by BioResources Consultants, Ojai, CA. August 2004. 1205
1206 Smallwood, K.S., C.G. Thelander, M.L. Morrison, and L.M. Rugge. 2007. Burrowing owl 1207
mortality in the Altamont Pass Wind Resource Area. Journal of Wildlife Management 1208 71(8):1513-1524. 1209
1210 Smith, T. S., J. T. Flinders, and D. S. Winn. 1991. A habitat evaluation procedure for Rocky 1211
Mountain bighorn sheep in the Intermountain West. Great Bas. Nat. 51:205-225. 1212 1213 Smolensky N. L. 2008. Population Enumeration and the Effects of Oil and Gas Development on 1214
Dune-Dwelling Lizards. Thesis. Texas A&M University. Pp:1-82 1215 1216 South Dakota Game, Fish and Parks. 2007. Siting Guidelines for Wind Power Projects in South 1217
Dakota. Pierre, S.D. 17pp. 1218 1219 Southwest Wyoming Sage-grouse Working Group. 2007. Southwest Wyoming Sage-grouse 1220
Conservation Assessment and Plan. 109pp. 1221 1222 Stemler, J. 2007. Windpower wind power siting, incentives, and wildlife guidelines in the 1223
United States. Report prepared for the Association of Fish and Wildlife Agencies, 1224 Washington, D.C. 131pp. 1225
1226 Stewart, G.B., A. S. Pullin, and C.F. Coles. 2007. Poor evidence-base for assessment of 1227
windfarm impacts on birds. Environnmental Conservation 34:1-11. 1228 1229 Stiver, S.J., A.D. Apa, J.R. Bohne, S.D. Bunnell, P.A. Deibert, S.C. Gardner, M.A. Hilliard, 1230
C.W. McCarthy, and M.A. Schroeder. 2006. Greater Sage-grouse Comprehensive 1231 Conservation Strategy. Western Association of Fish and Wildlife Agencies. Unpublished 1232 Report. Cheyenne, Wyoming. 1233
1234 Strickland, D. 2004. Non-fatality and habitat impacts on birds from wind energy development. 1235
Pages 34-38 in S.S. Schwartz (ed.). Proceedings of the Wind Energy and Birds/Bats 1236 Workshop: Understanding and Resolving Bird and Bat Impacts. May 18-19, 2004. 1237 RESOLVE, Inc. Washington, DC. 107pp. +appendices. 1238 1239
Strickland, D. 2005. Methods and Metrics for Understanding Indirect Impacts from Wind 1240 Projects. Pages 49-51 in S.S. Schwartz (ed.). Proceedings of the Onshore Wildlife 1241 Interactions with Wind Developments: Research Meeting V. Lansdowne, VA November 3-4, 1242 2004. Prepared for the Wildlife Subcommittee of the National Wind Coordinating 1243 Committee by RESOLVE, Inc., Washington, DC. 120 pp. 1244
1245 Strickland, D. 2008. Overview of avian interactions with wind energy development. Webinar, April 8, 1246
2008. http://www.west-inc.com/webinars/20080408AvianOverview.pdf 1247

29
Thelander, C.G., and L. Rugge. 2000. Avian Risk Behavior and Fatalities at the Altamont Wind 1248 Resource Area: March 1998 to February 1999. NREL/SR-500-27545. Prepared for the 1249 National Renewable Energy Laboratory, Golden, CO, by BioResource Consultants, Ojai, 1250 CA. May 2000. 1251
1252 Tilton, M. E. and E. E. Willard. 1982. Winter habitat selection by mountain sheep. J. Wildl. 1253
Manage. 46:359-366. 1254 1255 USFWS (U.S. Fish and Wildlife Service). 2003. Interim Guidelines to Avoid and Minimize 1256
Wildlife Impacts from Wind Turbines. Washington, D.C. 55pp. 1257 1258 USFWS (U.S. Fish and Wildlife Service). 2004. Comments on Forward Energy Wind Farm 1259
Project, Fond du Lac and Dodge Counties, Wisconsin. Memorandum dated November 18, 1260 2004 addressed to Ms. Marilyn Weiss, Wisconsin Public Service Commission, Madison, 1261 Wisconsin. 6pp. 1262
1263 Walker, B.L. 2008. Greater sage-grouse response to coal-bed natural gas development and West 1264
Nile virus in the Powder River Basin, Montana and Wyoming, USA. Phd Dissertation. 1265 University of Montana, Missoula. 218pp. 1266
1267 Walker, B.L., D.E. Naugle, and K.E. Doherty. 2007. Greater sage-grouse population response to 1268
energy development and habitat loss. Journal of Wildlife Management 71:2644-2654. 1269 1270
Walter, W. D., D. M. Leslie, Jr., and J. A. Jenks. 2006. Response of Rocky Mountain elk 1271 (Cervus elaphus) to wind-power development. American Midland Naturalist 156:363–375. 1272
1273 Weller, T.J. 2007. Evaluating Pre-construction Sampling Regimes for Assessing Patterns of Bat 1274
Activity at a Wind Energy Development in Southern California. PIER Energy-Related 1275 Environmental Research Program. CEC-500-01-032. 1276
1277 Werner J. K., B. A. Maxwell, P. Hendricks, and D. L. Flath. 2004. Amphibians and Reptiles of 1278
Montana. Mountain Press Publishing Company. Missoula, MO. Pp: 1-262 1279 1280 Winegrad, G. 2004. Why avian impacts are a concern in wind energy development. Pages 22-1281
24 in Proceedings of the Wind Energy and Birds/Bats Workshop: Understanding and 1282 Resolving Bird and Bat Impacts. Washington, D.C. May 18-19, 2004. Prepared by 1283 RESOLVE, Inc., Washington, D.C., Susan Savitt Schwartz, editor 1284
1285 Wisconsin Department of Natural: Guidance. Wisconsin Department of Natural Resources, 1286
Madison. 6pp. http://www.dnr.state.wi.us/org/es/science/energy/wind/guidelines.pdf 1287 1288 Wisinski, C.L. 2007. Survival and Summer Habitat Selection of Male Greater Sage-Grouse 1289
(Centrocercus urophasianus) in Southwestern Montana. M.S. Thesis. Montana State 1290 University, Bozeman. 1291
1292

30
Wolfe, D.H., M.A. Patten, and S.K. Sherrod. 2003a. Factors affecting nesting success and 1293 mortality of Lesser Prairie-Chickens in Oklahoma. ODWC Federal Aid in Wildlife 1294 Restoration Project W-146-R Final Report. OK Dept. Wildlife Conservation, 23 pp. 1295 1296
Wolfe, D.H., M.A. Patten, and S.K. Sherrod. 2003b. Causes and patterns of mortality in Lesser 1297 Prairie-Chickens. Poster presented at meetings of The Wildlife Society, Burlington, VT, and 1298 Prairie Chicken Technical Committee, OK Dept. Wildlife Conservation. OK Biological 1299 Survey and George M. Sutton Avian Research Center. [pdf file] 1300
1301 Wolfe, D.H., M.A. Patten, E. Shochat, C.L. Pruett, and S.K. Sherrod. 2007: Causes and patterns 1302
of mortality in lesser prairie-chickens (Tympanuchus pallidicinctus) and implications for 1303 management. -Wildl. Biol. 13 (Suppl. 1): 95-104. 1304
1305 Zeiler, Hubert P, Granschachner-Berger, Veronika. 2009. Impact of wind power plants on black 1306
grouse, Lyrurus tetrix in Alpine regions. Folia Zoologica. FindArticles.com. 05 Apr, 2010. 1307 http://findarticles.com/p/articles/mi_7539/is_200904/ai_n32334209/ 1308
1309 1310
1311

31
APPENDIX A 1312 WIND ENERGY DEVELOPMENT 1313
BEST MANAGEMENT PRACTICES 1314 These recommended Best Management Practices apply only to the activities of wind 1315
developers and their contractors and subcontractors. 1316 1317
1. Our recommendations (including the best management practices and monitoring 1318 recommendations) may not be applicable to all wind projects in the state and are 1319 intended to be applied based on specific characteristics of a project site determined 1320 during pre-construction surveys and in consultation with WGFD. Early consultation 1321 with WGFD is the best means available for developers to determine which 1322 recommendations are appropriate for their project area. These recommendations apply 1323 only to that portion of collector lines located within a wind generation project area 1324 boundary. Recommendations for collector lines outside of a wind generation project 1325 area boundary and for transmission lines will be developed on a case-by-case basis. 1326
1327 2. We recommend project developers engage early with the USFWS to obtain their input on 1328
siting, monitoring and potential impacts to wildlife and habitat. 1329 1330 3. Project developers should consult with the WGFD at least two years prior to submitting 1331
permit applications so that appropriate studies can be conducted and site-specific 1332 recommendations can be developed. 1333
1334 4. Wind development is not recommended in sage grouse core areas. 1335 1336 5. Developers should use the statewide wind energy/wildlife conflict map (GIS shapefiles 1337
available at http://gf.state.wy.us/habitat/ TerrestrialHome/ WindDevelopment/index.asp) 1338 as one of the first steps in evaluating the suitability of leases and pre-development 1339 planning. 1340
1341 6. To the extent practicable, site wind turbines and ancillary project components within 1342
habitats/areas already affected by other forms of development (e.g., cropland, oil and gas 1343 fields, mine sites). 1344
1345 7. Developments proposed within 2 miles of WGFD wildlife habitat management areas 1346
should be coordinated with WGFD to avoid or minimize impacts to associated wildlife 1347 species and habitats. 1348
1349 8. Developments proposed within 2 miles of federal wildlife refuges should be coordinated 1350
with WGFD and USFWS to avoid or minimize impacts to associated wildlife species 1351 and habitats 1352
1353 9. Avoid placing turbines in documented locations of any species of wildlife, fish, or plants 1354
protected under the Federal Endangered Species Act. 1355 1356

32
10. Within 2 miles of the perimeter of an occupied non-core SAGE GROUSE lek, 1357 construction activities should not occur between March 15 and May 15. The WGFD 1358 recommends that developers monitor leks subject to this recommendation to evaluate its 1359 effectiveness in reducing the impacts of wind development on sage-grouse. 1360
1361 11. A habitat map delineating vegetation types should be developed for each project. 1362 1363 12. Any construction/development activities within 2 miles of the perimeter of occupied 1364
Plains and Columbian sharp-tailed grouse leks should be suspended from April 1 – July 1365 15. 1366
1367 13. Turbines and all related above ground infrastructure, including roads, should occur 1368
outside a 0.25 mile (no surface occupancy) distance from the perimeter of sage-grouse 1369 leks in non-core habitat. 1370
1371 14. Turbines and all related above ground infrastructure, including roads, should occur 1372
outside a 0.25 mile (no surface occupancy) distance from the perimeter of plains sharp-1373 tailed grouse leks. 1374
1375 15. Turbines and all related above ground infrastructure, including roads, should occur 1376
outside a 0.6 mile (no surface occupancy) distance from the perimeter of Columbian 1377 sharp-tailed grouse leks. 1378
1379 16. Avoid siting wind energy facilities within crucial big game ranges including crucial 1380
winter, identified parturition, and migration corridors. 1381 1382 17. If siting within big game winter ranges cannot be avoided, suspend construction activities 1383
from November 15-April 30. 1384 1385 18. If siting within identified big game parturition areas cannot be avoided, suspend 1386
construction activities from May 1-June 15. 1387 1388 19. Avoid placing wind energy facilities in locations that bisect major big game migration 1389
corridors as determined by on the ground mapping. 1390 1391 20. To the extent practicable, roads and fences should not bisect or run immediately adjacent 1392
to any natural water feature potentially preventing wildlife from reaching adjacent 1393 habitat. 1394
1395 21. To the extent practicable, herptile habitats for SGCN species, such as fallen trees, prairie 1396
dog colonies, and potential basking rocks, should be left intact. 1397 1398 22. Avoid siting wind energy facilities within 0.25 mile of identified habitat used by SGCN 1399
amphibians and reptiles. 1400 1401

33
23. Developers and their contractors should be instructed to follow posted speed limits to 1402 reduce, to the extent possible, collisions with all wildlife. 1403
1404 24. Where feasible, place power lines collecting electricity from turbines underground. Use 1405
recommendations of the APLIC (1994, 2006) for any required above-ground lines, 1406 transformers, or conductors. 1407
1408 25. Within wind generation project area boundaries avoid overhead power or collector line 1409
crossings of naturally occurring perennial streams, lakes, reservoirs, riparian corridors, 1410 and large (>5 acres) wetlands, where feasible. 1411
1412 26. When siting wind turbines within 2 miles of naturally occurring wetlands, riparian areas, 1413
lakes, reservoirs, and forested habitats collect adequate information to demonstrate that 1414 specific turbine locations will not result in significant levels of impacts to associated 1415 wildlife species and habitats. Determinations should be made on a project specific basis 1416 based upon site-specific data and information. 1417
1418 27. Use non-guyed non-lattice meteorological towers or attach bird diverters to guy wires on 1419
guyed met towers.1
1421 1420
28. In coordination with WGFD and USFWS, determine appropriate set-backs from ridges, 1422 bluffs or other features to avoid or minimize impacts to bats, neotropical birds, 1423 migratory birds or raptors. Determinations should be made on a project specific basis 1424 based upon site-specific data and information. 1425
1426 29. Minimize construction of all roads, fences and other ancillary facilities to reduce overall 1427
fragmentation; use bird diverters on fences with high potential for strikes within 0.6 1428 miles of sage-grouse leks in core areas; 0.25 miles of sage-grouse leks in non-core areas 1429 and use or upgrade existing roads rather than constructing new roads where possible, . 1430
1431 30. If sage-grouse mortality due to collisions with fences is documented implement 1432
appropriate actions to mitigate impacts. 1433 1434 31. Close access and maintenance roads to public travel except preexisting roads on public 1435
lands (as applicable to management purposes). 1436 1437 32. Access for hunting should continue within wind leases on public lands and on private 1438
land with landowner permission. Wind developers should not require indemnification 1439 from landowners who are willing to provide public access for hunting and fishing or 1440 from sportsmen and sportswomen who utilize the property. 1441
1442
1 Wyoming State Law requires all new and existing wind energy met towers to be mapped within the Wyoming Department of Transportation information system and marked to be visible from 2000 feet during daylights hours. This information is available to the aviation community on the Wyoming Department of Transportation website --http://gf.state.wy.us/METTowers/default.aspx.1

34
33. Adopt appropriate turbine design and siting standards to minimize bird and bat collisions 1443 (see U.S. Fish and Wildlife Service 2003: and DOI Wind Turbine Guideline Advisory 1444 Committee Recommendations 2010). 1445
1446 34. While still providing for site-security and workplace safety, applicants should comply 1447
with the DOI Wind Turbine Guideline Advisory Committee Recommendations (2010) 1448 regarding lighting where possible. 1449
1450 35. Developers should consult with existing landowners, WGFD, and the authorized land 1451
management agency to determine the location of new fences and what types of fence 1452 design and construction are appropriate based on the wildlife resource and needs of the 1453 existing landowner and/or land management agency. 1454
1455 36. At the completion of each project construction phase provide WGFD as-built maps of 1456
roads, turbine locations and ancillary project components in a GIS format. 1457 1458 37. Construction should be suspended within buffers and during the dates specified around 1459
raptor nests as provided in Appendix B and as updated by USFWS and WGFC. 1460 1461 38. Map and control noxious and invasive weeds within project area. 1462 1463 39. Developers are responsible (physically and financially) for monitoring and disposing of 1464
carcasses and handling/rehabilitation of injured wildlife on the project area. Developers 1465 are required to obtain the appropriate WGFD Chapter 10 and 33 permits and any 1466 USFWS requirements. 1467
1468 1469
1470

35
APPENDIX B 1471 COORDINATION/CONSULTATION WITH PRIVATE 1472
LANDOWNERS & WIND DEVELOPERS, 1473 SITE SELECTION, BASELINE DATA COLLECTION & 1474
MONITORING 1475 RECOMMENDATIONS FOR WIND DEVELOPMENT, 1476
RECLAMATION, 1477 AND MITIGATION PRACTICES 1478
1479 1480 COORDINATION/CONSULTATION WITH PRIVATE LANDOWNERS 1481 1482 Affected private landowners are an integral part of WGFD/Wind Developer 1483 consultations. “Affected landowners” are defined as any person, or their designated 1484 representative, holding record title to land on which any portion of a commercial facility 1485 generating electricity from wind is proposed to be constructed. The 1486 coordination/consultation process outlined below will include all wind generation 1487 facilities located on private lands including that portion of any collector system located 1488 on those same lands. 1489 1490 Prior to entering into any agreement with a wind energy developer to undertake studies or 1491 monitoring activities on private lands that precede efforts to develop a Conservation Plan, 1492 the WGFD shall request from the developer a written statement certifying that all 1493 affected landowners have been notified of the proposed studies or monitoring activities 1494 and have granted all necessary access for the purpose of such studies or monitoring. 1495 1496 Prior to entering into any substantive discussions with the WGFD regarding WGFD 1497 recommendations for wind energy development, but in no case less than six months prior 1498 to the submission of an application for development: 1499 1500 WGFD shall request from the developer contact information for all affected 1501
landowners. WGFD will not meet with developers until a list of affected landowners 1502 has been provided by the developer. 1503
The WGFD shall notify affected landowners of all meetings between WGFD and the 1504 developer. 1505
Affected landowners or their representative shall be entitled to participate in all 1506 discussions between the developer and the WGFD. 1507
1508 Prior to submittal of any recommendations from the WGFD to the ISC and/or to local 1509 governments, the WGFD shall collaborate with the affected landowner(s) and the 1510 developer to develop a “Conservation Plan” for affected private lands incorporating 1511 mutually agreed upon goals and practices. In development of this Conservation Plan: 1512 1513 Discussions shall be conducted in a collaborative manner. 1514

36
The parties may mutually agree to utilize a facilitator or to engage in mediation with 1515 such facilitator or mediator approved by all parties. 1516
The WGFD will designate a WGFD representative to the discussions who is mutually 1517 acceptable to the affected landowners and the WGFD. 1518
If the landowner and the developer have agreed to certain conservation measures 1519 prior to initiation of the collaboration required under this section, the WGFD shall 1520 accept these as components of the Conservation Plan or provide in writing the reasons 1521 for their rejection. 1522
The final Conservation Plan shall be signed by the developer, the affected landowners 1523 or their authorized representative and the Director of the WGFD. 1524
• The Conservation Plan shall be incorporated into developer’s Permit Application to 1525 ISC. 1526
The Conservation Plan shall become the WGFD “recommendations “ under W. S. 35-1527 12-110 (b) and (c) and the WGFD recommendations to any local government entity. 1528
The parties shall jointly advocate for ISC incorporation of the Conservation Plan into 1529 the developer’s permit. 1530
• A Conservation Plan shall not be binding on any party unless it has been signed by a 1531 majority of affected landowners or by landowners representing a majority of the 1532 affected private lands. A Conservation Plan shall be binding only on parties 1533 signatory to that Plan. 1534 1535
If any affected landowner or the project developer declines to participate in the 1536 Conservation Plan process or a Conservation Plan is not successfully developed and 1537 signed by the WGFD, an affected landowner or the project developer : 1538 1539 WGFD shall provide contact information provided by the developer for all affected 1540
landowners to the ISC. 1541 The landowner, with or without the concurrence of the developer, may submit a 1542
conservation plan to the ISC. 1543 The WGFD may make recommendations to ISC as provided by statute as to lands not 1544
under a joint Conservation Plan. 1545 The process will proceed as outlined in the Industrial Development and Siting Act. 1546
1547 SITE SELECTION 1548 1549 Appropriate site selection for wind energy development is key in preventing negative impacts to 1550 wildlife. Therefore, detailed planning and survey efforts prior to investment and eventual 1551 construction will help identify and avoid problems that may occur, determine sites that are 1552 unsuitable for development, and minimize or mitigate impacts that cannot be avoided. In general, 1553 previously altered landscapes, such as cultivated, industrial, and urbanized areas with existing 1554 roads and power line corridors are, from a wildlife perspective, more fitting locations for wind 1555 development. 1556

37
1557 Our wind energy development recommendations are aimed at abiding by the following guiding 1558 principles. 1559 1560
1. Establish regulatory clarity and consistency while still providing adequate protection of 1561 Wyoming’s wildlife resources. 1562
1563 2. Attain methodological consistency in the development of pre and post- construction 1564 monitoring requirements. 1565
1566 3. Develop monitoring protocols that are scientifically sound while establishing 1567 reasonable certainty about the direct and indirect effects of wind development on 1568 wildlife. 1569
1570 4. Maintain a degree of reasonable flexibility to accommodate the unique characteristics 1571 of each proposed wind development. 1572
1573 5. Facilitate effective communication between project proponents and WGFD while also 1574 complimenting other local, state, and federal wildlife-related regulatory processes 1575 without creating conflicting recommendations. 1576
1577 6. Acknowledge the consequences that would result from the addition of Greater Sage-1578 grouse or any other species to the federal list of threatened or endangered species. 1579
1580 7. Establish a process to determine appropriate mitigation in the event that unforeseen 1581 wildlife conflicts arise during or after the construction of a wind energy development. 1582
1583 The following recommendations for baseline data collection and monitoring have been 1584 developed by WGFD staff to lessen future impacts to wildlife and facilitate planning for wind 1585 development. In all cases, baseline and monitoring data and reports will be provided to WGFD 1586 (Habitat Protection Office and appropriate Regional Office) on an annual basis. In addition, all 1587 research and monitoring design and results must be made available for review by the WGFD and 1588 in some instances may require independent peer review. 1589 1590 Consistent with the FAC Draft Guidelines (2010), WGFD offers a tiered approach to our review 1591 of wind development. We recommend that industry meet with WGFD very early in the process 1592 (pre-site selection, pre-planning) to best identify potential issues. We advise that initial 1593 discussion with WGFD begin at least 2 years prior to the submittal of any applications. 1594 1595 Tier 1- Site Selection 1596 1597 The objective of Tier 1 is to help the developer identify site(s) to consider or reject for wind 1598 development based on potential or known conflicts with wildlife resources. Questions to address 1599 under this tier include: 1600 1601
1. Are there species or habitat(s) of concern present on the site? 1602

38
2. Does the landscape contain areas where development is precluded by law, regulation 1603 or policy? 1604
3. Are there known crucial areas for wildlife such as hibernacula, winter ranges, 1605 migration corridors, or other vital/sensitive habitats? 1606
4. Are there large areas of intact habitat with species where habitat impacts are a 1607 concern? 1608
5. Using best available scientific information, has the potential presence of important 1609 species or crucial/vital habitat been documented? 1610
6. Which SGCN or interest is likely to use the proposed site based upon known data? 1611 1612 Tier 2- Field Monitoring to Document Wildlife Conditions and Potentially Predict Project 1613 Impacts 1614 1615 The objective of Tier 2 is to identify site-specific conditions regarding wildlife species and 1616 habitats based on pre-construction monitoring. Questions include: 1617 1618
1. Does pre-construction monitoring indicate that SGCN are present on or likely 1619 to use the proposed site? 1620
2. Does monitoring indicate the potential for adverse impacts on the wildlife 1621 species or habitat? 1622
3. If adverse impacts are predicted to a species or habitat, can these impacts be 1623 avoided (preferable) or mitigated? 1624
4. Is monitoring needed for construction and post-construction? 1625 1626 Tier 3- During and Post-Construction Monitoring 1627 1628 This Tier identifies impacts to species and habitats and can provide the basis for designing and 1629 implementing appropriate mitigation. Questions include: 1630 1631
1. What is the bird and bat fatality rate for the project? 1632 2. Have sage-grouse lek counts changed? 1633 3. Has raptor nesting and production been affected? 1634 4. Has big game distribution on crucial ranges changed, and, if so, how and to what 1635
degree? 1636 5. Has big game population parameters (recruitment rates, etc.) changed? 1637 6. Has other species of interest distribution and habitats been altered? 1638
1639 BASELINE DATA COLLECTION AND MONITORING RECOMMENDATIONS 1640
1641 Bats 1642
1643 The following are general recommendations aimed at standardizing surveys to improve our 1644 understanding and provide guidance on collection of baseline data related to bat issues (e.g., 1645 causal factors, species susceptibility, distribution, abundance, and behavior). These 1646 recommendations were developed by WGFD and the Wyoming Bat Working Group (WYBWG) 1647 specifically to address survey standardization in Wyoming. If additional information on broader 1648

39
objectives is required please consult survey recommendations in Hester and Grenier (2005). 1649 These recommendations are intended to provide specific details (e.g., timing, duration, 1650 equipment, etc.), yet remain flexible enough to provide managers with the ability to prescribe 1651 appropriate surveys (e.g., pre- and post-construction, etc.) across a broad range of project sites. 1652 A combination of multiple approaches (e.g., passive and active acoustic or passive acoustic and 1653 carcass searches, etc.) is recommended and survey strategies may vary by site. Please refer to 1654 the Survey Matrix (Table 1) for additional guidance. As bat survey methods advance the WGFD 1655 and WYBWG will evaluate new techniques and equipment for potential application in the state 1656 and revise these recommendations if new methods are appropriate. 1657
1658 In general, we recommend surveys be conducted for a minimum of 2 years prior to construction 1659 and 3 years post construction to be consistent with recommendations for other wildlife species 1660 (i.e., birds, sage-grouse and big game). 1661
1662 Habitat Evaluation 1663
1. Objective – Identify and quantify existing bat habitats within a project site. 1664 1665 2. Rationale – The results can be used to identify potential roosting and foraging areas for 1666
bats within project sites to prioritize surveys and improve siting. The analysis can also be 1667 used to quantify changes in habitat. 1668
1669 3. Equipment – No specialized equipment is required, however, analysis is most easily 1670
completed using remote sensing techniques (e.g., aerial or satellite imagery) and GIS. 1671 1672 4. Application – A pre-construction evaluation should be completed by identifying potential 1673
foraging areas (i.e., Forest and Woodlands, Grasslands and Shrub-steppe, Riparian 1674 Corridors, and Water Features) and roosting areas (i.e., Rock Shelters, Forest and 1675 Woodlands, Riparian Corridors) within the project boundary. Please refer to “A 1676 Conservation Plan for Bats in Wyoming” (Hester and Grenier 2005) for additional 1677 information on habitats and associated bat species. Habitat can be evaluated either 1678 remotely (e.g., GIS) or using ground surveys. Delineate foraging and roosting habitats 1679 within the project site. If the pre-construction evaluation is done using remote sensing 1680 then field verification is also recommended. Compare proposed turbine siting data with 1681 the results of the habitat evaluation to identify potential conflict areas. 1682
1683 A post-construction habitat evaluation is recommended following development of the 1684 project site. Compare pre- and post-construction habitat evaluations to quantify changes 1685 in habitats within the project site. 1686 1687
5. Analysis of Data – Total area and the percentage of each foraging and roosting habitat 1688 type present within the project area prior to construction should be reported. 1689 1690
Passive Acoustic Surveys 1691 1. Objective – Identify and quantify bat species and relative abundance near the rotor sweep 1692
zone. 1693 1694

40
2. Rationale – Results can be used to identify bat species presence and describe bat behavior 1695 (e.g., spatial and temporal use, etc.) likely to occur near rotor sweep zone. Data can also 1696 be used as an index of relative abundance for this component of the project area. For 1697 passive acoustic survey recommendations that address broader objectives see Hester and 1698 Grenier (2005). 1699
1700 3. Equipment – There are many systems available for acoustic monitoring of bats (e.g., 1701
AnaBat, Pettersson D500x, Binary Acoustics, etc.). The AnaBat system is the only 1702 known acoustic monitoring system currently being used in Wyoming. If other systems 1703 are to be used please consult the WYBWG prior to data collection to ensure that survey 1704 equipment is compatible with survey objectives. 1705
1706 4. Application – Passive acoustic survey stations should be designed to collect bat calls at ≥ 1707
50 m whenever possible to identify activity within the rotor sweep zone. Met Towers 1708 often provide an appropriate structure for this type of data collection. At least one 1709 acoustic unit, aimed away from the prevailing wind direction, per Met Tower should be 1710 utilized. A second unit, placed near the ground (e.g., < 5 m), can be used to quantify bat 1711 activity below the rotor sweep zone in areas that concentrate bat use (e.g., roosting or 1712 foraging areas, etc.). 1713 1714 Units should be deployed between April 15 and October 15 and be programmed to begin 1715 data collection ½ hr prior to sunset and end data collection ½ hr after sunrise. Equipment 1716 should be calibrated annually and checked bi-monthly to ensure that units are properly 1717 functioning. Non-functioning equipment should be replaced immediately. Storage cards 1718 should be rotated bi-monthly for data analysis. 1719 1720 The number of acoustic survey stations needed for a project will vary depending on the 1721 available bat habitat in the area. If few (e.g., ≤ 2) survey stations are used during the pre-1722 construction survey period, then the data collection period may need to extend past two 1723 years to ensure that the data accurately reflect conditions (e.g., species diversity, temporal 1724 and spatial use, etc.) within the project area. 1725 1726 Results from previous studies have demonstrated a high correlation between data 1727 collected using the above recommendations and project site conditions (e.g., species 1728 diversity, temporal and spatial use, etc.) despite constraints that each unit samples a small 1729 amount of area (Weller 2007, Collins and Jones 2009). Please refer to Weller (2007) for 1730 additional specifics regarding the deployment of passive units on met towers. 1731
1732 5. Analysis of Data –Analysis of bat calls should only be performed by experienced 1733
personnel. Species identification should be made whenever possible; however, calls 1734 should at a minimum be identified to a frequency grouping (e.g., 25 kHz, 40 kHz, etc.). 1735
1736 For each unit deployed report the total number of calls, number of identifiable calls, total 1737 number of survey nights, number of species detected, scientific name of species detected, 1738 and number and identity of frequency groups detected (e.g., 25 kHz, 40 kHz, etc.). The 1739 index of activity should be reported as the total calls per survey night per unit. The 1740

41
location (i.e., UTM), equipment aspect, microphone height, surveyor, and name of call 1741 analyst should also be reported. 1742
1743 A voucher call (i.e., representative call sequence) should be submitted for each species 1744 and frequency groups detected with the final report. The following supporting 1745 information should be supplied for each voucher call, location (i.e., UTM), date, time, 1746 scientific name of species detected, detector height and aspect, and name of call analyst. 1747
1748 Active Acoustic Surveys 1749
1. Objective – Identify and quantify bat species presence below the rotor sweep zone. 1750 1751 2. Rationale – Results should be used primarily in conjunction with other survey methods 1752
(e.g., live capture). These types of surveys can be used to identify and prioritize 1753 additional survey locations, enhance identification of species (i.e., for those species that 1754 are not easily captured), and target areas that concentrate bat activity (e.g., foraging). For 1755 active acoustic survey recommendations that address broader objectives see Hester and 1756 Grenier (2005). 1757
1758 3. Equipment – The same equipment used for passive acoustic monitoring should be used 1759
for active acoustic monitoring. External display devices (e.g., laptops or PDA) can 1760 improve the observer’s ability to collect high quality calls. 1761
1762 4. Application – Active acoustic monitoring should begin ½ hr before sunset and continue 1763
for at least 2½ hours. Personnel should attempt to follow bats in flight during the entire 1764 survey period. Care should be taken to collect long call sequences, whenever possible, to 1765 facilitate species identification. Avoid selecting survey sites near areas that reduce an 1766 observer’s ability to hear bats (e.g., high ambient noise). 1767 1768 Mobile (i.e., roaming or vehicle transects) acoustic surveys has the potential to quantify 1769 bat species and relative abundance below the rotor sweep zone across larger landscapes. 1770 This method collects bat calls while travelling a predetermined motorized route. There is 1771 no established methodology for this type of survey and individuals that are considering 1772 using this technique should consult qualified individuals before initiating surveys to 1773 ensure that the surveys are conducted in a robust manner to maximize inference. 1774 1775
5. Analysis of Data – Refer to Passive Acoustic Surveys – Analysis of Data. 1776 1777 Live Capture 1778
1. Objective – Obtain demographic information (e.g., sex, age, reproductive status, etc.) of 1779 bats using near ground (< 20 m) habitats (i.e., below the rotor sweep zone) that cannot be 1780 obtained through acoustic monitoring. 1781 1782
2. Rationale – Results should be used primarily in conjunction with other survey methods 1783 (e.g., active acoustic). This type of survey can be used to prioritize additional surveys, 1784 enhance efforts to positively identify species that are hard to identify through acoustic 1785 monitoring, and target areas that concentrate bat activity (e.g., foraging areas). For live 1786
42
capture survey recommendations that address broader objectives see Hester and Grenier 1787 (2005). 1788
1789 3. Equipment – A Chapter 33 Scientific Collection Permit is required by the Wyoming 1790
Game and Fish Department for live capture surveys. All individuals that will be handling 1791 bats should have their rabies prophylaxis. Mist nets and triple high mist nets are the most 1792 common equipment used for live capture of bats in Wyoming. The use of harp traps is 1793 more limited in Wyoming because of the high proportion of open landscapes. A more 1794 comprehensive discussion on additional equipment required for live captures can be 1795 found in Hester and Grenier (2005). 1796
1797 4. Application – Mist nets can be deployed successfully in almost any location where bats 1798
are expected to fly, and are highly effective for capturing bats at ground, sub-canopy, and 1799 canopy levels (i.e., below the rotor sweep zone). Identify productive sites by conducting 1800 acoustic surveys in advance. Capture success is usually highest near areas that 1801 concentrate use (e.g., water sources, foraging sites, and flyways [i.e., forest gaps, trails, 1802 and mountain ridges]). 1803
1804 Surveys should be performed between June 1 and August 30. Each netting site that is 1805 identified in the project area should be surveyed at least 3 times during the field season. 1806 Nets should be set up ½ hour prior to sunset and be open for at least 2½ hours. Bats 1807 should only be processed by experienced individuals to reduce potential injury to bats. 1808 Please refer to Hester and Grenier (2005) for handling, holding, and processing bats in 1809 Wyoming. 1810
1811 5. Analysis of Data –For each survey occasion report the total number of bats captured, sex 1812
ratio, age ratio, site description, date, time, location, beginning and ending weather 1813 conditions, moon phase, time nets open/closed. Report also the mean catch per unit 1814 effort (i.e., number of bats captured per unit of survey time) for each site. For each bat 1815 captured species, sex, age, time of capture, ear length, forearm length, weight, 1816 reproductive status, and body condition should be reported. 1817
1818 Carcass Search 1819
1. Objective – Identify and quantify bat species mortality after construction of turbines. 1820 1821 2. Rationale – The results of post-construction carcass searches are used to estimate 1822
mortality rates of bats at wind energy development sites. 1823 1824 3. Equipment – The WYBWG recommends searchers have their rabies prophylactic 1825
vaccination prior to conducting carcass searches to minimize risk associated with 1826 handling dead or wounded bats. A Chapter 33 Scientific Collection Permit is also 1827 required by the Wyoming Game and Fish Department for all personnel planning to 1828 collect bat carcasses. 1829
1830 4. Application – Carcass searches should be conducted weekly during two periods (Apr 15 1831
– Jun 15) and (Aug 1 – Sept 30). More intensive carcass searches may be conducted if 1832

43
necessary. We recommend that a subset of carcasses collected be submitted to the 1833 Wyoming Game and Fish Department as voucher specimens. Remaining carcasses (that 1834 likely remain attractive to scavengers) should be used to determine searcher efficiency 1835 and disappearance rates (Kerns 2005, Arnett et al. 2008). Carcass searches should be 1836 conducted in a robust method and estimates should correct for disappearance rates and 1837 searcher efficiency (Arnett et al. 2009, Baerwald et al. 2009). 1838
1839 5. Analysis of Data – Report age, sex, species, total number of killed and wounded bats 1840
found, and an estimate of bat mortality (Arnett et al. 2009, Baerwald et al. 2009). 1841 Reporting procedures for the Wyoming Game and Fish Department Chapter 33 Scientific 1842 Collection Permits must also be followed. 1843

44
Table 1: The following matrix was developed by the Wyoming Bat Working Group to facilitate survey selection for bats 1844 within proposed wind project sites. The matrix recommends pre- and post-construction survey methods and identifies relevant 1845 actions (e.g., timing, permits, etc.) for conducting surveys in Wyoming. 1846 1847
Recommended Pre-Construction Survey Methods Survey Type Objectives Timing Permits1 Training Comments
Habitat Evaluation Quantify existing habitat.
Anytime None
Passive Acoustic Quantify bat activity in the rotor sweep area.
April 15 – October 15 None Call interpretation Provide copies of calls to WGFD/WYNDD2
Active Acoustic
/Lead Agency.
Supplemental information for live capture and passive acoustic.
June 1 – August 31 None Call interpretation Provide copies of calls to WGFD/WYNDD/Lead Agency.
Live Capture Collect demographic information on bats
June 1 – August 31 Chapter 33 Bat handling and identification.
Provide copies of calls to WGFD/WYNDD/Lead Agency.
Recommended Post-Construction Survey Methods Survey Type Objectives Timing Permits1 Training Comments
Habitat Evaluation Quantify changes in habitat
Anytime None
Passive Acoustic Quantify bat activity in the rotor sweep area
April 15 – October 15 None Call interpretation Provide copies of calls to WGFD/WYNDD/Lead Agency.
Carcass Search Quantify bat species that are being impacted.
April 15 – June15 Chapter 33 Provide some specimens
August 1 – September 30
1 - Some federal land management agencies require permits for performing surveys. Please coordinate with the appropriate agency to ensure regulatory 1848 compliance. 1849
2 Wyoming Natural Diversity Database

45
Passerines and Raptors 1850 1851 Each proposed wind energy project is site-specific with local differences in avian species 1852 present, season and type of use, habitat, topography, weather patterns, and site development 1853 potential. Appropriate site selection for wind energy development is key in preventing negative 1854 impacts to birds. In addition, planning a wildlife-friendly wind energy development can lower 1855 long-term costs and potential liabilities under Federal wildlife protection laws, such as the 1856 Migratory Bird Treaty Act, the Bald and Golden Eagle Protection Act, and the Endangered 1857 Species Act. Therefore, detailed planning and survey efforts prior to construction will identify 1858 problems that may occur, how to circumvent these problems, how to mitigate problems that 1859 cannot be avoided, and identify sites that are unsuitable for development. We encourage 1860 developers to meet as soon as possible with the USFWS to get their input relating to potential 1861 impacts to migratory birds and raptors. 1862 1863 We recommend the following monitoring recommendations for pre-, during, and post-1864 construction should be implemented when wind energy projects are proposed for or occur in 1865 areas occupied by breeding, foraging, and migrating birds, especially Species of Greatest 1866 Conservation Need. These should serve as a starting point until the Wyoming Partners In Flight 1867 Bird Conservation Plan update has been completed, which will include a more comprehensive 1868 set of best management practices and recommendations for siting, monitoring, mitigation, and 1869 research to minimize the impacts of wind energy development on birds. 1870
1871 In general, we recommend surveys be conducted for a minimum of 2 years prior to construction 1872 and a minimum of 3 years post-construction to be consistent with recommendations for other 1873 wildlife species (i.e., bats, sage-grouse and big game). 1874 1875
1. Perform a risk assessment reconnaissance survey that includes a review of existing 1876 wildlife databases, maps, literature, reports, and aerial photographs, as well as discussions 1877 with wildlife experts, to determine concerns and potential conflicts with birds occurring 1878 in the proposed development area. Results may indicate that certain sites are unsuitable 1879 for wind energy or that the size of the project may need to be scaled back. 1880
2. Until a sufficient body of scientific research is developed nationwide to determine 1881 acceptable certainty regarding the level of disturbance or displacement of birds due to 1882 wind energy developments in general, wind project proponents are expected to 1883 implement appropriate monitoring to help answer this question on a case-by-case basis in 1884 Wyoming. 1885
3. We recommend conducting pre-construction surveys within the project area and within 1 1886 mile of the project boundary using the techniques described below. Data should 1887 document the species and number of birds observed, their movements and distribution, 1888 the proportion of birds occurring within the rotor sweep area, and altitude and orientation 1889 of flight during various weather conditions. 1890 1891
Point Counts 1892 a) Conduct spring and autumn point- count surveys to detect resident and migrant 1893
passerines, and other localized birds. Fixed-radius point count surveys (Reynolds 1894 et al. 1980) should be conducted weekly over a 12-week period in spring and 1895

46
again in fall in order to detect early, mid, and late migrants. Point count surveys 1896 should begin in April to late June (depending on location and elevation) to detect 1897 breeding songbirds. Points should be randomly distributed across the proposal 1898 area or strategically placed to assess data at turbine locations (depending on the 1899 proposed development design). A sufficient number of points should be 1900 incorporated in the design to enable statistical power in the analyses. Surveys 1901 should begin ½ hour before official sunrise and end approximately 4 to 5 hours 1902 after official sunrise (USGS 1998) for breeding birds; and occur at other times 1903 during the day for other birds. UTM coordinates of the count site, number of 1904 birds detected, time, and species should be recorded. Surveys should be 1905 conducted for 20 minutes at each point to optimize surveying time and number of 1906 stations (points) in the survey (Reynolds et al. 1980). Sufficient distance between 1907 point count stations should be considered to avoid duplication of counts 1908 (Alldredge et al. 2006, Buckland et al. 2009). 1909
b) Winter surveys- A minimum of 2 surveys should be conducted per season: early 1910 winter from 1 December – 15 January and late winter from 16 January – 28 1911 February. Follow point count protocol. Species, number of birds detected, time, 1912 primary habitat, and UTM coordinates of each sighting should be recorded. 1913
c) Depending upon survey results, additional surveys for sensitive avian species (e.g. 1914 SGCN) present within sensitive habitats (e.g. wetlands, riparian areas) may be 1915 suggested. Survey methodology will depend on the species present. 1916 1917
Raptors 1918 a) We recommend one day-long survey for raptors should occur each week during 1919
both the spring and autumn 12-week period of bird point counts. UTM 1920 coordinates of the count site, location relative to the project, number of birds 1921 detected, sex and age class (if possible), time, species, behavior, altitude, flight 1922 direction, and primary habitat should be recorded. Any observations of large 1923 flocks of non-raptors (waterfowl, shorebirds, swallows, cranes, etc.) should also 1924 be recorded. 1925
b) We recommend area search surveys occur during the breeding season to locate 1926 raptor nests. Surveys to locate raptor nest structures within suitable habitat (trees, 1927 rock outcrops, hillsides, etc.) can be conducted either aerially in a low-flying 1928 fixed-wing aircraft or helicopter, or on foot along transects that are no more that 1929 ½ mile apart (depending on topography and physical features) or by driving along 1930 public roads and accessible private roads that are within 1.0 miles of the project 1931 area. In general, the method used will depend on the size and accessibility of the 1932 proposed project site. However, if ground surveys cannot provide comprehensive 1933 coverage and accurate locations of nests within the project area, aerial surveys 1934 should be implemented. UTM coordinates, nesting substrate, status (occupied, 1935 unoccupied, incubating adult, young in the nest), and primary habitat should be 1936 recorded for each nest located. See the Table 2 for species-specific survey dates. 1937 1938
Carcass Search and Collection 1939 a) Conduct carcass collection surveys for the duration of post-construction 1940
monitoring; typically 3 years (appropriate state and federal permits are required 1941

47
for carcass salvage). The extent (e.g. sub-sample versus complete sample of 1942 developed area), frequency (e.g. daily, weekly, biweekly), and seasonality (e.g. 1943 migration, breeding season) should be determined prior to the initiation of the 1944 surveys and will be influenced by site-specific characteristics such as terrain and 1945 vegetation type, bird population levels, size of the development, and the level of 1946 impact the development has on birds in the area. All carcasses should be 1947 collected and identified. Annual fatality rates per MW or per turbine should be 1948 estimated. Actual fatality rates at wind turbines are incompletely observed and 1949 must be adjusted by at least these two factors: carcass removal by scavengers and 1950 searcher efficiency rates. Scavenger removal trials should be conducted at each 1951 site to determine the length of time it takes scavengers to find and remove 1952 carcasses. This rate can then be factored into statistical estimations of fatality 1953 rates to provide more accurate estimates (for protocols see Smallwood 2007). 1954
b) Searcher efficiency trials should be conducted at each site to account for 1955 differences in vegetation and individual detection rates. This rate can then be 1956 factored into statistical estimations of fatality rates to provide more accurate 1957 estimates (for protocols see Kunz et al. 2007). 1958
1959 Table 2: Diurnal Raptor Survey Dates (2a) and Disturbance Free Dates (2b) 1960 1961
Species March April May June July August
1 15 31 1 15 30 1 15 31 1 15 30 1 15 31 1 15 30 American Kestrel X X X Bald Eagle Cooper’s Hawk X X X X X X X X X Ferruginous Hawk Golden Eagle
Merlin Northern Goshawk Northern Harrier Osprey Peregrine Falcon Prairie Falcon Red-tailed Hawk Sharp-shinned Hawk Swainson’s Hawk
1962 Darkened block indicates best times to detect birds in courtship (early dates) or with young in the nest when adults will be 1963 conspicuous (later dates). For accipters, Merlins, and Peregrine Falcons, detectability during courtship is variable, with some pairs 1964 almost impossible to detect. 1965 ……….. : Indicates periods for species with conspicuous nests during which surveys can also be conducted effectively. 1966 Note: Dates may vary slightly by latitude, altitude or other factors affecting phonology and should be adjusted depending on field 1967 conditions. 1968

48
Table 2b: continued 1969 WGFD DISTURBANCE-FREE DATES AND BUFFERS FOR RAPTORS
SPECIES DISTURBANCE-FREE DATES DISTURBANCE-FREE BUFFER Bald Eagle February 15 – August 15 ½ mile Ferruginous Hawk March 1 – July 31 1 mile Golden Eagle January 15 – July 31 ½ mile Merlin April 1 – August 15 ½ mile Northern Goshawk April 1 – August 15 ½ mile Peregrine Falcon March 15 – August 15 ½ mile Prairie Falcon March 1 – August 15 ½ mile 1970 Note: Disturbance‐free dates include territory establishment through fledging. 1971 Note: Additional considerations include line of sight, visibility, type of disturbance activity, location of disturbance above or below 1972 the occupied nest, and specific situations. 1973
1974 Sage-Grouse 1975
1976 The WGFD has provided the WGFC with a summary of the current understanding of potential 1977 impacts of wind development on sage-grouse. While much additional research needs to be 1978 conducted, the WGFD has concluded that the best information currently available indicates a risk 1979 of significant population level impacts to sage-grouse if wind development occurs in a sage-1980 grouse core area. In addition, the U.S. Fish and Wildlife Service has notified the WGFD (letter 1981 dated July 7, 2009 from Brian Kelly to Director Ferrell), that “constructing wind farms in core 1982 areas, even for research purposes, prior to demonstrating that it can be done with no impact to 1983 sage-grouse, negates the usefulness of the core area concept as a conservation strategy and brings 1984 into question whether adequate regulatory mechanisms are in place to protect the species.” 1985 Having regulatory mechanisms is a key factor used by the USFWS in determining whether a 1986 species should be listed as endangered or threatened. The WGFD interprets the USFWS letter as 1987 a clear signal that state authorization of wind development in a sage-grouse core area, without 1988 clear demonstration from the project proponent that the activity will not cause a decline in sage-1989 grouse populations, leaves the state in a precarious position to demonstrate that adequate 1990 regulatory mechanisms are in place to conserve sage-grouse. 1991 1992 Based on our current understanding of potential conflicts between sage-grouse and wind 1993 development, the WGFC directed the WGFD to recommend to the WISC that no wind turbines 1994 be constructed in sage-grouse core area without clear demonstration from the project proponent 1995 that the activity will not cause a decline in sage-grouse populations. W.S. 35-12-110(c) allows 1996 WGFD to recommend appropriate conditions that might be included in the Industrial Siting 1997 Permit. The WGFC has directed the WGFD to continue to explore, through research outside of 1998 sage-grouse core areas, what impacts will occur to sage-grouse from wind energy development. 1999 That research may result in future revisions to these recommendations and WGFC policies. 2000 2001 The following recommendations for wind development projects in regard to sage-grouse baseline 2002 data collection and monitoring should occur assuming a multi-state industry supported research 2003 program is operational to determine sage-grouse response and population performance to wind 2004 development. If the research program is not operational additional research actions will be 2005 recommended for individual projects. Research response variables should include population 2006

49
and habitat parameters such as nesting success, chick survival, lek attendance, and any changes 2007 in distribution, movements, and habitat use. 2008
2009 For projects that will occur outside a sage-grouse core area we recommend the following 2010 monitoring protocol: 2011
2012 • Conduct lek counts (using WGFD protocol) within a 2 mile buffer of the proposed 2013
project area boundary. 2014 • Map habitat within a 2 mile buffer area of the project boundary. 2015 • Compare lek counts with a suitable nearby reference area. 2016 • We recommend 2 years pre-construction data collection followed by 3 years post 2017
construction with annual review thereafter as determined by the assigned Technical 2018 Advisory Committee (TAC). 2019 2020
Big Game 2021 2022
The following baseline data and monitoring recommendations for wind development projects in 2023 regard to big game should occur assuming a multi-state industry supported research program is 2024 developed that measures big game responses to wind development. If the research program is 2025 not operational additional research actions will be recommended. Research response variables 2026 should include population and habitat parameters such as fawning/calving rates, neonate 2027 survival, and any changes in distribution, movements, and habitat use. 2028
2029 If the project occurs on lands designated as crucial winter range, identified parturition areas, or 2030 will bisect known migration corridors, we recommend the following to provide baseline data and 2031 post-development data that will help identify any associated impacts and provide for future 2032 mitigation options for affected big game species: 2033
2034 • Radio collar a representative sample (to be determined in coordination with WGFD) of 2035
the female portion of the affected herd(s). 2036 • Collect telemetry relocation data 2 years prior to development and 3 years post 2037
development to determine habitat use, identify migration corridors, and identify changes 2038 in habitat use and population demographics. 2039
• Collect and compare these parameters on a suitable nearby reference area. 2040 2041
These data should be collected, analyzed, and provided in an annual report to WGFD. At the end 2042 of three years, if it is determined that significant avoidance of important habitats is occurring or 2043 population parameters are being negatively affected by the wind energy development, a 2044 mitigation plan should be developed in collaboration with WGFD to compensate for that impact. 2045 2046 Amphibians 2047
2048 In general, we recommend baseline monitoring be accomplished through incidental observations 2049 while performing other wildlife surveys. Incidental observations will allow for trend data, which 2050 could elucidate possible shifts in species assemblages resulting from energy development. In 2051 addition to generalized incidental monitoring, surveys may be recommended on specific SGCN. 2052

50
SGCNs include the following species: boreal toad, Wyoming toad, wood frog, Columbia spotted 2053 frog, Great Basin spadefoot, plains spadefoot and northern leopard frog. Additional information 2054 on these species can be found in Table 3. 2055 2056 If no SGCN is known to occur within or near a wind development project, we recommend that 2057 incidental observations be recorded for amphibian species. All amphibians encountered 2058 incidentally during wildlife surveys should be documented. Species, geographic coordinates 2059 (preferably decimal degrees or UTM), date, age class (adult, juvenile, larval, or egg), general 2060 vegetation type, and general comments are requested for each observation. Observations will be 2061 collected while performing other wildlife surveys within the study area. We recommend that 2 2062 years of preconstruction monitoring and 3 years post construction monitoring be completed. A 2063 two year preconstruction time frame helps ensure that surveys can be conducted in a wide range 2064 of environmental conditions. Many species that are rare or cryptic may easily be overlooked 2065 with only one year of survey. If a SGCN is discovered during the incidental observations 2066 additional monitoring may be recommended (Figure 1). 2067
2068 Species of Greatest Conservation Need (SGCN) 2069 2070 If a SGCN is known to occur or has the potential to occur within or near a wind 2071 development project, additional monitoring is recommended (Figure 1). 2072 2073
• The monitoring of SGCNs starts with creating habitat maps for a wind development 2074 project. In conjunction with mapping terrestrial habitats, the following water features 2075 will also be mapped: ephemeral drainages, perennial waters, vernal pools and playas. 2076 2077
• If amphibian habitat is not found during mapping, no additional monitoring will be 2078 needed. However, incidental monitoring is recommended. 2079 2080
• However, if SGCN amphibian habitat is found, we recommend the project developer 2081 contact the Department to discuss if the project can be designed so that amphibian habitat 2082 can be avoided. To protect SGCN amphibian habitat, the Department recommends a 500 2083 meter buffer. This buffer was designed to incorporate SGCN average home range and 2084 migration distances (Hammerson 1999, Ernst and Ernst 2003, Werner et al. 2004, Lannoo 2085 2005, Parker and Anderson 2007). If the project is designed such that habitat disturbance 2086 is located greater than 500 meters from water features, including ephemeral drainages, 2087 perennial waters, vernal pools and playas additional monitoring will not be needed. 2088 However, incidental monitoring is recommended. 2089 2090
• If SGCN amphibian habitat cannot be avoided, the project developer and the Department 2091 will determine the type and level of additional amphibian monitoring needed. 2092 2093
• Because of breeding chronology and the secretive nature of some species, two years of 2094 survey are recommended before development begins. During predevelopment surveys, 2095 important amphibian areas (such as breeding sites) should be designated for avoidance 2096 during construction. Surveys should be conducted at least three years post-construction to 2097 determine possible effects of development on amphibian species. 2098
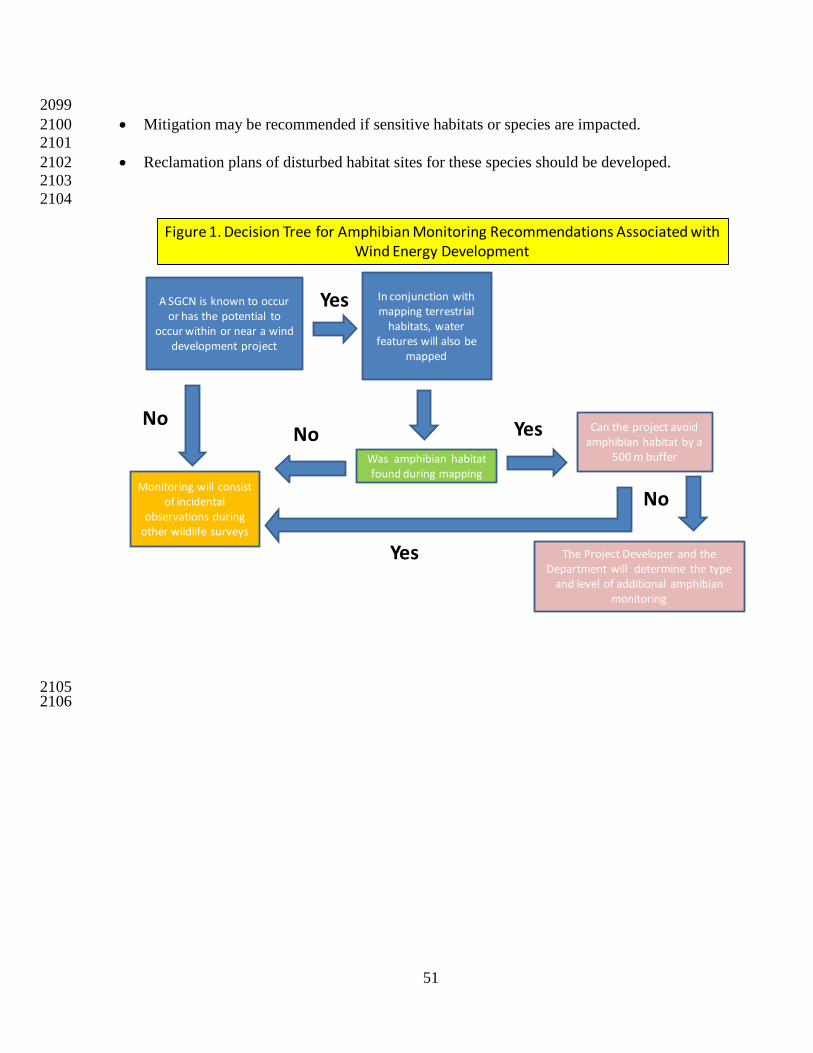
51
2099 • Mitigation may be recommended if sensitive habitats or species are impacted. 2100
2101 • Reclamation plans of disturbed habitat sites for these species should be developed. 2102 2103 2104
A SGCN is known to occur or has the potential to
occur within or near a wind development project
Figure 1. Decision Tree for Amphibian Monitoring Recommendations Associated with Wind Energy Development
In conjunction with mapping terrestrial
habitats, water features will also be
mapped
Yes
No
Was amphibian habitat found during mapping
Can the project avoid amphibian habitat by a
500 m buffer
Monitoring will consist of incidental
observations during other wildlife surveys
The Project Developer and the Department will determine the type
and level of additional amphibian monitoring
No Yes
Yes
No
2105 2106

52
Reptiles 2107 2108
If no SGCN is known to occur within or near a wind development project, we recommend that 2109 incidental observations be recorded for reptile species. All reptiles encountered incidentally 2110 during wildlife surveys should be documented. Species, geographic coordinates (preferably 2111 decimal degrees or UTM), date, age class (adult, or juvenile), general vegetation type, and 2112 general comments are requested for each observation. Observations will be collected while 2113 performing other wildlife surveys within the study area. We recommend that 2 years of 2114 preconstruction monitoring and 3 years post construction monitoring be completed. A two year 2115 preconstruction time frame helps ensure that surveys can be conducted in a wide range of 2116 environmental conditions. Many species that are rare or cryptic may easily be overlooked with 2117 only one year of survey. If a SGCN is discovered during the incidental observations additional 2118 monitoring may be recommended (Figure 2.) 2119 2120 There are three reptile SGCN; midget faded rattlesnake, northern tree lizard, and Great Basin 2121 gophersnake. All three species occur in southwest Wyoming. Additional information on these 2122 species can be found in Table 3. If a wind project is located in habitat that is known to have 2123 these species or has the potential to occur within or near the project, additional monitoring is 2124 recommended. 2125
2126 • If reptile habitat, hibernacula and potential hibernacula habitat is not found during two 2127
years of preconstruction monitoring, no additional monitoring will be needed. However, 2128 incidental monitoring is recommended. 2129 2130
• However, if SGCN reptile habitat is found, we recommend the project developer contact 2131 the Department to discuss if the project can be designed so that reptile habitat can be 2132 avoided. To protect SGCN reptile habitat, hibernacula and potential hibernacula habitat, 2133 the Department recommends a 500 meter buffer. This buffer was designed to 2134 incorporate SGCN average home range and migration distances (Ernst and Ernst 2003, 2135 Hammerson 1999, Lannoo 2005, Parker and Anderson 2007, Werner et al. 2004). If the 2136 project is designed such that habitat disturbance is located greater than 500 meters from 2137 hibernacula or potential hibernacula habitat additional monitoring will not be needed. 2138 However, incidental monitoring is recommended. 2139 2140
• If SGCN reptile habitat, hibernacula and potential hibernacula habitat cannot be avoided, 2141 an additional three years post construction monitoring is recommended. 2142 2143
• Mitigation may be recommended if sensitive habitats or species are impacted. 2144 2145
2146 2147

53
Midget Faded Rattlesnake, Great Basin Gophersnake, and Northern Tree Lizard 2148 Survey Protocol - Design of Survey 2149
2150 1. We recommend that before a survey is done, that the survey team spend a day with 2151
Wyoming Game and Fish personnel to ensure that the survey method is being used 2152 correctly. 2153 2154
2. Delineate rock outcroppings with a Southern aspect (SE, S, SW or 120o- 240o) using 2155 aerial photography, Google Earth, or other available GIS data layers within the proposed 2156 project area. Any rock outcropping above 7,500 feet or with a Northern aspect may be 2157 excluded from the survey design. Although hibernacula for these species are historically 2158 observed below 7,000 feet, it would be prudent to search slightly higher elevations to 2159 ensure the absence of midget faded rattlesnake, Great Basin gophersnake, or northern tree 2160 lizard populations. The proposed elevation would help prevent the possible exclusion of 2161 males migrating away from hibernacula during summer months, or other fringe 2162 hibernacula. 2163 2164
3. A total of three surveys should be performed from late spring through early fall (mid May 2165 through mid September) on delineated rock outcroppings. Surveys can only be 2166 performed when daytime temperatures exceed 55oF for a week or more. At least two 2167 surveys should be conducted between July 15th and September 15th. Surveys may be 2168 performed in spring and fall months at any time during the day. However, during 2169 summer months when daytime temperatures exceed 85oF, surveys should be limited to 2170 morning and early afternoon time periods (8:30AM to 1:00PM). 2171 2172
4. Each delineated rock outcropping should be surveyed for a total of 1 man-hour per km2 2173 of suitable habitat (i.e. One person should survey suitable habitat for 1 hour, while two 2174 people could survey the same area for 30 minutes). For midget faded rattlesnakes, it is 2175 recommended that surveyors wear protective gear or clothing while conducting surveys 2176 to maintain safety. This could include any one of the following items: snake boots, snake 2177 gaiters, or snake chaps. When climbing rocks, surveyors should also verify that all 2178 handholds snake free. Observers should listen closely for snakes rattling while 2179 conducting the survey. Some snakes will not be easily observable, and may give their 2180 locations away by this behavior. Effort should be made to avoid flipping rocks. This 2181 activity could alter reptile habitat. Surveyors are recommended to inspect crevices, 2182 fissures, and overhangs within rock outcrops. All herpetafauna found during the course 2183 of a survey should be noted on observational datasheets and photographed. 2184 2185 Upon observation of a reptile or identifiable shed skin, the surveyor should fill out the 2186 correct datasheet and collect a photo voucher of the specimen. A GPS point (UTM NAD 2187 83 zone12) should be taken at the observed location. Effort should be made to not 2188 disturb the observed reptile. 2189 2190

Page 54
A SGCN is known to occur or has the potential to
occur within or near a wind development project
Figure 2. Decision Tree for Reptile Monitoring Recommendations Associated with Wind Energy Development
The Project Developer will conduct surveys
and map habitat, particularly potential
hibernacula
Yes
NoWas hibernacula or potential hibernacula habitat found during
surveys?
Can the project avoid known or potential
hibernacula habitat by a 500m buffer
Monitoring will consist of incidental
observations during other wildlife surveys
The Project Developer will continue reptile monitoring three years post
construction
No Yes
Yes
No
2191
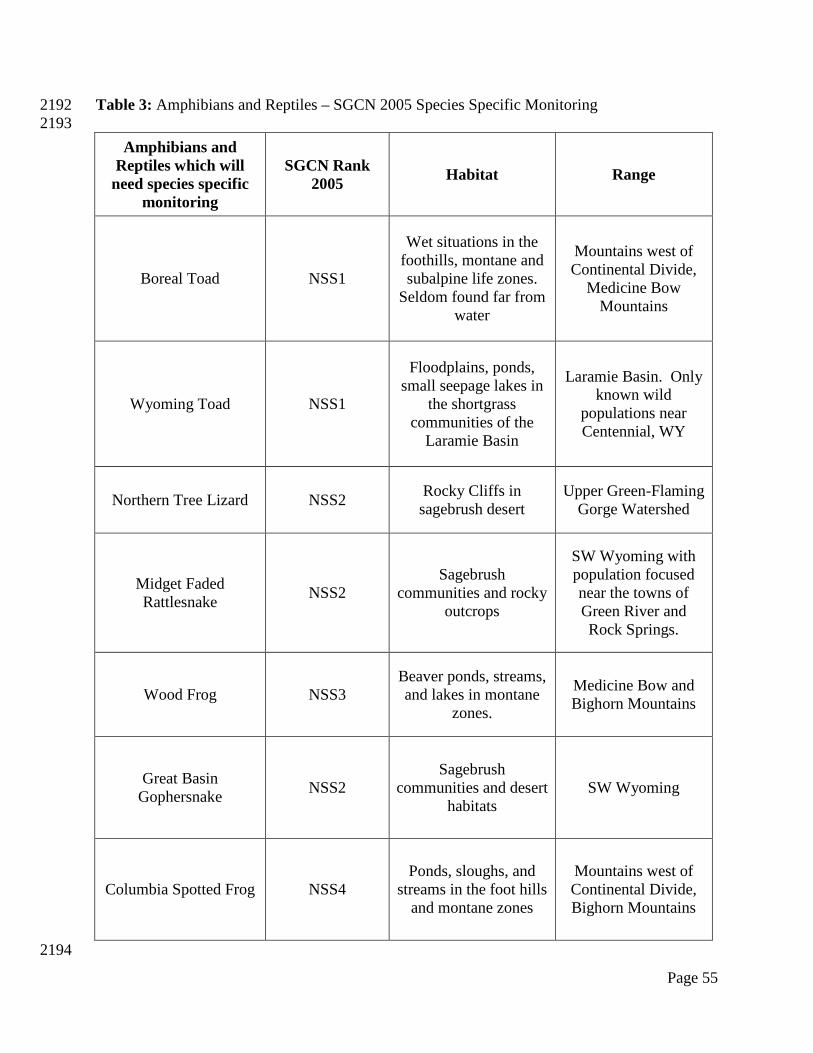
Page 55
Table 3: Amphibians and Reptiles – SGCN 2005 Species Specific Monitoring 2192 2193
Amphibians and Reptiles which will
need species specific monitoring
SGCN Rank 2005 Habitat Range
Boreal Toad NSS1
Wet situations in the foothills, montane and subalpine life zones.
Seldom found far from water
Mountains west of Continental Divide,
Medicine Bow Mountains
Wyoming Toad NSS1
Floodplains, ponds, small seepage lakes in
the shortgrass communities of the
Laramie Basin
Laramie Basin. Only known wild
populations near Centennial, WY
Northern Tree Lizard NSS2 Rocky Cliffs in sagebrush desert
Upper Green-Flaming Gorge Watershed
Midget Faded Rattlesnake NSS2
Sagebrush communities and rocky
outcrops
SW Wyoming with population focused near the towns of Green River and Rock Springs.
Wood Frog NSS3 Beaver ponds, streams, and lakes in montane
zones.
Medicine Bow and Bighorn Mountains
Great Basin Gophersnake NSS2
Sagebrush communities and desert
habitats SW Wyoming
Columbia Spotted Frog NSS4 Ponds, sloughs, and
streams in the foot hills and montane zones
Mountains west of Continental Divide, Bighorn Mountains
2194

Page 56
Table 3: Continued 2195 2196
Amphibians and Reptiles which will
need species specific monitoring
SGCN Rank 2005 Habitat Range
Great Basin Spadefoot NSS4
Sagebrush communities mostly in
the Wyoming Basin and Green River Valley
Low elevations mainly west of
Continental Divide
Plains Spadefoot NSS4 Grasslands and
sagebrush communities in the plains zones
Low elevations mainly east of
Continental Divide
Ornate Box Turtle NSS4 Sandy open grasslands Along Lower North
Platte adjacent to Nebraska
Northern Leopard Frog NSS4
Permanent water in the plains, foothills, and
montane zones. Prefers marshes and
beaver ponds.
Statewide
* All species are considered SGCN. Species Information from Baxter and Stone 1985.
2197

Page 57
Aquatics 2198 2199
The WGFD recognizes that proposed wind projects will differ in their potential for impacting 2200 stream channels and aquatic species. A one-size-fits-all approach to aquatic and geomorphology 2201 impact avoidance or monitoring would not adequately address the variability of each project or 2202 its location. Impact potential depends on elevation, aspect, slope, project size, soil type, 2203 vegetative cover, road density, distance from ephemeral or permanent water sources, and the 2204 presence of other (non-wind energy related) soil perturbations in the watershed. The approach 2205 described below is recommended to help wind development proponents identify the potential for 2206 sediment impacts to aquatic habitats, address that potential during project development, and 2207 monitor for impacts in cases where aquatic resources may be in jeopardy. Based on site-specific 2208 conditions the monitoring of culverts, roads with 5% slope or greater and geomorphological 2209 studies of waterways may be recommended. 2210 2211 The purpose of monitoring culverts and roads with 5% or greater slope is to determine the 2212 presence, absence and/or extent of cumulative impacts resulting from changes to the upland 2213 surface hydrology, erosion and deposition, to ensure that culverts are functioning as designed 2214 and are being maintained and to ensure that the long-term BMPs that were installed are still 2215 functioning and are being maintained. 2216 2217 The purpose of geomorphological monitoring activities is to determine the presence, absence 2218 and/or extent of cumulative impacts resulting from changes to upland surface hydrology, erosion 2219 and deposition and the potential for impacting habitats important to fish, macroinvertebrates, 2220 reptiles and amphibians. The geomorphological monitoring WGFD is recommending follows the 2221 Watershed Assessment of River Stability and Sediment Supply (WARSSS) methodology 2222 outlined in Rosgen (2006). The following descriptions of the WARSSS methodology are quotes 2223 from Rosgen (2006) and are provided here as background information: 2224 2225 Watershed Assessment of River Stability and Sediment Supply (WARSSS) is a geomorphology-2226 based procedure for quantifying the effects of land uses on sediment relations and channel 2227 stability (Pg. 1-1). 2228
2229 WARSSS identifies the hillslope, hydrologic and channel processes responsible for significant 2230 changes in erosion, sedimentation and related stream channel instability. It uses a three-phase 2231 assessment process to quickly separate areas into low-, moderate- and high-risk landscapes and / 2232 or river reaches (Pg. 1-2). 2233
2234 The results of the WARSSS assessment reveal significant, adverse influences of land uses on 2235 stream channel stability, sediment sources and sediment yield that may affect the material 2236 beneficial uses of rivers and streams. WARSSS data can be used for watershed planning, “clean 2237 sediment” Total Maximum Daily Load (TMDL) assessments for non-point source pollution and 2238 stability analysis for river restoration (Pg. 1-2). 2239
2240 The Reconnaissance Level Assessment (RLA) is the first and most general phase of the three 2241 WARSSS assessment phases. It provides a broad overview of the landscape while focusing on 2242

Page 58
processes that may affect sediment supply and channel stability (Pg. 3-1). Performing a 2243 Reconnaissance Level Assessment (RLA) requires one to a few office days. 2244
2245 Sensitive landscapes, potentially unstable stream systems and sediment-generating land use 2246 activities need to be identified, prioritized and evaluated for potential impacts at a level of detail 2247 beyond the initial RLA analysis. The Rapid Resource Inventory for Sediment and Stability 2248 Consequence (RRISSC) provides this finer level of analysis (Pg. 4-1). Performing the Rapid 2249 Resource Inventory for Sediment and Stability Consequence requires about 1 week depending on 2250 data availability. 2251
2252 The Prediction Level Assessment (PLA), the most detailed level of the WARSSS methodology, 2253 is reserved for sub-watersheds and river reaches previously identified as being at high risk for 2254 sediment and / or river stability problems. The PLA compares direction, rate, nature and extent 2255 of departure of existing sediment and channel stability to a reference condition typical of stable, 2256 natural land and stream conditions (Pg. 5-1). Performing a PLA, would require at least 4 2257 sampling occasions/reaches (before/after project implementation, upstream/downstream of 2258 project area). 2259 2260 A Rosgen Level II assessment consists of a morphological description of stream channel 2261 conditions at a reach. A Level III is synonymous with the PLA and includes all the aspects of a 2262 Level II assessment plus assessments of river stability, bank erosion, sediment competence, and 2263 sediment transport capacity. 2264 2265 Recommended Approach 2266 To identify and avoid impacts to aquatic resources, a multiphase approach is recommended 2267 (Figure 3). The approach includes varying levels of effort and assurance of impact avoidance 2268 depending on the apparent risk to aquatic habitats. 2269 2270 As indicated in Figure 3, very minimal effort is recommended if the wind project is proposed 2271 within an existing heavily developed area (e.g. an existing oil or gas field), is located within a 2272 closed basin (i.e. water cannot reach a perennial water body), or if sediment catchments exist on 2273 the ephemeral drainage(s) such that sediment could never reach a permanent water course, or the 2274 project developer and the Department agree that no impacts to a fisheries will occur. In these 2275 cases, WGFD recommends simply a pre-construction onsite visit followed by yearly onsite visits 2276 (Figure 3). The purpose of the yearly onsite visits is to ensure that the BMPs, as outlined in the 2277 Storm Water Prevention Plan, are working as designed. If problem/s are occurring, WGFD will 2278 provide recommendations to fix the problem/s. If the problem/s is not fixed in a timely manner, 2279 WGFD may recommend additional monitoring be conducted. Such yearly site visits are 2280 recommended for all wind energy developments. 2281

Page 59
Does the project occur in a heavily developed area, or a closed basin, or do sediment catch‐
basins exist or does WGFD agree that no impacts to fisheries will occur?
Figure 3. Decision Tree for WGFD Aquatic Monitoring RecommendationsThis decision tree will be used to develop wind energy recommendations to the ISC . The suggested assessments Reconnaissance Level Assesment (RLA)
and Rapid Resource Inventory for Sediment and Stability Consequence (RRISC) and monitoring approaches are from Rosgen, D. 2006, Watershed Assessment of River Stability and Sediment Supply (WARSSS).
Project developer conducts a standardized assessment of project risks to aquatic habitats
(Reconnaissance Level Assessment [RLA] or other standardized method)
No
Yes
Conduct a more detailed assessment of the project’s disturbance and potentially unstable stream reaches, sediment yield and transport
potential such as the Rapid Resource Inventory for Sediment and Stability Consequence
(RRISSC).
Monitoring will consist of a preconstruction site visit and yearly
onsite visits
If the detailed assessment indicates aquatic habitat may experience sediment or runoff changes due to the project, there is a high probability that additional monitoring depending on site‐specific conditions will be recommended. This could entail a Rosgen II station with repeated measures, a Rosgen II station
plus a reference station with repeated measures, or multiple Rosgen II stations. Where the affected water is a blue or red ribbon trout stream or
contains an SGCN species (Table 4), it is more likely multiple Rosgen II stations with repeated measures will be recommended.
Assessment or project refinement indicate aquatic habitats are at low risk.
Assessment indicate aquatic habitats are at risk.
Detailed assessment or project refinement indicate aquatic habitats are at low risk to
change from sediment or runoff changes due to the project
Detailed assessment indicates aquatic habitats may experience sediment or runoff changes due
to the project
Monitoring will consist of a preconstruction site visit and yearly onsite visits
ANDculverts and roads will be monitored
2282

Page 60
• If the project proponent cannot demonstrate the proposed development is within an existing heavily developed area (e.g. an existing oil or gas field), is in a closed basin, or has substantial sediment basins, the WGFD recommends the project proponent conduct a standardized assessment to identify low, medium, and high risk landscapes and/or stream reaches (via a Reconnaissance Level Assessment [RLA] preferably or other standardized method to determine where critical areas exist down slope from a proposed project site (Figure 3).
• If the reconnaissance assessment indicates low risk to stream reaches or project refinements are implemented so that aquatic habitats are at low risk, monitoring will consist of a preconstruction site visit and yearly onsite visits (Figure 3). Examples of project refinements are: additional BMP’s that will prevent the movement of sediment into nearby waterways; avoidance/minimization measures, such as larger road offsets from channels; implementation of measures to mimic existing surface water runoff patterns; or site-specific engineering controls.
• If the assessment indicates aquatic habitats are at risk, we recommend a more detailed assessment of the project’s disturbance and potentially unstable stream reaches, sediment yield and transport potential such as the Rapid Resource Inventory for Sediment and Stability Consequence (RRISSC) be conducted (Figure 3).
• If the detailed assessment indicates low risk to change from sediment or runoff
changes due to the project or project refinements are implemented so that aquatic habitats are at low risk, monitoring will consist of a preconstruction site visit and yearly onsite visits (Figure 3). Examples of project refinements are: additional BMP’s that will prevent the movement of sediment into nearby waterways; avoidance/minimization measures, such as larger road offsets from channels; implementation of measures to mimic existing surface water runoff patterns; or site-specific engineering controls
• If the detailed assessment indicates that aquatic habitats may experience sediment or runoff changes due to the project, then monitoring will consist of a preconstruction site visit, yearly onsite visits and culverts and roads will be monitored (Figure 3). There is a high probability that additional monitoring depending on site-specific conditions will be recommended (Figure 3). This could entail a Rosgen II station with repeated measures, a Rosgen II station plus a reference station with repeated measures, or multiple Rosgen II stations. Where the affected water is a blue or red ribbon trout stream or contains an SGCN species (Table 4), it is more likely multiple Rosgen II stations with repeated measures will be recommended.

Page 61
Detailed Culvert, Road And Channel Monitoring Recommendations Culverts If a perennial stream is crossed as a result of a wind development project, stream crossings by roads should be adequately designed to allow fish passage at all flows. Crossing types in order of descending desirability to minimize aquatic impacts are a) bridge spans with abutments on banks, b) bridge spans with center support, c) open bottomed box culverts and d) round culverts with the bottom placed no less than one foot below the existing stream grade. Some level of monitoring may be recommended. The level of monitoring will be determined by what type of structure is used to cross the perennial stream. If the stream is crossed either with a properly designed bridge or bottomless culvert, monitoring will consist of a preconstruction onsite visit with yearly onsite visits. If a round culvert is used, we recommend that data from two Rosgen II stations (above and below culvert) be collected. Perched culverts block fish passage and in most cases are unacceptable in any stream that supports a fishery. A perched culvert may be acceptable and recommended by the Department to protect an upstream fishery population i.e. cutthroat trout population or native non-game population. The following are recommended references for the minimum guidelines for culvert sizing and placement: the BLM’s Gold Book or the Forest Service Handbook 7709.56b.
1. Collect GPS coordinates or other location specific information for each culvert
site 2. Collect pre-construction photographs of the planned culvert site; upstream and
downstream 3. Collect construction photographs of the planned culvert site following
construction phase roadway installation (temporary width) and following final roadway installation (permanent width).
4. Typical SWPPP monitoring and maintenance requirements will apply during construction phase of the project.
5. Collect post-construction photographs of the culvert site; upstream and downstream.
6. Following completion of final roadway and shoulder installation (permanent width), place a graduated fence post upstream and downstream of each culvert. The posts should have visible markings every 2” to provide a visual reference within each photograph. Fence posts should be placed within 50 feet of the culvert openings. Posts should be placed outside of the channel flow so they are not directly affected by storm flow events. Each fence post location will be referenced by GPS or other location specific information.
7. GPS or otherwise identify the site where photographs will be taken for the upstream and downstream view.
8. Following completion of final roadway and shoulder installation (permanent width), culverts and accompanying fence posts will be monitored/photographed a minimum two times a year (spring after snow melt and fall). We recommend that

Page 62
the fall monitoring occur before September 15, so there will be sufficient time to review the photographs and remedy any problems before winter. Additional monitoring is recommended after a summer rainfall event/s accumulating greater than ½ inch of precipitation in an hour as measured at the nearest National Weather Service Monitoring point (if within 10 miles of the site) or at the Facility operations and maintenance building.
9. Make photographs available for WGFD review within 30 days. 10. Monitoring will continue for two-years post SWPPP release, and will be re-
evaluated by Project Developer and WGFD for necessity following that period. 11. If monitoring shows that impacts are occurring, WGFD and the project developer
will meet to discuss what corrective actions need to be taken to remedy the cause of the impact. If impacts are still occurring, additional monitoring maybe recommended.
If the photographs reveal observable changes from erosion or deposition, consultation between WGFD and Project Developer will occur within 30 days after WGFD receives the photographs.
Roads with 5% or greater slope
1. Collect GPS coordinates or other location specific information for each 5% roadway slope monitoring point
2. Collect pre-construction photographs of each 5% roadway slope monitoring site; upstream and downstream
3. Collect construction photographs of each 5% roadway slope monitoring site following construction phase roadway installation (temporary width) and following final roadway installation (permanent width).
4. Typical SWPPP monitoring and maintenance requirements will apply during construction phase of the project.
5. Collect post-construction photographs of the 5% roadway slope monitoring site; upstream and downstream.
6. Following completion of final roadway and shoulder installation (permanent width), place a graduated fence post midway down the 5% roadway slope and at the bottom of the slope in the drainage ditch or shoulder on the side of the road if no drainage ditch is installed. If drainage ditches are installed on both sides of the road, graduated fence posts will be placed in both drainage ditches. The posts should have visible markings every 2” to provide a visual reference within each photograph. Posts should be placed outside of the main flow channel so they are not directly affected by storm flow events.
7. Each fence post location will be referenced by GPS or otherwise identified. 8. GPS or otherwise identify the site where photographs will be taken. 9. Following completion of final roadway and shoulder installation (permanent
width), fence posts will be monitored/photographed a minimum two times a year (spring after snow melt and fall). We recommend the fall monitoring occur before September 15, so there will be sufficient time to review the photographs and remedy any problems before winter. Additional monitoring is required after

Page 63
a summer rainfall event/s accumulating greater than ½ inch of precipitation in an hour as measured at the nearest National Weather Service Monitoring point (if within 10 miles of the site) or at the Facility operations and maintenance building.
10. Photographs will be made available for WGFD review within 30 days. 11. Monitoring will continue for two-years post SWPPP release, and will be re-
evaluated by Project Developer and WGFD for necessity following that period. 12. If monitoring shows that impacts are occurring, WGFD and the project developer
will meet to discuss what corrective actions need to be taken to remedy the cause of the impact. If impacts are still occurring, additional monitoring maybe recommended.
If the photographs reveal observable changes from erosion or deposition, consultation between WGFD and Project Developer will occur within 30 days after the WGFD receives the photographs. Channel Geomorphology
1) Perform the Reconnaissance Level Assessment (RLA) of the WARSSS methodology to identify sediment sources and existing channel stability problems.
2) For areas or reaches not excluded in step 1, perform the Rapid Resource Inventory for Sediment and Stability Consequence (RRISSC) to identify and clarify potential natural sediment and channel problem areas and to put potential project-related impacts in context.
3) Based on the results of the RLA and RRISSC, aquatic habitats will be identified either at low risk to change from sediment or runoff changes due to the project or aquatic habitats may experience sediment or runoff changes due to the project. At this stage, it is recommended the project proponent contact the Department to discuss the nature and extent of monitoring needed.
4) If the project will have a low risk to aquatic habitat, no additional monitoring will be recommend.
5) If the detailed assessment indicates aquatic habitats may experience sediment or runoff changes due to the project additional monitoring will be recommended. Monitoring will depend on site-specific conditions.
6) The lowest level of monitoring would entail completing a Rosgen Level II assessment at one reach downstream from the project area (or in an area potentially impacted by the project) and repeating measurements following a high flow/bankfull event or one year from the preconstruction survey. If impacts are indicated during the culverts and roads monitoring, repeating channel measurements may be recommended.
7) The next level of monitoring would entail establishing two Rosgen II stations. Data would be collected downstream from the project area and at one reference reach either upstream of the project area or from a reach having the same stream and valley type. Monitoring would consist of repeating measurements following a high flow/bankfull event or one year from the preconstruction survey and three years from the preconstruction survey.

Page 64
8) The highest level of monitoring would entail multiple Rosgen II stations. Data would be collected at various locations throughout the project area and at a minimum of one reference reach either upstream of the project area or from a reach having the same stream and valley type. Monitoring would consist of repeating measurements following a high flow/bankfull event or one year from the preconstruction survey and three years from the preconstruction survey.
9) Complete the various intermediate and summary worksheets associated with the Level II work to allow interpretation of project level impacts compared to natural or existing conditions.
10) If monitoring shows that impacts are occurring, WGFD and the project developer will meet to discuss what corrective actions need to be taken to remedy the cause of the impact. If impacts are still occurring, additional monitoring maybe recommended.
11) Field techniques should follow the guidelines outlined in: Harrelson, C.C., C.L. Rawlins and J.P. Potyondy (1994); in Chapter 2 of Rosgen (2008); and in Chapter 5 of Rosgen (1996).
12) All data including GPS locations of cross section pins, upstream and downstream locations, photographs, survey data, pebble count data, etc. should be made available to the WGFD Staff Aquatic Biologist, Environmental Protection Program, within six months.
Storm Water Prevention Plan And Wyoming Construction General Permit State and Federal laws require wind project developers to develop and submit a Storm Water Prevention Plan (SWPPP) to the Wyoming Department of Environmental Quality (WDEQ) that acts on behalf of the Environmental Protection Agency. The WGFD assumes each SWPPP will adequately address potential erosion issues and each project developer will institute permit stipulations to the best of their ability. However the SWPPP and Wyoming Construction General Permit may be modified to incorporate additional sediment and erosion monitoring. Such modifications could include WGFD monitoring recommendations. Please contact the Department of Environmental Quality for further information on modification of SWPPPs. Any additional monitoring recommended by WGFD is meant to assist wind project developers and the Department in determining the presence, absence and/or extent of cumulative impacts resulting from changes to upland surface hydrology, erosion, deposition and the potential for impacting habitats important to fish, reptiles, and amphibians. The SWPPP required by the Construction General Permit addresses erosion and sedimentation control during active construction and the immediate post-construction period when revegetation is occurring. The WGFD aquatic recommendations look at the cumulative impacts on a given area of one or more projects over a much longer time frame. Under the Construction General Permit, as soon as vegetation at a construction site reaches 70% of typical background cover, storm water permit coverage is done. The Construction General Permit does not address or allow for monitoring long-term, non-point source pollution. If the Department is interested in long-term sedimentation and its potential for influencing aquatic wildlife, the Construction General Permit will not be helpful and other monitoring would be needed (WDEQ Memo, August 11, 2009).

Page 65
Concerns have been expressed that channel and sediment monitoring under the WGFD aquatic recommendations duplicates Construction General Permit requirements. The monitoring required under the Construction General Permit only address the functionality of the erosion and sedimentation control best management practices at individual construction sites during the time of construction and revegetation. No downstream sampling for total suspended solids, turbidity or sediment accumulation is required. Theoretically, if all BMP’s function well, are properly designed and installed and are well maintained, little or no sediment should leave a construction site. However, BMP’s are only in place for a short time. Long-term monitoring addresses how the project, as designed, functions over time with respect to hydrology and sediment transport (WDEQ Memo, August 11, 2009). Table 4: SGCN Fish Species (2005)
Bluehead Sucker NSS1 Finescale Dace NSS1 Flannelmouth Sucker NSS1 Hornyhead Chub NSS1 Leatherside Chub NSS1 Pearl Dace NSS1 Roundtail Chub NSS1 Sturgeon Chub NSS1 Suckermouth Minnow NSS1 Western Silvery Minnow NSS1 Bonneville Cutthroat Trout NSS2 Burbot NSS2 Colorado River Cutthroat Trout NSS2 Goldeye NSS2 Kendall WS Dace NSS2 Orangethroat Darter NSS2 Plains Topminnow NSS2 Sauger NSS2 Shovelnose Sturgeon NSS2 Yellowstone Cutthroat Trout NSS2 Black Bullhead NSS3 Common Shiner NSS3 Flathead Chub NSS3 Lake Chub NSS3 Mountain Sucker NSS3 Plains Minnow NSS3

Page 66
RECLAMATION RECOMMENDATIONS
1. Erosion Control: Use best management practices to control erosion and prevent sediment from reaching nearby waterways.
2. Topsoil: Save topsoil removed for construction activities and spread over the
disturbed area as soon as possible after disturbance to accelerate natural and artificial re-vegetation.
3. Re-vegetation: Prompt reclamation is essential as this can help minimize
erosion issues and return lands to a useable condition for wildlife and livestock. We encourage private landowners to consider our reclamation recommendations on their property where it meets their operational management needs.
a. Carefully plan for establishing a complex of vegetation that reflects the
diversity of plant species and habitats in the surrounding area. b. Livestock grazing should be deferred until plants become established,
which is typically two growing seasons. c. We recommend using only native grass/forb species palatable to
wildlife. d. If hay or straw is used as mulch, it should be certified weed free. e. Monitoring reclamation for noxious and undesirable weeds should
occur during and after construction with subsequent control as needed. f. Avoid planting monocultures.
4. Accelerating Reclamation: Reclamation may be accelerated by the use of
locally derived cultivars and by mycorrhizal inoculations of shrubs and trees. In sagebrush habitat, prepare fire and weed control plans to protect both reclamation and adjacent sagebrush.
MITIGATION RECOMMENDATIONS
Current research is inadequate to determine the level of impact by wind energy development for most species of wildlife. A mitigation plan will be recommended outlining compensatory habitat conservation practices for offsetting wildlife losses in habitats defined as “vital” in the WGFC Mitigation Policy (focus management areas for SGCN species, big game crucial habitat, wetlands, and Blue Ribbon streams), if monitoring determines declines due to development in these habitats. Maps of these areas are available from WGFD.

Page 67
APPENDIX C ACRONYMS
APLIC ............................................Avian Powerline Interaction Committee BACI ..............................................Before-After Control-Impact BLM ...............................................Bureau of Land Management BMPs ..............................................Best Management Practices DOE ...............................................U.S. Department of Energy DOI ................................................Department of the Interior ESA ................................................Endangered Species Act FAC ................................................Federal Advisory Committee on Wind MWs ................................................Megawatts PLA ................................................Prediction Level Assessment RLA ................................................The Reconnaissance Level Assessment RRISSC ........................................... Rapid Resource Inventory for Sediment and Stability Consequence SGCN .............................................Species of Greatest Conservation Need SWPPP ............................................ Storm Water Prevention Plan TAC ................................................Technical Advisory Committee TMDL ............................................Total Maximum Daily Load WARSSS………………………… Watershed Assessment of River Stability and Sediment Supply WISC............................................... Wyoming Industrial Siting Council WDEQ.............................................Wyoming Department of Environmental Quality WGFC .............................................Wyoming Game and Fish Commission WGFD ............................................Wyoming Game and Fish Department WYBWG ........................................Wyoming Bat Working Group WYNDD ........................................Wyoming Natural Diversity Database