Wildfire - Home - Alberta Wilderness Association experienced in 2013, 2014, and 2015. In 2013, 1.87...
7
WLA | April 2016 | Vol. 24, No. 2 | FEATURES 4 By Ian Urquhart S lave Lake, Kelowna, Barriere, La Loche, now Fort McMurray. The wildfires that devastated lives in these communities testify to the likelihood, if not certainty, that we’ve crossed a thresh- old. The world of wildfire in twenty-first century Canada promises to be a very dif- ferent and more challenging world than it was a generation ago. Here’s a look at the presence of wildfire on the Canadian/ Albertan landscapes, explanations for this pattern, how government is addressing wildfire, and the hard choices we need to debate. Wildfire on the Landscape: More Now Than We Have Ever Seen Before Wildfires burn, on average, much more of Canada’s forests today than they did 40 to 60 years ago. In 2012 the 10-year running average of land burned by wildfires stood at just over two million hectares. As the University of Alberta’s Dr. Mike Flannigan told the CBC program Sunday Edition in 2013, this was twice the average amount of territory wildfires consumed in the ear- ly 1970s. Flannigan’s observation affirmed and extended the conclusion from research from the mid-1990s indicating that wildfire in the boreal forest in the 1980s and ear- ly 1990s burned significantly more of the land than was the case in the 1950s, 1960s, and early 1970s. Chart 1 illustrates this moving average is again on the upswing. Now at 2.65 million hectares this moving average has increased since 2012 due to the very active fire years we experienced in 2013, 2014, and 2015. In 2013, 1.87 million hectares of forests burned in Québec; in 2014, wildfire spread over 3.4 million hectares of the Northwest Territories; in 2015, 1.78 million hectares of Saskatchewan’s boreal forest went up in flames. Wildfire in Alberta is an important con- tributor to this story. The May 2016 Horse River/Fort McMurray Wildfire and very high to extreme fire danger forecasts across most of Alberta’s boreal forest in early to mid-May suggest that Alberta could lead Canada into its fourth active fire year in a row. “To have four in a row,” as Professor Flannigan told me, “there is no historical analogue that we have.” The recent history of forest land burned in Alberta generally mimics the Canadian pattern. A 1999 study prepared for Dai- showa-Marubeni observed that, in north- west Alberta, large fires already occurred more frequently and burned more territory there in the 1980-1995 period than they did in the 1960s and 1970s. Chart 2 pres- ents a provincial overview of the average territorial scope of wildfires over time. On average, three times as much of the land was burned by wildfire in the first decade of this century than was burned in the 1970s; in the first six years of the current decade the annual average of area burned stands at 301,331 hectares – nearly seven times the decadal average for the 1970s. What the decadal averages hide is the fact that annual area burned totals over the me- dium to long term generally resemble a roll- er coaster ride. There may be tremendous variation in area burned from year to year. Reviewing the past 45 years of Alberta’s fire history you will find years when hundreds of thousands of hectares burned; you will find other years which saw little wildfire on Wildfire: Nature, Government, Choice 0 0.5 1 1.5 2 2.5 3 3.5 4 Chart 1: Canada, Total Forest Land Burned, in Millions of Hectares, 10year averages from 197079 to 200615 Source: Averages calculated from Canada, Natural Resources Canada, National Forestry Database
Transcript of Wildfire - Home - Alberta Wilderness Association experienced in 2013, 2014, and 2015. In 2013, 1.87...

44 WLA | April 2016 | Vol. 24, No. 2 | FEATURES4
By Ian Urquhart
S lave Lake, Kelowna, Barriere, La
Loche, now Fort McMurray. The
wildfires that devastated lives in
these communities testify to the likelihood,
if not certainty, that we’ve crossed a thresh-
old. The world of wildfire in twenty-first
century Canada promises to be a very dif-
ferent and more challenging world than
it was a generation ago. Here’s a look at
the presence of wildfire on the Canadian/
Albertan landscapes, explanations for this
pattern, how government is addressing
wildfire, and the hard choices we need to
debate.
Wildfire on the Landscape: More Now Than We Have Ever Seen Before
Wildfires burn, on average, much more of
Canada’s forests today than they did 40 to
60 years ago. In 2012 the 10-year running
average of land burned by wildfires stood
at just over two million hectares. As the
University of Alberta’s Dr. Mike Flannigan
told the CBC program Sunday Edition in
2013, this was twice the average amount
of territory wildfires consumed in the ear-
ly 1970s. Flannigan’s observation affirmed
and extended the conclusion from research
from the mid-1990s indicating that wildfire
in the boreal forest in the 1980s and ear-
ly 1990s burned significantly more of the
land than was the case in the 1950s, 1960s,
and early 1970s.
Chart 1 illustrates this moving average is
again on the upswing. Now at 2.65 million
hectares this moving average has increased
since 2012 due to the very active fire years
we experienced in 2013, 2014, and 2015.
In 2013, 1.87 million hectares of forests
burned in Québec; in 2014, wildfire spread
over 3.4 million hectares of the Northwest
Territories; in 2015, 1.78 million hectares
of Saskatchewan’s boreal forest went up in
flames.
Wildfire in Alberta is an important con-
tributor to this story. The May 2016 Horse
River/Fort McMurray Wildfire and very
high to extreme fire danger forecasts across
most of Alberta’s boreal forest in early to
mid-May suggest that Alberta could lead
Canada into its fourth active fire year in a
row. “To have four in a row,” as Professor
Flannigan told me, “there is no historical
analogue that we have.”
The recent history of forest land burned
in Alberta generally mimics the Canadian
pattern. A 1999 study prepared for Dai-
showa-Marubeni observed that, in north-
west Alberta, large fires already occurred
more frequently and burned more territory
there in the 1980-1995 period than they
did in the 1960s and 1970s. Chart 2 pres-
ents a provincial overview of the average
territorial scope of wildfires over time. On
average, three times as much of the land
was burned by wildfire in the first decade
of this century than was burned in the
1970s; in the first six years of the current
decade the annual average of area burned
stands at 301,331 hectares – nearly seven
times the decadal average for the 1970s.
What the decadal averages hide is the fact
that annual area burned totals over the me-
dium to long term generally resemble a roll-
er coaster ride. There may be tremendous
variation in area burned from year to year.
Reviewing the past 45 years of Alberta’s fire
history you will find years when hundreds
of thousands of hectares burned; you will
find other years which saw little wildfire on
Wildfire: Nature, Government, Choice
0
0.5
1
1.5
2
2.5
3
3.5
4
Chart 1: Canada, Total Forest Land Burned, in Millions of Hectares, 10-‐year averages from 1970-‐79 to 2006-‐15
Source: Averages calculated from Canada, Natural Resources Canada, National ForestryDatabase

A5WLA | April 2016 | Vol. 24, No. 2 | FEATURES
the Horse River/Fort McMurray wildfire
was estimated to be more than 500,000
hectares in size. By the time you read this it
will be larger than that. No previous decade
has seen wildfire burn as much of the prov-
ince as the decade we are in now.
Ironically, past successes in putting out
fires makes today’s challenges for wild-
fire managers more daunting.; they’ve in-
creased the risks of catastrophic wildfires.
The Flat Top Complex Wildfire Review
Committee (2012), struck after the May
2011 Slave Lake fire, made this point.
Successful fire suppression turns a forest
inventory’s age structure on its head over
time. This is emphatically the case for Al-
berta’s boreal forest. In 2011, mature and
overmature trees in the boreal constituted
more than 60 percent of the forest invento-
ry. In the late 1950s and early 1970s they
constituted less than 10 percent of that in-
ventory. Wildfire suppression in the boreal,
the Committee concluded, was “beginning
to increase the risk of large and potentially
costly catastrophic wildfires.”
The recent fire record is a humbling one.
Canada is a global leader on the wildfire
fighting front. Moreover, our fire suppres-
sion capabilities have become more im-
pressive over time. When ignitions are de-
tected initial attack crews are sent, usually
by helicopter, to extinguish or control the
blaze before it starts to grow. Fire managers
now have a variety of sophisticated predic-
tive models and indices they can use to try
to anticipate where wildfires may start. This
allows them to place initial attack crews,
helicopters, water bombers, and heavy ma-
chinery in close proximity to areas where
they believe the chances of wildfire ignition
and spread are greatest. This is especially
important when, as was the case in mid-
May, firefighters had less than 15 minutes
to prevent a wildfire in the northeastern
boreal from growing to two hectares in size
after ignition. But, wildfire trends don’t
suggest that our impressive capabilities
are reducing wildfire’s impact on the land-
scape. Fire suppression may be successful
in reducing the amount of our forests that
taste wildfires but that doesn’t necessari-
the landscape. In 1995 Alberta experienced
an active fire year when more than 336,000
hectares of the province burned; but in
1996 wildfire consumed less than 2,000
hectares. In 1981 two fires, over a period
of just eight days, set ablaze nearly one mil-
lion hectares of the boreal forest. They were
the major contributors to making 1981
the worst year for area burned in Alberta
(1.37 million hectares). One analysis of the
1980 and 1981 fire seasons called August
27, 1981 “Black Thursday” – in less than
seven hours on that day roughly 376,000
hectares, more than one-quarter of the total
territory burned in Alberta in 1981, went
up in smoke.
These variations continue to mark Alber-
ta’s annual wildfire pattern in this decade.
However, this decade already can be dis-
tinguished from its predecessors by the fre-
quency of years where very large amounts
of territory burn. Three of the first six years
of this decade recorded annual area burned
totals of more than 300,000 hectares. This
year will make it four years of the first sev-
en since, as of the Victoria Day weekend,
The Moderate Resolution Imaging Spectroradiometer (MODIS) on NASA’s Terra satellite recorded these temperature anomalies for the week of April 26 to May 3, 2016. Red areas were hotter than the 2000-2010 averages for this same one-week period. CREDIT: National Aeronautics and Space Administration (NASA)
0
50000
100000
150000
200000
250000
300000
350000
1970-‐79 1980-‐89 1990-‐99 2000-‐09 2010-‐15
Chart 2: Alberta, Total Forest Land Burned, in Hectares, selected averages
Source: Averages calculated from Canada, Natural Resources Canada, National ForestryDatabase

66 WLA | April 2016 | Vol. 24, No. 2 | FEATURES
ly mean we will see reductions in the to-
tal areas burned over time. If you want to
view fighting wildfires as a war, wildfire is a
powerful adversary that is in no danger of
surrendering.
Wildfire on the Landscape: Likely Even More in the Future
In Alberta our future is very likely one
where the risks of wildfires starting are
greater than recently. Also, the potential
for wildfires to grow quickly and dramat-
ically likely is greater as well. For Mike
Flannigan our escalating needs and desires
to work, live, and play in the forests well-
away from large urban centres is important
to understanding increased wildfire risks.
“You look at Alberta,” he says, “and…other
than National Parks, there’s a lot of activ-
ity on the landscape and where you have
people you have fire.” Lynn Johnston, one
of Flannigan’s graduate students, studies
wildlands/human interfaces. Her interface
maps for wildfire may be used to support
Flannigan’s observation and make import-
ant distinctions between types of interfac-
es and their prevalence. People who want
to live in the forests, some of whom live
in communities such as Bragg Creek or
Nordegg, are part of the wildland-urban
interface detailed in map b. Alberta stands
out as a western Canadian province char-
acterized by many wildlands/industrial
and wildlands/infrastructure interfaces.
Johnston wouldn’t suggest that such exten-
sive interfaces automatically translate into
greater risks but I think it’s fair to suggest
they may increase the potential for greater
human-caused wildfire risks.
Climate change, in addition to fire weath-
er (precipitation, relative humidity, tem-
perature, and wind direction/speed), also
increases the probabilities of wildfire igni-
tion, growth, and speed of growth. For a
quarter-century now Mike Flannigan has
been studying what effects climate change
are likely to have on wildfire. His research
and that of his collaborators has long ar-
gued that climate change will increase both
the severity of wildfires and the amount of
area burned. In a 2004 paper Flannigan
and his three co-authors explicitly demon-
strated that human emissions of green-
Interface Maps for Wildfire in Canadaa) Composite of maps b, c, and db) Wildland-urban interfacec) Wildland-industrial interfaced) Infrastructure interface
Wildland-Urban Interface, Wildland-Industrial Interface, Infrastructure Interface. Producer: Lynn Johnston / Natural Resources Canada (Sault Ste. Marie, ON), University of Alberta (Edmonton, AB).Date: May 2016 Email: [email protected] system: Canada Lambert Conformal ConicDatum: North American 1983Software version: ArcMap 10.3.Note: Contains data derived from information licensed under the Open Government Licence – Canada.Disclaimer: This data is provided as is. It is the user's responsibility to determine proper uses for the data. The data provider holds no liability for adverse outcomes associated with use of this data and cannot guarantee the data is free of errors or omissions.
a)
d)
c)
b)
CREDIT: Johnston, Lynn M. (in preparation). Mapping and analysis of Canadian wildland fire interface areas (Master’s thesis). University of Alberta, Department of Renewable Resources.

A7WLA | April 2016 | Vol. 24, No. 2 | FEATURES
Strategy (2005), essentially hadn’t put any
money into the strategy. This comment
confirmed what an update on the strategy
for 2008/2009 suggested: the actual federal
commitment for 2005-2008 was $4.8 mil-
lion, a light year away from the $328.9 mil-
lion federal proposed funding requirement
for those years.
FireSmart Canada, in the aftermath of the
Flat Top Complex/Slave Lake fire, request-
ed one million dollars from Public Safety
Canada to help the non-profit organization
develop a national standard for wildfire
prevention planning for municipalities and
rural homeowners. The federal govern-
ment rejected the request. The organization
then lobbied Conservative MPs and asked
Minister Toews to reconsider shutting the
door on this preventative proposal. Otta-
wa still refused. You can taste the frustra-
tion in FireSmart Canada’s Kelly O’Shea’s
words from several years ago about federal
government priorities. “The federal gov-
ernment would rather spend millions of
dollars on evacuating communities and
recovery after the fire than spending a few
dollars up front to reduce the risk and
help mitigate the results of a disaster.” Tom
Burton, Secretary of Partners in Protection
(the creator of the FireSmart brand) and a
member of the Flat Top Complex Wildfire
house gases and sulfate contributed to the
warming in wildfire-prone areas of Cana-
da; moreover, they demonstrated that the
human contribution to climate change had
a significant impact on the area burned in
Canada. Three years later another of Flan-
nigan’s co-authored contributions to un-
derstanding wildfire looked ahead, instead
of to the recent past. That research suggest-
ed that doubling carbon dioxide levels in
the atmosphere from pre-industrial levels
(roughly from 280 parts per million to 560
ppm) would increase the amount of Alber-
ta’s boreal forest burned by wildfire by 12.9
percent (the carbon dioxide concentration
recorded at the Mauna Loa Observatory
on May 19, 2016 was 407.82 ppm). Triple
the carbon dioxide concentration and that
paper predicted that wildfires will burn an
additional 29.4 percent of Alberta’s boreal.
As greenhouse gas emissions and tempera-
tures rise we can expect to see more wild-
fires and larger hectares-burned totals on
those areas of the boreal that do not receive
significant increases in precipitation due to
climate change.
Positive feedbacks are one of the most
haunting or unnerving possibilities associ-
ated with climate change. These feedbacks
occur when the consequences of a warming
global climate amplify, in turn, the process-
es that generate warming. The catastrophic
fires that ravaged Indonesia last year gen-
erated such feedback. The vast majority of
those fires were set deliberately, often as
part of deforestation plans designed to re-
place rainforest with palm oil plantations.
These fires released tremendous amounts
of carbon into the atmosphere. The World
Resources Institute reported that on many
days last fall the greenhouse gas emissions
from these fires were greater than the aver-
age daily emissions of the total US economy.
By last December the cumulative emissions
from just the Indonesian fires were great-
er than the annual emissions of the United
Kingdom, or Canada, or Germany, or Ja-
pan. Not only do these fires release carbon
into the atmosphere but, by destroying the
rainforest, they also destroy carbon sinks.
Forests that absorbed atmospheric carbon
dioxide were obliterated.
This year’s Horse River/Fort McMurray
fire, although minuscule when compared
to what regularly takes place in Indone-
sia, has journalists asking fire and climate
change experts about the global warming
contributions of fires in the boreal. While
the experts don’t agree yet on how much
carbon this Alberta fire has sent into the
atmosphere no one disputes that it’s mil-
lions and millions of tons; it’s a significant
percentage of Canada’s “normal” annual
GHG emissions. And, as in Indonesia, ev-
ery hectare of forest burned in northern
Alberta is one less hectare of forest able to
sequester carbon.
Another similarity between the Indone-
sian fires and boreal forest fires such as the
Horse River/Fort McMurray fire warrants
mention and consideration. Both areas are
rich in peat, partially decomposed plant
matter. So when Indonesian forests are set
ablaze this organic, very rich in carbon,
material burns as well. The amount of peat
in our northern forests, as Mike Flannigan
points out, “dwarfs” the amount of peat
found in tropical forests. Preventing peat
fires, fires that are very hard to distinguish
and may burn or smolder for months, then
becomes a more pressing policy concern in
a warmer future.
Does Ottawa Care Enough?Governments face a range of hard choic-
es when it comes to the subject of wildfire.
These choices will require resources, both
financial and human, and the federal and
Alberta governments’ actions on this front
in recent years don’t inspire a great deal of
confidence that they are taking the chal-
lenges of wildfire seriously enough. In the
2013 Sunday Edition program mentioned
above Brian Stocks, a retired research sci-
entist from the Canadian Forest Service
who continues to specialize in wildfire
behaviour today from the University of
Toronto, noted that governments weren’t
doing enough to try to understand wildfire
and mitigate the risks it poses to Canadi-
ans. The federal government, although a
signatory to the Canadian Wildland Fire
“The federal government would
rather spend millions of dollars on evacuating
communities and recovery after the
fire than spending a few dollars up front to reduce the risk
and help mitigate the results of a disaster.”
Kelly O’Shea,
Executive Director, FireSmart Canada (2013)

88 WLA | April 2016 | Vol. 24, No. 2 | FEATURES
Review Committee, noted in an interview
that, before the Horse River/Fort McMurray
fire, the federal government had increased
the importance of wildfire in its rankings of
disasters. His initial sense of Public Safety
Canada Minister Ralph Goodale’s position,
in the aftermath of the tragic Fort McMur-
ray fire, was that Ottawa now may take a
more serious view of the need for the feder-
al government to increase its commitment
to managing wildfire.
With respect to wildfire research, the sto-
ry Stocks told to the CBC about the history
of federal cuts to basic science in Natural
Resources Canada painted the federal gov-
ernment with the brush of neglect. Stocks
claimed that, when he started his fire re-
search work with the federal government
roughly forty years ago, the federal re-
search capacity in terms of personnel was
at its peak. About 50 staff, with adequate
budgets, were engaged in basic scientif-
ic research on fire. This research capacity
suffered debilitating cuts over the subse-
quent forty years. By 2013, the federal fire
research capabilities were less than half of
what they had been. He asserted that fewer
than 24 people, with “a hugely inadequate
budget,” were engaged in fire research in
2013. He went on to say that so many of
the wildfire challenges we face require ba-
sic scientific research to underpin policy
and this research suffered from cuts to gov-
ernment laboratories. The path we’ve been
on for forty years, one where we’ve moved
away from government-based basic scien-
tific research, seriously hinders our chances
of adapting to a world with more wildfires
on most landscapes.
And What About Alberta?The provincial government owns the vast
majority of Alberta’s natural resources and
arguably has the primary responsibility for
responding to wildfire. What does Alberta’s
recent wildfire management record look
like? One place to begin is with the annual
base amounts budgeted for managing wild-
The Western Partnership for Wildland Fire Science: Understanding and Improving Wildfire ManagementCanada’s fire management agencies long have been
among the world’s leaders when it comes to managing wildfire. But, as Professor Mike Flannigan, the Director of the Western Partnership for Wildland Fire Science, told me recently: “it’s a challenging job and it’s becoming more challenging in Alberta.” In other words, there’s an ongoing need to understand wildfire better and to im-prove our efforts to manage wildfire appropriately. This need is at the core of the mandate of the Western Partner-ship for Wildland Fire Science.Centred at the University of Alberta, the Partnership
established a collaborative network in 2009 between three institutions: the university’s Department of Renew-able Resources, Alberta’s Department of Agriculture and Forestry, and the Canadian Forest Service. Dedicated to research and education it’s not surprising to hear Profes-sor Flannigan point to more than 20 graduate students who have developed an expertise in wildfire through the training they’ve received through faculty involved in the Partnership. The university registration system suggests that Renewable Resources plans to offer one undergrad-uate and three graduate courses explicitly focused on wildfire in the 2016-17 year. The Partnership is making an important contribution to training the next generation
of scientists and practitioners who will wrestle with the challenges of managing wildfire in Canada and abroad. The original science plan for the Partnership estab-
lished three research priorities: fire resilient landscapes, fire danger rating systems, and fire weather and climate change. Here Flannigan sees research such as that on rating systems and fire weather as work building on an already impressive Canadian pedigree. The Canadian Fire Weather Index, for example, is the de facto glob-al standard when it comes to estimating the effects fuel moisture and wind will have on the behaviour of fire. The new modeling that researchers are developing, and students/future forestry managers are learning about, re-fines and improves on the insights of past generations. The prize here is greater predictability, less uncertainty. But make no mistake when it comes to prediction and uncertainty - there’s no hubris in the orientation of Flan-nigan and his research colleagues. Uncertainty will al-ways be a part of wildfire management. The goal of the Partnership’s research and education program is to re-duce that uncertainty and better prepare the current and future generations of wildfire managers to face the chal-lenges a warming world presents.

A9WLA | April 2016 | Vol. 24, No. 2 | FEATURES
think so. Slave Lake in 2011 and Fort Mc-
Murray in 2016 should make it clear that
this measure for protecting the public and
environment is flawed. The government
needs to reconsider how it measures wild-
fire management performance.
“Alberta Agriculture and Forestry,” ac-
cording to the department, “responds
to every wildfire reported in the Forest
Protection Area (approximately 60% of
the province’s landbase).” The province’s
five priorities in deciding how to allocate
wildfire fighting resources are: human life,
communities, watershed and sensitive
soils, natural resources, and infrastructure.
With respect to these priorities, should the
province devote resources to protect com-
mercial timber values at the same time as it
tries to subdue a fire on the doorstep of a
community?
In the aftermath of the Horse Lake/Fort
McMurray fire this is a hard question our
political leaders should be asked to wrestle
with. On April 30, 2016, one day before
the Horse Lake/Fort McMurray fire was dis-
covered, a wildfire erupted approximately
45 kilometres northwest of Red Earth on a
landscape marked by clearcuts, well sites,
and merchantable timber. Communities
were not threatened by this rapidly grow-
ing, out of control wildfire. But the Otter
Lakes wildfire did threaten timber values.
So, helicopters, airtankers, and dozens of
firefighters attacked the wildfire. Thanks
to the hard work of the firefighters and the
use of aircraft and heavy equipment they
were able to slow the growth of this fire in
an unpopulated area. By Saturday May 7th
the fire had grown to nearly 2,000 hectares
but it was 50 percent contained. The next
day the province announced that the fire
was held – it was not expected to grow any
larger.
With no communities at risk should the
province have hit the Otter Lakes wildfire
as hard as it did? Might not some of the air-
craft and firefighters used there to defend
timber values, perhaps even all of those re-
sources, have been better deployed on the
next day or on May 2nd 200 kilometres to
the east fighting the fire that engulfed the
fire. As a base budget, this total generally
will be less and sometimes far less than
what the province actually spends on fight-
ing wildfires. Supplementary estimates will
be relied on in active or bad fire years to en-
sure the province fights all dangerous fires.
For example, Alberta Sustainable Re-
source Development’s 2011/2012 budget
dedicated $107.4 million “to cover wildfire
prevention and detection and to retain (on-
call) the necessary manpower, equipment
and aircraft for immediate mobilization.”
The Flat Top Complex/Slave Lake and
Richardson Backcountry wildfires were
largely responsible for Alberta spending an
additional $250 million in wildfire emer-
gency funding during that fiscal year. The
lower figure, $107.4 million, is a better es-
timate of the permanent resources Alberta
devoted that year to managing wildfire.
From the 2004/2005 fiscal year to the
2014/2015 fiscal year there was very slim
growth in this measure of Alberta’s com-
mitment to managing wildfire. Two per-
cent annually, that’s how little the base or
pre-season Alberta wildfire management
budget grew in constant, inflation-adjust-
ed dollars. The Flat Top Complex Wildfire
Review Committee noted that the increas-
ing costs of a wide range of firefighting
resources was a “key pressure” on the gov-
ernment’s ability to prepare for wildfires.
I’m skeptical that such a slim real increase
in the base budget has been able to keep
pace with the current costs and needs of
wildfire management.
In November 2015, at the end of an ac-
tive fire year where wildfires burned near-
ly 500,000 hectares of Alberta, Agriculture
and Forestry Minister Oneil Carlier told
members of a legislative committee that
a review had started of the personnel and
equipment his department would need to
be prepared well for the 2016 fire season.
Apparently that review didn’t convince the
provincial government to increase mark-
edly Alberta’s base wildfire management
budget. In April 2016 Deputy Minister
Bev Yee told the Standing Committee on
Alberta’s Economic Future that the wild-
fire base budget was slightly less than the
previous year. Still, she suggested, her
department was ready for the 2016 sea-
son. Premier Notley defended her gov-
ernment’s approach to wildfire by saying
that, if the fire season warranted it, Alberta
would “add if necessary” to the base bud-
get. This philosophy is no different from
that taken by the Progressive Conservative
governments she succeeded.
Performance Measures and Priorities: Do They Need to Change?
Do climatological and weather circum-
stances justify this continuation in wildfire
management policy? If Alberta truly wants
to take the “proactive approach to con-
trolling wildfires” that Minister Carlier sub-
scribed to in his November 2015 commit-
tee testimony then perhaps Alberta should
be investing in more wildfire research,
knowledge, equipment, and personnel.
This suspicion arises from the belief that
the challenges and risks associated with
wildfire today are more serious than they
were one or two generations ago. One of
the first things these challenges demand is a
serious reconsideration of how government
measures and reports wildfire management
success. Containment and suppression is a
longstanding measure of how well Alber-
ta is performing its wildfire management
role; what percentage of wildfires are con-
tained by 10am of the day following their
discovery? Alberta’s performance is stellar
according to this measure. In 2011, the
government could report that 96.1 per-
cent of all wildfires were contained with-
in this timeframe. But…this was the year
Slave Lake burned; this also was the year of
the Richardson backcountry fire – a mam-
moth 600,000 hectares fire that burned for
months. And, to return to an observation
from the Flat Top Complex Review Com-
mittee report, successful suppression ac-
tually is beginning to increase the risks of
catastrophic wildfires.
Hypothetically, would we be comfortable
in arguing at the end of the current fire year
that it was a success because we met a con-
tainment target of 97.8 percent? I wouldn’t
1010 WLA | April 2016 | Vol. 24, No. 2 | FEATURES
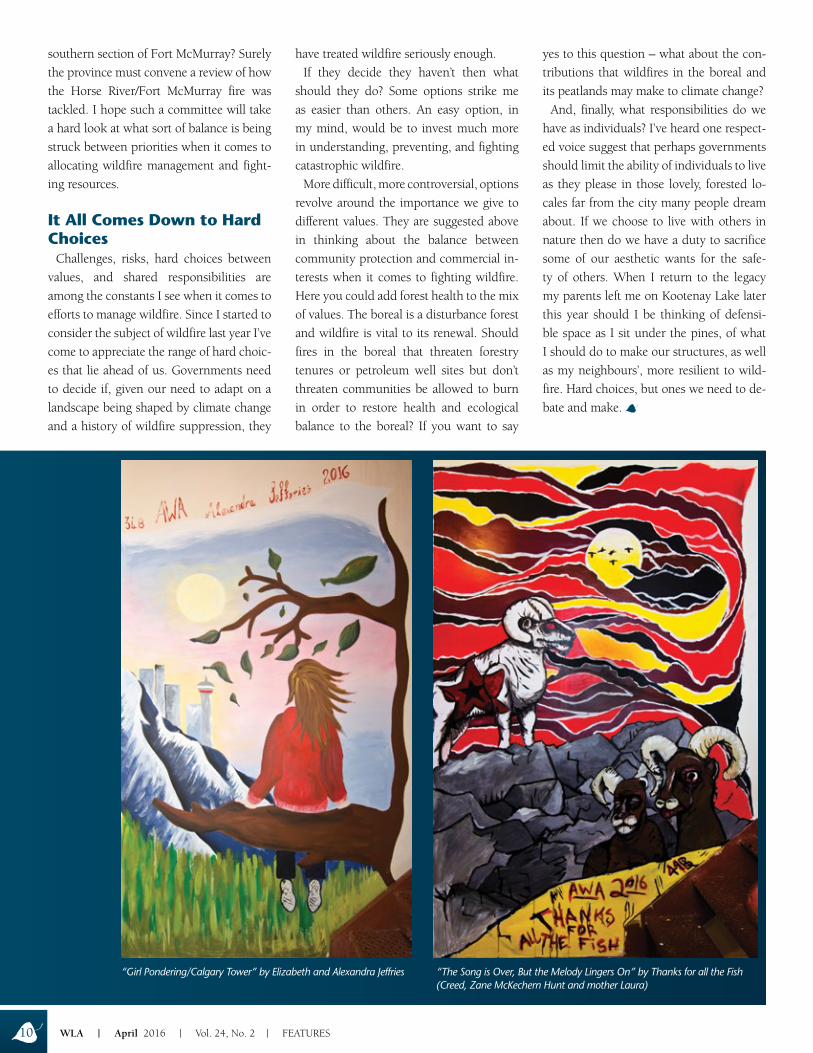
“The Song is Over, But the Melody Lingers On” by Thanks for all the Fish (Creed, Zane McKechern Hunt and mother Laura)
“Girl Pondering/Calgary Tower” by Elizabeth and Alexandra Jeffries
southern section of Fort McMurray? Surely
the province must convene a review of how
the Horse River/Fort McMurray fire was
tackled. I hope such a committee will take
a hard look at what sort of balance is being
struck between priorities when it comes to
allocating wildfire management and fight-
ing resources.
It All Comes Down to Hard Choices
Challenges, risks, hard choices between
values, and shared responsibilities are
among the constants I see when it comes to
efforts to manage wildfire. Since I started to
consider the subject of wildfire last year I’ve
come to appreciate the range of hard choic-
es that lie ahead of us. Governments need
to decide if, given our need to adapt on a
landscape being shaped by climate change
and a history of wildfire suppression, they
have treated wildfire seriously enough.
If they decide they haven’t then what
should they do? Some options strike me
as easier than others. An easy option, in
my mind, would be to invest much more
in understanding, preventing, and fighting
catastrophic wildfire.
More difficult, more controversial, options
revolve around the importance we give to
different values. They are suggested above
in thinking about the balance between
community protection and commercial in-
terests when it comes to fighting wildfire.
Here you could add forest health to the mix
of values. The boreal is a disturbance forest
and wildfire is vital to its renewal. Should
fires in the boreal that threaten forestry
tenures or petroleum well sites but don’t
threaten communities be allowed to burn
in order to restore health and ecological
balance to the boreal? If you want to say
yes to this question – what about the con-
tributions that wildfires in the boreal and
its peatlands may make to climate change?
And, finally, what responsibilities do we
have as individuals? I’ve heard one respect-
ed voice suggest that perhaps governments
should limit the ability of individuals to live
as they please in those lovely, forested lo-
cales far from the city many people dream
about. If we choose to live with others in
nature then do we have a duty to sacrifice
some of our aesthetic wants for the safe-
ty of others. When I return to the legacy
my parents left me on Kootenay Lake later
this year should I be thinking of defensi-
ble space as I sit under the pines, of what
I should do to make our structures, as well
as my neighbours’, more resilient to wild-
fire. Hard choices, but ones we need to de-
bate and make.