Wild Turkey Resources in South Carolina 2020
25
ANNUAL REPORT OF THE DEPARTMENT OF NATURAL RESOURCES ON ACT 51 123 rd SESSION OF THE SOUTH CAROLINA GENERAL ASSEMBLY (2019) Wild Turkey Resources in South Carolina 2020 June 2021
Transcript of Wild Turkey Resources in South Carolina 2020

1
ANNUAL REPORT OF THE DEPARTMENT OF NATURAL RESOURCES ON
ACT 51 123rd SESSION OF THE SOUTH CAROLINA
GENERAL ASSEMBLY (2019)
Wild Turkey Resources in South Carolina 2020
June 2021

2
EXECUTIVE SUMMARY
Act 51 of the 123rd Session of the South Carolina General Assembly largely rewrote wild turkey hunting
laws in South Carolina. It established new turkey season frameworks, imposed a limit of one gobbler
during the first 10 days of the season, a daily limit of one gobbler, and it imposed a first-time fee on
turkey tags. Act 51 also requires that “The department shall provide an annual report on the wild turkey
resources in South Carolina to the Chairman of the Senate Fish, Game and Forestry Committee and the
Chairman of the House Agriculture and Natural Resources Committee.” The following is offered by the
department to fulfill that requirement.
The popularity and status of the Eastern wild turkey in South Carolina drives the South Carolina
Department of Natural Resources (SCDNR) Wildlife Section's ongoing commitment to conduct
pertinent research, surveys and monitoring related to the state's wild turkey population. Due to the
importance of turkeys as a state resource, SCDNR believes that accurately assessing the productivity,
harvest, as well as hunter participation in turkey hunting, is key to the management of this species.
Agencies and legislators are faced with the daunting task of designing and recommending regulatory
frameworks that maximize hunter satisfaction while ensuring that populations are sustainable. Proposed
changes in turkey-related laws and regulations should have foundations in biology, therefore, the
population dynamics associated with annual reproduction and hunting mortality must be monitored and
reported. Similarly, when issues arise that do not involve biological parameters, it is important to have
information related to turkey hunter activities afield because they also form an important basis for
managing wild turkeys.
The objectives of annual survey and monitoring are to obtain valid estimates of; (1) the statewide spring
gobbler harvest, (2) the harvest of gobblers in the constituent counties, (3) hunting effort related to
turkeys, (4) information on hunters’ opinions of the turkey resource and other aspects of turkey hunting,
and (5) annual reproduction and recruitment of wild turkeys in South Carolina.
Additionally, wildlife biologists and managers in South Carolina and throughout the range of the Eastern
wild turkey have observed and reported declines in productivity, likely attributable to large-scale
declines in nest success and brood survival. Likewise, declines in turkey abundance, and corresponding
declines in spring harvest of males have been noted. Collectively, these findings are of considerable
concern to state wildlife agencies, like SCDNR, charged with ensuring sustainable populations of wild
turkeys.
To quantify, South Carolina has experienced declines in turkey productivity since 1988. Average
recruitment prior to 1988 was 3.5 poults per hen. Average recruitment since then has been 2.1,
representing a 40 percent decrease in average recruitment. Coincidentally, the turkey harvest has
decreased over 40 percent since it peaked in 2002.
The declines, here and in other states, have precipitated numerous research projects over the last decade.
This research has been conducted by several universities across the Southeast, with assistance and
primary funding from state wildlife agencies. SCDNR has and continues to support and participate in
3
these studies. Over time, the agency hopes to gain a better understanding of the factors influencing
turkey declines, and methods, techniques, and management strategies to slow or reverse this trend.
This research entails a comprehensive assessment of reproductive ecology and chronology of male and
female wild turkeys. This includes studies of timing, location and success of nesting and brood rearing
activity. Projects also investigate survival, behavioral and movement data, demographic parameters,
gobbling activity, and descriptions of mate selection and parentage for populations of wild turkeys.
Summaries of current research can be found within this report.
Turkey harvest, hunter participation and hunter effort are estimated by means of an annual mail survey
that involves a single mail-out. Hunters are surveyed randomly by selecting 30,000 individuals who
received a set of 2020 Turkey Transportation Tags which are required to hunt turkeys in South Carolina.
During the 2020 spring season it is estimated that 43,164 hunters harvested a total of 13,348 adult
gobblers and 696 jakes for a statewide total of 14,044 turkeys (Table 1). This figure represents a 19
percent decrease in harvest from 2019 (17,374). Determining why the harvest decreased this amount is
difficult because legislative changes went into effect in 2020 which established new season frameworks,
bag limits, and a first-time fee for turkey tags. Additionally, the Covid-19 virus surfaced just prior to the
2020 turkey season. Abrupt and significant changes like these can create “noise” which interrupts or
disguises trends that develop over time under more uniform conditions. The big question is was the
decrease in harvest in 2020 a continuing trend of fewer turkeys and declining harvests or was it an
artifact of the legislative changes and effects of Covid-19? This should become clear as trends emerge
over the next several years.
Wild turkey productivity is assessed by observations of reproduction and associated survival of
offspring being recruited into the population. This measure of young entering the population based on
the number of hens in the population is the Total Recruitment Ratio (TRR). This annual index is the
most practical measure of productivity because it considers successful hens, unsuccessful hens, and
poult survival. Recruitment of four or more poults per hen is considered excellent, three is good, two is
fair and considered a break-even point, and one or less poults per hen is poor.
During 2020 statewide Total Recruitment Ratio was 1.5, and for the last five years has averaged 1.6. For
hens that successfully raised a brood, average brood size was 3.7 poults, a number that has remained
consistent over time. However, the driving factor in the low productivity is the high percentage of hens
with no poults at all by late summer. Sixty percent of hens observed during the 2020 survey had no
poults and that figure has averaged 57% the last five years.
The current estimated population of wild turkeys in South Carolina is approximately 100,000. This is
based on a hen to gobbler ratio of 1.84:1 derived from the 2020 Summer Turkey Survey, the estimated
harvest of 14,044 gobblers during spring 2020 and a 40 percent male harvest rate. Male harvest rate is
based on long-term average disparity in hen to gobbler ratio which can only be explained by differential
mortality between the sexes, in this case attributed to hunter harvest.
Additional details and discussion on the annual harvest and productivity surveys are found within this
report.
4
2020 SC WILD TURKEY HARVEST REPORT
Introduction
Ranking only behind white-tailed deer in popularity among hunters, the Eastern wild turkey is
an important natural resource in South Carolina. The 2020 Turkey Hunter Survey represents
the South Carolina Department of Natural Resources (SCDNR), Wildlife Section’s ongoing
commitment to conduct pertinent research related to the state’s wild turkey population. The
primary objectives of this survey research were to obtain valid estimates of; (1) the statewide
spring gobbler harvest in 2020, (2) the harvest of gobblers in the constituent counties of the
state, and (3) hunting effort related to turkeys. Information on hunter’s opinions of the turkey
resource and other aspects of turkey hunting are also presented.
Due to the importance of turkeys as a state resource, SCDNR believes that accurately assessing
the harvest of turkeys, as well as hunter participation in turkey hunting, is key to the
management of this species. Proposed changes in turkey-related laws and regulations should
have foundations in biology, therefore, the population dynamics associated with annual
hunting mortality cannot be ignored. Similarly, when issues arise that do not involve biological
parameters, it is important to have information related to turkey hunter activities afield because
they too form an important basis for managing wild turkeys.
Since the inception of the Statewide Turkey Restoration and Research Project (Turkey Project)
the methods used to document the turkey harvest have changed. Historically, turkey harvest
figures were developed using a system of mandatory turkey check stations across the state. This
system yielded an actual count of harvested turkey which were reported at checks stations and
was, therefore, an absolute minimum harvest figure. Shortcomings in this system included
deterioration of check station compliance, complaints from hunters regarding the inconvenience
of check stations, and costs associated with the check station system. The requirement to check
harvested turkeys in South Carolina was eliminated following the 2005 season. Prior to
eliminating the check-in requirement, SCDNR conducted surveys in order to document the rate
of noncompliance, as well as, to determine the relationship between harvest figures obtained
from check stations and those obtained from surveys. As would be expected, harvest figures
obtained from surveys are higher than those from check stations due to lack of compliance with
the check-in requirement.
Survey Methodology
The 2020 Turkey Hunter Survey represented a random mail survey that involved a single
mailout. The questionnaire for the 2020 Turkey Hunter Survey was developed by Wildlife
Section personnel (Figure 1). The mailing list database was constructed by randomly selecting
30,000 individuals who received a set of 2020 Turkey Transportation Tags which are required
to hunt turkeys in South Carolina. Data entry was completed by Data Dash, Inc., Farmington,
Missouri.
Results from the mail survey were corrected for nonresponse bias using data collected by Southwick

5
Associates, Fernandina Beach, Florida using a Computer Assisted Telephone Interview program
(CATI). Statistical analysis was conducted using Statistix 10 (Analytical Software, Tallahassee, FL).
Results and Discussion
Turkey Harvest
During the 2020 spring season it is estimated that a total of 13,348 adult gobblers and 696 jakes
were harvested for a statewide total of 14,044 turkeys (Table 1). This figure represents a 19
percent decrease in harvest from 2019 (17,374). Determining why the harvest decreased this
amount is difficult because legislative changes went into effect in 2020 which established new
season frameworks, bag limits, and a first-time fee for turkey tags. Additionally, the Covid-19
virus surfaced just prior to the 2020 turkey season. Abrupt and significant changes like these can
create “noise” which interrupts or disguises trends that develop over time under more uniform
conditions. The big question is whether the decrease in harvest in 2020 a continuing trend of
fewer turkeys and declining harvests or was it an artifact of the legislative changes and effects of
Covid-19?
On one hand, turkey harvest figures have trended down for over a decade in South Carolina
reflecting decreased numbers of turkeys likely due to ongoing poor recruitment of poults into
the population. This trend appears to be a regional situation and has been called the “southeast
turkey decline” by biologists and managers. The percentage of jakes in the 2020 harvest (5.0%)
was the lowest on record. Low jake harvests are usually indicative of poor recruitment the
previous year. This would lend credence to the notion that the decrease in harvest in 2020 was
simply a continuation of a declining trend.
On the other hand, the legislative changes and effects of Covid-19 could easily explain much of
the decline in harvest. Along with the new season structure the legislative changes allowed for
only one gobbler to be taken during the first 10 days of the season. This was an intentional
effort to limit the harvest of birds early in the season to moderate possible effects of early
gobbler removal on the reproductive success of hens. Additionally, overall hunter numbers
were down 12 percent in 2020 perhaps related to “pushback” by hunters on the first-time fee for
a set of turkey tags. Nonresident hunter numbers were down nearly 50 percent likely due to the
high fee for a set of nonresident turkey tags ($100), as well as, concerns associated with Covid-
19 which was raging during the spring of 2020. It will likely take several years for the effects of
the legislative changes and Covid-19 to settle and allow for new trends to emerge.
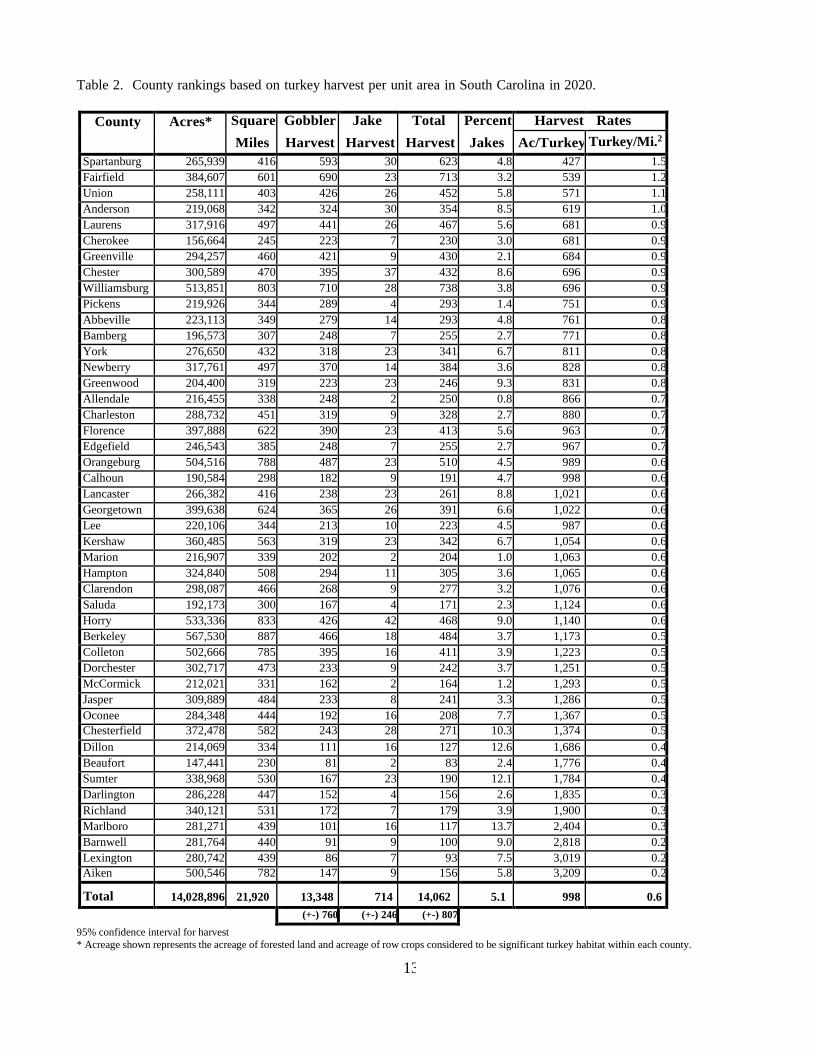
Harvest Per Unit Area County Rankings
Comparisons can be made between turkey harvests from the various counties in South Carolina
if a harvest per unit area is established. Harvest per unit area standardizes the harvest among
counties regardless of the size of individual counties. One measure of harvest rate is the number
of turkeys taken per square mile (640ac. = 1 mile2). When considering the estimated turkey
habitat that is available in South Carolina, the turkey harvest rate in 2020 was 0.6 gobblers per

6
square mile statewide (Table 2). Although this harvest rate is not as high as it once was, it
should be considered good and is similar to other Southeastern states. The top 5 counties for
harvest per unit area were Spartanburg (1.5 turkeys/mile2), Fairfield (1.2 turkeys/mile2), Union
(1.1 turkeys/mile2), Anderson (1.0 turkeys/mile2), and Laurens (0.9 turkeys/mile2) (Table 2).
Turkey Harvest Rankings by County
Total turkey harvest is not comparable among counties because there is no standard unit of
comparison, i.e., counties vary in size and are, therefore, not directly comparable. However,
some readers may be interested in this type of ranking. The top 5 counties during 2029 were
Williamsburg, Fairfield, Spartanburg, Orangeburg, and Berkeley (Table 3).
Number of Turkey Hunters
Even though all individuals receiving a set of Turkey Transportation Tags were licensed to hunt
turkeys, only 67 percent indicated that they actually hunted turkeys. Based on this figure,
approximately 43,164 hunters participated in the 2020 spring turkey season, a 12 percent
decrease from 2019 (49,060). Counties with the highest estimates for individual hunters include
Fairfield, Laurens, Newberry, Spartanburg, and Union (Table 4). As previously discussed,
“pushback” by hunters on the first-time fee for a set of turkey tags along with travel restrictions
and other issues associated with Covid-19 likely was likely responsible for the reduced number
of hunters, particularly nonresidents.
Hunter Effort
For the purposes of this survey hunter effort was measured in days with one day being defined
as any portion of the day spent afield. Turkey hunters averaged approximately 8.4 days afield
during the 2020 season (Table 4). Successful hunters averaged significantly more days afield
(11.2 days) than unsuccessful hunters (6.6 days). Extrapolating to the entire population of
turkey hunters yields a figure of 269,154 total days of spring gobbler hunting, a 4 percent
increase from 2019 (258,445 days).
Although hunter numbers were down in 2020, there was increased effort by those who did hunt
which may be attributable to Covid-19 “lockdowns” and the notion that individuals had more
time to hunt. The number of days devoted to turkey hunting in South Carolina is significant and
points not only to the availability and popularity of turkeys as a game species, but to the obvious
economic benefits related to this important natural resource. The top 5 South Carolina counties
for overall days of turkey hunting during 2020 were Fairfield, Spartanburg, Laurens, Chester,
Union and Newberry counties (Table 4).
Turkey Harvest by Period of Season
Gobbling by male wild turkeys occurs primarily in the spring and is for the purpose of
attracting hens for mating purposes. Therefore, spring turkey hunting is characterized by hunters
attempting to locate and call gobbling male turkeys using simulated hen calls. With respect to

7
both biology and quality hunting, the timing of the spring gobbler season should consider three
primary factors: peak breeding, peak gobbling, and peak nest initiation. Considering these
factors, seasons can be set to afford hunters the best opportunity to hunt during the best time
(i.e., peak gobbling) without inhibiting reproductive success of hens.
A recent multi-year nesting study conducted in the lower coastal plain indicates that on average,
hens do not initiate nesting until April 9. Gobbling studies conducted simultaneously to the
nesting studies indicate peak gobbling occurs the first 10 days of April. The peak in gobbling is
believed to coincided with nest initiation by hens because gobbling increases in response to
decreased hen availability due to commencement of nesting activities.
The 2020 season marked a return to two spring turkey season frameworks in South Carolina. In
Game Zones 1 and 2 which encompasses the piedmont and mountains the season is now April
1 to May 10, whereas, in Game Zones 3 and 4 located in the coastal plain the season is March
22 to April 30. Based on the research, the April 1 season start date coincides more closely with
the onset of nesting and peak gobbling. This should provide for improved reproductive success
by hens because gobblers are not harvested too early and it should also lead to improved
hunting success because gobblers are not accompanied by as many hens due to onset of
nesting. On the other hand, the March 22 season start date is nearly 3 weeks prior to peak nest
initiation and prior to peak gobbling as well. That being the case, considerations should be
given to potential effects on reproduction due to excessive early removal of males and
decreased hunter success due to decreased gobbling and hunters competing with hens.
If seasons are set appropriately, the greatest proportion of turkeys should be harvested during
the first week or 10 days of the season because increasing number of hens should be egg- laying
or incubating resulting in gobblers that are naïve and more responsive to hunters’ calls.
Harvest by period of season demonstrates that the timing of the April 1 opening date affords
higher turkey harvests as most turkeys are harvested during the 10 days following the
April 1 opening date (Figure 4).
When broken-out by specific season frameworks the results are similar. In areas where the
season begins March 22, only 34 percent of the total harvest was accounted for during the first
10 days of the season (Figure 5). This is likely because late March is the time of peak breeding
and males gobble less because hens are available. Hunters refer to this as gobblers being
“henned-up.” On the other hand, 45 percent of the harvest occurred during the first 10 days of the
season in areas where the season begins April 1 (Figure 6). This is because by April 10 a
significant number of hens are involved in nesting activities leaving gobblers “lonely” and more
susceptible to hunters’ calls. These same trends were apparent prior to 2016 when there were
split seasons in South Carolina with one framework beginning March 15 and the other April 1.

8
Hunting Success
For determination of hunting success only those individuals who actually hunted turkeys were
included in the analysis and similarly, success was defined as harvesting at least one turkey.
Overall hunting success in 2020 was 27 percent (Figure 5). Unlike deer hunting which typically
has high success, turkey hunting can be an inherently unsuccessful endeavor, relatively
speaking.
The statewide bag limit in South Carolina is 3 gobblers. Obviously, most successful hunters
harvest only one or two birds. However, it is interesting to note the relative contribution to the
total harvest of turkeys by the few hunters that harvest 3 birds. Ironically, the percentage of
hunters taking 3 birds was only 2.1 percent, however, this small percentage of hunters
harvested an estimated 24 percent of the total birds taken in the state (Figure 6).
Hunter Opinion Regarding Turkey Numbers
The 2020 Turkey Hunter Survey asked participants to compare the number of turkeys in the area
they hunt most often with the number of turkeys in past years. Participants were given 3
choices: increasing, about the same, or decreasing. Approximately 48 percent of hunters
indicated that the number of turkeys in the area they hunted most often was about the same as in
past years. A higher percentage of hunters (37 percent) believed that the turkey population was
decreasing than increasing (16 percent). On a scale of 1 to 3 with 1 being increasing, 2 being the
same, and 3 being decreasing, the overall mean rating of 2.2 suggests that hunters viewed the
turkey population as decreasing. The opinion among hunters that the turkey population is
decreasing has been consistent the last few years.
Turkeys Shot but not Recovered
Harvesting game signals the end of a successful hunt and although most hunters do a good job
of preparing their equipment and mental state, it goes without saying that a certain percentage
of game is shot or shot at and not killed or recovered. This point is no different when turkey
hunting.
To estimate the prevalence of errant shots at turkeys, the 2020 Turkey Hunter Survey asked
hunters to indicate the number of turkeys that they “shot but did not kill or recover during the
2020 season in South Carolina.” Approximately 9.7 percent of hunters indicated that they shot
but did not kill or recover at least one turkey in 2020 (10.1 percent in 2019). There were
approximately 43,164 turkey hunters in 2020 meaning that approximately 4,181 turkeys were
shot or shot at and not killed or recovered. Therefore, approximately 23 percent of the total
number of turkeys shot at were not killed or recovered. These results have been consistent since
this type of data has been available.
This data is certainly not indicative of “dead and unrecovered turkeys,” however, some

9
percentage of the 4,181 turkeys that were shot at did eventually die. Although shot shells for
turkeys have become increasingly sophisticated, accurate, and lethal it is a fact that the pattern of
a shotgun is relatively broad and contains hundreds of pellets. Therefore, a “clean miss” is not
as clear-cut for turkeys compared to other big game like deer where there is typically a single
projectile. Additional research is needed on this topic.
Turkey Harvest in the Morning vs. Afternoon
The typical spring turkey hunt is characterized by attempting to locate a gobbling bird prior to
or just after sunrise. Once a gobbler is located most hunters position themselves as close as they
can to the gobbler without scaring it away. Various types of callers that mimic the sounds of
wild turkeys are then used to attempt to call the gobbler into gun range. This technique of
locating a gobbling bird, setting up, and calling is repeated as necessary.
Traditionally, spring turkey hunting was primarily carried out during the first few hours of the
day. As the popularity of turkey hunting has increased, many hunters now hunt in the afternoon
as well. Gobblers are generally not as vocal in the afternoon but can be stimulated to gobble
using the various turkey calls, particularly late in the afternoon near areas where turkeys
frequently roost. Additionally, it is now common for hunters to set up on food plots, often in
blinds, using decoys in areas that turkeys frequent for feeding and loafing in the afternoon.
To gain a better understanding of the distribution of harvest with respect to time of day, the 2020 Turkey
Hunter Survey asked hunters to identify the number of birds harvested in the morning compared to the
afternoon. Results indicate that approximately 72 percent of gobblers were harvested in the morning
compared to 28 percent in the afternoon. This data may be useful if discussions arise concerning the
relative importance of morning compared to afternoon harvest of gobblers in the spring. These results
have been consistent since this type of data has been available.

10
COVID-19 and the 2020 Spring Turkey Season
On March 16, the week prior to the opening of the 2020 spring turkey season, Governor Henry
McMaster announced the closing of schools in South Carolina. Government agencies, businesses,
sporting events, etc. immediately followed suit with stay-at-home recommendations or mandates. This
marked the beginning of the COVID-19 “lockdown” which lasted well beyond the close of the turkey
season in early May.
To determine possible effects of COVID-19 on spring turkey season, two questions were added to the
2020 Turkey Hunter Survey. The first asked participants how the pandemic affected the amount of time
they spent turkey hunting compared to a “normal” year. There were 3 choices: more, about the same, or
less. Responses were similar for residents and nonresidents with approximately 57 percent of
respondents indicating they hunted the same amount as a normal year. A higher percentage (25%) of
participants indicated they hunted more than those who indicated they hunted less (18%). On a scale of 1
to 3 with 1 being more, 2 being the same, and 3 being less, the overall mean of 1.3 suggests that
respondents hunted more during the 2020 season. As previously discussed, although total turkey hunter
numbers were down (12%), the total amount of effort (man/days) increased (4%) in 2020. Thus, for
those individuals who hunted, they hunted more on average than in 2019.
The second question asked participants if the circumstances surrounding the COVID-19 pandemic were
the sole reason they did not turkey hunt in South Carolina during 2020. Responses were not similar for
residents compared to nonresidents. Significantly more nonresidents (85%) than residents (37%)
indicated that circumstances surrounding COVID-19 were the sole reason they did not hunt in South
Carolina in 2020. These results are not surprising given that travel restrictions, quarantines, etc. could
have easily affected nonresidents more than residents. Finally, these results could easily explain the
decrease (12%) in hunter numbers seen in 2020. This is particularly the case as nonresident hunter
numbers decreased approximately 50 percent from 2019.

11
List of Tables
Table Title Page
1 Estimated statewide turkey harvest in South Carolina in 2020……………………………..12
2 County rankings based on turkeys harvested per unit area in South Carolina in 2020……..13
3 County rankings based on total turkeys harvested in South Carolina in 2020……………...14
4 Estimated number of turkey hunters, average days hunted, and total hunting effort
by county in South Carolina in 2020.………………………………………………………15
List of Figures
Figure Title Page
1 South Carolina Department of Natural Resources 2020 Turkey Hunter Survey……….16-17
2 Spring wild turkey harvest in South Carolina 1982-2020…………………………………18
3 Summer wild turkey recruitment ratio in South Carolina 1982-2019……………………..18
4 Percentage of gobblers harvested by period of season in South Carolina in 2020………...19
5 Percentage of gobblers harvested by period of season with March 22-April 30
framework in Game Zones 3 & 4 (coastal plain) in South Carolina in 2020………………19
6 Percentage of gobblers harvested by period of season with April 1-May 10 framework
in Game Zones 1 & 2 (piedmont and mountains) in South Carolina in 2020…..…………19
7 Hunter success during the spring turkey season in South Carolina in 2020………………20
8 Relative contribution to the total turkey harvest by hunters taking between 1 and 3 birds
in South Carolina in 2020…………………………………………………………………20
.

12
Table 1. Estimated statewide turkey harvest in South Carolina in 2020.
County Acres* Square Gobbler Jake Total Percent Harvest Rates
Miles Harvest Harvest Harvest Jakes Ac/Turkey Turkey/Mi.2
Abbeville 223,113 349 279 14 293 4.8 761 0.8
Aiken 500,546 782 147 9 156 5.8 3,209 0.2
Allendale 216,455 338 248 2 250 0.8 866 0.7
Anderson 219,068 342 324 30 354 8.5 619 1.0
Bamberg 196,573 307 248 7 255 2.7 771 0.8
Barnwell 281,764 440 91 9 100 9.0 2,818 0.2
Beaufort 147,441 230 81 2 83 2.4 1,776 0.4
Berkeley 567,530 887 466 18 484 3.7 1,173 0.5
Calhoun 190,584 298 182 9 191 4.7 998 0.6
Charleston 288,732 451 319 9 328 2.7 880 0.7
Cherokee 156,664 245 223 7 230 3.0 681 0.9
Chester 300,589 470 395 37 432 8.6 696 0.9
Chesterfield 372,478 582 243 28 271 10.3 1,374 0.5
Clarendon 298,087 466 268 9 277 3.2 1,076 0.6
Colleton 502,666 785 395 16 411 3.9 1,223 0.5
Darlington 286,228 447 152 4 156 2.6 1,835 0.3
Dillon 214,069 334 111 16 127 12.6 1,686 0.4
Dorchester 302,717 473 233 9 242 3.7 1,251 0.5
Edgefield 246,543 385 248 7 255 2.7 967 0.7
Fairfield 384,607 601 690 23 713 3.2 539 1.2
Florence 397,888 622 390 23 413 5.6 963 0.7
Georgetown 399,638 624 365 26 391 6.6 1,022 0.6
Greenville 294,257 460 421 9 430 2.1 684 0.9
Greenwood 204,400 319 223 23 246 9.3 831 0.8
Hampton 324,840 508 294 11 305 3.6 1,065 0.6
Horry 533,336 833 426 42 468 9.0 1,140 0.6
Jasper 309,889 484 233 8 241 3.3 1,286 0.5
Kershaw 360,485 563 319 23 342 6.7 1,054 0.6
Lancaster 266,382 416 238 23 261 8.8 1,021 0.6
Laurens 317,916 497 441 26 467 5.6 681 0.9
Lee 220,106 344 213 10 223 4.5 987 0.6
Lexington 280,742 439 86 7 93 7.5 3,019 0.2
McCormick 212,021 331 162 2 164 1.2 1,293 0.5
Marion 216,907 339 202 2 204 1.0 1,063 0.6
Marlboro 281,271 439 101 16 117 13.7 2,404 0.3
Newberry 317,761 497 370 14 384 3.6 828 0.8
Oconee 284,348 444 192 16 208 7.7 1,367 0.5
Orangeburg 504,516 788 487 23 510 4.5 989 0.6
Pickens 219,926 344 289 4 293 1.4 751 0.9
Richland 340,121 531 172 7 179 3.9 1,900 0.3
Saluda 192,173 300 167 4 171 2.3 1,124 0.6
Spartanburg 265,939 416 593 30 623 4.8 427 1.5
Sumter 338,968 530 167 23 190 12.1 1,784 0.4
Union 258,111 403 426 26 452 5.8 571 1.1
Williamsburg 513,851 803 710 28 738 3.8 696 0.9
York 276,650 432 318 23 341 6.7 811 0.8
Total 14,028,896 21,920 13,348 714 14,062 5.1 998 0.6
95% confidence interval for harvest
(+-) 760 (+-) 246 (+-) 807
* Acreage shown represents the acreage of forested land and acreage of row crops considered to be significant turkey habitat within each county.
13
Table 2. County rankings based on turkey harvest per unit area in South Carolina in 2020.
County Acres* Square Gobbler Jake Total Percent Harvest Rates
Miles Harvest Harvest Harvest Jakes Ac/Turkey Turkey/Mi.2
Spartanburg 265,939 416 593 30 623 4.8 427 1.5
Fairfield 384,607 601 690 23 713 3.2 539 1.2
Union 258,111 403 426 26 452 5.8 571 1.1
Anderson 219,068 342 324 30 354 8.5 619 1.0
Laurens 317,916 497 441 26 467 5.6 681 0.9
Cherokee 156,664 245 223 7 230 3.0 681 0.9
Greenville 294,257 460 421 9 430 2.1 684 0.9
Chester 300,589 470 395 37 432 8.6 696 0.9
Williamsburg 513,851 803 710 28 738 3.8 696 0.9
Pickens 219,926 344 289 4 293 1.4 751 0.9
Abbeville 223,113 349 279 14 293 4.8 761 0.8
Bamberg 196,573 307 248 7 255 2.7 771 0.8
York 276,650 432 318 23 341 6.7 811 0.8
Newberry 317,761 497 370 14 384 3.6 828 0.8
Greenwood 204,400 319 223 23 246 9.3 831 0.8
Allendale 216,455 338 248 2 250 0.8 866 0.7
Charleston 288,732 451 319 9 328 2.7 880 0.7
Florence 397,888 622 390 23 413 5.6 963 0.7
Edgefield 246,543 385 248 7 255 2.7 967 0.7
Orangeburg 504,516 788 487 23 510 4.5 989 0.6
Calhoun 190,584 298 182 9 191 4.7 998 0.6
Lancaster 266,382 416 238 23 261 8.8 1,021 0.6
Georgetown 399,638 624 365 26 391 6.6 1,022 0.6
Lee 220,106 344 213 10 223 4.5 987 0.6
Kershaw 360,485 563 319 23 342 6.7 1,054 0.6
Marion 216,907 339 202 2 204 1.0 1,063 0.6
Hampton 324,840 508 294 11 305 3.6 1,065 0.6
Clarendon 298,087 466 268 9 277 3.2 1,076 0.6
Saluda 192,173 300 167 4 171 2.3 1,124 0.6
Horry 533,336 833 426 42 468 9.0 1,140 0.6
Berkeley 567,530 887 466 18 484 3.7 1,173 0.5
Colleton 502,666 785 395 16 411 3.9 1,223 0.5
Dorchester 302,717 473 233 9 242 3.7 1,251 0.5
McCormick 212,021 331 162 2 164 1.2 1,293 0.5
Jasper 309,889 484 233 8 241 3.3 1,286 0.5
Oconee 284,348 444 192 16 208 7.7 1,367 0.5
Chesterfield 372,478 582 243 28 271 10.3 1,374 0.5
Dillon 214,069 334 111 16 127 12.6 1,686 0.4
Beaufort 147,441 230 81 2 83 2.4 1,776 0.4
Sumter 338,968 530 167 23 190 12.1 1,784 0.4
Darlington 286,228 447 152 4 156 2.6 1,835 0.3
Richland 340,121 531 172 7 179 3.9 1,900 0.3
Marlboro 281,271 439 101 16 117 13.7 2,404 0.3
Barnwell 281,764 440 91 9 100 9.0 2,818 0.2
Lexington 280,742 439 86 7 93 7.5 3,019 0.2
Aiken 500,546 782 147 9 156 5.8 3,209 0.2
Total 14,028,896 21,920 13,348 714 14,062 5.1 998 0.6
(+-) 760 (+-) 246 (+-) 807
95% confidence interval for harvest * Acreage shown represents the acreage of forested land and acreage of row crops considered to be significant turkey habitat within each county.

14
Table 3. County rankings based on total turkeys harvested in South Carolina in 2020.
County Acres* Square Gobbler Jake Total Percent Harvest Rates
Miles Harvest Harvest Harvest Jakes Ac/Turkey Turkey/Mi.2
Williamsburg 513,851 803 710 28 738 3.8 696 0.9
Fairfield 384,607 601 690 23 713 3.2 539 1.2
Spartanburg 265,939 416 593 30 623 4.8 427 1.5
Orangeburg 504,516 788 487 23 510 4.5 989 0.6
Berkeley 567,530 887 466 18 484 3.7 1,173 0.5
Horry 533,336 833 426 42 468 9.0 1,140 0.6
Laurens 317,916 497 441 26 467 5.6 681 0.9
Union 258,111 403 426 26 452 5.8 571 1.1
Chester 300,589 470 395 37 432 8.6 696 0.9
Greenville 294,257 460 421 9 430 2.1 684 0.9
Florence 397,888 622 390 23 413 5.6 963 0.7
Colleton 502,666 785 395 16 411 3.9 1,223 0.5
Georgetown 399,638 624 365 26 391 6.6 1,022 0.6
Newberry 317,761 497 370 14 384 3.6 828 0.8
Anderson 219,068 342 324 30 354 8.5 619 1.0
Kershaw 360,485 563 319 23 342 6.7 1,054 0.6
York 276,650 432 318 23 341 6.7 811 0.8
Charleston 288,732 451 319 9 328 2.7 880 0.7
Hampton 324,840 508 294 11 305 3.6 1,065 0.6
Pickens 219,926 344 289 4 293 1.4 751 0.9
Abbeville 223,113 349 279 14 293 4.8 761 0.8
Clarendon 298,087 466 268 9 277 3.2 1,076 0.6
Chesterfield 372,478 582 243 28 271 10.3 1,374 0.5
Lancaster 266,382 416 238 23 261 8.8 1,021 0.6
Bamberg 196,573 307 248 7 255 2.7 771 0.8
Edgefield 246,543 385 248 7 255 2.7 967 0.7
Allendale 216,455 338 248 2 250 0.8 866 0.7
Greenwood 204,400 319 223 23 246 9.3 831 0.8
Dorchester 302,717 473 233 9 242 3.7 1,251 0.5
Jasper 309,889 484 233 8 241 3.3 1,286 0.5
Cherokee 156,664 245 223 7 230 3.0 681 0.9
Lee 220,106 344 213 10 223 4.5 987 0.6
Oconee 284,348 444 192 16 208 7.7 1,367 0.5
Marion 216,907 339 202 2 204 1.0 1,063 0.6
Calhoun 190,584 298 182 9 191 4.7 998 0.6
Sumter 338,968 530 167 23 190 12.1 1,784 0.4
Richland 340,121 531 172 7 179 3.9 1,900 0.3
Saluda 192,173 300 167 4 171 2.3 1,124 0.6
McCormick 212,021 331 162 2 164 1.2 1,293 0.5
Darlington 286,228 447 152 4 156 2.6 1,835 0.3
Aiken 500,546 782 147 9 156 5.8 3,209 0.2
Dillon 214,069 334 111 16 127 12.6 1,686 0.4
Marlboro 281,271 439 101 16 117 13.7 2,404 0.3
Barnwell 281,764 440 91 9 100 9.0 2,818 0.2
Lexington 280,742 439 86 7 93 7.5 3,019 0.2
Beaufort 147,441 230 81 2 83 2.4 1,776 0.4
Total 14,028,896 21,920 13,348 714 14,062 5.1 998 0.6
(+-) 760 (+-) 246 (+-) 807

15
Table 4. Estimated number of turkey hunters, average days hunted, and total hunting effort in SC in 2020.
County Total Number Avg. Days Total
Harvest Hunters Hunted Man/Days
Abbeville 293 1,091 5.8 6,339
Aiken 156 850 5.8 4,949
Allendale 250 609 6.4 3,871
Anderson 354 1,245 5.1 6,286
Bamberg 255 682 5.7 3,898
Barnwell 100 408 6.4 2,614
Beaufort 83 294 4.8 1,423
Berkeley 484 1,251 6.7 8,401
Calhoun 191 609 5.9 3,579
Charleston 328 1,164 5.8 6,751
Cherokee 230 689 7.8 5,354
Chester 432 1,485 6.8 10,064
Chesterfield 271 703 7.5 5,255
Clarendon 277 723 6.2 4,503
Colleton 411 1,050 7.3 7,716
Darlington 156 509 6.0 3,060
Dillon 127 241 6.4 1,550
Dorchester 242 682 6.2 4,250
Edgefield 255 903 6.7 6,053
Fairfield 713 2,288 6.6 15,066
Florence 413 1,024 6.4 6,545
Georgetown 391 890 5.3 4,689
Greenville 430 1,372 5.0 6,864
Greenwood 246 897 5.5 4,969
Hampton 305 923 6.0 5,574
Horry 468 1,064 6.4 6,818
Jasper 241 495 6.4 3,146
Kershaw 342 1,004 6.0 6,046
Lancaster 261 863 6.9 5,946
Laurens 467 1,733 6.5 11,228
Lee 223 616 5.5 3,392
Lexington 93 482 4.3 2,082
McCormick 164 736 6.2 4,556
Marion 204 468 6.5 3,066
Marlboro 117 301 6.6 1,976
Newberry 384 1,686 6.1 10,203
Oconee 208 796 7.2 5,694
Orangeburg 510 1,345 6.2 8,275
Pickens 293 897 6.1 5,487
Richland 179 776 6.3 4,889
Saluda 171 743 5.9 4,350
Spartanburg 623 1,633 7.0 11,467
Sumter 190 816 5.3 4,363
Union 452 1,546 6.6 10,223
Williamsburg 738 1,352 6.2 8,314
York 341 1,231 6.5 8,008
Total 14,062 43,164 6.3* 269,154
*Note - Since individuals hunt multiple counties the average number of days hunted per county varies from the
average number of days individuals hunt (8.4 days).

16
Figure 1. South Carolina Department of Natural Resources 2020 Turkey Hunter Survey.

17
Figure 1. continued

18
Figure 2. Spring wild turkey harvest in South Carolina 1982-2020. Harvest increased (R2 = 0.92)
between 1982 and 2002 because of increasing turkey population during restoration efforts. Since 2002
harvest has generally declined likely due to less than desirable annual recruitment.
Figure 3. Summer wild turkey recruitment ratio in South Carolina 1982-2019. Note declining trend
since 1988. Average recruitment prior to 1988 = 3.5. Average recruitment since 1988 =
2.1. This represents a 40 percent decrease in average recruitment.

19
Figure 4. Percentage of gobblers harvested by period of season in South Carolina in 2020.
Figure 5. Percentage of gobblers harvested by period of season with March 22-April 30 framework in
Game Zones 3 & 4 (coastal plain) in South Carolina in 2020.
Figure 6. Percentage of gobblers harvested by period of season with April 1-May 10 framework in
Game Zones 1 & 2 (piedmont and mountains) in South Carolina in 2020.

20
Figure 7. Hunter success during the spring turkey season in South Carolina in 2020. Overall success
was 27 percent at harvesting at least one gobbler.
Figure 8. Relative contribution to the total turkey harvest by hunters taking between 1 and 3 gobblers
in South Carolina in 2020.

21
2020 SC WILD TURKEY SUMMER SURVEY
Annually since the early 1980’s, the S.C. Department of Natural Resources (DNR) has conducted a
Summer Turkey Survey to estimate reproduction and recruitment of wild turkeys in South Carolina.
The survey involves agency wildlife biologists, technicians, and conservation officers, as well as many
volunteers from other natural resource agencies and the general public. The 2020 survey involved
approximately 195 participants recording 1,058 unique observations, seeing approximately 6,300
turkeys across the state in July and August. Although wild turkeys nest primarily in April and May in
South Carolina, the survey does not take place until late summer. Therefore, the survey statistics
document poults (young turkeys) that have survived and have a high probability of entering the fall
population (Table 1).
Wild turkey productivity is assessed by observations of reproduction and associated survival of
offspring being recruited into the population. This measure of young entering the population based on
the number of hens in the population is the Total Recruitment Ratio (TRR). This annual index is the
most practical measure of productivity because it considers successful hens, unsuccessful hens, and
poult survival. Recruitment of four or more poults per hen is considered excellent, three is good, two
is fair and considered a break-even point, and one or less poults per hen is poor. If hens are successful
at some level, a turkey population can be maintained. However, the goal is to optimize conditions
through management applications to promote optimal reproductive success and turkey populations that
provide sustainable, quality turkey hunting opportunities into the future. Unlike deer, wild turkeys are
much more susceptible to significant fluctuations in reproduction and recruitment. Lack of
reproductive success is often associated with bad weather (cold and wet) during nesting and brood
rearing season. However, there are a host of predators that take advantage of turkey nests and broods
including: raccoons, opossums, skunks, armadillos, snakes, foxes, coyotes, bobcats, feral hogs, and
numerous avian predators including hawks, owls, and crows.
South Carolina has experienced declines in turkey productivity since 1988. Average recruitment prior
to 1988 was 3.5 poults per hen. Average recruitment since 1988 has been 2.1, representing a 40
percent decrease in average recruitment. Coincidentally, the turkey harvest has decreased over 40
percent since it peaked in 2002. This has been a slow and steady decline with TRR numbers in the
1990’s generally between 2 and 3, but since 2005 numbers below 2.0 have been the norm with an
average TRR the last 15 years of 1.7 (Figure 2). The 2020 statewide TRR was 1.5. For hens that
successfully raise a brood, average brood sizes of 3.5 to 4 poults have remained consistent over time.
However, the driving factor in the low productivity is the high percentage of hens that have no poults
at all by late summer. Sixty percent (60%) of hens observed during this survey period had no poults
and that figure has averaged 57 percent the last five years (Table 2). By comparison, the percentage of
hens with no poults averaged only 39 percent from 1982 to 2010. Hens without poults are considered
unsuccessful and either did not attempt to nest, abandoned their nest, lost their nest to predation or
human disturbance, or had no poults survive due to predation, exposure, starvation, disease, or
flooding.
These TRR figures consistently below 2.0 are indicative of a shrinking population which does not pair
well with increasing hunter numbers and hunter effort. It is also worth noting that turkeys have high
reproductive potential and are normally able to maintain populations despite predation and weather-
related factors. Predators and periodic poor weather conditions existed prior to the year 2000 so this
more recent and prolonged poor success may be tied to a high number of hens that did not breed
successfully or poor fitness, vigor and survival of poults due to genetics, disease, other environmental

22
factors or large-scale changes in habitat. Continued research and attention to season timing and other
potential contributing factors is needed.
It is also worth noting that both short and long-term fluctuations up and down are not unexpected given
the reproductive strategy of turkeys and the multiple factors that influence their success and survival.
This inherent instability is the reason that annual monitoring is critical for this species.
Anyone interested in participating in the annual Summer Turkey Survey is encouraged to sign-up. The
survey period is July 1-August 29 annually and those who participate typically spend a reasonable
amount of time outdoors during that period. Cooperators obviously must be able to identify wild
turkeys and must be comfortable in telling the difference between hens, poults, and gobblers. If you
would like to participate in the survey, contact Jay Cantrell at [email protected]. You will be added
to the cooperator list and receive materials at the end of June annually. Those interested in the survey
can also download instructions and survey forms at the following website:
http://www.dnr.sc.gov/wildlife/turkey/volunbroodsurvey.html
Figure 1. Map of physiographic regions for 2020 Summer Turkey Survey.
Piedmont and
Mountains (PMT)
Midlands (Mid)
Northern Coastal
Plain (NCP)
Southern Coastal
Plain (SCP)

23
Table 1. Summary of reproductive data for 2020 Summer Turkey Survey by region.
Table 2. Statewide Summer Turkey Survey reproductive data 2016-2020.
Figure 2. Summer wild turkey recruitment ratio in South Carolina 1982-2020.
Note the declining trend since 1988. Average recruitment prior to 1988 = 3.5.
Average recruitment since 1988 = 2.1. This represents a 40 percent decrease in average recruitment.
0
0.5
1
1.5
2
2.5
3
3.5
4
4.5
5
1980 1985 1990 1995 2000 2005 2010 2015 2020
RE
CR
UIT
ME
NT
R
AT
IO
YEAR

24
SUMMARY OF CURRENT WILD TURKEY RESEARCH IN SOUTH CAROLINA
SCDNR is contributing funding and cooperating on a study entitled “Reproductive Ecology of
Wild Turkeys in an Unhunted Population.” This is a joint project between SCDNR, USDA
Forest Service-Southern Research Station, University of Georgia, Louisiana State University,
and University of Missouri. This research is occurring on the Savannah River Site (SRS), and is
focused on evaluating reproductive ecology of a population of wild turkeys not exposed to
hunting. Specific objectives include:
1. Determining space use, habitat selection, and survival of male and female wild turkeys
2. Assessing nesting and brooding ecology of female wild turkeys, with a focus on
thoroughly describing nesting chronology and behavior of females during laying,
incubating, and brooding.
3. Describing vegetative and habitat characteristics associated with nest sites and areas used
by brooding females.
4. Spatially and temporally describing gobbling activity and relating gobbling activity to
nesting chronology of females and movement ecology of males.
5. Evaluating the genetic mating system of wild turkeys and describe patterns of parentage
in clutches of females.
These research objectives have been studied on several other study sites across the Southeast in
recent years on populations subjected to hunting (i.e. the recent SCDNR funded project at the
Webb Wildlife Center). By conducting parallel research on an unhunted population, we will be
able to better assess the impacts of hunting on wild turkeys.
To date, 116 birds (62 females, 54 males) have been captured and banded. 80 of these birds
were marked with GPS transmitters. This project will continue until 2024 and findings will be
provided as they become available.
A 3-year cooperative study is nearing completion with Clemson University. The project is
assessing variation of chronology of wild turkey gobbling in the Upstate of South Carolina using
38 autonomous recording units (ARUs) on public and private lands in the foothills/mountains.
The goal is to quantify turkey gobbling chronology and occupancy in relation to latitude,
elevation, and habitat within the Upstate of South Carolina. The results of this project combined
with gobbling chronology data from coastal plain study areas which include SRS, Crackerneck
WMA and the Webb Wildlife Center will provide quantifiable differences in the timing and
amount of gobbling activity across different latitudes, elevations, and hunting regimes in the
state.

25
SCDNR funded and collaborated on an in-depth mail survey and analysis that was conducted in
2019 by Dr. Shari Rodriguez at Clemson University. This project was designed to gain a better
understanding of turkey hunter satisfaction in South Carolina and Wildlife Management Area
(WMA) use for turkey hunting in the state.
Input from turkey hunter stakeholders is key for SCDNR to remain a well-informed management
agency. The goal of this study was to learn more about SC WMA turkey hunters, as well as
provide them with a formal outlet to express their level of satisfaction and their concerns
regarding turkey hunting in the state. Specifically, the objectives were to 1) determine WMA
turkey hunter opinions on turkey hunting quality in SC, 2) understand what factors influence
their satisfaction, dissatisfaction, and success, 3) assess their perceptions of recent turkey
population trends, and 4) identify any significant differences between lottery hunt and open
access hunting regimes. A final report is available.
SCDNR is cooperating on a project to assess the diet of coyotes in South Carolina through non-
invasive genetic sampling and DNA metabarcoding. This study is part of a larger coyote
abundance estimation project underway with the University of Georgia and Savannah River
Ecology Lab, using coyote fecal samples collected from sites across South Carolina. The project
will analyze these samples for species-specific prey found within each fecal sample through
DNA metabarcoding. As part of this analysis we will be able to estimate the percentage of wild
turkeys in coyote diets during the spring and summer (nesting and brood rearing season).