WIL AR2011 all sections - Bombay Stock Exchange · DIRECTORS' REPORT To, The Members, WELSPUN INDIA...
135
Transcript of WIL AR2011 all sections - Bombay Stock Exchange · DIRECTORS' REPORT To, The Members, WELSPUN INDIA...

2
4
8
18
30
54
Contents
Corporate Information
Chairman’s Statement
Directors' Report
Corporate Governance Report
Management Discussion and Analysis
Financial Section
Forward looking statement
In this Annual Report we have disclosed forward-looking information to enable investors to comprehend our prospects and take
informed investment decisions. This report and other statements that set out anticipated results based on the management's
plans and assumptions. We have tried wherever possible to identify such statements by using words as 'anticipate', 'estimate',
'expects', 'projects', 'intends', 'plans', 'believes', and words of similar substance in connection with any discussion of future
performance. We cannot guarantee that these forward-looking statements will be realized, although we believe we have been
prudent in assumptions. Should known or unknown risks or uncertainties materialize, or should underlying assumptions prove
inaccurate, actual results could vary materially from those anticipated, estimated or projected. Readers should bear this in
mind. We undertake no obligation to publicity update any forward-looking statements, whether as a result of new information,
future events or otherwise.
EBelieve in YOU
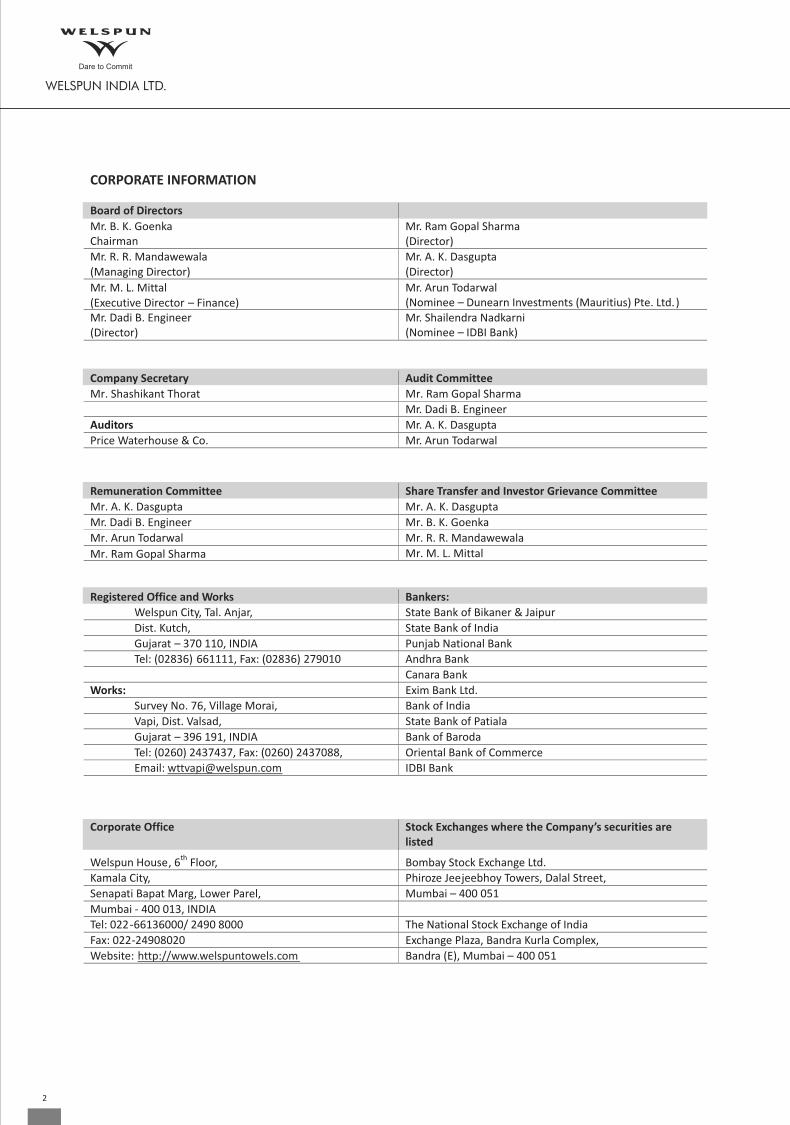
CORPORATE INFORMATION
Board of Directors
Mr. B. K. GoenkaChairman
(Nominee –Mr. Arun Todarwal
Dunearn Investments (Mauritius) Pte. Ltd.)
Mr. Dadi B. Engineer(Director)
Mr. Ram Gopal Sharma
(Director)
Mr. A. K. Dasgupta(Director)
Mr. R. R. Mandawewala(Managing Director)
Mr. M. L. Mittal
(Executive Director – Finance)
Company Secretary
Audit Committee
Mr. Shashikant Thorat
Mr. Ram Gopal Sharma
Mr. Dadi B. Engineer
Auditors
Mr. A. K. Dasgupta
Price Waterhouse & Co. Mr. Arun Todarwal
Remuneration Committee
Share Transfer and Investor Grievance Committee
Mr. A. K. Dasgupta
Mr. A. K. Dasgupta
Mr. Dadi B. Engineer
Mr. B. K. Goenka Mr. Arun Todarwal
Mr. Ram Gopal Sharma Mr. R. R. Mandawewala
Mr. M. L. Mittal
Registered Office and Works
Bankers: Welspun City, Tal. Anjar,
State Bank of Bikaner & Jaipur
Dist. Kutch,
State Bank of India Gujarat – 370 110, INDIA
Punjab National Bank
Tel: (02836) 661111, Fax: (02836) 279010
Andhra Bank Canara Bank Works:
Exim Bank Ltd.
Survey No. 76, Village Morai,
Bank of India
Vapi, Dist. Valsad,
State Bank of Patiala
Gujarat – 396 191, INDIA
Bank of Baroda
Tel: (0260) 2437437, Fax: (0260) 2437088,
Oriental Bank of Commerce
Email: [email protected]
IDBI Bank
Corporate Office Stock Exchanges where the Company’s securities are listed
Welspun House, 6th
Floor, Bombay Stock Exchange Ltd. Kamala City, Phiroze Jeejeebhoy Towers, Dalal Street, Senapati Bapat Marg, Lower Parel, Mumbai – 400 051 Mumbai - 400 013, INDIA Tel: 022-66136000/ 2490 8000 The National Stock Exchange of India Fax: 022-24908020 Exchange Plaza, Bandra Kurla Complex,
Website: http://www.welspuntowels.com Bandra (E), Mumbai – 400 051
(Nominee –Mr. Shailendra Nadkarni
IDBI Bank)
2

* Not a member of the Board of Directors
Key Management Team
Mr. B. K. Goenka Chairman
Mr. R.R. Mandawewala DirectorManaging
Mr. M.L. Mittal Executive Director (Finance)
Ms. Dipali Goenka*Executive Director
Mr. Bharat B Sharma *Director, Operations,
WIL Anjar
Mr. Swapan S Nath*Director, Operations
WIL Vapi
Mr. Akhil Jindal*Director,
Corporate Affairs
3
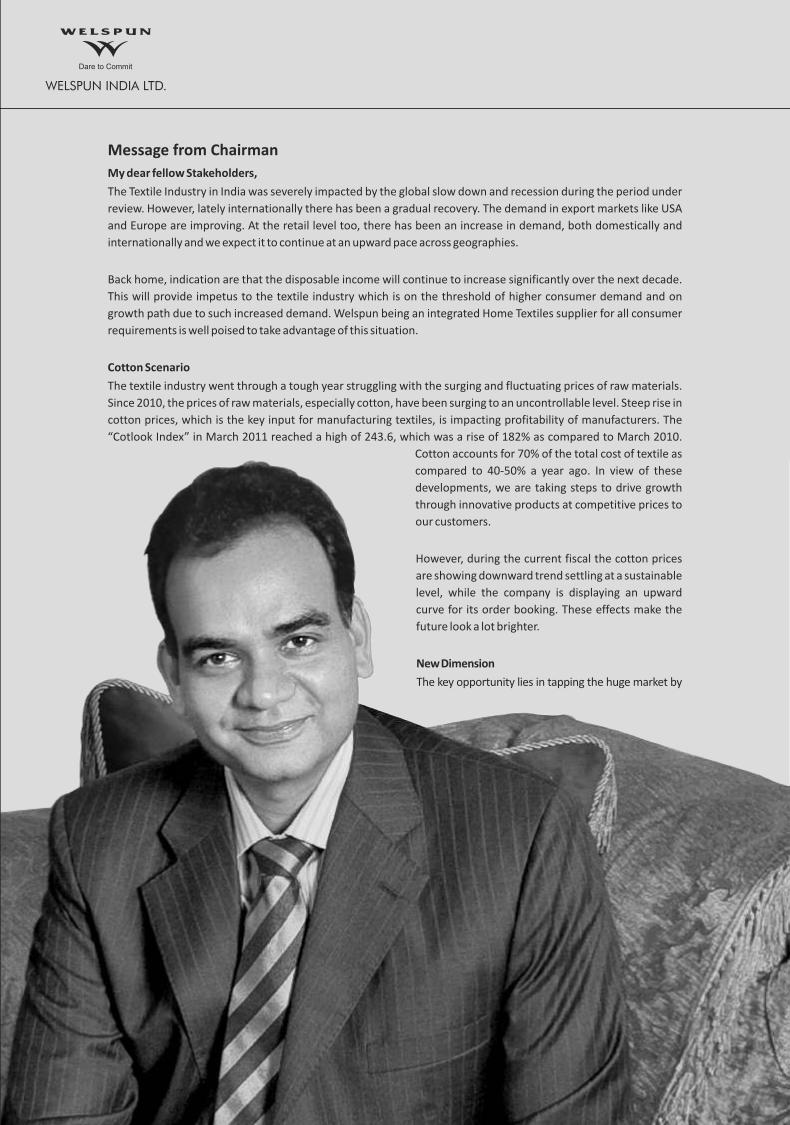
My dear fellow Stakeholders,
The Textile Industry in India was severely impacted by the global slow down and recession during the period under
review. However, lately internationally there has been a gradual recovery. The demand in export markets like USA
and Europe are improving. At the retail level too, there has been an increase in demand, both domestically and
internationally and we expect it to continue at an upward pace across geographies.
Back home, indication are that the disposable income will continue to increase significantly over the next decade.
This will provide impetus to the textile industry which is on the threshold of higher consumer demand and on
growth path due to such increased demand. Welspun being an integrated Home Textiles supplier for all consumer
requirements is well poised to take advantage of this situation.
Cotton Scenario
The textile industry went through a tough year struggling with the surging and fluctuating prices of raw materials.
Since 2010, the prices of raw materials, especially cotton, have been surging to an uncontrollable level. Steep rise in
cotton prices, which is the key input for manufacturing textiles, is impacting profitability of manufacturers. The
“Cotlook Index” in March 2011 reached a high of 243.6, which was a rise of 182% as compared to March 2010.
Cotton accounts for 70% of the total cost of textile as
compared to 40-50% a year ago. In view of these
developments, we are taking steps to drive growth
through innovative products at competitive prices to
our customers.
However, during the current fiscal the cotton prices
are showing downward trend settling at a sustainable
level, while the company is displaying an upward
curve for its order booking. These effects make the
future look a lot brighter.
New Dimension
The key opportunity lies in tapping the huge market by
Message from Chairman
leveraging the brand and our extensive presence across the globe. Having a distinction of being one of the Top 3 Home
Textiles Manufacturers in the World, and with our products sold across 32 countries; we have added yet another feather in
our cap by acquiring the assets of KOJO Worldwide - the most recognized name in the Hospitality Industry- for soft goods in
the US, Mexico, Canada and Latin America. Along with KOJO, we are in a position within the hospitality industry to provide
a “Total Soft Goods Solution” from linens and towels to decorative beddings to window treatments of all types.
We will now provide our current and future customers with a single manufacturing source which will streamline their
design, purchasing and ordering needs coupled with a state-of-the- art “real time” B2B purchasing system. The benefits to
the customer will also accrue, from the innovative hospitality soft goods design capabilities acquired from KOJO
Worldwide. Together with KOJO we will provide the first-ever vertical of total soft goods solution for the hospitality
industry, by controlling the growing of cotton to product designs, to lab testing, to forecasting, to purchasing and
delivering, these quality soft goods products to the customers’ doorstep through an established global logistics
network.
Moreover, we also launched the catalogue business in UK which is getting good response from the customers. To leverage
the proximity of scale we recently shifted our bedding facility from Ciudad de Juarez to Rosarito in Mexico. With its
proximity to San Diego, the facility is geographically closer to the US market, which is one of the largest markets for our
fashion bedding and basic bedding product categories. With this move we will be able to save on transportation costs and
will be able to delivery our products faster to the end customers in the US. Additionally, we will also benefit from the import
duty exemption in the US under NAFTA (North American Free Trade Agreement).
Product Development and Innovation
We believe that product development and innovation are the two key areas to create a sustainable competitive
advantage. With the cotton prices sky rocketing alternate fibers and blends are being looked at as an option to counter the
extreme proportions that cotton prices have attained. Being the pioneers in textile industry, extra emphasis is given on
product innovation and technological excellence. Using inputs from consumer research and through tracking the new
developments, we have added new towel products like nanospun, eco-lite (quick dry), cotton bamboo, eucalyptus and
texture towels to our product base.
On the Bed Linen front, we have added products like Ever Smooth MXL Wrinkle Free, Quick Dry Sheets, Flexifit Sheets and
the Perfect Sheet incorporating all the qualities mentioned earlier. Altogether, we have one registered product patent and
seven trademarks under our name.
Corporate Social Responsibility
With our commitments firmly rooted into Corporate Sustainability and Social Responsibility, we as an organisation,
constantly commit ourselves towards the betterment of the society where we resides in.
It was yet another golden moment for Welspun when we were honoured for India Shining CSR Award – “Outstanding CSR
in Textile Sector” at the CSR Thought Leadership Conclave hosted by Wockhardt – a pharmaceutical giant. The award
ceremony was graced by many notable personalities such as Noble Peace Laureate - His Holiness Dalai Lama, Noble Peace
Laureate - Prof. Muhammad Yunus and Cabinet Minister for Minority Affairs and Water Resources, Government of India,
Dr. Salman Khurshid. This award is a testimony to the good work that we as a company are trying to do for the community
and I hope that we continue with this noble cause.
In conclusion, I would like to heartily thank our investors, the Board, the management, our dedicated employees
and the community at large for their consistent support and commitment to Welspun; as well as our esteemed
customers for their confidence on us.
B. K. Goenka
Chairman

Elive your dream
Houses are all about how much room is given for imagination. Every individual has this dream of owning the most beautiful house and we at Welspun help you to live this dream by designing the best of home furnishings.

DIRECTORS' REPORT
To,
The Members,
WELSPUN INDIA LIMITED
Your directors have pleasure in presenting their 26th Annual Report on the Audited Financial Statements of the Company for
the financial year ended March 31, 2011.
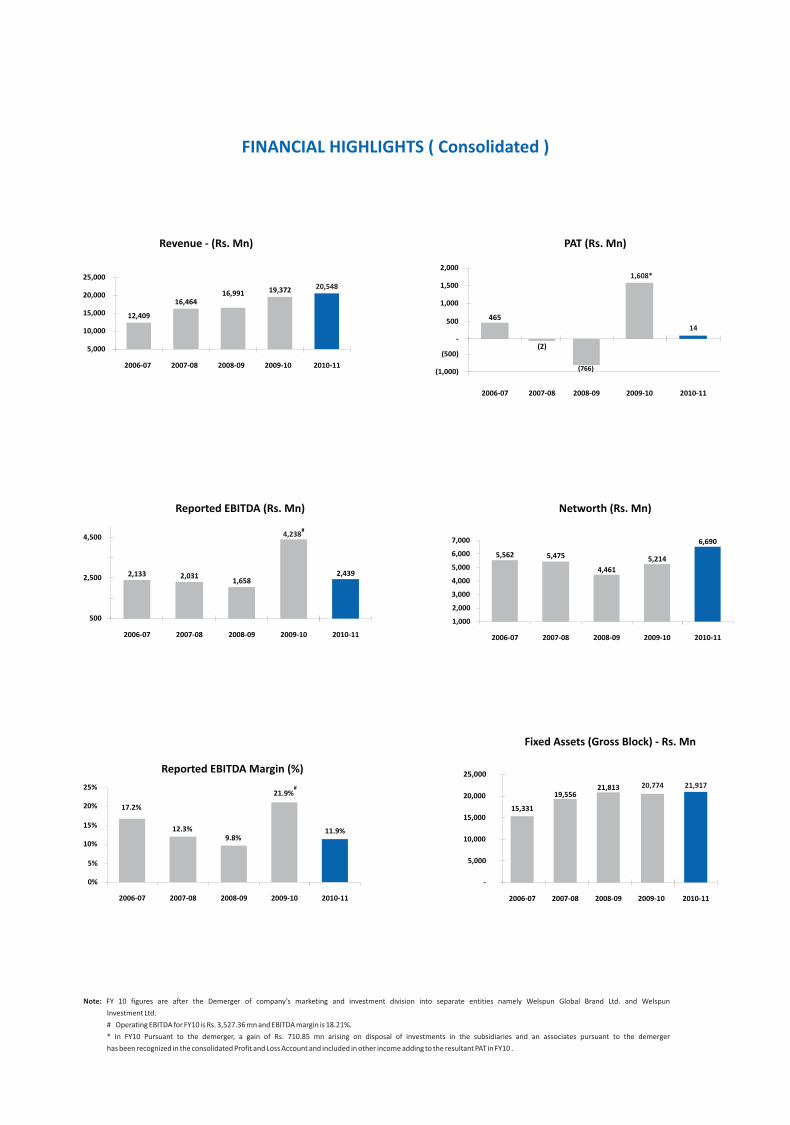
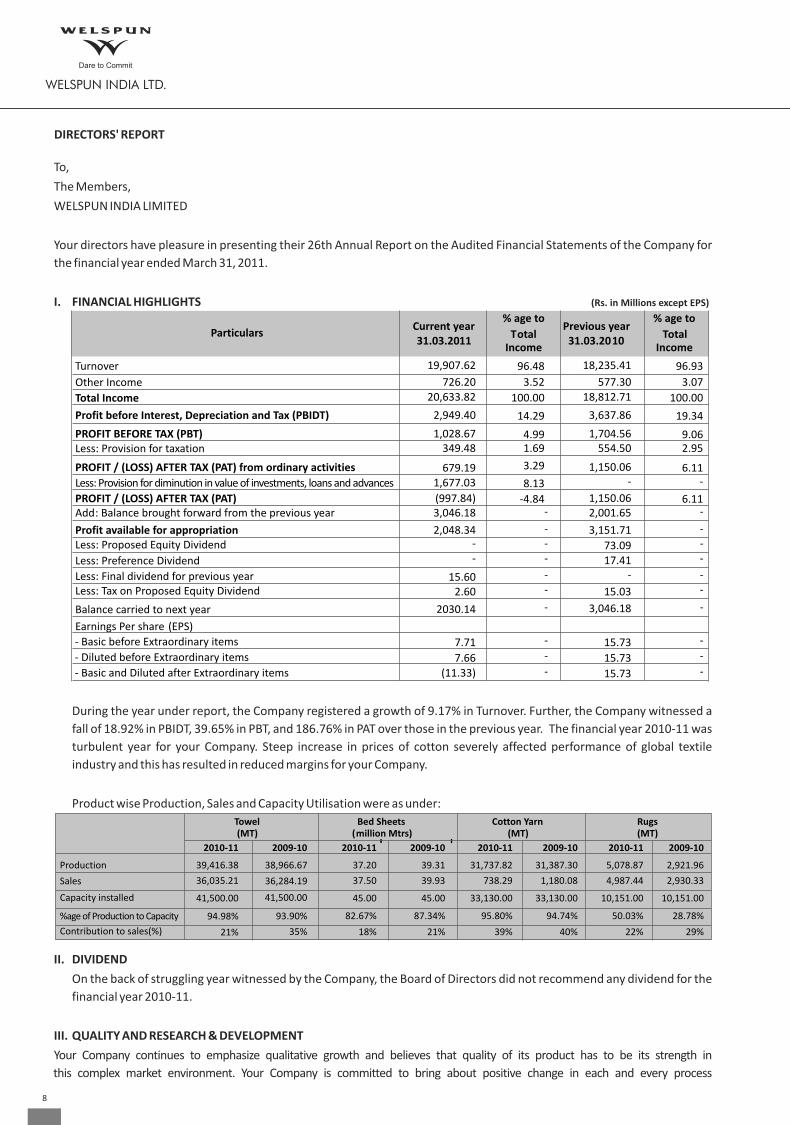
I. FINANCIAL HIGHLIGHTS
During the year under report, the Company registered a growth of 9.17% in Turnover. Further, the Company witnessed a
fall of 18.92% in PBIDT, 39.65% in PBT, and 186.76% in PAT over those in the previous year. The financial year 2010-11 was
turbulent year for your Company. Steep increase in prices of cotton severely affected performance of global textile
industry and this has resulted in reduced margins for your Company.
Product wise Production, Sales and Capacity Utilisation were as under:
II. DIVIDEND
On the back of struggling year witnessed by the Company, the Board of Directors did not recommend any dividend for the
financial year 2010-11.
III. QUALITY AND RESEARCH & DEVELOPMENT
Your Company continues to emphasize qualitative growth and believes that quality of its product has to be its strength in
this complex market environment. Your Company is committed to bring about positive change in each and every process
Towel
(MT) Bed Sheets
(million Mtrs) Cotton Yarn
(MT) Rugs
(MT)
2009-10
38,966.67 36,284.19
41,500.00
2009-102010-11 2009-102010-11 2009-102010-11
37.20
37.50
45.00
39.31
39.93
45.00
31,737.82
738.29
33,130.00
31,387.30
1,180.08
33,130.00
5,078.87
4,987.44
10,151.00
2,921.96
2,930.33
10,151.00
93.90%
35%
82.67%
18%
87.34%
21%
95.80%
39%
94.74%
40%
50.03%
22%
28.78%
29%
(Rs. in Millions except EPS)
Particulars Current year31.03.2011
% age to
Total Income
Previous year 31.03.2010
% age to
Total Income
Turnover 19,907.62
726.2020,633.82
2,949.40
1,028.67349.48
679.191,677.03
(997.84)3,046.18
2,048.34--
15.602.60
2030.14
7.71
7.66(11.33)
96.48
3.52
100.00
14.29
4.991.69
3.29
8.13
-4.84
18,235.41
577.3018,812.71
3,637.86
1,704.56554.50
1,150.06-
1,150.062,001.65
3,151.71
73.0917.41
-
15.03
3,046.18
15.73
15.73
15.73
96.93
3.07
100.00
19.34
9.062.95
6.11-
6.11
Other Income
Total Income
Profit before Interest, Depreciation and Tax (PBIDT)
PROFIT BEFORE TAX (PBT)Less: Provision for taxation
PROFIT / (LOSS) AFTER TAX (PAT) from ordinary activities
Less: Provision for diminution in value of investments, loans and advances
Add: Balance brought forward from the previous year - -
Profit available for appropriation - - Less: Proposed Equity Dividend - -
Less: Preference Dividend
Less: Final dividend for previous year
- -
Less: Tax on Proposed Equity Dividend - -
Balance carried to next year -
-
Earnings Per share
- Basic before Extraordinary items
- Diluted before Extraordinary items
- Basic and Diluted after Extraordinary items
(EPS) - -
PROFIT / (LOSS) AFTER TAX (PAT)
--
-
-
-
-
Production Sales
39,416.38
36,035.21
41,500.00
94.98%
21%
Capacity installed
2010-11
%age of Production to Capacity
Contribution to sales(%)
8

and has a team fully focused on Research & Development. Particulars of activities relating thereto have been given in Annexure II
hereto.
IV. DIRECTORS
In the ensuing Annual General Meeting, Mr. Dadi B. Engineer and Mr. A. K. Dasgupta will be retiring by rotation and being
eligible have offered themselves to be reappointed. Mr. Dadi B. Engineer and Mr. A. K. Dasgupta are independent
directors. Further, details about these directors are given in the Notice of the ensuing Annual General Meeting being sent
to the shareholders along with this report. The Board recommends their reappointment.
V. ENERGY, TECHNOLOGY AND FOREIGN EXCHANGE
Information in accordance with the provisions of Section 217 (1) (e) of the Companies Act, 1956, read with Companies
(Disclosure of Particulars in the Report of Board of Directors) Rules, 1988, regarding conservation of energy, technology
absorption and foreign exchange earnings and outgo is given in the Annexure I forming part of this report.
VI. SUBSIDIARY COMPANIES:
The Ministry of Corporate Affairs vide its General Circular No. 2 / 2011 dated 8th February, 2011 granted general
exemption to companies from attaching a copy of the Balance Sheet, the Profit and Loss Account and other documents of
their subsidiary companies as required to be attached under Section 212 of the Companies Act, 1956 to the Balance Sheet
of companies subject to fulfillment of conditions stipulated in the circular. Therefore, the said Reports of the subsidiary
companies viz. Welspun AG, Switzerland Welspun Mexico SA de CV, Mexico and Besa Developers and Infrastructure
Private Limited, India, are not attached herewith. However, a statement giving certain information as required by the
Ministry is placed along with the Consolidated Accounts.
The Company shall provide a copy of Annual Report and other documents of its subsidiary companies as required under
section 212 of the Companies Act to the shareholders upon their request, free of cost.
VII. AUDITORS’ REPORT:
Report of M/s. Price Waterhouse & Co., the Statutory Auditors, on the Audited Financial Statements of the Company for
the financial year ended March 31, 2011 contains a qualification regarding the accounts receivables balance of Rs. 696.02
million (March 31, 2010: Rs. 475.93 million) that is due from Welspun Retail Limited ("WRL"), a group company, as at
March 31, 2011, in relation to which no valuation allowance has been estimated and adjusted in these financial
statements which, in the statutory auditors’ view, does not meet the requirement to consider prudence in selection of
accounting policies, as set out in Accounting Standard 1 – Disclosure of Accounting Policies, as WRL has been incurring
significant losses (Rs.199.73 million for the year ended March 31, 2011 and Rs. 1,205.96 million as at March 31, 2011 basis
its audited financial statements as of and for the year ended March 31, 2011) and has also been unable to achieve its
projected financial results in the previous and current financial reporting periods. The Company is of the view that, in order
to turnaround WRL's operations, WRL has made a robust plan for widening its reach in the market by using new
marketing strategies with aggressive cost reduction programs. Accordingly, in the opinion of the Management, the
aforesaid accounts receivable as at March 31, 2011 is considered good and recoverable.
VIII. FIXED DEPOSIT
During the year under review, your Company has not accepted any fixed deposit within the meaning of Section 58-A of the
Companies Act, 1956 and the Rules made thereunder.
IX. EMPLOYEE STOCK OPTION SCHEME:
The particulars required to be disclosed pursuant to Clause 12 of SEBI (Employee Stock Option Scheme and Employee
Stock Purchase Scheme) Guidelines, 1999 are as under:
On June 30, 2009, the Company issued 22,65,000 Employee Stock Options under the Employee Stock Options Scheme (the
“Scheme”) to employees of the Company and its subsidiaries with a right to subscribe to equity shares at a price of Rs.
35.60 per equity share (closing market price as on June 30, 2009). The stock option can be exercised during a period of 3
years from the date of vesting. The dates of vesting of options are June 30, 2010 (20%), June 30, 2011 (20%), June 30, 2012
(30%) and June 30, 2013 (30%). 9
The Company has adopted intrinsic value method for the valuation and accounting of the aforesaid stock options as per
SEBI guidelines. Since the grants were made at an exercise price equal to the closing market price at the time of grant, no
amount was required to be accounted as employee compensation cost. The fair value of the options as per the “Black
Scholes” model comes to Rs. 17.49 per option. Had the company valued and accounted the aforesaid options as per the
“Black Scholes” model, the employee compensation cost would have been higher by Rs. 9.11 mn, the Profit After Tax for
the year would have been lower by Rs. 6.27 mn, the basic loss per share would have been higher by Re. 0.07 and diluted
loss per share would have been higher by Re. 0.07, respectively.
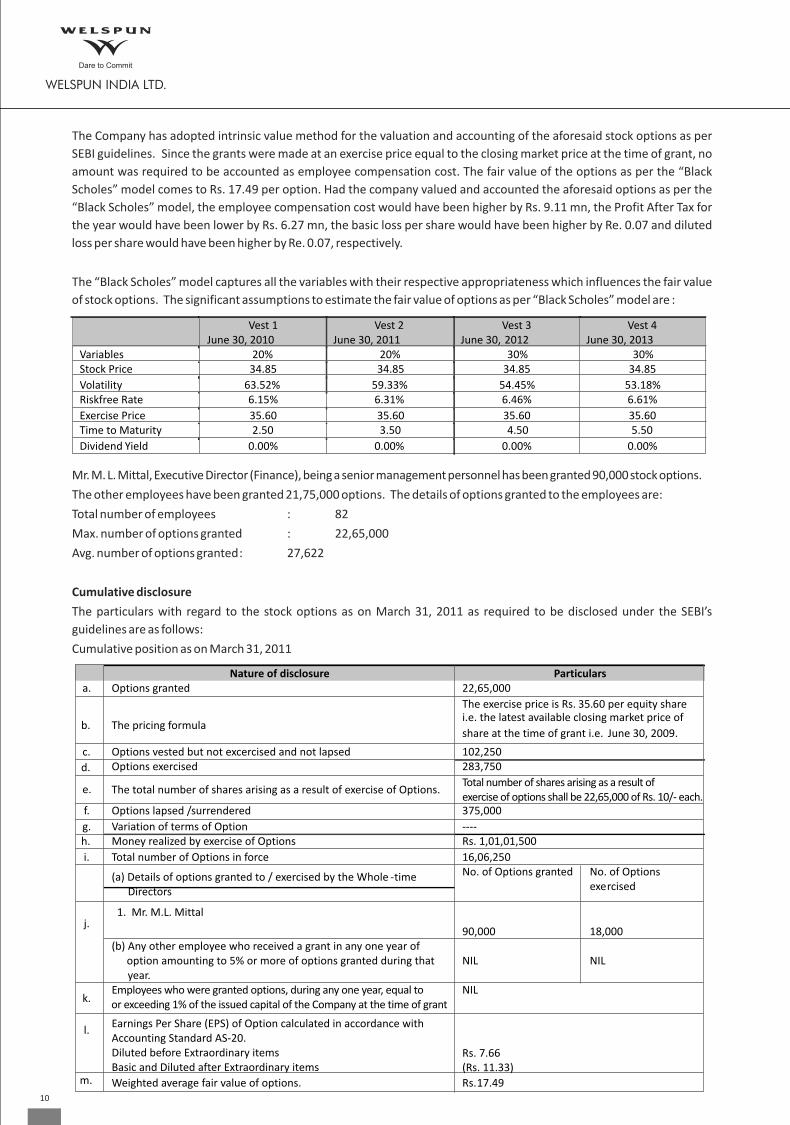
The “Black Scholes” model captures all the variables with their respective appropriateness which influences the fair value
of stock options. The significant assumptions to estimate the fair value of options as per “Black Scholes” model are :
Mr. M. L. Mittal, Executive Director (Finance), being a senior management personnel has been granted 90,000 stock options.
The other employees have been granted 21,75,000 options. The details of options granted to the employees are:
Total number of employees : 82
Max. number of options granted : 22,65,000
Avg. number of options granted: 27,622
Cumulative disclosure
The particulars with regard to the stock options as on March 31, 2011 as required to be disclosed under the SEBI’s
guidelines are as follows:
Cumulative position as on March 31, 2011
Nature of disclosure Particulars a. Options granted 22,65,000
b. The pricing formula
c. Options vested but not excercised and not lapsed 102,250
d. Options exercised 283,750
e. The total number of shares arising as a result of exercise of Options. Total number of shares arising as a result of exercise of options shall be 22,65,000 of Rs. 10/- each.
f. Options lapsed /surrendered
g. Variation of terms of Option h. Money realized by exercise of Options
i. Total number of Options in force (a) Details of options granted to / exercised by the Whole -time Directors
1. Mr. M.L. Mittalj.
(b) Any other employee who received a grant in any one year of option amounting to 5% or more of options granted during that year.
k.
Employees who were granted options, during any one year, equal to or exceeding 1% of the issued capital of the Company at the time of grant
l. Earnings Per Share (EPS) of Option calculated in accordance with Accounting Standard AS-20.Diluted before Extraordinary itemsBasic and Diluted after Extraordinary items
m.
Weighted average fair value of options.
Vest 1 June 30, 2010
Vest 2 June 30, 2011
Vest 3 June 30, 2012
Vest 4 June 30, 2013
Variables 20% 20% 30% 30% Stock Price 34.85 34.85 34.85 34.85
Volatility 63.52% 59.33% 54.45% 53.18% Riskfree Rate 6.15% 6.31% 6.46% 6.61%
Exercise Price 35.60 35.60 35.60 35.60 Time to Maturity 2.50 3.50 4.50 5.50
Dividend Yield 0.00% 0.00% 0.00% 0.00%
375,000
---- Rs. 1,01,01,500
16,06,250 No. of Options granted No. of Options
exercised
90,000
18,000
NIL NIL
NIL
Rs.17.49
Rs. 7.66(Rs. 11.33)
The exercise price is Rs. 35.60 per equity share i.e. the latest available closing market price of
share at the time of grant i.e. June 30, 2009.
10
As required by the provisions of Section 217(2A) of the Companies Act, 1956 read with the Companies (Particulars of
Employees) Rules, 1975 as amended, the names and other particulars of the employees are set out in the Annexure to the
Directors’ Report. However, as per the provisions of Section 219(1)(b)(iv) of the Companies Act, 1956, the Report and
Accounts is being sent to all the shareholders of the Company excluding the aforesaid information. Any shareholder
interested in obtaining such particulars may write to the Company Secretary at the Registered Office of the Company.
IX. DIRECTORS' RESPONSIBILITY STATEMENT
Pursuant to the requirement under section 217(2AA) of the Companies Act, 1956, with respect to Directors’ Responsibility
Statement, it is hereby confirmed:
(i) That in the preparation of the accounts for the financial year ended March 31, 2011, the applicable accounting
standards have been followed alongwith proper explanation relating to material departures;
(ii) That the Directors have selected such accounting policies and applied them consistently and made judgements and
estimates that were reasonable and prudent so as to give a true and fair view of the state of affairs of the Company at
the end of the financial year and of the profit or loss of the Company for the year under review;
(iii) That the Directors have taken proper and sufficient care for the maintenance of adequate accounting records in
accordance with the provisions of the Companies Act, 1956, for safeguarding the assets of the Company and for
preventing and detecting fraud and other irregularities;
(iv) That the Directors have prepared the accounts for the financial year ended March 31, 2011 on a ‘going concern’ basis.
X. CORPORATE GOVERNANCE
Your Company believes that Corporate Governance is a voluntary code of self-discipline. Your Company continuously
endeavors to follow healthy Corporate Governance practices to nurture interest of all stakeholders in the Company.
A separate report on Corporate Governance is annexed hereto as a part of this report. A certificate from a practicing
company secretary regarding compliance of conditions of Corporate Governance as prescribed under Clause 49 of the
Listing Agreement is attached to this report. Management Discussion and Analysis Report is separately given in the Annual Report.
XI. ACKNOWLEDGEMENT
Your directors express deep sense of appreciation for the assistance and co-operation received from the Financial
Institutions, Banks, Government Authorities, creditors and Shareholders and for the devoted services rendered, by the
Executives, Staff and Workers of the Company.
For and on behalf of the Board
Mumbai May 30, 2011
B.K. GoenkaChairman
R. R. MandawewalaManaging Director
11

Annuexure I
Form A
(See Rule 2)
FORM FOR DISCLOSURE OF PARTICULARS WITH RESPECT TO CONSERVATION OF ENERGY
2009-10A. POWER AND FUEL CONSUMPTION
ELECTRICITY
1,261.29
74.27
5.89
167,612
4.23
9,410.21
5.61
15.60
3.90
1.41
9.05
91,467
237,028
385.89
4,951.82
5.41
1,835.58
109.81
5.98
168,429
4.21
7,972
4.73
15.41
3.90
1.39
9.05
86,135
235,502
365.75
4,208.76
4.89
(A)
KWH Units (in '000s)
Unit per Ltr of Furnace Oil
Furnace Oil Consumption (Rs. in Lacs)
Cost / KWH Unit (Rs.)
Through Diesel Generator (Diesel Oil)
KWH Units (in '000s)
Unit per Ltr of Diesel Oil Diesel Consumption (Rs. in Lacs)
Cost / KWH Unit (Rs.)
(II)
Through Gas Turbine / Generator
KWH Units (in '000s)
Giga Calorie Consumption
KWH per Giga Calorie of Natural Gas Gas Cost (Rs. in Lacs)
(B)
(III)
Cost / KWH Unit (Rs.)
1
2 COAL
FURNACE OIL & HSD
(i) Furnace Oil
Quantity (K.Ltrs) 40,423.16 8,064.99
19.95
3.95 1.39
35.30
235,501.73
4,208.76 1,787.14
Total Amount (Rs. in Lacs)
Cost/ Unit of Furnace Oil (Rs.)
(ii) Diesel Oil
Quantity (K.Ltrs)
Total Amount (Rs. in Lacs)
Cost / Unit of Diesel Oil (Rs.)
3
NATURAL GAS
Quantity (Giga Calorie)
Total Amount (Rs. in Lacs)
Cost / Giga Calorie of Natural Gas (Rs.)
4
OTHERS/INTERNAL GENERATION
-5
B.
CONSUMPTION PER UNIT OF PRODUCTION
PRODUCTS
STANDARD
CURRENT YEAR PREVIOUS YEAR
Cotton Yarn & Terry Towels and Bed Sheet
Mt
92,263 2.82 0.43
92,557 2.77 0.44
Electricity
Kwh
Furnace Oil
Ltr
Coal
-
-
-
Others
-
-
-
-
2010-11
39,6039,412.97
23.77
4.00 1.41
35.30
237,028
4,951.82 2,089.13
PURCHASED
KWH Units (in '000s)
Total Amount (Rs. in Lacs)
Rate/Unit (Rs.)
OWN GENERATION UNIT
Through Diesel Generator (Furnace Oil) (I)
– –
12
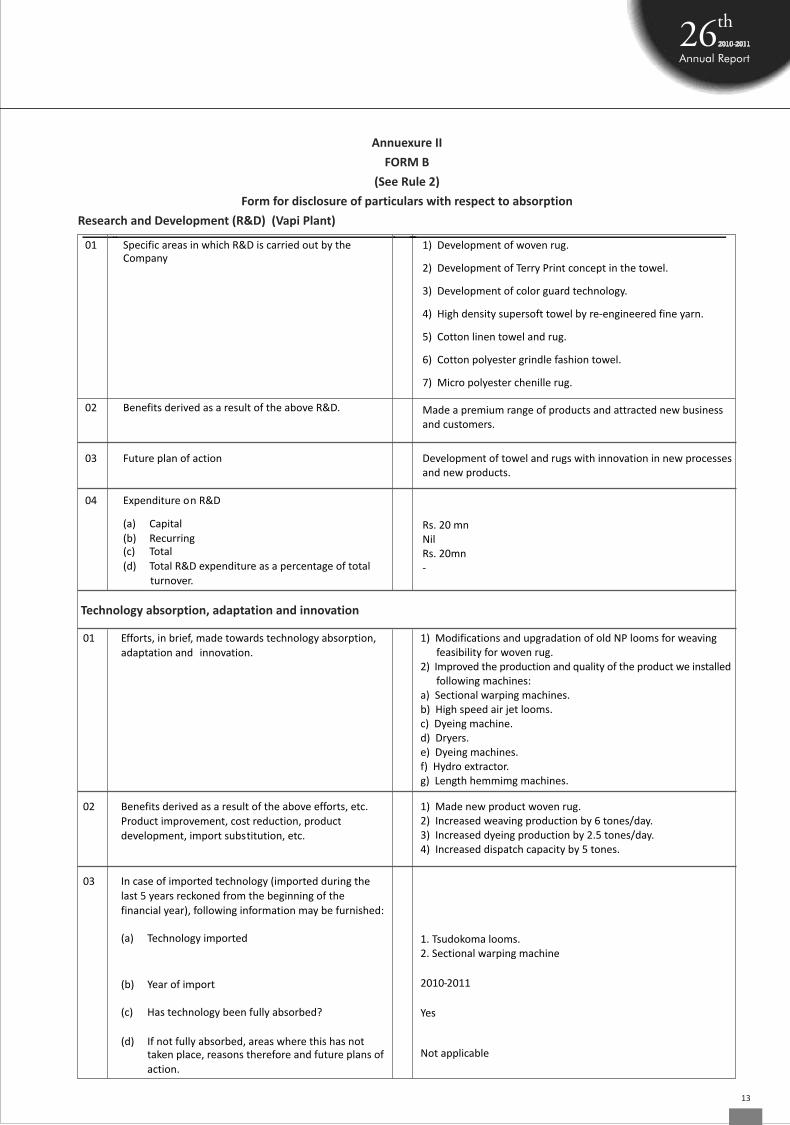
Annuexure II
FORM B
(See Rule 2)
Form for disclosure of particulars with respect to absorption
Research and Development (R&D) (Vapi Plant)
Technology absorption, adaptation and innovation
01
Specific areas in which R&D is carried out by the Company
02 Benefits derived as a result of the above R&D.
03 Future plan of action Development of towel and rugs with innovation in new processes and new products.
04 Expenditure on R&D
(a)
Capital
(b)
Recurring
(c)
Total
(d)
Total R&D expenditure as a percentage of total turnover.
Rs. 20 mnNilRs. 20mn-
01
Efforts, in brief, made towards technology absorption, adaptation and innovation.
1) Modifications and upgradation of old NP looms for weaving feasibility for woven rug.2) Improved the production and quality of the product we installed following machines: a) Sectional warping machines. b) High speed air jet looms.c) Dyeing machine. d) Dryers. e) Dyeing machines.f) Hydro extractor. g) Length hemmimg machines.
02 Benefits derived as a result of the above efforts, etc. Product improvement, cost reduction, product development, import substitution, etc.
1) Made new product woven rug.2) Increased weaving production by 6 tones/day.3) Increased dyeing production by 2.5 tones/day.4) Increased dispatch capacity by 5 tones.
03 In case of imported technology (imported during the last 5 years reckoned from the beginning of the financial year), following information may be furnished:
(a) Technology imported
(b) Year of import
(c)
Has technology been fully absorbed?
(d)
If not fully absorbed, areas where this has not taken place, reasons therefore and future plans of action.
2010-2011
Yes
Not applicable
1. Tsudokoma looms.2. Sectional warping machine
1) Development of woven rug.
2) Development of Terry Print concept in the towel.
3) Development of color guard technology.
4) High density supersoft towel by re-engineered fine yarn.
5) Cotton linen towel and rug.
6) Cotton polyester grindle fashion towel.
7) Micro polyester chenille rug.
Made a premium range of products and attracted new business and customers.
13
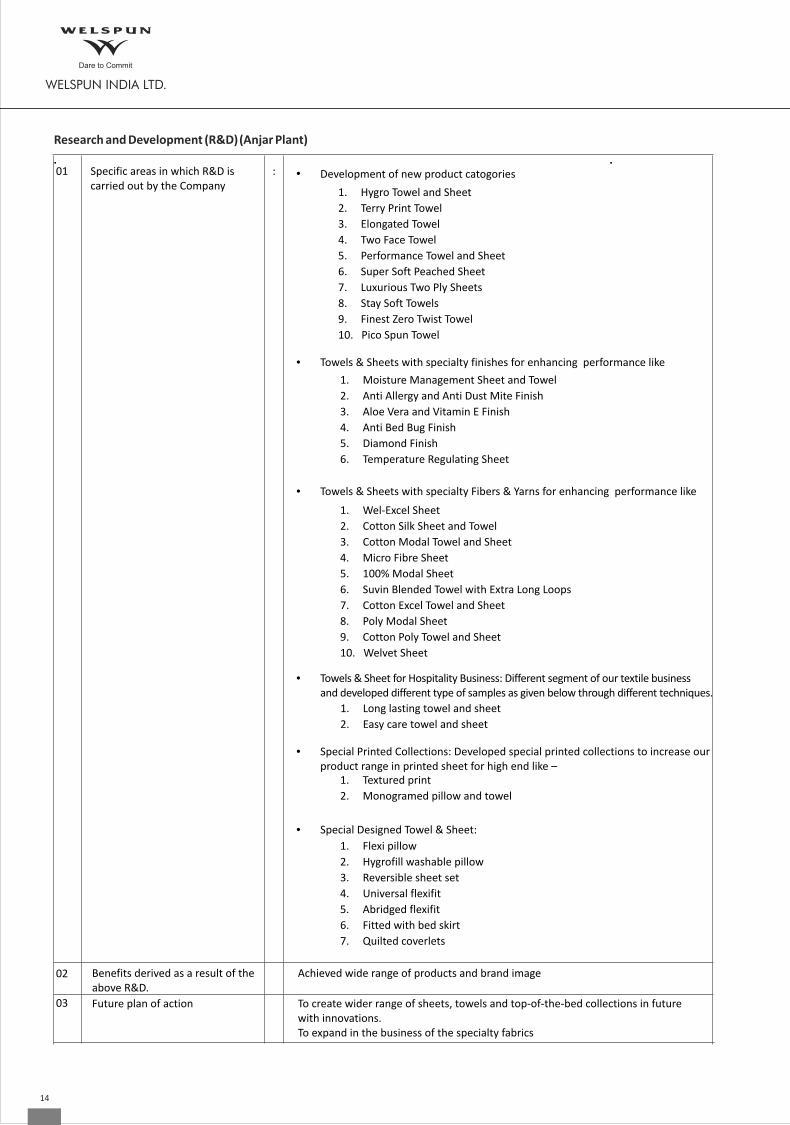
Research and Development (R&D)(Anjar Plant)
01
02
03
Specific areas in which R&D is carried out by the Company
:
• Towels & Sheets with specialty finishes for enhancing performance like 1. Moisture Management Sheet and Towel
2. Anti Allergy and Anti Dust Mite Finish
3. Aloe Vera and Vitamin E Finish
4. Anti Bed Bug Finish
5. Diamond Finish
6. Temperature Regulating Sheet
• Towels & Sheets with specialty Fibers & Yarns for enhancing performance like
1. Wel-Excel Sheet
2. Cotton Silk Sheet and Towel
3. Cotton Modal Towel and Sheet
4. Micro Fibre Sheet
5. 100% Modal Sheet
6. Suvin Blended Towel with Extra Long Loops
7. Cotton Excel Towel and Sheet
8. Poly Modal Sheet
9. Cotton Poly Towel and Sheet
10. Welvet Sheet
• Towels & Sheet for Hospitality Business: Different segment of our textile business and developed different type of samples as given below through different techniques.
1. Long lasting towel and sheet
2. Easy care towel and sheet
• Special Printed Collections: Developed special printed collections to increase our
product range in printed sheet for high end like – 1. Textured print
2. Monogramed pillow and towel
• Special Designed Towel & Sheet:
1. Flexi pillow
2. Hygrofill washable pillow
3. Reversible sheet set
4. Universal flexifit
5. Abridged flexifit
6. Fitted with bed skirt
7. Quilted coverlets
Benefits derived as a result of the above R&D.
Achieved wide range of products and brand image
Future plan of action
Development of new product catogories
1. Hygro Towel and Sheet
2. Terry Print Towel
3. Elongated Towel
4. Two Face Towel
5. Performance Towel and Sheet
6. Super Soft Peached Sheet
7. Luxurious Two Ply Sheets
8. Stay Soft Towels
9. Finest Zero Twist Towel
10. Pico Spun Towel
•
To create wider range of sheets, towels and top-of-the-bed collections in future with innovations. To expand in the business of the specialty fabrics
14
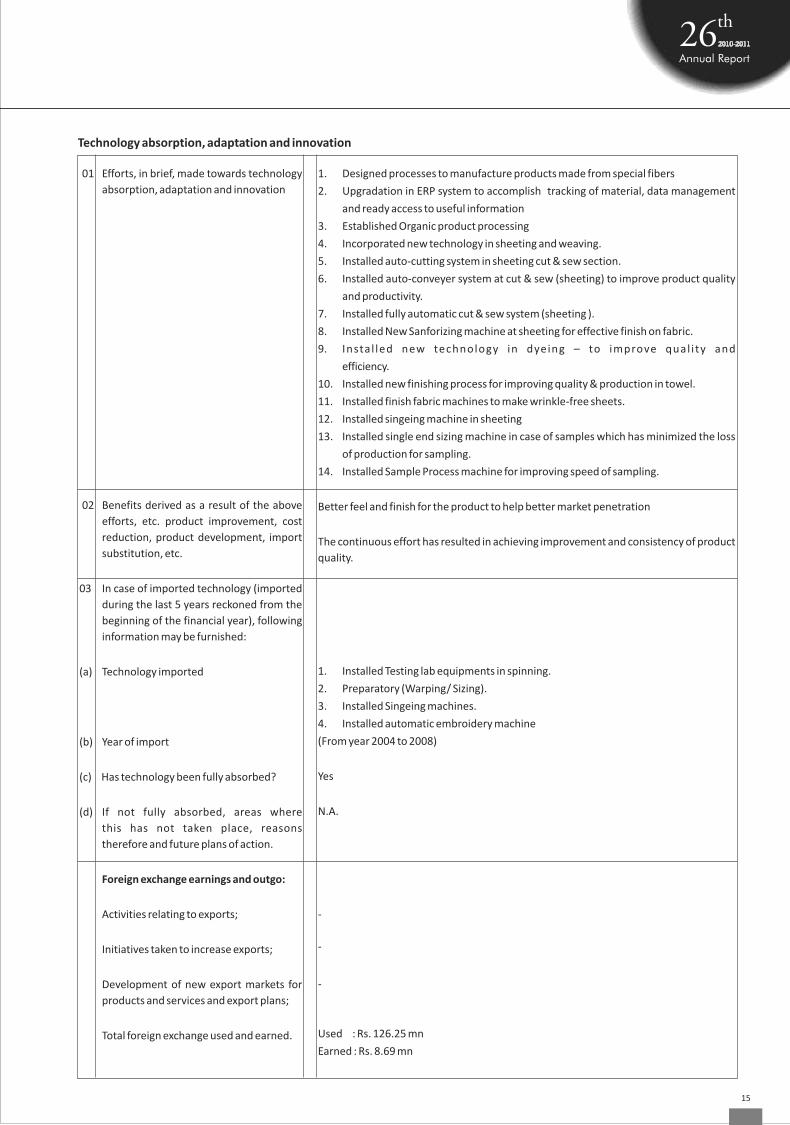
Technology absorption, adaptation and innovation
1. Designed processes to manufacture products made from special fibers
2. Upgradation in ERP system to accomplish tracking of material, data management
and ready access to useful information
3. Established Organic product processing
4. Incorporated new technology in sheeting and weaving.
5. Installed auto-cutting system in sheeting cut & sew section.
6. Installed auto-conveyer system at cut & sew (sheeting) to improve product quality
and productivity.
7. Installed fully automatic cut & sew system (sheeting ).
8. Installed New Sanforizing machine at sheeting for effective finish on fabric.
9. Instal led new technology in dyeing – to improve qual i ty and
efficiency.
10. Installed new finishing process for improving quality & production in towel.
11. Installed finish fabric machines to make wrinkle-free sheets.
12. Installed singeing machine in sheeting
13. Installed single end sizing machine in case of samples which has minimized the loss
of production for sampling.
14. Installed Sample Process machine for improving speed of sampling.
Better feel and finish for the product to help better market penetration
The continuous effort has resulted in achieving improvement and consistency of product
quality.
1. Installed Testing lab equipments in spinning.
2. Preparatory (Warping/ Sizing).
3. Installed Singeing machines.
4. Installed automatic embroidery machine
(From year 2004 to 2008)
Yes
N.A.
-
-
-
Used : Rs. 126.25 mn
Earned : Rs. 8.69 mn
01 Efforts, in brief, made towards technology
absorption, adaptation and innovation
02 Benefits derived as a result of the above
efforts, etc. product improvement, cost
reduction, product development, import
substitution, etc.
03 In case of imported technology (imported
during the last 5 years reckoned from the
beginning of the financial year), following
information may be furnished:
(a) Technology imported
(b) Year of import
(c) Has technology been fully absorbed?
(d) If not fully absorbed, areas where
this has not taken place, reasons
therefore and future plans of action.
Foreign exchange earnings and outgo:
Activities relating to exports;
Initiatives taken to increase exports;
Development of new export markets for
products and services and export plans;
Total foreign exchange used and earned.
15

Home is where the heart is and to make your home the best place in the world we constantly strive to innovate with our fabrics and designs putting extra emphasis on the minutest details to produce a world class product that will add that special touch to your home.
believe in working ahead
E

CORPORATE GOVERNANCE REPORT 2011
I. Philosophy on Corporate Governance
Board of Directors of the Company acts as a trustee and assumes fiduciary responsibility of protecting the interests of the
shareholders and other stakeholders of the Company. Board supports the broad principles of Corporate Governance. In
order to attain the highest level of good Corporate Governance practice, Board lays strong emphasis on transparency,
accountability and integrity.
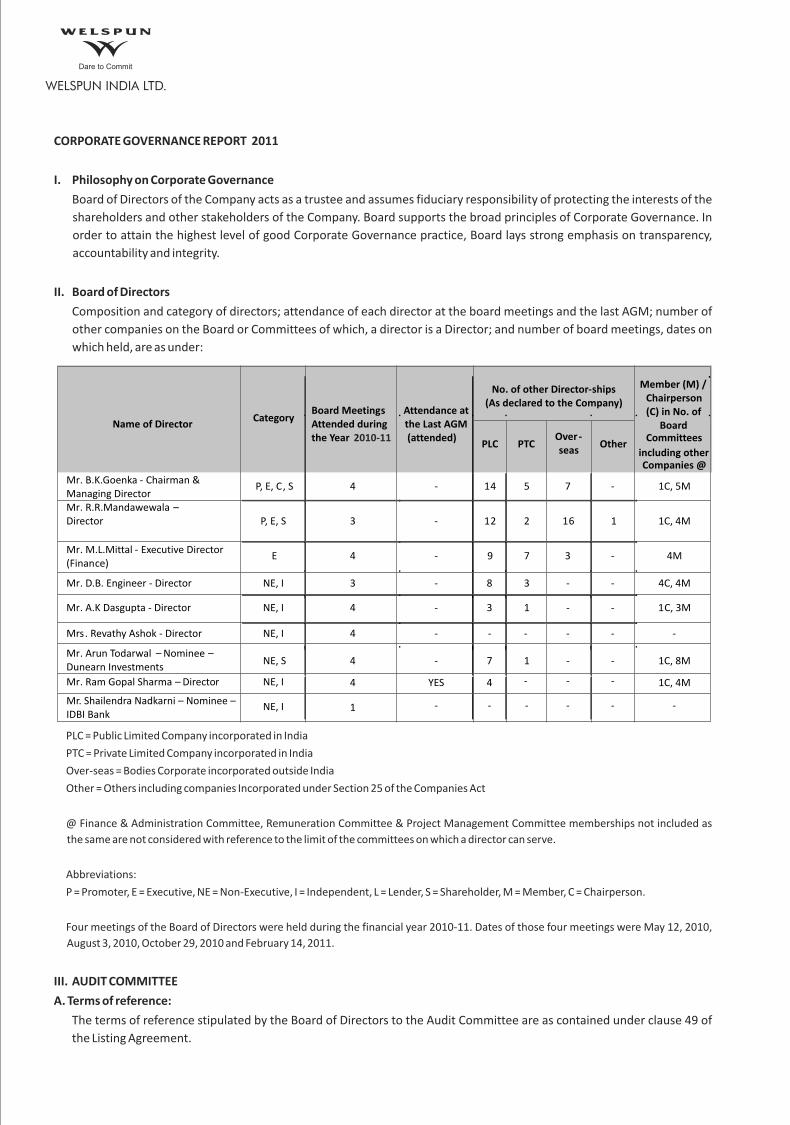
II. Board of Directors
Composition and category of directors; attendance of each director at the board meetings and the last AGM; number of
other companies on the Board or Committees of which, a director is a Director; and number of board meetings, dates on
which held, are as under:
PLC = Public Limited Company incorporated in India
PTC = Private Limited Company incorporated in India
Over-seas = Bodies Corporate incorporated outside India
Other = Others including companies Incorporated under Section 25 of the Companies Act
@ Finance & Administration Committee, Remuneration Committee & Project Management Committee memberships not included as
the same are not considered with reference to the limit of the committees on which a director can serve.
Abbreviations:
P = Promoter, E = Executive, NE = Non-Executive, I = Independent, L = Lender, S = Shareholder, M = Member, C = Chairperson.
Four meetings of the Board of Directors were held during the financial year 2010-11. Dates of those four meetings were May 12, 2010,
August 3, 2010, October 29, 2010 and February 14, 2011.
III. AUDIT COMMITTEE
A. Terms of reference:
The terms of reference stipulated by the Board of Directors to the Audit Committee are as contained under clause 49 of
the Listing Agreement.
No. of other Director-ships(As declared to the Company)
Name of Director Category
Board Meetings
Attended during the Year 2010-11
Attendance at the Last AGM(attended)
PLC PTC Over-
seas Other
Member (M) / Chairperson (C) in No. of
Board Committees
including other Companies @
Mr. B.K.Goenka - Chairman & Managing Director P, E, C, S 4 - 5 7 -
Mr. R.R.Mandawewala – Director
P, E, S 3 - 2 16 1
Mr. M.L.Mittal - Executive Director (Finance)
E 4 - 7 3 -
NE, I 3 - 3 - -
NE, I
4
-
1
-
-
NE, I
4 -
-
-
-
NE, S - 1 - -
NE, I
YES
-
-
-
NE, I - - - -
4
4
1
14
12
9
8
3
-
7
4
-
1C, 5M
1C, 4M
4M
4C, 4M
1C, 3M
-
1C, 8M
1C, 4M
-
Mr. D.B. Engineer - Director
Mr. A.K Dasgupta - Director
Mrs. Revathy Ashok - Director
Mr. Arun Todarwal – Nominee – Dunearn Investments
Mr. Ram Gopal Sharma – Director
Mr. Shailendra Nadkarni – Nominee –IDBI Bank

B. Composition:
The Audit Committee was constituted by the Board of Directors on September 27, 1996. The Chairperson of the
Committee is an independent director. Five meetings of the Committee were held during the year under review. Dates of
those five meetings were May 12, 2010, August 3, 2010, October 29, 2010, February 14, 2011 and March 16, 2011. The
composition of the Committee and attendance of the members are given hereunder:
The Company Secretary of the Company, Mr. Shashikant Thorat is the Secretary of the Committee. Executive Director
(Finance), Internal Auditors and Statutory Auditors attended each of the meetings as per the provisions of section 292A of
the Companies Act, 1956.
IV. REMUNERATION COMMITTEE:
The Remuneration Committee was constituted by the Board of Directors in its meeting held on June 22, 2002. Two
meetings of the Committee were held during the year. Dates of those two meetings were August 3,2010 and February 14,
2011. The terms of reference, compositions are as under:
A. Terms of reference: To recommend appointment of Managerial Personnel and consider the remuneration payable
to them and review thereof from time to time.
B. Composition:
C. Remuneration to Executive Directors
The details of remuneration paid/ payable to the directors for the Financial Year
2010-11 are as under:
1. Mr. B. K Goenka - Chairman
* @ 1 % on the profits determined under Section 349 of the Companies Act, 1956.
Name of Member Member/ Chairman
Category Number of Meetings Attended
Mr. Ram Gopal Sharma Chairman Non-Executive Independent
Mr. D. B. Engineer Member Non-Executive Independent
Mr. Arun Todarwal Member Non-Executive Shareholder
Mr. A. K. Dasgupta Member Non-Executive Independent
Name of Member Member/ Chairman Mr. A. K. Dasgupta ChairmanMr. Arun Todarwal Member Mr. Dadi B. Engineer Member
Salary & Allowances 3.00Perquisites NIL
Commission * 10.35
TenureNotice Period 1 Month
Severance Fees NIL
Stock Option NIL
(Rs. in million)
5
4
5
5
Mr. Ram Gopal Sharma (Member with effect from May 12, 2010) Member
Dated October 11, 2010 to October 10, 2013
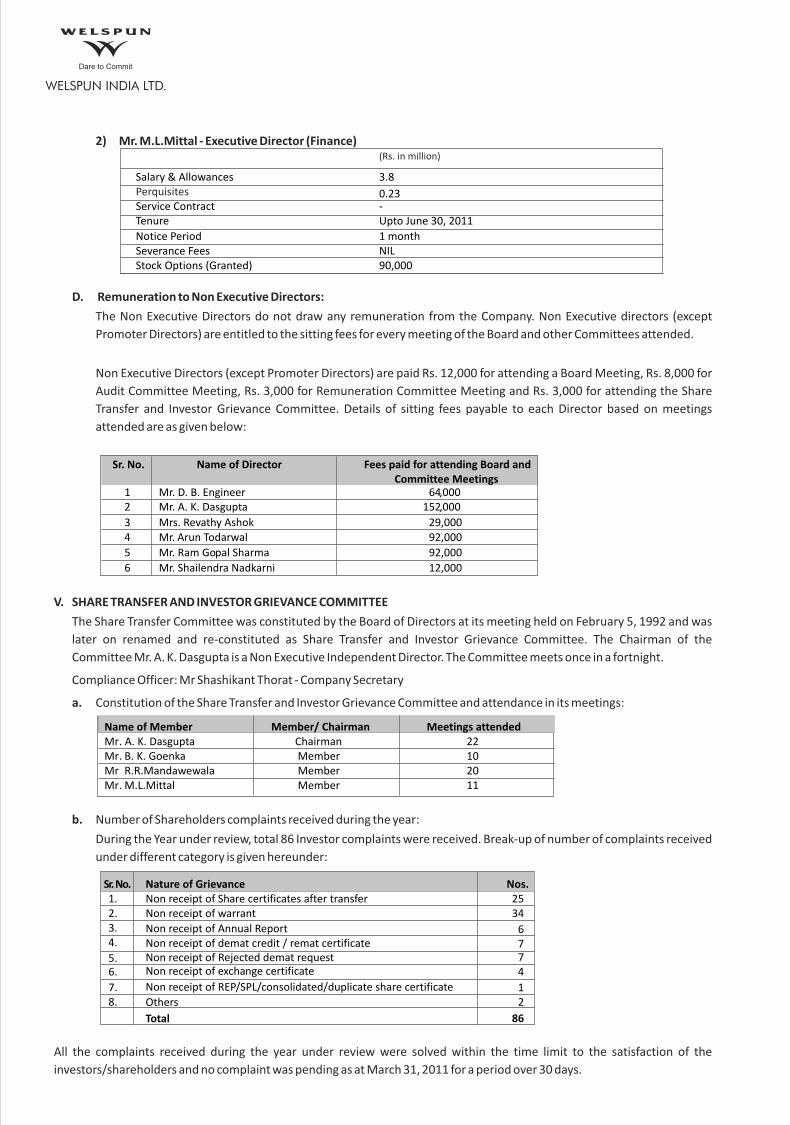
2) Mr. M.L.Mittal - Executive Director (Finance)
D. Remuneration to Non Executive Directors:
The Non Executive Directors do not draw any remuneration from the Company. Non Executive directors (except
Promoter Directors) are entitled to the sitting fees for every meeting of the Board and other Committees attended.
Non Executive Directors (except Promoter Directors) are paid Rs. 12,000 for attending a Board Meeting, Rs. 8,000 for
Audit Committee Meeting, Rs. 3,000 for Remuneration Committee Meeting and Rs. 3,000 for attending the Share
Transfer and Investor Grievance Committee. Details of sitting fees payable to each Director based on meetings
attended are as given below:
V. SHARE TRANSFER AND INVESTOR GRIEVANCE COMMITTEE
The Share Transfer Committee was constituted by the Board of Directors at its meeting held on February 5, 1992 and was
later on renamed and re-constituted as Share Transfer and Investor Grievance Committee. The Chairman of the
Committee Mr. A. K. Dasgupta is a Non Executive Independent Director. The Committee meets once in a fortnight.
Compliance Officer: Mr Shashikant Thorat - Company Secretary
a. Constitution of the Share Transfer and Investor Grievance Committee and attendance in its meetings:
b. Number of Shareholders complaints received during the year:
During the Year under review, total 86 Investor complaints were received. Break-up of number of complaints received
under different category is given hereunder:
All the complaints received during the year under review were solved within the time limit to the satisfaction of the
investors/shareholders and no complaint was pending as at March 31, 2011 for a period over 30 days.
Salary & Allowances 3.8 PerquisitesService Contract - Tenure Upto June 30, 2011 Notice Period 1 month Severance Fees NILStock Options (Granted) 90,000
Sr. No. Name of Director Fees paid for attending Board and Committee Meetings
1 Mr. D. B. Engineer 64,0002 Mr. A. K. Dasgupta 152,000
3 Mrs. Revathy Ashok 29,0004 Mr. Arun Todarwal 92,000
5 Mr. Ram Gopal Sharma 92,000
Name of Member Member/ Chairman Meetings attendedMr. A. K. Dasgupta Chairman 22 Mr. B. K. Goenka Member 10 Mr R.R.Mandawewala Member 20 Mr. M.L.Mittal Member 11
(Rs. in million)
6 Mr. Shailendra Nadkarni 12,000
0.23
Sr. No. Nature of Grievance Nos.1. Non receipt of Share certificates after transfer 2. Non receipt of warrant 3. 4.
Non receipt of Annual Report
5.
Non receipt of demat credit / remat certificate
6. Non receipt of Rejected demat request
7. Non receipt of exchange certificate
8. Non receipt of REP/SPL/consolidated/duplicate share certificate
Total
25
Others
34
6774
12
86
VI. MANAGEMENT
a. Management Discussion and Analysis
Management Discussion and Analysis of various businesses of the Company will be separately given in the Annual
Report.
b. Disclosures by Management to the Board
All details relating to financial and commercial transactions where directors may have a pecuniary interest are
provided to the Board, and the interested directors neither participated in the discussion, nor do they vote on such
matters.
VII. GENERAL BODY MEETINGS
The details of Annual General Meetings held in the last three years are given hereunder:
VIII. DISCLOSURE
a. Details of related party transactions
Refer Note No. 23 (ii) of Schedule 19 to the Accounts in the Annual Statement for list of related party transactions
b. Details of information on appointment of new directors
A brief resume, nature of expertise in specific functional areas, names of companies in which the person already holds
directorship and membership of committees of the Board and his shareholdings in the Company forms part of the
Notice of General Meeting, annexed to this Annual Report.
c. Details of non-compliance
There was no non compliance by the Company, nor there was any penalty or stricture imposed on the Company by the
Stock Exchange or SEBI or any authority on any matter related to capital market during the last 3 years.
d. Whistle Blower Policy
The Company has a Whistle Blower Policy and no personnel have been denied access to the Audit Committee.
e. Code of Conduct
The Company has Code of Conduct for Board members and senior management personnel. A copy of the Code has
been put on the Company’s website for information of all the members of the Board and management personnel.
All Board members and senior management personnel have affirmed compliance of the same.
A declaration signed by the of the Chairman of the Company is given below:
“I hereby confirm that all Board members and senior management personnel have affirmed compliance with the
Code of Conduct of the Company.”
B.K. Goenka
Chairman
Meeting Day & Date of Meeting Time Place 23rd Annual General Meeting
Saturday, September 28, 2008 10.30 a.m.
24th Annual General Meeting
Wednesday, September 29, 2009 10.30 a.m.
Registered Office : Survey No.76, Village Morai, Vapi, Dist. Valsad, Gujarat – 396191
Registered Office : Welspun City, Village Versamedi, Taluka Anjar, District Kutch, Gujarat – 370 110
Registered Office : Welspun City, Village Versamedi, Taluka Anjar, District Kutch, Gujarat – 370 110
25th Annual General Meeting Tuesday, August 31, 2010 11.00 a.m.
21
f. Certification by Executive Director (Finance)
A certificate obtained from Executive Director (Finance) on the Financial Statements of the Company in terms of
Clause 49 of the Listing Agreement was placed before the Board, who took note of it and took the same on record.
g. Secretarial Audit
A qualified practicing Company Secretary carried out the Secretarial Audit on quarterly basis to reconcile the share
capital with National Securities Depository Limited (“NSDL”) and Central Depository Services (India) Limited (“CDSL”)
and the total issued and listed capital. The audit confirms that the total issued / paid-up capital is in agreement with
total number of shares in physical forms and total number of demat shares held with NSDL and CDSL.
h. Accounting Standards
The Accounting Standards laid down by the Institute of Chartered Accountants of India and applicable to the
Company were followed by the Company in preparation of accounts of the Company.
i. Details (in aggregate) of shares in the suspense account including freeze on their voting rights:
There are no unclaimed shares and hence no suspense account is required to be opened and credited with such
shares and also there is no freeze on voting rights of any shares.
IX. MEANS OF COMMUNICATION
The Company published its un-audited quarterly results / audited annual financial results in one or more of the following
newspapers:
(i) Western Times (English and Gujarati Editions)
(ii) Business Standard (English Edition)
(iii) Economic Times (English Edition)
(iv) The Financial Express (English Edition)
Results are published immediately after the same are approved / taken on record by the Board of directors.
Address of Website on which quarterly results are posted: www.welspuntowels.com
Management Discussion and Analysis form part of this Annual Report.
X. GENERAL SHAREHOLDER INFORMATION
AGM will be held on Thursday, September 8, 2011 at 11.00 a.m. at the Registered Office of the Company at Welspun
City, Village Versamedi, Taluka Anjar, District Kutch, Gujarat 370 110.
Financial Year of the Company is April 1 to March 31.
Date of Book Closure: Wednesday, August 24, 2011 to Tuesday, August 30, 2011 (Both days inclusive)
Listing on Stock Exchanges: Bombay Stock Exchange Limited (BSE) and The National Stock Exchange of India Limited (NSE).
The equity shares of the Company have been voluntarily delisted from Ahmedabad and Delhi Stock Exchanges and all the
formalities for delisting of equity shares from Calcutta Stock Exchange have been completed and formal intimation is
awaited.
Stock Code:
Bombay Stock Exchange : 514162
National Stock Exchange : WELSPUNIND (SERIES EQ)

Market Price Data: High & Low price of equity shares on Bombay Stock Exchange Limited is as under.
Market Price Data: High & Low price of equity shares on The National Stock Exchange is as under.
Performance in comparison to broad-based indices i.e. BSE Sensex and NSE S & P CNX is as under:
Month High Amount (Rs.) Low Amount (Rs.)
116.00
97.55
83.40
82.20
80.25
72.50
73.80
79.70
66.90
68.00
47.35
45.25
85.00
75.35
73.00
75.00
66.55
60.00
59.00
56.10
51.10
42.50
37.15
36.55
Month BSE Index Closing price of Shares NSE Nifty Closing price of Shares (Rs.)
Month High Amount (Rs.)
115.75
97.40
82.80
82.40
85.00
71.90
73.75
80.00
67.00
69.00
48.85
46.90
Low Amount (Rs.)
85.00
78.20
68.10
74.45
66.20
61.50
58.90
55.80
46.00
41.10
35.30
36.30
Apr - 2010
May - 2010
Jun - 2010
Jul - 2010
Aug - 2010
Sep - 2010
Oct - 2010 Nov - 2010
Dec - 2010
Jan - 2011
Feb - 2011
Mar - 2011
Apr - 2010
May - 2010
Jun - 2010
Jul - 2010
Aug - 2010
Sep - 2010
Oct - 2010 Nov - 2010
Dec - 2010
Jan - 2011
Feb - 2011
Mar - 2011
Apr - 2010 5,278.00 88.65
May - 2010 5,086.30 80.90
Jun - 2010 17,700.90 75.00
Jul - 2010 17,868.29 77.70
Aug - 2010 17,971.12 67.75
Sep - 2010 20,069.12 63.00
Oct - 2010 66.75
Nov - 2010 19,521.25 60.60
Dec - 2010 20,509.09 59.90
Jan - 2011 18,327.76 46.40
Feb - 2011 17,823.40 37.65
Mar - 2011 19,445.22 42.70
17,558.71
16,944.63
20,032.34
(Rs.)
88.15
81.85
75.00
77.55
67.70
63.10
67.00
60.80
59.65
46.15
37.65
42.60
5,312.50
5,367.60
5,402.40
6,029.95
6,017.70
5,862.70
6,134.50
5,505.90
5,333.25
5,833.75
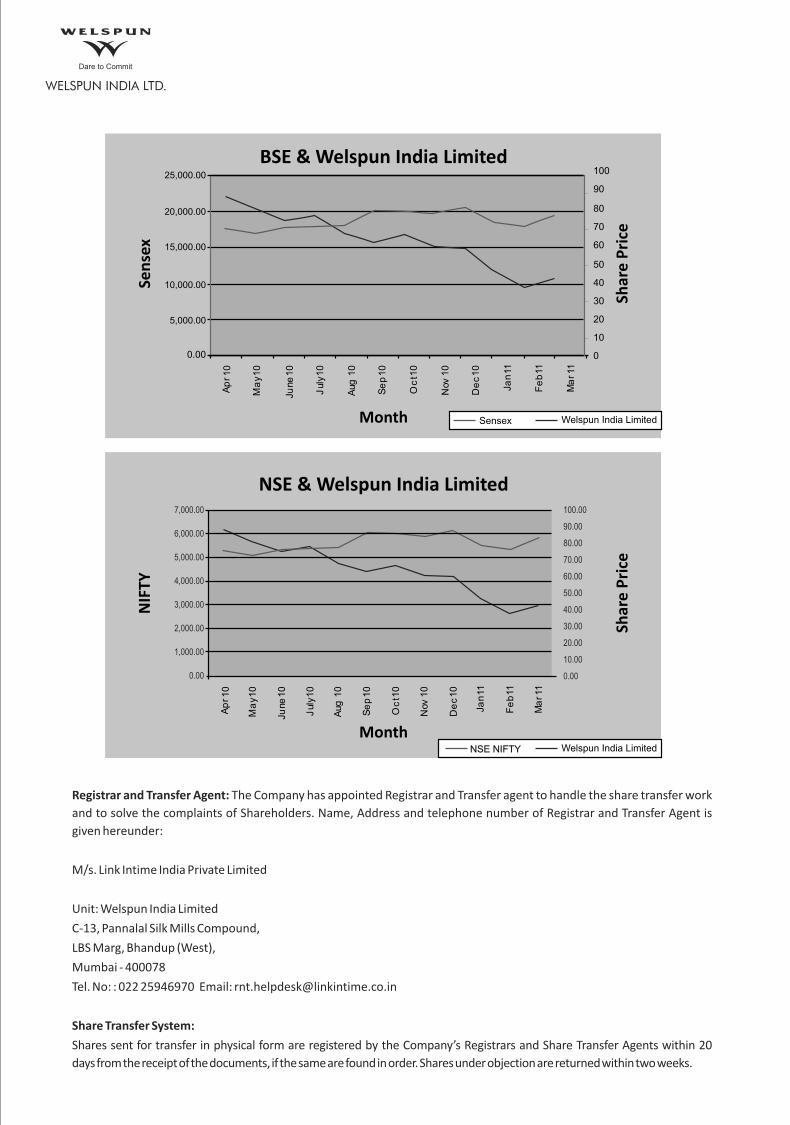
Registrar and Transfer Agent: The Company has appointed Registrar and Transfer agent to handle the share transfer work
and to solve the complaints of Shareholders. Name, Address and telephone number of Registrar and Transfer Agent is
given hereunder:
M/s. Link Intime India Private Limited
Unit: Welspun India Limited
C-13, Pannalal Silk Mills Compound,
LBS Marg, Bhandup (West),
Mumbai - 400078
Tel. No: : 022 25946970 Email: [email protected]
Share Transfer System:
Shares sent for transfer in physical form are registered by the Company’s Registrars and Share Transfer Agents within 20
days from the receipt of the documents, if the same are found in order. Shares under objection are returned within two weeks.
BSE & Welspun India Limited
0.00 0
10
20
30
40
50
60
70
80
90
100
Ap
r 10
Ma
y1
0
Ju
ne1
0
July
10
Aug
10
Se
p1
0
Oc
t10
Nov
10
De
c1
0
Ja
n11
Fe
b11
Ma
r 11
5,000.00
10,000.00
15,000.00
20,000.00
25,000.00
Sen
sex
Shar
e P
rice
Month
7,000.00
6,000.00
5,000.00
4,000.00
3,000.00
2,000.00
1,000.00
0.00
100.00
90.00
80.00
70.00
60.00
50.00
40.00
30.00
20.00
10.00
0.00
Ap
r 10
Ma
y1
0
Ju
ne1
0
July
10
Aug
10
Se
p1
0
Oc
t10
Nov
10
De
c1
0
Ja
n11
Fe
b11
Ma
r 11
NSE & Welspun India Limited
NIF
TY
Shar
e P
rice
Month
Sensex Welspun India Limited
Welspun India LimitedNSE NIFTY
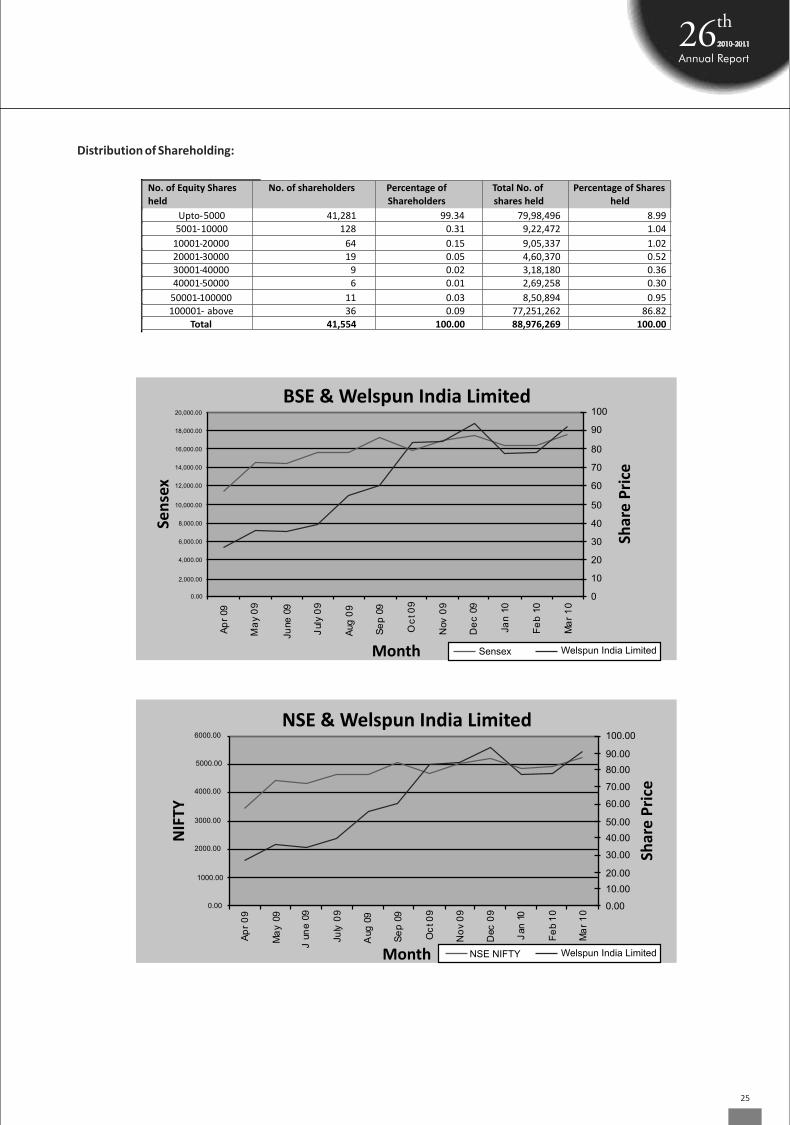
Distribution of Shareholding:
0.00
1000.00
2000.00
3000.00
4000.00
5000.00
6000.00
Ap
r0
9
Ma
y09
Jun
e09
Ju
ly0
9
Aug
09
Se
p09
Oc
t0
9
No
v0
9
Dec
09
Jan
10
Fe
b1
0
Ma
r1
0
0.00
10.00
20.00
30.00
40.00
50.00
60.00
70.00
80.00
90.00
100.00
NSE & Welspun India Limited
NIF
TY
Shar
e P
rice
Month Welspun India LimitedNSE NIFTY
0.00
2,000.00
4,000.00
6,000.00
8,000.00
10,000.00
12,000.00
14,000.00
16,000.00
18,000.00
20,000.00
Ap
r09
Ma
y0
9
Ju
ne09
July
09
Aug
09
Se
p09
Oc
t0
9
Nov
09
De
c09
Ja
n10
Fe
b10
Ma
r1
0
0
10
20
30
40
50
60
70
80
90
100
Sensex Welspun India Limited
BSE & Welspun India Limited
Sen
sex
Shar
e P
rice
Month
No. of Equity Shares
held
No. of shareholders Percentage of
Shareholders
Upto-5000 41,281
5001-10000 128
10001-20000 64
20001-30000
30001-40000
40001-50000
50001-100000
100001- above
Total
19
9
6
11
36
41,554
99.34
0.31
0.15
0.05
0.02
0.01
0.03
0.09
100.00
Total No. of
shares held
Percentage of Shares
held
79,98,496
9,22,472
9,05,337
4,60,370
3,18,180
2,69,258
8,50,894
77,251,262
88,976,269
8.99
1.04
1.02
0.52
0.36
0.30
0.95
86.82
100.00
25
Dematerialisation of shares and liquidity: 98.88% have been dematerialized and has reasonable liquidity on Bombay Stock Exchange Limited and The National Stock Exchange of India Limited.
Outstanding GDR’s/ADR’s/Convertible ( As at March 31, 2011) – Nil.Plant locations: Survey No.76, Village Morai, Vapi, Dist. Valsad, Gujarat - 396191 (India) and Village Varsamedi, Tal Anjar, Distt. Kutch, Gujarat – 370110 (India)
Address for correspondence: Company SecretaryWelspun India Limited, Welspun House, 7th Floor, Kamala Mills Compound, Senapati Bapat Marg, Lower Parel, Mumbai 400013, Tel: +91-22-24908000, +91-22-66136000 Fax: +91-22-24908020 E-mail : [email protected]
26

PRACTICING COMPANY SECRETARY'S CERTIFICATE
TO THE MEMBERS OF WELSPUN INDIA LIMITED
We have examined the compliance of conditions of Corporate Governance by Welspun India Limited for the year ended on
March 31, 2011, as stipulated in Clause 49 of the Listing Agreement of the said Company with Stock Exchanges.
The compliance of conditions of Corporate Governance is the responsibility of the management. Our examination was limited
to procedures and implementation thereof, adopted by the Company for ensuring the compliance of the conditions of the
Corporate Governance. It is neither an audit nor an expression of opinion on the financial statements of the Company.
In our opinion and to the best of our information and according to the explanation given to us, we certify that the Company
has complied with the conditions of Corporate Governance as stipulated in the above mentioned Listing Agreement.
We state that in respect of investor grievance received during the year ended March 31, 2011, the Registrars of the Company
have certified that as at March 31, 2011, there was no investor grievance remaining unattended/pending for more than 30
days.
We further state that such compliance is neither an assurance as to the future viability of the Company nor the efficiency or
effectiveness with which the management has conducted the affairs of the Company.
For S. S. Risbud & Co.
Company Secretaries
Sanjay S. Risbud
Proprietor
Mumbai
May 30, 2011
27

For us customers are of paramount importance and we take utmost care to match up to their trust. It our business, it’s very important to work closely with the customers to make sure the product created is as close to their requirements. It’s critical to form a close working relationship with the client so that they feel valued, wanted and loved.
believe in living up to your trust
E

Management Discussion and Analysis
The Management Discussion and Analysis (MD&A) should be read in conjunction with the Audited Consolidated Financial Statement of
Welspun India Ltd (“Welspun” or the “Company”), and the notes thereto for the year ended March 31, 2011. This MD&A covers Welspun's
financial position and operations for the year ended March 31, 2011. Amounts are stated in Indian Rupees unless otherwise indicated. The
numbers used in the analysis are on a consolidated basis, the corresponding number for the previous year have been regrouped and
reclassified wherever necessary.
Forward-Looking Statements
This report contains forward-looking statements, which may be identified by their use of words like 'plans', 'expects', 'will’, ‘anticipates',
'believes', 'intends', 'projects', 'estimates' or other words of similar meaning. All statements that address expectations or projections about
the future, including but not limited to statements about the Company's strategy for growth, product development, market position,
expenditures, and financial results, are forward-looking statements. Forward-looking statements are based on certain assumptions and
expectations of future events. The Company assumes no responsibility to publicly amend, modify or revise any forward looking statements,
on the basis of any subsequent development, information or event.
Company Overview
Welspun India Limited (WIL) continues to maintain its leading manufacturer status for a wide range of home textile products.
WIL, through Welspun Global Brands Limited (WGBL), is a strategic vendor to some of the top global retailers. Its
manufacturing, sales and distribution network is spread over 38 countries. Worldwide, the ranking of WIL amongst the top 3
manufacturers of terry towels, having capacities of 41,500 MT in Terry Towels, 10,151 MT in Rugs and 45 mn mtrs in Bed
Sheets.
WIL's is selling its products largely through Welspun Global Brands Limited (WGBL) and Welspun Retail Limited (WRL). WGBL
and WRL are the marketing and distribution arm of WIL in the international and the domestic markets respectively. WGBL is
operating as the international sales and marketing intermediary of WIL. The major customers (through WGBL) in the
international market include major retail chains, specialty stores and fashion stores like Target, WalMart, Bed Bath & Beyond,
J C Penney, Tesco, IKEA and many others. WRL caters to the domestic market through a chain of company-owned and
franchisee retail-outlets and other channels like Institutional, B2B and Distribution. WRL provides a one stop home solution
for evolving customers with its brands ‘Welhome’ and ‘Spaces- Home and Beyond’.
Global Overview
Economic Environment is turning positive in important markets
US economy in 2010, overcame the recessionary pressures, which it was facing in the previous year. Its GDP grew at a healthy
2.8% in 2010 while the world economy grew at 3.9%. Euro area (EU17) GDP grew at 1.7% with a projection of 1.4% growth for
2011. Developing countries GDP grew at 7% with South Asia growing at a whopping 8.7% . Comparative retail sales in the US,
UK and Eurozone have shown strong sustainability with most months showing a positive growth year-on-year. Labour costs
also saw an upward correction in India, China, Brazil and most other countries earlier recognized for their availability of cheap
labour.
World Textile Market projected to show growth in the coming years
The global textiles and apparels trade is currently estimated at about US$ 500 billion. The global market for textile trade
includes yarns, fabrics, apparel and non-apparel finished products. Welspun estimates that the global home textiles market is
around US$ 25 billion, amounting to about 5% of the total global textile market. The home textiles market includes:
1. Household textiles: Rugs, bed linen, table linen, bathroom and kitchen linen, etc.
2. Furnishing textiles: Curtains, bedspreads and other furnishing articles for home interiors, etc.
Post the expiry of the Agreement on Textiles and Clothing in 2005, India's share of textile imports into the EU and the US has
significantly increased. India is consistently among the top 3 leading suppliers of bed and bath linen in the EU . India along with
China and Pakistan is amongst the top 3 suppliers of textile globally. (Source: Office of Textile & Apparels, OTEXA)
30
Global Demand - Supply Scenario
While starting at the end of second quarter of 2010-11 the cotton crisis spread across the globe and resulted in high prices of
cotton breaking all previously attained records around the world. The crisis has been attributed to various reasons including
floods in Pakistan, poor crop in China, export restrictions on cotton and yarn, growing domestic consumption in China, along
with the fact that lesser cotton was grown this year due to competition from other crops. However, retail sales in most of the
markets went on to gain momentum. Manufacturers started de-specking their offerings, introducing new technologies to
offer better consumer value on one hand and reducing the costs on the other hand. Cotton blends have seen resurgence
during the year and facilitated introduction of innovative products in the market. The largest consumers for home textile
continue to be dominated from the markets of US, Europe and Japan. Over the years, consumer’s wallet share for textiles has
been declining leading to great demand in the value segment and relatively lower demand for premium segment. In the last
quarter of FY10, we observed a cautious optimism in the consumer demand which has grown at a gradual pace across the
geographies. The Industry is expected to grow at a CAGR of 14% over the next 4 years to reach approximately US $ 850 billion
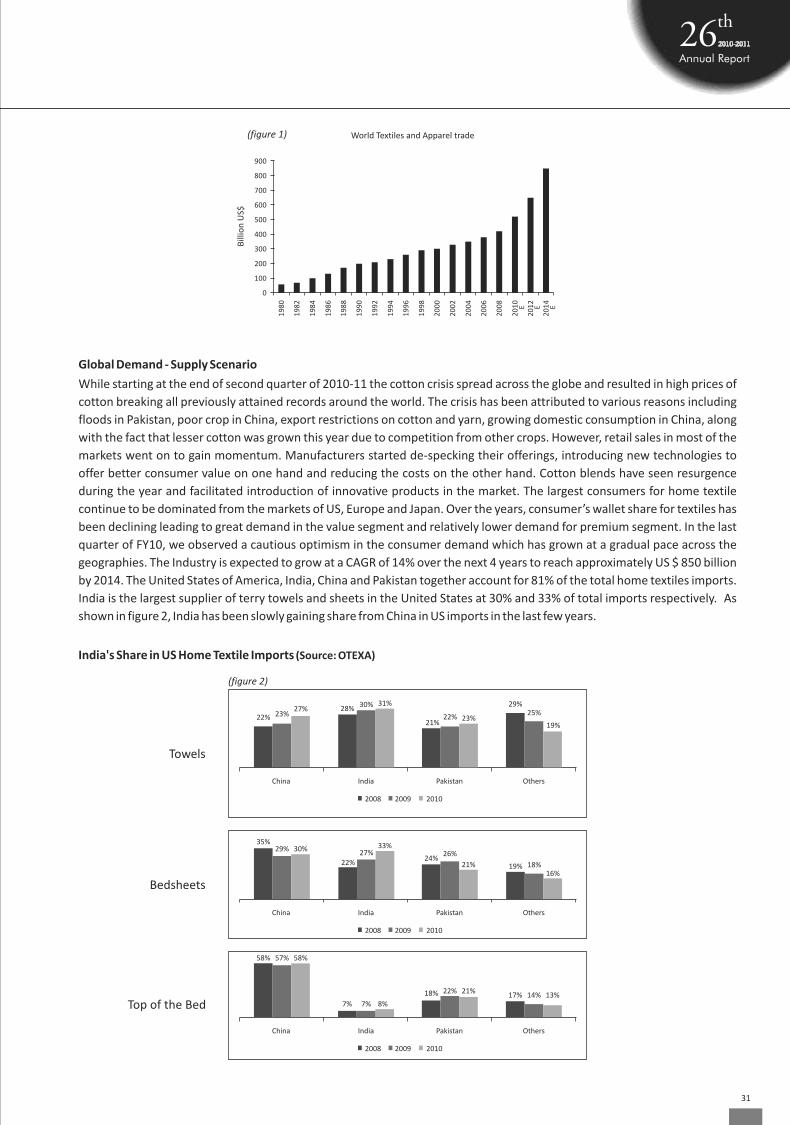
by 2014. The United States of America, India, China and Pakistan together account for 81% of the total home textiles imports.
India is the largest supplier of terry towels and sheets in the United States at 30% and 33% of total imports respectively. As
shown in figure 2, India has been slowly gaining share from China in US imports in the last few years.
India's Share in US Home Textile Imports (Source: OTEXA)
Bedsheets
China India Pakistan Others
2008 2009 2010
35%29% 30%
22%27%
33%
24%26%
21% 19% 18%16%
Towels
China India Pakistan Others
2008 2009 2010
22% 23%27% 28%
30% 31%
21%22% 23%
29%25%
19%
900
800
700
600
500
400
300
200
100
0
19
80
19
82
19
84
19
86
19
88
19
90
19
92
19
94
19
96
19
98
20
00
20
02
20
04
20
06
20
08
20
10
20
12
20
14
World Textiles and Apparel trade
Bill
ion
US$
EEE
Top of the Bed
China India Pakistan Others
2008 2009 2010
58% 58%57%
7% 7% 8%
18% 22% 21%17% 14% 13%
(figure 1)
(figure 2)
31
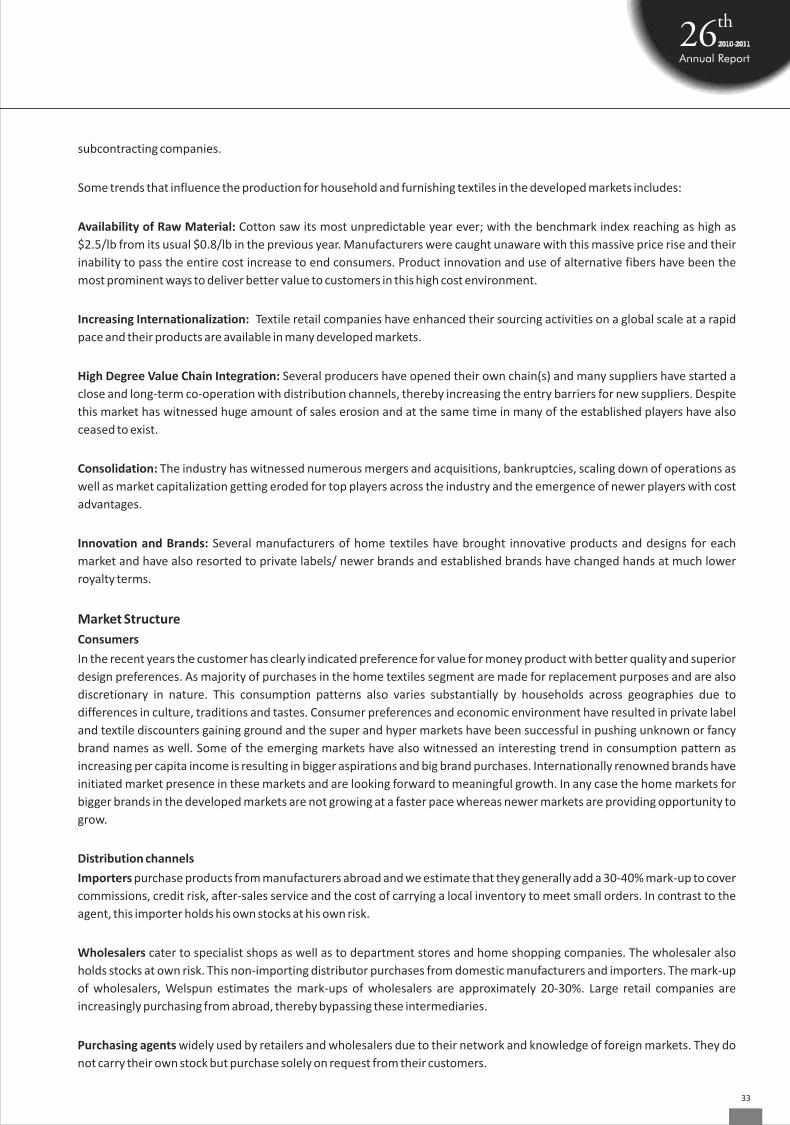
Overview of the Indian Economy
Economic Indicators
India’s GDP registered a growth of 8.5% during 2010-11, contributed mainly by manufacturing and services sectors. GDP
growth estimates for 2011-12 provided by the Finance ministry indicated that the economy will better its performance and
touch the 9% mark. Overall inflation rate for 2010-11 stood at 9.4% while Industrial production trend showed some weakness,
registering a growth of 7.8% in 2010-11 against a growth of 10% seen during 2009-10. Core sectors recorded an overall growth
of 5.7% during 2010-11 which is better than 5.4% growth seen in 2009-10. Exports grew phenomenally by 35% during the
year, while imports increased by 21.2%. Strong tax revenues, 3G/BWA spectrum windfall and moderation in growth of overall
expenditure have helped the Government to rein in fiscal deficit in 2010-11. (Source:FICCI)
GDP Growth Trend in India
Industry Structure
The industrial restructuring process has led to significant changes in the location of production activities in the home textiles
sector. In the last two decades, many Western European home textiles companies have moved manufacturing activities to
countries in Eastern Europe or to non-European countries, where costs of production are lower. Home textile manufacturers
in developed economies have responded to pressures by continuing to pursue the strategy of:
• Relocating production or sourcing to Low Cost Countries; and
• Development of value-added products and higher value to customers through product innovation and cost management
Major retailers have integrated their supply chain through production facilities or sourcing tie-ups. This results in most
economic cost and best quality products being offered to customers across the globe. Besides, it also brings in
multidimensional implications like lower cost, value for money, innovation in product and services, supply chain efficiency,
environment awareness and stiff conditions to be complied for production facilities in line with global standard. The buyers
are also required to monitor working conditions and manufacturing practices in all parts of the value chain, including those at
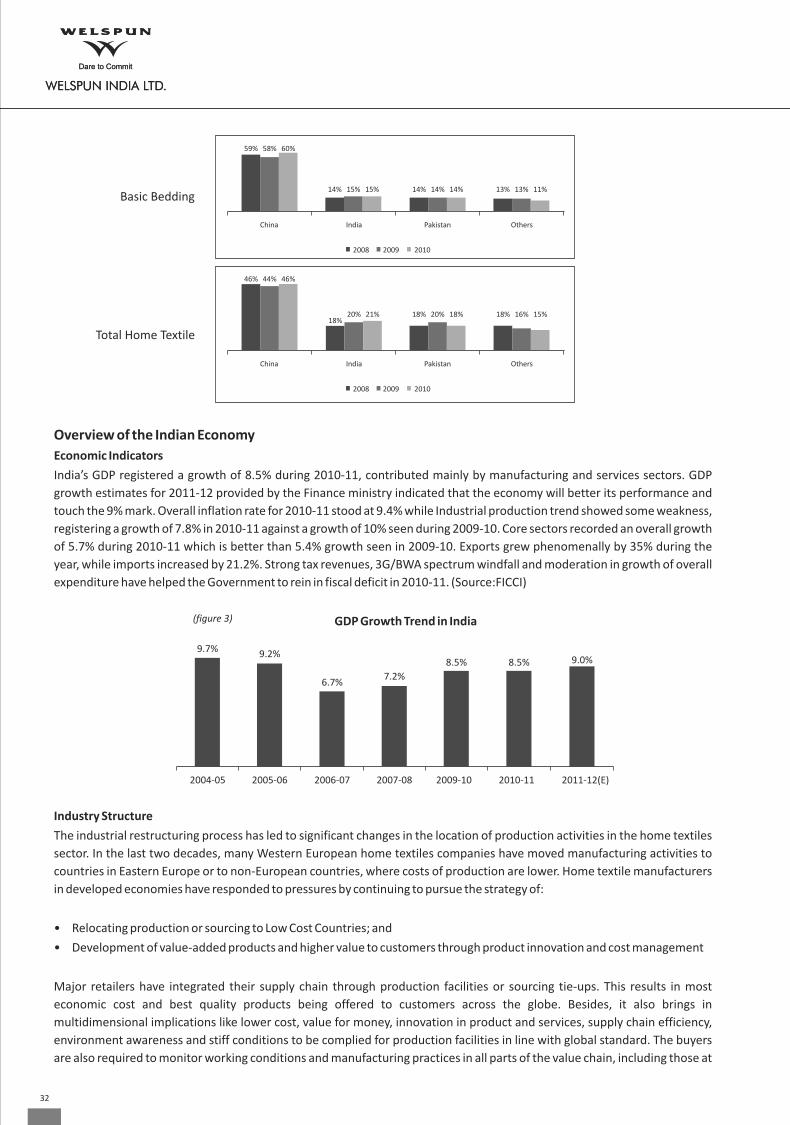
Basic Bedding
Total Home Textile
46% 44% 46%
18%20% 21% 18% 20% 18% 18% 16% 15%
China India Pakistan Others
2008 2009 2010
China India Pakistan Others
2008 2009 2010
59% 58% 60%
14% 15% 15% 14% 14% 14% 13% 13% 11%
8.5%
2009-10
9.7%
2004-05
9.2%
2005-06
8.5%
2010-11
6.7%
2006-07
9.0%
2011-12(E)
7.2%
2007-08
(figure 3)
32
subcontracting companies.
Some trends that influence the production for household and furnishing textiles in the developed markets includes:
Availability of Raw Material: Cotton saw its most unpredictable year ever; with the benchmark index reaching as high as
$2.5/lb from its usual $0.8/lb in the previous year. Manufacturers were caught unaware with this massive price rise and their
inability to pass the entire cost increase to end consumers. Product innovation and use of alternative fibers have been the
most prominent ways to deliver better value to customers in this high cost environment.
Increasing Internationalization: Textile retail companies have enhanced their sourcing activities on a global scale at a rapid
pace and their products are available in many developed markets.
High Degree Value Chain Integration: Several producers have opened their own chain(s) and many suppliers have started a
close and long-term co-operation with distribution channels, thereby increasing the entry barriers for new suppliers. Despite
this market has witnessed huge amount of sales erosion and at the same time in many of the established players have also
ceased to exist.
Consolidation: The industry has witnessed numerous mergers and acquisitions, bankruptcies, scaling down of operations as
well as market capitalization getting eroded for top players across the industry and the emergence of newer players with cost
advantages.
Innovation and Brands: Several manufacturers of home textiles have brought innovative products and designs for each
market and have also resorted to private labels/ newer brands and established brands have changed hands at much lower
royalty terms.
Market Structure
Consumers
In the recent years the customer has clearly indicated preference for value for money product with better quality and superior
design preferences. As majority of purchases in the home textiles segment are made for replacement purposes and are also
discretionary in nature. This consumption patterns also varies substantially by households across geographies due to
differences in culture, traditions and tastes. Consumer preferences and economic environment have resulted in private label
and textile discounters gaining ground and the super and hyper markets have been successful in pushing unknown or fancy
brand names as well. Some of the emerging markets have also witnessed an interesting trend in consumption pattern as
increasing per capita income is resulting in bigger aspirations and big brand purchases. Internationally renowned brands have
initiated market presence in these markets and are looking forward to meaningful growth. In any case the home markets for
bigger brands in the developed markets are not growing at a faster pace whereas newer markets are providing opportunity to
grow.
Distribution channels
Importers purchase products from manufacturers abroad and we estimate that they generally add a 30-40% mark-up to cover
commissions, credit risk, after-sales service and the cost of carrying a local inventory to meet small orders. In contrast to the
agent, this importer holds his own stocks at his own risk.
Wholesalers cater to specialist shops as well as to department stores and home shopping companies. The wholesaler also
holds stocks at own risk. This non-importing distributor purchases from domestic manufacturers and importers. The mark-up
of wholesalers, Welspun estimates the mark-ups of wholesalers are approximately 20-30%. Large retail companies are
increasingly purchasing from abroad, thereby bypassing these intermediaries.
Purchasing agents widely used by retailers and wholesalers due to their network and knowledge of foreign markets. They do
not carry their own stock but purchase solely on request from their customers.
33
Domestic manufacturers either import the raw material required for the finishing operations or are primarily manufacturing
products which are freight unfriendly or difficult to manage with long supply chains. These manufacturers have the advantage
of proximity to the source of raw material as well as the customer.
Sales agents independent intermediaries between the (foreign) manufacturer and the retailer or retail organization,
receiving a commission from the former. The sales agents do not take title to the merchandise, they are responsible for
presenting samples to potential clients, obtaining orders, and forwarding these to the exporters.
Retailers constitute the final stage before products reach the consumer. A criterion for dividing the market is the composition
of the total assortment: wholly or partly specialized in selling home textiles.
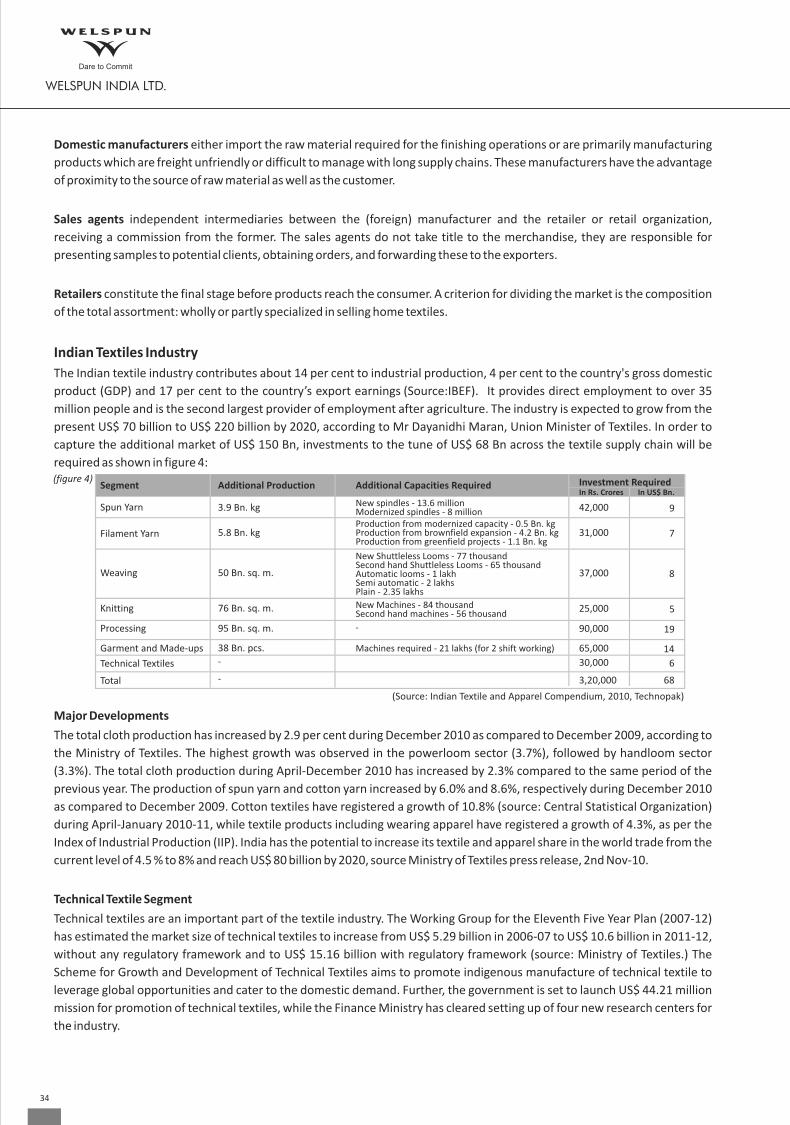
Indian Textiles Industry
The Indian textile industry contributes about 14 per cent to industrial production, 4 per cent to the country's gross domestic product (GDP) and 17 per cent to the country’s export earnings (Source:IBEF). It provides direct employment to over 35
million people and is the second largest provider of employment after agriculture. The industry is expected to grow from the
present US$ 70 billion to US$ 220 billion by 2020, according to Mr Dayanidhi Maran, Union Minister of Textiles. In order to
capture the additional market of US$ 150 Bn, investments to the tune of US$ 68 Bn across the textile supply chain will be
required as shown in figure 4:
Major Developments
The total cloth production has increased by 2.9 per cent during December 2010 as compared to December 2009, according to
the Ministry of Textiles. The highest growth was observed in the powerloom sector (3.7%), followed by handloom sector
(3.3%). The total cloth production during April-December 2010 has increased by 2.3% compared to the same period of the
previous year. The production of spun yarn and cotton yarn increased by 6.0% and 8.6%, respectively during December 2010
as compared to December 2009. Cotton textiles have registered a growth of 10.8% (source: Central Statistical Organization)
during April-January 2010-11, while textile products including wearing apparel have registered a growth of 4.3%, as per the
Index of Industrial Production (IIP). India has the potential to increase its textile and apparel share in the world trade from the
current level of 4.5 % to 8% and reach US$ 80 billion by 2020, source Ministry of Textiles press release, 2nd Nov-10.
Technical Textile Segment
Technical textiles are an important part of the textile industry. The Working Group for the Eleventh Five Year Plan (2007-12)
has estimated the market size of technical textiles to increase from US$ 5.29 billion in 2006-07 to US$ 10.6 billion in 2011-12,
without any regulatory framework and to US$ 15.16 billion with regulatory framework (source: Ministry of Textiles.) The
Scheme for Growth and Development of Technical Textiles aims to promote indigenous manufacture of technical textile to
leverage global opportunities and cater to the domestic demand. Further, the government is set to launch US$ 44.21 million
mission for promotion of technical textiles, while the Finance Ministry has cleared setting up of four new research centers for
the industry.
(figure 4)
(Source: Indian Textile and Apparel Compendium, 2010, Technopak)
34

Government Initiatives
Government has announced the restructuring of the Technology Upgradation Funds Scheme (TUFS) to boost investments in
Textiles sector. Investment under the Scheme has been increasing steadily. The Scheme for Integrated Textile Park (SITP) was
approved in July 2005 to facilitate setting up of textiles parks with world class infrastructure facilities. Forty parks have been
sanctioned till December 31, 2010 in nine states with total project cost of about US$ 931.1 million with Government
contribution of US$ 320 million. When fully functional the parks would have an investment of US$ 4.3 billion (source: IBEF).
The Government has also launched the Integrated Skill Development Scheme for the Textiles & Apparel Sector, including Jute
& Handicrafts, with an objective of capacity building of Institutions providing skill development & training in Textiles Sector.
Under this Scheme, the Government has envisaged skill development of 2.7 million persons with an overall cost of US$ 530
million over the next five years (source: IBEF).
India - A Manufacturing Destination
India continues to enjoy some of the key advantages as a manufacturing location is set to become as a major centre for
outsourcing of textile products for global markets. In the recent period the Indian economy has been growing but also has also
witnessed higher inflation and higher interest rate regime. This has resulted in major increase in the cost structure including
salary & wages. This coupled with increase in raw material prices has severely impacted the industry. The crude oil prices have
also been in a very high range of more than USD 90 per barrel which in turn has increased transportation costs. With the
volatility in foreign currency rates and appreciation of Indian rupees, the export earnings have taken a beating for the textiles
industry in general. With the reorganization of export and imports in the textiles industry it is imperative on the part of
government to provide boost to the textiles sector in terms of export benefits and lower interest cost. This is gaining more
relevance given the high level of employment generated by the industry and the forex earnings made by the exports. Despite
all this macro factors India continues to enjoy strategic advantage as a manufacturing destination as below:
Self sufficiency of raw materials
Firstly, India is amongst the top cotton growers in the world and is a net exporter of cotton. The same holds true for other raw
materials for textiles, both natural and man-made. Currently, India is exporting raw cotton and this is creating huge impact on
higher cotton prices, though they are aligned to global demand and supply forces. India needs to put a more strategic though
process to build finished product capacities and leverage on raw material availability and enjoy better margin on value
addition. This will create more employment and improve forex earnings in the country. Initiative to increase productivity
would be an added advantage. On the other hand other Asian countries such as China, Bangladesh, Pakistan, Thailand and
Indonesia are net importers of cotton and are also large exporters of finished textiles products. Thus India is well poised to use
the raw material availability to its overall advantage in the global trade and as well as move up the value chain.
Labour Cost Advantage
Secondly, young and skilled pool of working class is another important cost competitiveness with the country. This enables
easy availability of low cost skilled labor across different industries. The textile industry is no exception whereby India's cost of
production ranks amongst the lowest in the world today (source: ITMF, 2010).
Design Skills, Innovations and Value Addition Capabilities
Thirdly, India with its talent pool has become the harbinger of global design, innovation and value added products for the
global markets. This also enables to deliver smaller order sizes to large number of customers and also provide tailor made
design and service solutions for all types of customers. This niche is well appreciated in the global context as compared to
some of the other countries which typically stand for either very low cost of production or mass producers. India is well poised
to deliver some of the best in class products in both the mid segment and the high end segments of the market.
Economies of Scale owing to a Huge Domestic Market
Fourthly, India enjoys a unique advantage of being one of the largest textile market itself and a large consumer base in the
world, growing consistently over the years. Currently, domestic textile industry is being estimated to be around USD 52 billion
(source: Indian Textiles and Apparel Compendium, 2010, Technopak). A large part of Indian textiles industry is still
35

unorganized but provides a huge advantage in terms of lower manufacturing overheads and better operational efficiencies
possible with larger volumes. Indian producers are not only able to produce for both exports and domestic orders but are also
able to bring best international practices & design and delivery for the domestic consumers. This market is shaping up in a
great manner and is going be a big differentiator in the coming days.
The Home Textile Industry
World over, home textiles have always played an important role in the comfort, protection and decoration of households. The
size of the global home textiles industry, estimated to be $70 billion has been growing with China, Pakistan and India
remaining major players. Bangladesh too has emerged as an important supplier, thanks to its cheap labour, enterprising
private sector operators and edge in terms of duty exemptions and concessions that it enjoys as a Least Developed Country
(LDC). India and China have been the major preferred supplying countries as far as higher end products are concerned, while
Pakistan and Bangladesh dominate the lower end of the market.(<Source: emergingtextiles.com>) Earlier, quota restrictions
inhibited foreign manufacturers from developing economies of scale and the logistics & supply chain capabilities required to
effectively service overseas replenishment demand. The removal of quotas in January 2005 has resulted in the elimination of
the advantages enjoyed by manufacturers in the United States and improved the competitive position of the overseas
manufacturers. Manufacturing plants in USA and Europe have been shutting down and adapting their business model to
either relocating to low cost manufacturing locations, sourcing from Asia or getting acquired by companies from these
manufacturing centers.
WELSPUN - A SWOT Analysis
Opportunities
• Grow market share in important markets of US and
Europe
• Leverage global scale capacities and product portfolio to
offer complete solution to customers
• Multi-location production and distribution network to
serve the clients in superior manner
• Enhance backward integration and derive higher margin
on the entire value chain
• Leverage the brand capabilities in WGBL and WRL
• International design and innovation capability
Threats / Risks
• Intense completion in domestic market and international
markets
• Volatile Forex exchange rates
• Rising input costs
• Volatile Crude Prices
Strengths
• Strategically located manufacturing facilities (Anjar and
Vapi in Gujarat, India and Rosarito in Mexico)
• Economies of scale with modern manufacturing facilities
• Integration across the production chain (Spinning,
weaving, processing, cut and sew, packing and logistics)
• Wide range of product portfolio (terry towels and bed
linen, basic and decorative beddings and bath rugs)
• Focus on cost reduction
• Innovative Products
• Focus on quality (ISO 9001:2008 / ISO 14001:2004
certifications - by Intertek Systems Certification)
Weeknesses
• Does not have control over the entire value chain
• Volatility in raw material prices impacts the cost
structure
• Limited ability to command desired price from large
customers
WELSPUN
36

WELSPUN PRODUCTS
Welspun with its wide range of home textile products include terry towels, bed sheets & pillow cases, bath robes, bath rugs,
basic & decorative bedding.
Terry Towels
Welspun is the 3rd Largest Terry Towels manufacturer in the World with its quality products manufactured in different shapes
and sizes. These are beach towels, kitchen towels, baby hood towels, and for special use, such as hand towels, face towels and
bath sheets. These towels are woven out of 100% cotton yarn, acquire significant hygroscopic property, which is a prime
reason for using terry fabrics in home textiles in general and towels and bath robes in particular.
Bed Sheets & Pillow Cases
Welspun’s bed sheets is ranked 4th by HTT for its quality and innovation. These bed sheets come in different shapes and sizes
according to the bed sizes and mattress depth. Our bed sheets are made from cotton or various blends, such as polyester
cotton, cotton bamboo, cotton silk and cotton eucalyptus. Blends provide the consumer ease of maintenance and cost
effective of the product by the consumer.
Bath Rugs
Welspun’s rugs are of various designs using its multi-level cut loop machine to create multiple fiber lengths within a rug. Our
bath rugs are generally made of cotton, nylon or micro fiber and can be latex-backed, depending on consumer preferences.
Based on customer requirements, we make rugs of different sizes and weights including reversible rugs.
Basic Bedding and Decorative Bedding
Welspun ranks 4th in Comforters (Decorative Bedding) by HTT. The basic bedding includes mattress pads, blown and garneted
pillows and basic comforters while our decorative bedding products includes comforters, duvets, coverlets, bed skirts, shams,
decorative pillows and bolsters. Most of these products are made of polyester fiber fill wadding. The fill used for each product
varies according to customer requirements. Since the decorative products provide the look and feel to the bedroom, the
products are design-oriented.
Bath Robes
Welspun manufactures bath robes in different designs, shades and weights as per customer requirements. Its ability to make
piece dyed, yarn dyed, jacquard and velour bath robes. The bath robes are manufactured in different styles such as "kimono",
"hood", "zipper", and "shawl". Welspun specializes in the manufacture of a specific category of bath robes called "wraps". It
also provides embellishments, embroidery and prints as per customer requirements. The fabric for our bath robes is similar to
the fabric of our towels, which enables us to leverage the product development and innovation undertaken in the production
of terry towels.
Welspun
Products
Terry Towels
Bath Robes
Basic & Decorative Bedding
Bath Rugs
Bed Sheets &
Pillow Cases
(figure 5)
37
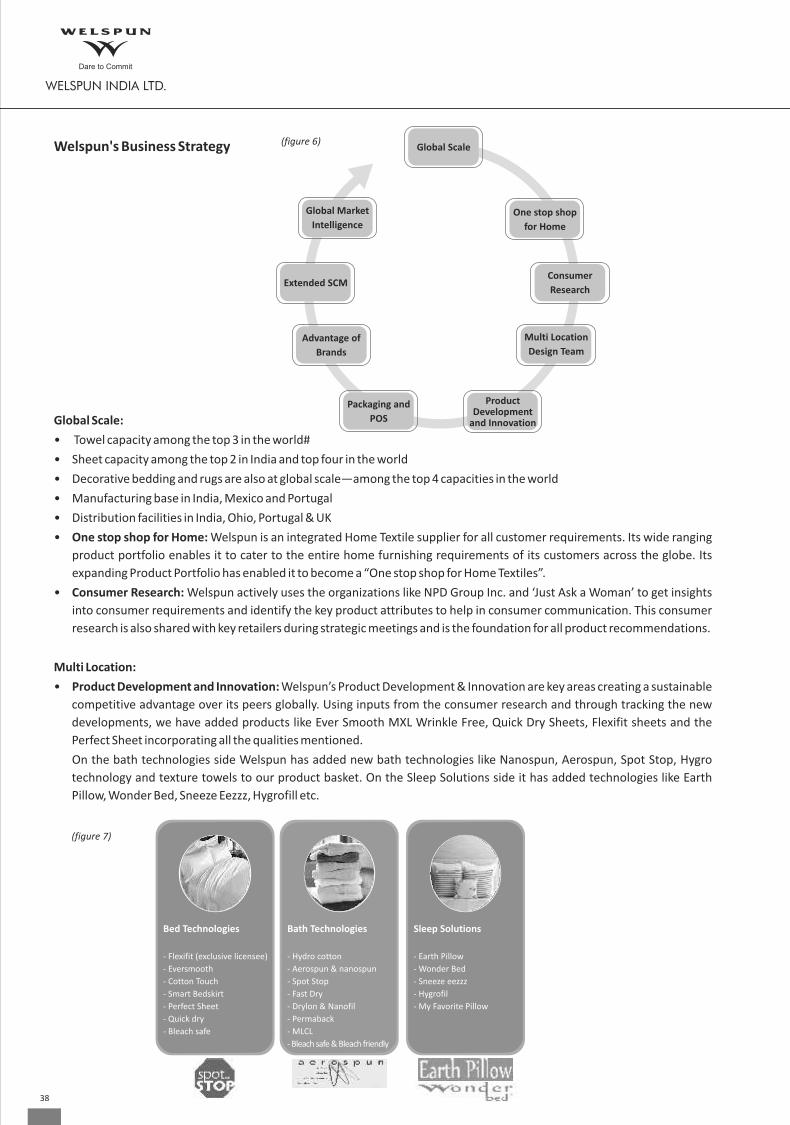
Welspun's Business Strategy
Global Scale:
• Towel capacity among the top 3 in the world#
• Sheet capacity among the top 2 in India and top four in the world
• Decorative bedding and rugs are also at global scale—among the top 4 capacities in the world
• Manufacturing base in India, Mexico and Portugal
• Distribution facilities in India, Ohio, Portugal & UK
• One stop shop for Home: Welspun is an integrated Home Textile supplier for all customer requirements. Its wide ranging
product portfolio enables it to cater to the entire home furnishing requirements of its customers across the globe. Its
expanding Product Portfolio has enabled it to become a “One stop shop for Home Textiles”.
• Consumer Research: Welspun actively uses the organizations like NPD Group Inc. and ‘Just Ask a Woman’ to get insights
into consumer requirements and identify the key product attributes to help in consumer communication. This consumer
research is also shared with key retailers during strategic meetings and is the foundation for all product recommendations.
Multi Location:
• Product Development and Innovation: Welspun’s Product Development & Innovation are key areas creating a sustainable
competitive advantage over its peers globally. Using inputs from the consumer research and through tracking the new
developments, we have added products like Ever Smooth MXL Wrinkle Free, Quick Dry Sheets, Flexifit sheets and the
Perfect Sheet incorporating all the qualities mentioned.
On the bath technologies side Welspun has added new bath technologies like Nanospun, Aerospun, Spot Stop, Hygro
technology and texture towels to our product basket. On the Sleep Solutions side it has added technologies like Earth
Pillow, Wonder Bed, Sneeze Eezzz, Hygrofill etc.
Bed Technologies
- Flexifit (exclusive licensee)
- Eversmooth
- Cotton Touch
- Smart Bedskirt
- Perfect Sheet
- Quick dry
- Bleach safe
Bath Technologies
- Hydro cotton
- Aerospun & nanospun
- Spot Stop
- Fast Dry
- Drylon & Nanofil
- Permaback
- MLCL
- Bleach safe & Bleach friendly
Sleep Solutions
- Earth Pillow
- Wonder Bed
- Sneeze eezzz
- Hygrofil
- My Favorite Pillow
Global Scale
Global Market
Intelligence
Extended SCM
Advantage of
Brands
Packaging and
POS
Product Development
and Innovation
Multi Location
Design Team
Consumer
Research
One stop shop
for Home
(figure 6)
(figure 7)
38
• Packaging and Point of Sale: Welspun has marketing teams in USA and in India which work on development of packaging
for different products. Point of sale communication is also developed in order to ensure the key functional product
attributes are communicated to the consumer at the retail floor.
• Advantage of Brands: WIL supplies its products to the premium International and Domestic brands under WGBL like
Welhome and Spaces Home & Beyond in Domestic and Christy, Sorema, Graciozza, Kngsley, and Luxus etc.
• Extended SCM: Welspun is among the few manufacturers who provide Collaborative Forecasting, Planning and
Replenishment to its customers over more than 30 programs from POS to production at the plant level.
• Global Market Intelligence: Welspun has presence at multiple locations across the world and uses this presence to build
the market intelligence for different markets. In addition to this, secondary research using published Industry sources
helps to build the market intelligence.
Principal Factors Affecting Results of Operations
• Volatility in Cotton Prices which is the main Raw Material for the business
• General economic conditions
• Condition and performance of Indian and international textile industry
• Price and availability of raw materials/ factors of production
• Demand and supply of products across the globe
• Foreign exchange fluctuations: Most of the costs of our operations and income are in Indian Rupees. However, we do have
indirect exposure to foreign exchange fluctuations as the sale prices of our products sold to WGBL are based on the
prevailing exchange rate. Further, we are exposed to foreign exchange fluctuations in relation to our manufacturing facility
in Mexico, as the costs of operation of this facility are in Peso and the income from its sales are in US Dollars.
• Global Competition
Welspun's efforts to sharpen competitive edge
• Welspun defined strategy, towards the improved product mix and optimized utilization of assets.
• Continue with the improvement in Retail Operations by
- Improve Merchandising & Store Experience
- Build Organizational Capability
- Build brand awareness
- Improve efficiencies, reduce closeouts, and increase in-stock availability
• Further expansion /modernization of its manufacturing capacities with an objective to attain increase in volume with
lower overhead, better quality and replacement/ upgradation of technology.
• Focusing on increasing contribution of Innovative products to portfolio
• Cost optimization with an aim to become the lowest cost producer of home textiles globally and further aims to become
the preferred partner in home textiles for global initiative with its business model.
In 2011-12, Welspun plans to:
• Sustain its market share of all products in USA and UK while improving its share in other geographies
• Stabilize the sales of licensed brand products in UK
• Increase sales in Europe through Sorema, while we have made an entry at many retailers now we need to leverage our
presence to get significantly higher sales from Europe.
• Increase revenues in fashion bedding, basic bedding and bath rugs
• Product Development and Innovation to remain a focus area for growth especially in current volatile cotton scenario
• Strengthening of Process : Reducing turnaround times and quicker customer response
• Develop new markets like Korea, Japan, Russia and China
• Create innovative products for all markets
• Continuous focus on cost reduction at plants and subsidiaries across locations in each category of products
39
Research and Development
Welspun has a strong focus on research and development of products, processes and technology to endeavor and achieve a
leading position in the international market. In order to achieve this Welspun is focusing on:
• Continuously monitoring our product quality
• Maintaining highly trained and experienced employees
• Using the latest technology available to create high quality products
• Developing new manufacturing and testing facilities to eliminate possibilities of defects in our products
• Providing training to our employees working in research and development as well as in other associated departments
Our management is committed to providing all necessary resources for research and development in order to achieve a
leading position in the global market.
HUMAN RESOURCES POLICY
Our HR policies cover our objectives, eligibility & coverage, policies and procedures. We review, revise and update our Human
Resource policies consistently to make them relevant, effective and useful to the employees.
OUTLOOK
The Textile business is passing through a tough phase due to increase in raw material cost , higher oil price , high inflation and
higher wage cost, volatile forex rates and limited ability to pass on price rise due competitive business environment.
The opportunity lies in building efficiency in operating processes, better control over input costs, bring design and innovation
in the product portfolio and providing complete solution to the customers. The markets in the developed countries are
shaping up well despite some challenges in some of the countries and the potential for domestic Indian market continues
remain loss. We believe the home textile business will see increasing share in the organized sector and better capacity
utilization and sweating of assets will deliver better profitability.
However during the current fiscal the cotton prices are now showing the downward trend and settling at a sustainable level,
while the company is showing an upward curve in order booking for its products. With such encouraging twin effects the
future prospects looks promising.
INTERNAL CONTROL SYSTEM AND THEIR ADEQUACY
At Welspun, the internal control system encompasses the policies, processes, tasks, behaviours and other aspects of Welspun
that taken together, facilitate effective and efficient operation, quality of internal and external reporting, compliance with
applicable laws and regulations. Welspun's objectives, its internal organization and the environment in which it operates are
continuously evolving and as a result, the risks it faces are continuously changing. In order to make its internal control effective
and sound, Welspun thoroughly and regularly evaluates the nature and extent of the risks to which the Company is exposed.
The operation and monitoring of the system of internal control has been taken by individuals who collectively possess the
necessary skills, technical knowledge, objectivity, understanding of the Company, industries and markets in which it operates.
The qualified, experienced and independent Audit Committee of the Board of Directors actively reviews the adequacy and
effectiveness of internal controls systems and suggests improvements for strengthening them. Welspun has a strong
Management Information System which is an integral part of the control mechanism. Welspun has successfully implemented
an enterprise wide solution (ERP) in its textile plants.
40

DISCUSSION OF FINANCIAL PERFORMANCE
The Company has shown robust performance during the year. The significant developments which have major impact on
financial numbers were:
Sales growth of 6.07%, backed by
• Higher Sales volume of Bed Linen Product by 23.2%
• Higher Sales volume of Rugs by 70.2%.
• Higher realization in line with higher raw material costs
• Whereas, revenues from Mexico subsidiary operations were lower at Rs. 511.37 million in FY11 against Rs. 730.25
million in FY10 due to lower level of activity.
KEY FINANCIAL DATA - Consolidated
(Rs. in million, except per share data)
Particulars FY 10-11 % FY 09-10 % YOY Change
YOY % Change
Net Sales (net of excise) 20,548.11 100.00 19,371.62 100.00 1,176.49 6.07
Other Income 736.68 3.59 683.61 3.53 53.06 7.76
Gain on disposal of Subsidiaries and Associates pursuant to Demerger
- - 710.85
3.67
(710.85)
(100.00)
Cost of Material 10,603.26 51.60 9,481.33 48.94 1,121.93 11.83
Manufacturing Expenses 5,514.37 26.84 4,829.37 24.93 685.00 14.18
Employee Cost 1,670.64 8.13 1,316.50 6.80 354.14 26.90
Selling Administration and Other Expenses 1,057.04 5.14 900.67 4.65 156.36 17.36
Reported EBIDTA 2,439.49 11.87 4,238.21 21.88 (1,798.72) (42.44)
Financial Expenses 800.89 3.90 925.73 4.78 (124.84) (13.49)
Depreciation 1,203.34 5.86 1,126.26 5.81 77.08 6.84
Taxes 403.05 1.96 571.36 2.95 (168.31) (29.46)
Net Income from Ordinary Activites 32.21 0.16 1,614.86 8.34 (1,582.65) (98.01)
Share of Associate's Net (Loss)/ Profit (18.19) (0.09) (6.57) (0.03) (11.62) 176.92
PAT (Profit After Tax) 14.02 0.07 1,608.29 8.30 (1,594.27) (99.13)
EPS (Basic and Diluted) 0.16 22.00 (21.85) (99.28)- -
41
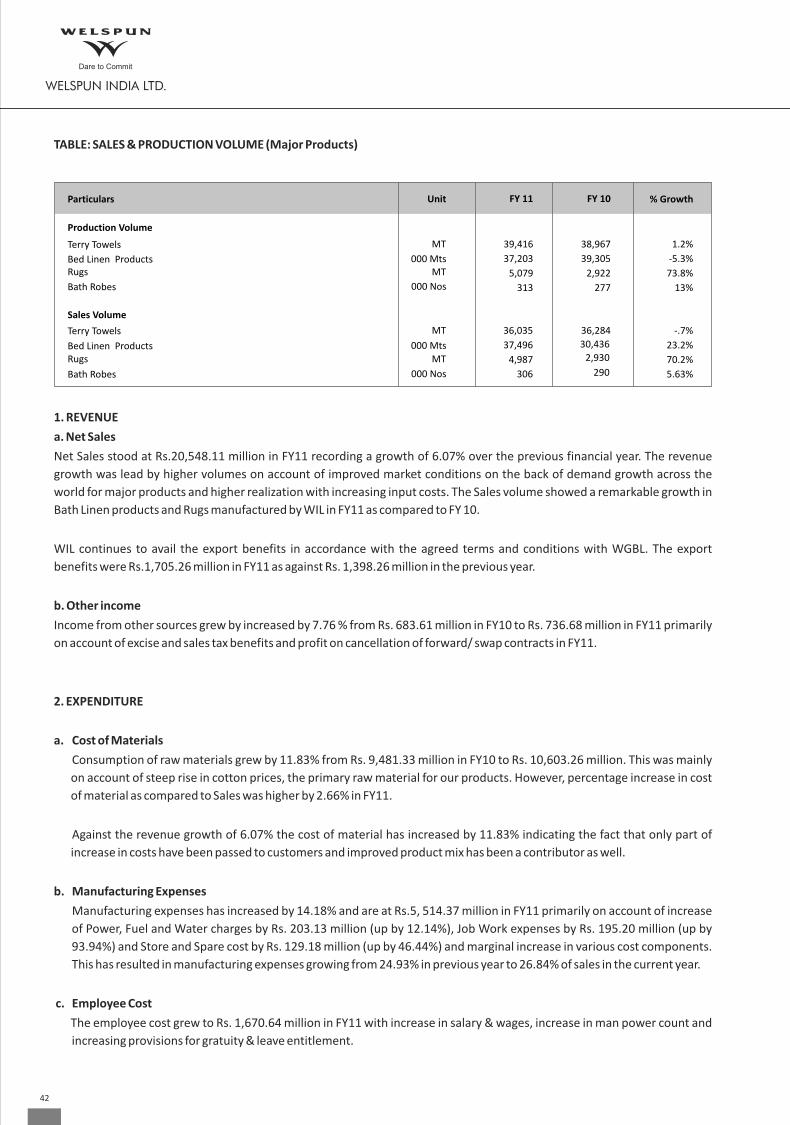
TABLE: SALES & PRODUCTION VOLUME (Major Products)
1. REVENUE
a. Net Sales
Net Sales stood at Rs.20,548.11 million in FY11 recording a growth of 6.07% over the previous financial year. The revenue
growth was lead by higher volumes on account of improved market conditions on the back of demand growth across the
world for major products and higher realization with increasing input costs. The Sales volume showed a remarkable growth in
Bath Linen products and Rugs manufactured by WIL in FY11 as compared to FY 10.
WIL continues to avail the export benefits in accordance with the agreed terms and conditions with WGBL. The export
benefits were Rs.1,705.26 million in FY11 as against Rs. 1,398.26 million in the previous year.
b. Other income
Income from other sources grew by increased by 7.76 % from Rs. 683.61 million in FY10 to Rs. 736.68 million in FY11 primarily
on account of excise and sales tax benefits and profit on cancellation of forward/ swap contracts in FY11.
2. EXPENDITURE
a. Cost of Materials
Consumption of raw materials grew by 11.83% from Rs. 9,481.33 million in FY10 to Rs. 10,603.26 million. This was mainly
on account of steep rise in cotton prices, the primary raw material for our products. However, percentage increase in cost
of material as compared to Sales was higher by 2.66% in FY11.
Against the revenue growth of 6.07% the cost of material has increased by 11.83% indicating the fact that only part of
increase in costs have been passed to customers and improved product mix has been a contributor as well.
b. Manufacturing Expenses
Manufacturing expenses has increased by 14.18% and are at Rs.5, 514.37 million in FY11 primarily on account of increase
of Power, Fuel and Water charges by Rs. 203.13 million (up by 12.14%), Job Work expenses by Rs. 195.20 million (up by
93.94%) and Store and Spare cost by Rs. 129.18 million (up by 46.44%) and marginal increase in various cost components.
This has resulted in manufacturing expenses growing from 24.93% in previous year to 26.84% of sales in the current year.
c. Employee Cost
The employee cost grew to Rs. 1,670.64 million in FY11 with increase in salary & wages, increase in man power count and
increasing provisions for gratuity & leave entitlement.
Particulars Unit FY 11
FY 10 % Growth
Production Volume
Terry Towels 39,416
37,203
5,079
313
Bed Linen ProductsRugs
Bath Robes
Sales Volume
Terry Towels
Bed Linen ProductsRugs
Bath Robes
MT
000 MtsMT
000 Nos
MT
000 Mts
MT 000 Nos
38,967
39,305
2,922
277
1.2%
-5.3%
73.8%
13%
36,284 -.7%
23.2%
70.2%
5.63%
36,035
37,496
4,987
306
30,436
2,930
290
42

d. Selling, Administration and Other Expenses
The selling administration and other expenses has increased by Rs. 156.37 million and scaled upto Rs. 1,057.04 million
largely due to higher rent charges, higher legal and foreign exchange losses. Whereas, some of the expenses are lower like
freight, forwarding and coolie charges as export dispatches were replaced with domestic sales to WGBL.
e. Finance Expenses (Net)
The net interest cost in FY11 was lower at Rs. 800.89 million as against Rs. 925.73 million in FY10 despite increase in the
loan funds. The Company has mainly benefited by judiciously managing its funds and deriving interest income earned on
surplus funds.
f. Depreciation
Depreciation was higher at Rs. 1,203.34 million in FY11 as against Rs.1, 126.26 million in FY10 primarily on account of
commissioning of new plant and machinery.
g. Taxes
In the current year, total tax provisions were Rs. 403.05 million as compared Rs. 571.36 million in the previous year, which
is in line with current year’s profits.
3. MARGINS
a. EBIDTA
The EBIDTA has is lower from Rs. 4,238.21 million in FY10 to Rs. 2,439.49 million in FY11 due to lower increases in prices
and all round increase various cost components as explained above. This resulted in lower operating EBITDA margins at
11.87% in FY 11 as compared to 21.88% in FY 10.
b. Profit After Tax
Profit after tax in FY11 was Rs. 14.02 million as against a profit of Rs. 1,608.29 million of profit in the previous year.
4. EARNING PER SHARE (Basic)
The Earning per Share for the year ending March 31, 2011 (Basic) (before extra-ordinary item) was Rs. 0.16 against Rs. 22.00
per share in the previous year.
5. TABLE: BALANCE SHEET
(Rs. In million)
16,571.96
As At Particulars
March 31, 2011
SHAREHOLDERS' FUNDS
Share Capital 939.76
Reserves and Surplus 5,749.79
6,689.55
LOAN FUNDS
Secured Loans
Unsecured Loans
Total
Total
DEFERRED TAX LIABILITY (NET)
TOTAL
16,391.51 180.44
As At ChangeMarch 31, 2010
780.90
4,433.16 1,316.62
5,214.06 1,475.49
158.86
834.50
17,406.46
1,878.45
25,974.46
417.38 417.12
16,808.89 597.57
1,561.98 316.47
23,584.93 2,389.53
43
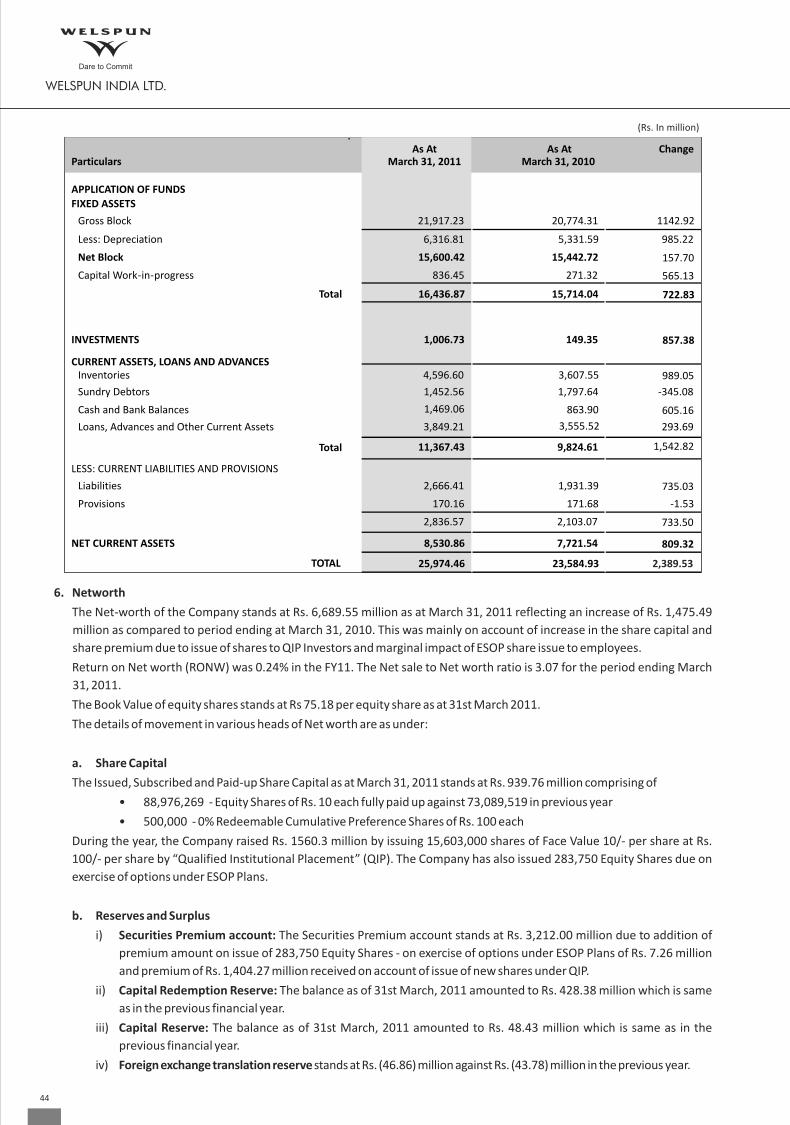
6. Networth
The Net-worth of the Company stands at Rs. 6,689.55 million as at March 31, 2011 reflecting an increase of Rs. 1,475.49
million as compared to period ending at March 31, 2010. This was mainly on account of increase in the share capital and
share premium due to issue of shares to QIP Investors and marginal impact of ESOP share issue to employees.
Return on Net worth (RONW) was 0.24% in the FY11. The Net sale to Net worth ratio is 3.07 for the period ending March
31, 2011.
The Book Value of equity shares stands at Rs 75.18 per equity share as at 31st March 2011.
The details of movement in various heads of Net worth are as under:
a. Share Capital
The Issued, Subscribed and Paid-up Share Capital as at March 31, 2011 stands at Rs. 939.76 million comprising of
• 88,976,269 - Equity Shares of Rs. 10 each fully paid up against 73,089,519 in previous year
• 500,000 - 0% Redeemable Cumulative Preference Shares of Rs. 100 each
During the year, the Company raised Rs. 1560.3 million by issuing 15,603,000 shares of Face Value 10/- per share at Rs.
100/- per share by “Qualified Institutional Placement” (QIP). The Company has also issued 283,750 Equity Shares due on
exercise of options under ESOP Plans.
b. Reserves and Surplus
i) Securities Premium account: The Securities Premium account stands at Rs. 3,212.00 million due to addition of
premium amount on issue of 283,750 Equity Shares - on exercise of options under ESOP Plans of Rs. 7.26 million
and premium of Rs. 1,404.27 million received on account of issue of new shares under QIP.
ii) Capital Redemption Reserve: The balance as of 31st March, 2011 amounted to Rs. 428.38 million which is same
as in the previous financial year.
iii) Capital Reserve: The balance as of 31st March, 2011 amounted to Rs. 48.43 million which is same as in the
previous financial year.
iv) Foreign exchange translation reserve stands at Rs. (46.86) million against Rs. (43.78) million in the previous year.
As At
As At
Change
Particulars
March 31, 2011
March 31, 2010
APPLICATION OF FUNDS
FIXED ASSETS
Gross Block
21,917.23 20,774.31 1142.92
Less: Depreciation
6,316.81 5,331.59
Net Block
15,600.42 15,442.72
Capital Work-in-progress
836.45 271.32
Total 16,436.87 15,714.04
INVESTMENTS
1,006.73 149.35 857.38
CURRENT ASSETS, LOANS AND ADVANCES
Inventories
Sundry Debtors
Cash and Bank Balances
Loans, Advances and Other Current Assets
LESS: CURRENT LIABILITIES AND PROVISIONS
Liabilities
Provisions
NET CURRENT ASSETS
2,389.53
(Rs. In million)
TOTAL
Total
985.22
157.70
565.13
722.83
4,596.60 3,607.55 989.05
1,452.56 1,797.64 -345.08
1,469.06 863.90 605.16
3,849.21 3,555.52 293.69
11,367.43 9,824.61 1,542.82
2,666.41 1,931.39 735.03
170.16 171.68 -1.53
2,836.57 2,103.07 733.50
8,530.86 7,721.54 809.32
23,584.9325,974.46
44
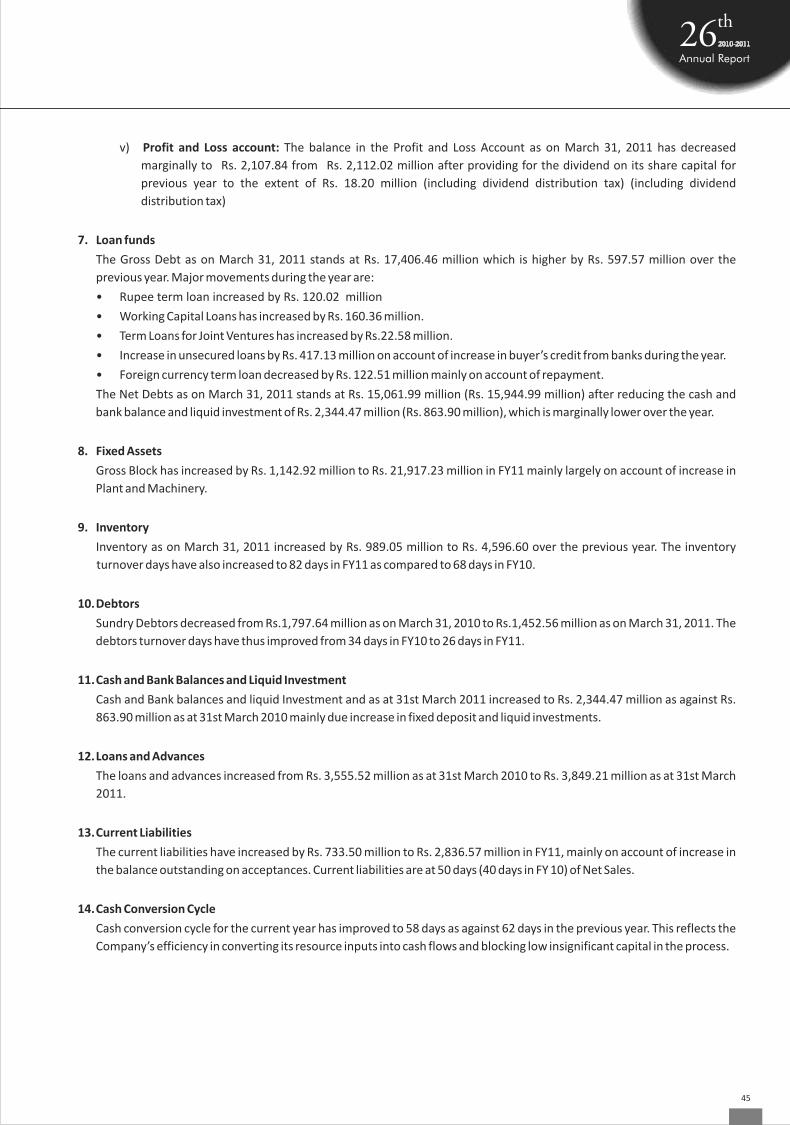
v) Profit and Loss account: The balance in the Profit and Loss Account as on March 31, 2011 has decreased
marginally to Rs. 2,107.84 from Rs. 2,112.02 million after providing for the dividend on its share capital for
previous year to the extent of Rs. 18.20 million (including dividend distribution tax) (including dividend
distribution tax)
7. Loan funds
The Gross Debt as on March 31, 2011 stands at Rs. 17,406.46 million which is higher by Rs. 597.57 million over the
previous year. Major movements during the year are:
• Rupee term loan increased by Rs. 120.02 million
• Working Capital Loans has increased by Rs. 160.36 million.
• Term Loans for Joint Ventures has increased by Rs.22.58 million.
• Increase in unsecured loans by Rs. 417.13 million on account of increase in buyer’s credit from banks during the year.
• Foreign currency term loan decreased by Rs. 122.51 million mainly on account of repayment.
The Net Debts as on March 31, 2011 stands at Rs. 15,061.99 million (Rs. 15,944.99 million) after reducing the cash and
bank balance and liquid investment of Rs. 2,344.47 million (Rs. 863.90 million), which is marginally lower over the year.
8. Fixed Assets
Gross Block has increased by Rs. 1,142.92 million to Rs. 21,917.23 million in FY11 mainly largely on account of increase in
Plant and Machinery.
9. Inventory
Inventory as on March 31, 2011 increased by Rs. 989.05 million to Rs. 4,596.60 over the previous year. The inventory
turnover days have also increased to 82 days in FY11 as compared to 68 days in FY10.
10.Debtors
Sundry Debtors decreased from Rs.1,797.64 million as on March 31, 2010 to Rs.1,452.56 million as on March 31, 2011. The
debtors turnover days have thus improved from 34 days in FY10 to 26 days in FY11.
11.Cash and Bank Balances and Liquid Investment
Cash and Bank balances and liquid Investment and as at 31st March 2011 increased to Rs. 2,344.47 million as against Rs.
863.90 million as at 31st March 2010 mainly due increase in fixed deposit and liquid investments.
12.Loans and Advances
The loans and advances increased from Rs. 3,555.52 million as at 31st March 2010 to Rs. 3,849.21 million as at 31st March
2011.
13.Current Liabilities
The current liabilities have increased by Rs. 733.50 million to Rs. 2,836.57 million in FY11, mainly on account of increase in
the balance outstanding on acceptances. Current liabilities are at 50 days (40 days in FY 10) of Net Sales.
14.Cash Conversion Cycle
Cash conversion cycle for the current year has improved to 58 days as against 62 days in the previous year. This reflects the
Company’s efficiency in converting its resource inputs into cash flows and blocking low insignificant capital in the process.
45
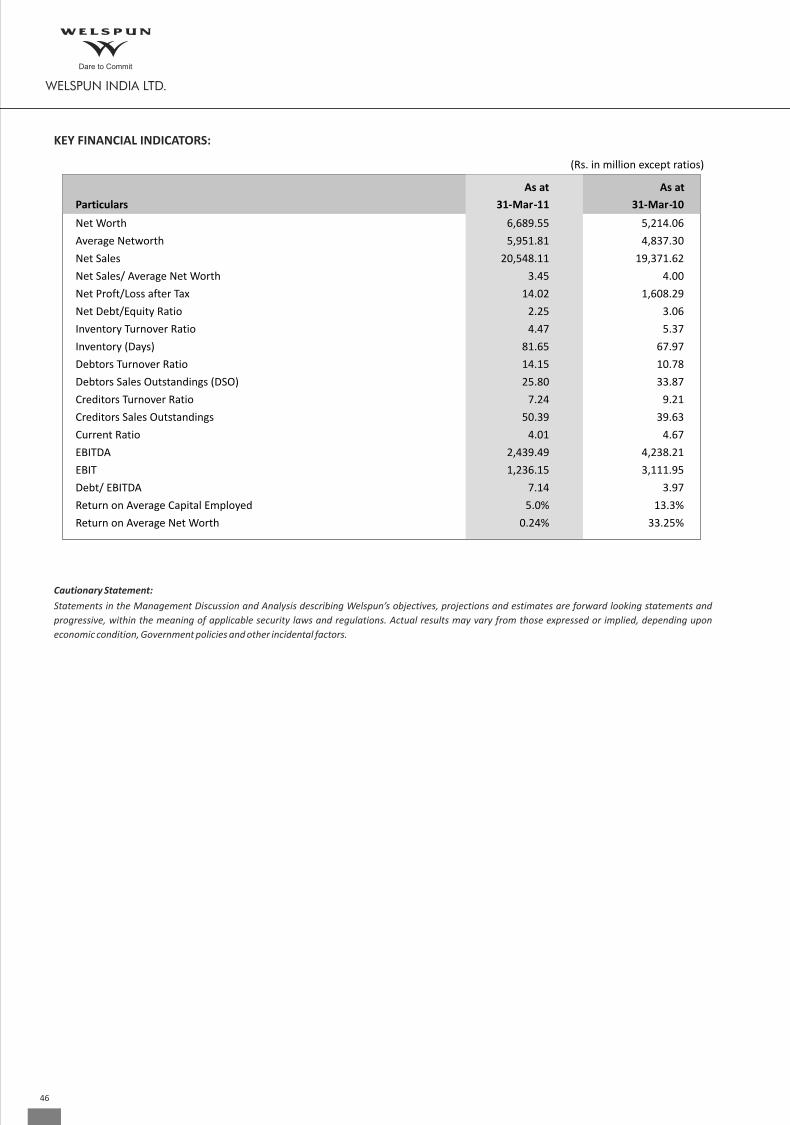
Cautionary Statement:
Statements in the Management Discussion and Analysis describing Welspun’s objectives, projections and estimates are forward looking statements and
progressive, within the meaning of applicable security laws and regulations. Actual results may vary from those expressed or implied, depending upon
economic condition, Government policies and other incidental factors.
KEY FINANCIAL INDICATORS:
As at As at
Particulars 31-Mar-11 31-Mar-10
Net Worth
Average Networth
Net Sales
Net Sales/ Average Net Worth
Net Proft/Loss after Tax
Net Debt/Equity Ratio
Inventory Turnover Ratio
Inventory (Days)
Debtors Turnover Ratio
Debtors Sales Outstandings (DSO)
Creditors Turnover Ratio
Creditors Sales Outstandings
Current Ratio
EBITDA
EBIT
Debt/ EBITDA
Return on Average Capital Employed
Return on Average Net Worth
6,689.55
5,951.81
20,548.11
3.45
14.02
2.25
4.47
81.65
14.15
25.80
7.24
50.39
4.01
2,439.49
1,236.15
7.14
5.0%
0.24%
5,214.06
4,837.30
19,371.62
4.00
1,608.29
3.06
5.37
67.97
10.78
33.87
9.21
39.63
4.67
4,238.21
3,111.95
3.97
13.3%
33.25%
(Rs. in million except ratios)
46
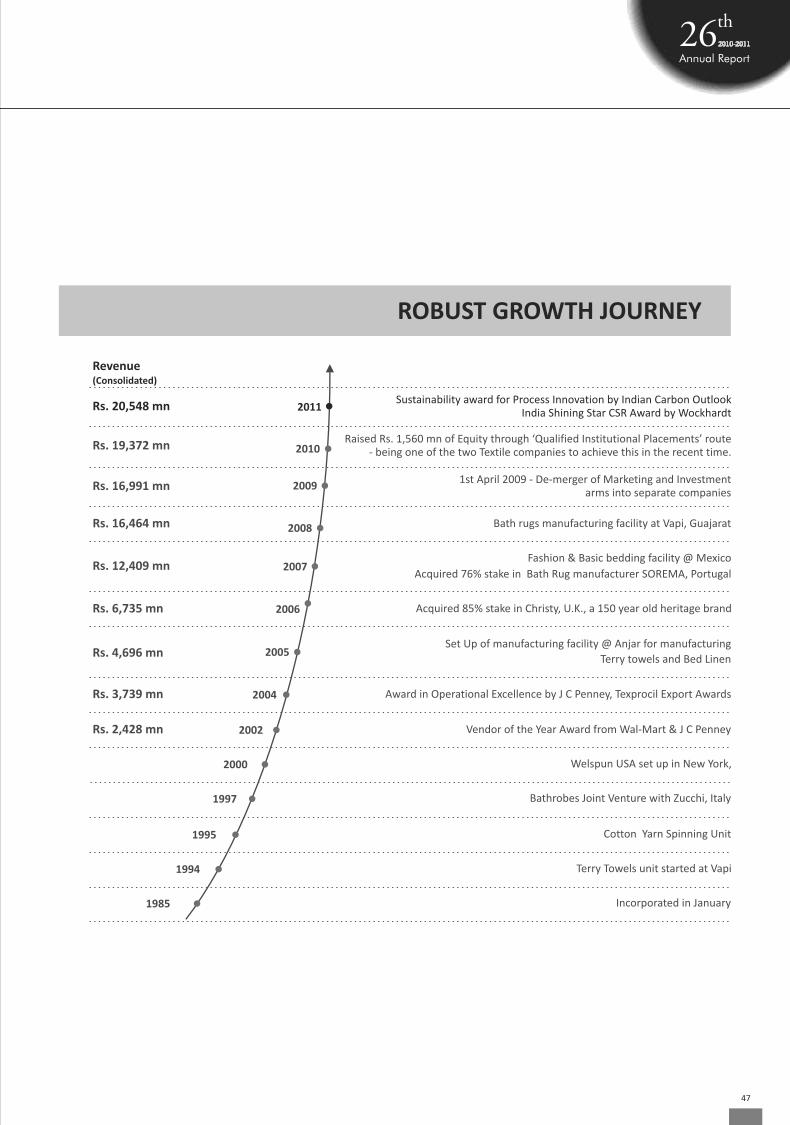
Vendor of the Year Award from Wal-Mart & J C Penney
1st April 2009 - De-merger of Marketing and Investment arms into separate companies
Raised Rs. 1,560 mn of Equity through ‘Qualified Institutional Placements’ route - being one of the two Textile companies to achieve this in the recent time.
Bath rugs manufacturing facility at Vapi, Guajarat
Fashion & Basic bedding facility @ Mexico
Acquired 76% stake in Bath Rug manufacturer SOREMA, Portugal
Acquired 85% stake in Christy, U.K., a 150 year old heritage brand
Set Up of manufacturing facility @ Anjar for manufacturing
Terry towels and Bed Linen
Award in Operational Excellence by J C Penney, Texprocil Export Awards
Incorporated in January
Terry Towels unit started at Vapi
Cotton Yarn Spinning Unit
Bathrobes Joint Venture with Zucchi, Italy
Rs. 19,372 mn
Rs. 16,991 mn
Rs. 16,464 mn
Rs. 12,409 mn
Rs. 6,735 mn
Rs. 4,696 mn
Rs. 3,739 mn
Rs. 2,428 mn
2010
2009
2008
2007
2006
2005
2004
2002
2000
1985
1994
1995
1997
Revenue (Consolidated)
Welspun USA set up in New York,
Sustainability award for Process Innovation by Indian Carbon Outlook India Shining Star CSR Award by Wockhardt
Rs. 20,548 mn 2011
ROBUST GROWTH JOURNEY
47
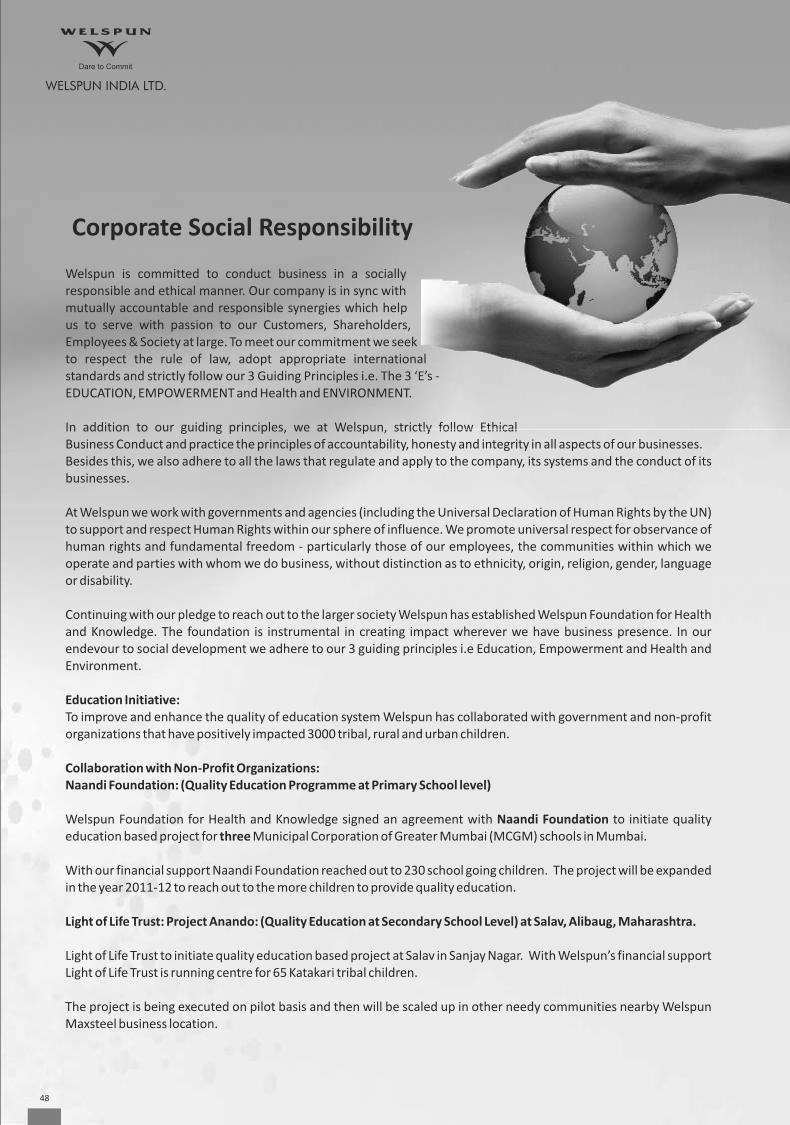
Welspun is committed to conduct business in a socially responsible and ethical manner. Our company is in sync with mutually accountable and responsible synergies which help us to serve with passion to our Customers, Shareholders, Employees & Society at large. To meet our commitment we seek to respect the rule of law, adopt appropriate international standards and strictly follow our 3 Guiding Principles i.e. The 3 ‘E’s - EDUCATION, EMPOWERMENT and Health and ENVIRONMENT.
In addition to our guiding principles, we at Welspun, strictly follow Ethical Business Conduct and practice the principles of accountability, honesty and integrity in all aspects of our businesses. Besides this, we also adhere to all the laws that regulate and apply to the company, its systems and the conduct of its businesses.
At Welspun we work with governments and agencies (including the Universal Declaration of Human Rights by the UN) to support and respect Human Rights within our sphere of influence. We promote universal respect for observance of human rights and fundamental freedom - particularly those of our employees, the communities within which we operate and parties with whom we do business, without distinction as to ethnicity, origin, religion, gender, language or disability.
Continuing with our pledge to reach out to the larger society Welspun has established Welspun Foundation for Health and Knowledge. The foundation is instrumental in creating impact wherever we have business presence. In our endevour to social development we adhere to our 3 guiding principles i.e Education, Empowerment and Health and Environment.
Education Initiative: To improve and enhance the quality of education system Welspun has collaborated with government and non-profit organizations that have positively impacted 3000 tribal, rural and urban children.
Collaboration with Non-Profit Organizations: Naandi Foundation: (Quality Education Programme at Primary School level)
Welspun Foundation for Health and Knowledge signed an agreement with Naandi Foundation to initiate quality education based project for three Municipal Corporation of Greater Mumbai (MCGM) schools in Mumbai.
With our financial support Naandi Foundation reached out to 230 school going children. The project will be expanded in the year 2011-12 to reach out to the more children to provide quality education.
Light of Life Trust: Project Anando: (Quality Education at Secondary School Level) at Salav, Alibaug, Maharashtra.
Light of Life Trust to initiate quality education based project at Salav in Sanjay Nagar. With Welspun’s financial support Light of Life Trust is running centre for 65 Katakari tribal children.
The project is being executed on pilot basis and then will be scaled up in other needy communities nearby Welspun Maxsteel business location.
Corporate Social Responsibility
48
Environment Initiative: Bombay Natural History Society: (Hornbill Club Project) at Salav, Alibaug, Maharashtra.
Hornbill Club Project on Environment and Conservation programme initiated in Welspun Vidya Mandir Salav, and Welspun Vidya Mandir Anjar – programme covers around four hundred and ninety students from standard 5th to 8th and 15 teachers. Welspun’s environment based initiatives are to improve the standard of operations and have successfully managed net reduction of CO2 emission. In addition, Welspun transformed once devastated deserts to green-belt by planting – programme covers around four hundred and ninety students from standard 5th to 8th and 15 teachers.
Welspun’s environment based initiatives are to improve the standard of operations and have successfully managed net reduction of CO2 emission. In addition, Welspun transformed once devastated deserts to green-belt by planting 100,000 saplings in and around Anjar.
Welspun has collaborated with non-profit organization to create environment awareness and conservation amongst communities.
Empowerment and Health Projects at Anjar - Kutch and Salav - MaharashtraHealth Initiative: Welspun’s health centers are providing health facilities for underprivileged population from the neighboring villages, particularly on general health, mother and child health care and also by sponsoring major health expenditure.
Women Empowerment initiative at Varsamedi, Anjar: Empowerment is one of the important principles Welspun foundation work on. Welspun pioneered Mission Mangalam Scheme with Gujarat Government. This initiative brings livelihood options by building capacities and providing trainings to the rural women. Approximately 125 women are trained under this scheme. The same project has been replicated in Bhadreshwar as Public Private Partnership.
Skill development and livelihood project at Welspun Grams for women Two centers for women are being run to develop cutting and stitching skills and to bring livelihood to them. Approximately 75 women from both the centers have been trained and given jobs.
Self Help Groups at Salav: Ten self help groups have been formed in villages to empower women by providing v a r i o u s s k i l l s a n d b u i l d i n g their capacities. Approximately 250 women are participating enthusiastically in act iv i t ies and t ra in ing be ing provided to them. The main aim behind forming SHG’s is to mobilize women for their own development as well as communities.
49
Computer centre at Salav With the growing need to computer skills and the availability of jobs a computer training centre is started in Salav village for the basic computer literacy. In last three months 120 students have been benefitted with this initiative. Along with the computer skills other soft skills sessions have also beenorganised for the students by Maxsteel employee volunteers.
Adoption of Industrial Training Institute at Vansda in Navsari District Welspun India Ltd, (WIL) Vapi has adopted an ITI in Vansda, District, and Navsari under the Central Govt. Scheme of “ITI upgradation by Public-Private Partnership” where three new trades i.e Spinning, Weaving and Cut & Sew are being introduced. The theoretical classes are taken care of by MS University Professors and On-Job Training is imparted by WIL, Vapi unit. The successful student of these trades will be given opportunity to be absorbed in WIL.
Tie up with MPSTME College, Sirpur, VapiWIL has tied up with MPSTME College, Sirpur and Vapi where students belong mainly to rural background. Around 13 students are being provided opportunity of six months practical training in WIL. The boarding, lodging & transportation for these students are extended by WIL free of cost and are being trained to be made fit for the industry as soon as they complete their academics. Job opportunity will be provided by Welspun to them on completion of their course.
Volunteerism at Welspun Volunteerism is one of the crucial elements in all our CSR initiatives at all our locations. Our employee’s volunteers participate enthusiastically and consistently. Their participation is strategically planned that helps to get different set of skills.
Joy of Giving Week with Light of Life Trust As part of Joy of Giving Week the Light of Life Trust organised Spandan programme to raise funds wherein children from their Alibaug and Karjat performed. This performance was supported by Welspun with buying tickets for our Welspun Vidya Mandir community club members and teachers.
Charitable Donations:Partnered with Save The Children India to support victims of cloud burst in Ladakh.
Donation of desks and benches to Government run primary school, Korlai village in Alibaug benefiting around 350 students.
Supported orphanage/homes with donations like bed sheets and towels
Creating awareness and employee participation
Organised Blood donation Camp at Welspun Head Office123 employees donated blood in the blood donation camp organised in Welspun HO on 27th May 2011. Employees have been provided with the blood donation card to avail blood in emergency.
World Environment Day World environment day organised at Welspun HO in order to bring about awareness on environment related issues through the competition. Overwhelming response received by Welspunites. Three best ideas to protect the environment were awarded.
50

School Material Distribution DriveWelspun employees donated school material like text books, stationary that was Vatsalya foundation working for street children organization.
Corporate Yoga Sessions for Welspun EmployeesCorporate Yoga Sessions by Mrs. Preeti Mandawewala is organised at Anjar, Vapi, Silvassa, Zagadia, Dahej and Welspun Vidya Mandir Anjar. In all 700 employees benefitted from the sessions.
Special Achievement Welspun is honoured with India Shining CSR Award – “Outstanding CSR in Textile Sector” hosted by Wockhardt. The award ceremony was presided by Noble Peace Laureate - The Dalai Lama, Noble Peace Laureate - Prof. Muhammad Younis and Union Cabinet Minister Dr. Salman Khurshid.
At the Wockhardt Foundation’s first ‘CSR Thought Leadership Conclave’ 2011 Industry Leaders emphasized the need for focusing on social development for economic growth.
51

A smile speaks a thousand words and we vouch for it through our products. The greatest reward for us is the effervescent smile on our customers face. In the years to come it is this smile which will inspire us to achieve for more.
dwell on your smile
E

54
Financials Section
Standalone AccountsAudit Report 55Balance Sheet 60Profit & Loss Account 61Schedules 62Cash flow Statement 93Balance Sheet Abstract 94Section 212 disclosure 95
Consolidated AccountsAudit Report 96Balance Sheet 98Profit & Loss Account 99Schedules 100Cash flow Statement 128
55
AUDITORS’ REPORT TO THE MEMBERS OF WELSPUN INDIA LIMITED
1. We have audited the attached Balance Sheet of Welspun India Limited (the “Company”) as at March 31, 2011, and the related Profit and Loss Account and Cash Flow Statement for the year ended on that date annexed thereto, which we have signed under reference to this report. These financial statements are the responsibility of the Company’s Management. Our responsibility is to express an opinion on these financial statements based on our audit.
2. We conducted our audit in accordance with the auditing standards generally accepted in India. Those Standards require that we plan and perform the audit to obtain reasonable assurance about whether the financial statements are free of material misstatement. An audit includes examining, on a test basis, evidence supporting the amounts and disclosures in the financial statements. An audit also includes assessing the accounting principles used and significant estimates made by Management, as well as evaluating the overall financial statement presentation. We believe that our audit provides a reasonable basis for our opinion.
3. As required by the Companies (Auditor’s Report) Order, 2003, as amended by the Companies (Auditor’s Report) (Amendment) Order, 2004 (together the “Order”), issued by the Central Government of India in terms of sub-section (4A) of Section 227 of ‘The Companies Act, 1956’ of India (the ‘Act’) and on the basis of such checks of the books and records of the Company as we considered appropriate and according to the information and explanations given to us, we give in the Annexure a statement on the matters specified in paragraphs 4 and 5 of the Order.
4. We draw your attention to Note 7(b) on Schedule 19 to the financial statements, regarding the accounts receivables balance of Rs. 696.02 million (March 31, 2010: Rs. 475.93 million), which include Rs.108.33 million (March 31, 2010: Rs.52.07 million) outstanding for more then one year, that is due from Welspun Retail Limited (“WRL”), a group company, as at March 31, 2011, in relation to which no valuation allowance has been estimated and adjusted in these financial statements which, in our view, does not meet the requirement to consider prudence in selection of accounting policies, as set out in Accounting Standard 1 – Disclosure of Accounting Policies, as WRL has been incurring significant losses (Rs.199.73 million for the year ended March 31, 2011 and Rs. 1,205.96 million as at March 31, 2011 basis its audited financial statements as of and for the year ended March 31, 2011) and has also been unable to achieve its projected financial results in the previous and current financial reporting periods.
5. Without qualifying our opinion, we draw your attention to:
(a) Note 8 on Schedule 19, regarding the Company’s dependence on Welspun Global Brands Limited (‘WGBL’) and WRL for selling its products consequent to the demerger of the marketing arm of the Company effective April 1, 2009. If the arrangement between the Company, WGBL and WRL are discontinued, the business of the Company could be adversely impacted.
(b) Note 9 on Schedule 19, regarding corporate guarantees, aggregating Rs. 3,593 million at the year end, issued consequent to the demerger of the marketing arm of the Company referred to in paragraph 5 (a) above, to the bankers of WGBL in relation to the debt facilities provided by them to WGBL, and other corporate guarantees disclosed in Note 3 on Schedule 19, aggregating Rs. 5,145.52 million at the year end, issued on behalf of WGBL, Welspun USA Inc. (‘WUSA’), Welspun Captive Power Generation Limited (WCPGL), Welspun Mexico SA de CV (WELMEX) and Welspun Home Textiles UK limited (‘WHTL’). If WGBL, WUSA, WCPGL and WHTL are unable to meet their obligation as they fall due, the financial condition and cash flows of the Company could be adversely impacted.
(c) Note 4 on Schedule 19, regarding the recognition of deferred tax assets during the year, aggregating Rs. 303.64 million, on the incremental unabsorbed Income-tax depreciation arising out of its treatment of certain excise and Value Added Tax incentives as ‘capital receipts’ for income tax purposes based on the judgement in re Commissioner of Income Tax, Mumbai v/s. Reliance Industries Limited of the Honourable High Court of Judicature at Bombay. However, this case has not attained finality as the judgement has been challenged by the tax authorities in the apex court. If the final decision in the matter is eventually decided against the Company, then the carrying value of the deferred tax assets at the period end could be significantly impacted.
56
6. Further to our comments in the Annexure referred to in paragraph 3 above, we report that:
(a) Except for the indeterminate effects of the matter referred to paragraph 4 above, we have obtained all the information and explanations which, to the best of our knowledge and belief, were necessary for the purposes of our audit;
(b) In our opinion, except for the indeterminate effects of the matter referred to paragraph 4 above, proper books of account as required by law have been kept by the Company so far as appears from our examination of those books;
(c) The Balance Sheet, Profit and Loss Account and Cash Flow Statement dealt with by this report are in agreement with the books of account;
(d) In our opinion, except for the matter referred to paragraph 4 above, the Balance Sheet, Profit and Loss Account and Cash Flow Statement dealt with by this report comply with the accounting standards referred to in sub-section (3C) of Section 211 of the Act;
(e) On the basis of written representations received from the directors, as on March 31, 2011 and taken on record by the Board of Directors, none of the directors is disqualified as on March 31, 2011 from being appointed as a director in terms of clause (g) of sub-section (1) of Section 274 of the Act;
(f) In our opinion and to the best of our information and according to the explanations given to us, except for the indeterminate effects of the matter referred to in paragraph 4 above, the said financial statements together with the notes thereon and attached thereto give, in the prescribed manner, the information required by the Act, and give, a true and fair view in conformity with the accounting principles generally accepted in India:
(i) in the case of the Balance Sheet, of the state of affairs of the Company as at March 31, 2011;
(ii) in the case of the Profit and Loss Account, of the loss for the year ended on that date;
(iii) in the case of the Cash Flow Statement, of the cash flows for the year ended on that date.
For Price Waterhouse & Co.Firm Registration Number: 007567S
Chartered Accountants
Neeraj Gupta Partner
Membership Number F055158Place: MumbaiDate: May 30, 2011
AUDITORS’ REPORT TO THE MEMBERS OF WELSPUN INDIA LIMITED

57
ANNEXURE TO AUDITORS’ REPORT
Referred to in paragraph 3 of the Auditors’ Report of even date to the members of Welspun India Limited on the financial statements for the year ended March 31, 2011
1. (a) The Company is maintaining proper records showing full particulars, including quantitative details and situation, of fixed assets.
(b) The fixed assets of the Company have been physically verified by the Management during the year and no material discrepancies between the book records and the physical inventory have been noticed. In our opinion, the frequency of verification is reasonable.
(c) In our opinion and according to the information and explanations given to us, a substantial part of fixed assets has not been disposed of by the Company during the year.
2. (a) The inventory (excluding stocks with third parties and materials in transit) has been physically verified by the Management during the year. In respect of inventory lying with third parties, these have substantially been confirmed by them. In our opinion, the frequency of verification is reasonable.
(b) In our opinion, the procedures of physical verification of inventory followed by the Management are reasonable and adequate in relation to the size of the Company and the nature of its business.
(c) On the basis of our examination of the inventory records, in our opinion, the Company is maintaining proper records of inventory. The discrepancies noticed on physical verification of inventory as compared to book records were not material.
3. (a) The Company has not granted any loans, secured or unsecured, to companies, firms or other parties covered in the register maintained under Section 301 of the Act.
(b) The Company has not taken any loans, secured or unsecured, from companies, firms or other parties covered in the register maintained under Section 301 of the Act.
4. In our opinion and according to the information and explanations given to us, there is an adequate internal control system commensurate with the size of the Company and the nature of its business for the purchase of inventory, fixed assets and for the sale of goods. Further, on the basis of our examination of the books and records of the Company, and according to the information and explanations given to us, no major weakness have been noticed or reported.
5. (a) In our opinion and according to the information and explanations given to us, the particulars of contracts or arrangements referred to in Section 301 of the Act have been entered in the register required to be maintained under that Section.
(b) In our opinion and according to the information and explanations given to us, there are no transactions made in pursuance of such contracts or arrangements and exceeding the value of Rupees Five Lakhs in respect of any party during the year, which have been made at prices which are not reasonable having regard to the prevailing market prices at the relevant time.
6. The Company has not accepted any deposits from the public within the meaning of Sections 58A and 58AA of the Act and the rules framed there under.
7. In our opinion, the Company has an internal audit system commensurate with its size and nature of its business.
8. We have broadly reviewed the books of account maintained by the Company in respect of products where, pursuant to the Rules made by the Central Government of India, the maintenance of cost records has been prescribed under clause (d) of sub-section (1) of Section 209 of the Act, and are of the opinion that prima facie, the prescribed accounts and records have been made and maintained. We have not, however, made a detailed examination of the records with a view to determine whether they are accurate or complete.
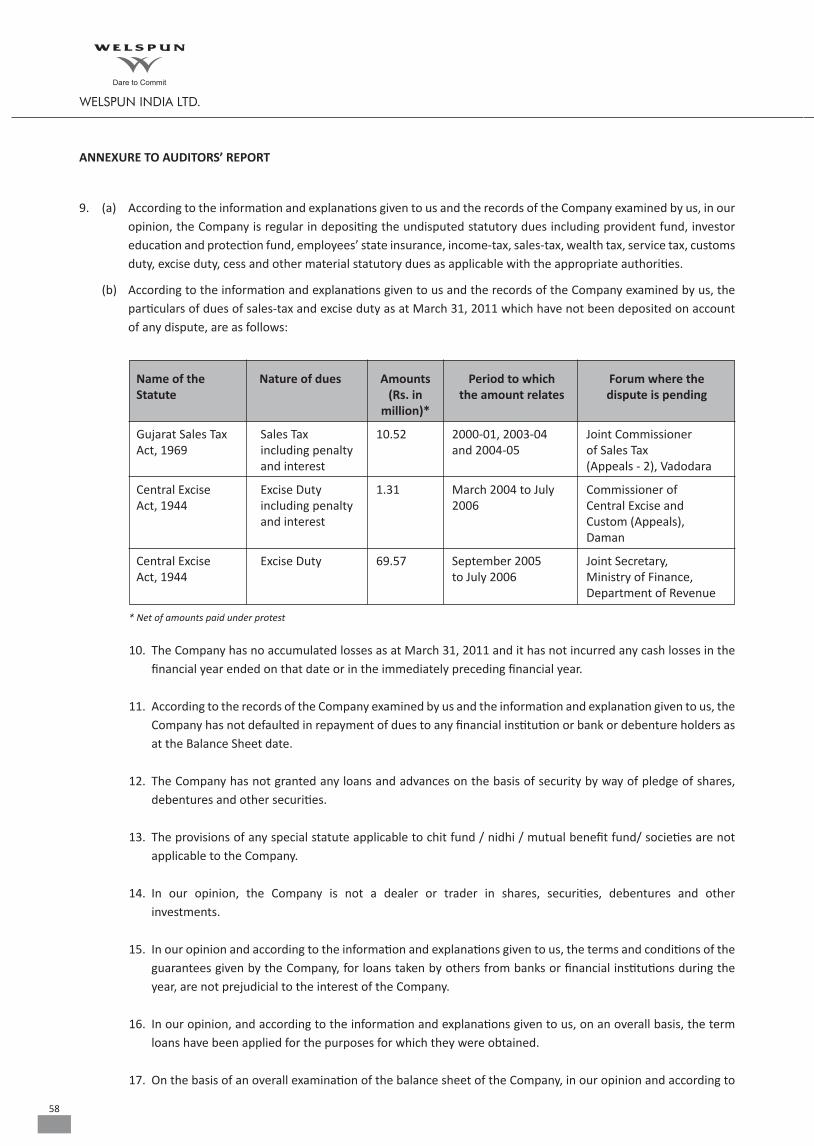
58
9. (a) According to the information and explanations given to us and the records of the Company examined by us, in our opinion, the Company is regular in depositing the undisputed statutory dues including provident fund, investor education and protection fund, employees’ state insurance, income-tax, sales-tax, wealth tax, service tax, customs duty, excise duty, cess and other material statutory dues as applicable with the appropriate authorities.
(b) According to the information and explanations given to us and the records of the Company examined by us, the particulars of dues of sales-tax and excise duty as at March 31, 2011 which have not been deposited on account of any dispute, are as follows:
Name of the Nature of dues Amounts Period to which Forum where the Statute (Rs. in the amount relates dispute is pending million)*
Gujarat Sales Tax Sales Tax 10.52 2000-01, 2003-04 Joint Commissioner Act, 1969 including penalty and 2004-05 of Sales Tax and interest (Appeals - 2), Vadodara
Central Excise Excise Duty 1.31 March 2004 to July Commissioner of Act, 1944 including penalty 2006 Central Excise and and interest Custom (Appeals), Daman
Central Excise Excise Duty 69.57 September 2005 Joint Secretary, Act, 1944 to July 2006 Ministry of Finance, Department of Revenue
* Net of amounts paid under protest
10. The Company has no accumulated losses as at March 31, 2011 and it has not incurred any cash losses in the financial year ended on that date or in the immediately preceding financial year.
11. According to the records of the Company examined by us and the information and explanation given to us, the Company has not defaulted in repayment of dues to any financial institution or bank or debenture holders as at the Balance Sheet date.
12. The Company has not granted any loans and advances on the basis of security by way of pledge of shares, debentures and other securities.
13. The provisions of any special statute applicable to chit fund / nidhi / mutual benefit fund/ societies are not applicable to the Company.
14. In our opinion, the Company is not a dealer or trader in shares, securities, debentures and other investments.
15. In our opinion and according to the information and explanations given to us, the terms and conditions of the guarantees given by the Company, for loans taken by others from banks or financial institutions during the year, are not prejudicial to the interest of the Company.
16. In our opinion, and according to the information and explanations given to us, on an overall basis, the term loans have been applied for the purposes for which they were obtained.
17. On the basis of an overall examination of the balance sheet of the Company, in our opinion and according to
ANNEXURE TO AUDITORS’ REPORT
59
the information and explanations given to us, there are no funds raised on a short term basis which have been used for long-term investment.
18. The Company has not made any preferential allotment of shares to parties and companies covered in the register maintained under Section 301 of the Act during the year.
19. The Company has not issued any debentures during the year.
20. The Company has not raised any money by public issues during the year.
21. During the course of our examination of the books and records of the Company, carried out in accordance with the generally accepted auditing practices in India, and according to the information and explanations given to us, we have neither come across any instance of fraud on or by the Company, noticed or reported during the year, nor have we been informed of such case by the Management.
For Price Waterhouse & Co.Firm Registration Number: 007567S
Chartered Accountants
Neeraj Gupta Partner
Membership Number F055158Place: MumbaiDate: May 30, 2011
ANNEXURE TO AUDITORS’ REPORT
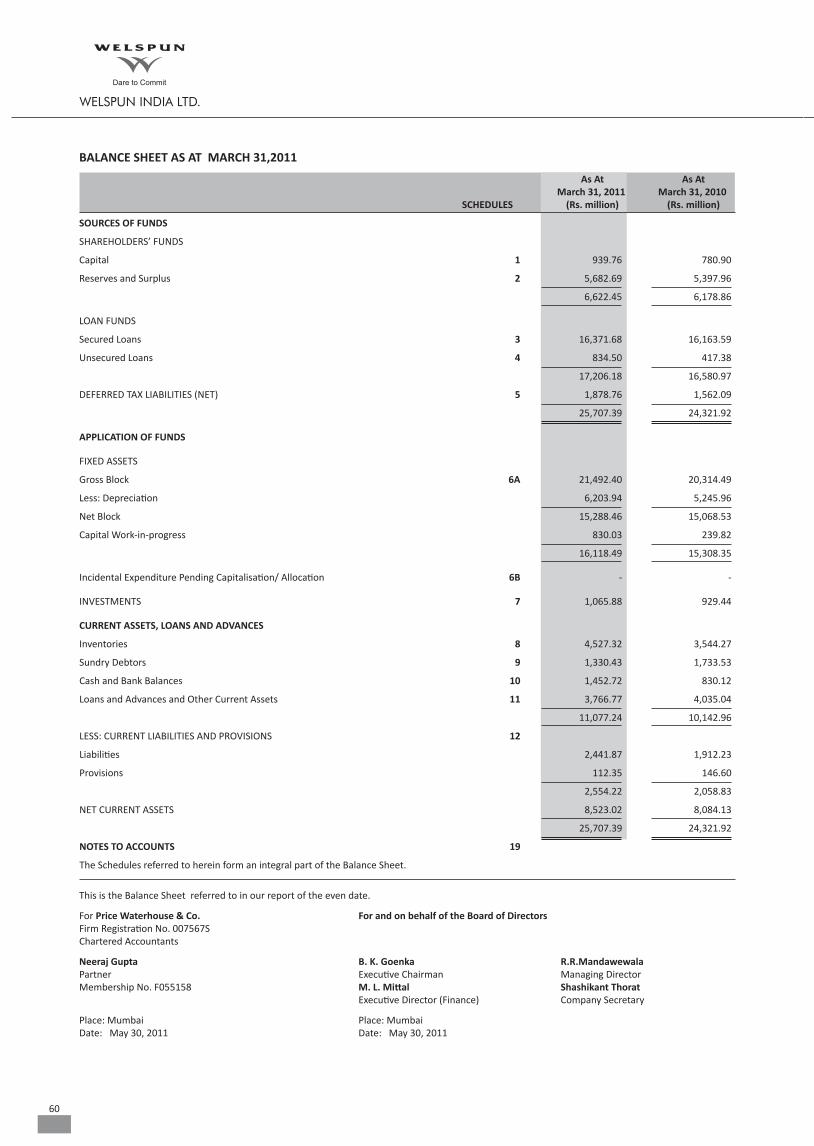
60
As At As At March 31, 2011 March 31, 2010 SCHEDULES (Rs. million) (Rs. million)
SOURCES OF FUNDS
SHAREHOLDERS’ FUNDS
Capital 1 939.76 780.90
Reserves and Surplus 2 5,682.69 5,397.96
6,622.45 6,178.86
LOAN FUNDS
Secured Loans 3 16,371.68 16,163.59
Unsecured Loans 4 834.50 417.38
17,206.18 16,580.97
DEFERRED TAX LIABILITIES (NET) 5 1,878.76 1,562.09
25,707.39 24,321.92
APPLICATION OF FUNDS
FIXED ASSETS
Gross Block 6A 21,492.40 20,314.49
Less: Depreciation 6,203.94 5,245.96
Net Block 15,288.46 15,068.53
Capital Work-in-progress 830.03 239.82
16,118.49 15,308.35
Incidental Expenditure Pending Capitalisation/ Allocation 6B - -
INVESTMENTS 7 1,065.88 929.44
CURRENT ASSETS, LOANS AND ADVANCES
Inventories 8 4,527.32 3,544.27
Sundry Debtors 9 1,330.43 1,733.53
Cash and Bank Balances 10 1,452.72 830.12
Loans and Advances and Other Current Assets 11 3,766.77 4,035.04
11,077.24 10,142.96
LESS: CURRENT LIABILITIES AND PROVISIONS 12
Liabilities 2,441.87 1,912.23
Provisions 112.35 146.60
2,554.22 2,058.83
NET CURRENT ASSETS 8,523.02 8,084.13
25,707.39 24,321.92
NOTES TO ACCOUNTS 19
The Schedules referred to herein form an integral part of the Balance Sheet.
BALANCE SHEET AS AT MARCH 31,2011
This is the Balance Sheet referred to in our report of the even date.
For Price Waterhouse & Co. For and on behalf of the Board of Directors Firm Registration No. 007567S Chartered Accountants
Neeraj Gupta B. K. Goenka R.R.Mandawewala Partner Executive Chairman Managing Director Membership No. F055158 M. L. Mittal Shashikant Thorat Executive Director (Finance) Company Secretary
Place: Mumbai Place: Mumbai Date: May 30, 2011 Date: May 30, 2011

61
Year ended Year ended SCHEDULES March 31, 2011 March 31, 2010 (Rs. million) (Rs. million)
Income
Sales 13 20,362.51 18,355.74
Less : Excise Duty 454.89 120.33
19,907.62 18,235.41
Other Income 14 726.20 577.30
20,633.82 18,812.71
Expenditure
Materials and Manufacturing Expenses 15 15,595.89 13,378.73
Employees’ Remuneration and Benefits 16 1,478.58 1,163.63
Selling, Administration and Other Expenses 17 609.95 632.49
Finance Expenses (Net) 18 785.60 870.05
Depreciation 6A 1,135.13 1,063.25
19,605.15 17,108.15
Profit Before Taxation from Ordinary Activities 1,028.67 1,704.56
Provision For Taxation
- Current Tax 202.02 288.93
Less : Minimum Alternative Tax Credit Availed (201.21) (288.93)
- Short/ (Excess) Provision for Tax in respect of Earlier Years 4.60 (16.76)
- Reversal of Minimum Alternative Tax Credit Availed in Earlier Years 27.40 49.00
- Deferred Tax (Refer Note on Schedule 5 and Note 4 on Schedule 19) 316.67 522.26
349.48 554.50
Profit After Taxation from Ordinary Activities 679.19 1,150.06
Less: Extraordinary Items (Refer Note 7(a) on Schedule 19)
- Provision for diminution in value of Investments (net of deferred Tax: Rs. Nil) 739.12 -
- Provision for doubtful loans and advances (net of deferred Tax: Rs. Nil) 937.91 -
Profit After Taxation (997.84) 1,150.06
Profit and Loss Account Balance Brought Forward 3,046.18 2,001.65
Profit Available for Appropriation 2,048.34 3,151.71
Appropriations:
Proposed Dividend
- Equity Shareholders - 73.09
- Preference Shareholders - 17.41
Final Dividend for Previous Year (Refer Note 10(b) on Schedule 19) 15.60 -
Tax on Final Dividend 2.60 15.03
Profit and Loss Account Balance carried to the Balance Sheet 2,030.14 3,046.18
2,048.34 3,151.71
Earnings/ (Loss) Per Share (Rs.) - (Refer Note 27 on Schedule 19)
- Basic before Extraordinary Items 7.71 15.73
- Diluted before Extraordinary Items 7.66 15.73
- Basic and diluted after Extraordinary Items (11.33) 15.73
NOTES TO ACCOUNTS 19
The Schedules referred to herein form an integral part of the Profit and Loss Account.
PROFIT AND LOSS ACCOUNT FOR THE YEAR ENDED MARCH 31, 2011
This is the Profit and Loss Account referred to in our report of the even date.
For Price Waterhouse & Co. For and on behalf of the Board of Directors Firm Registration No. 007567S Chartered Accountants
Neeraj Gupta B. K. Goenka R.R.Mandawewala Partner Executive Chairman Managing Director Membership No. F055158 M. L. Mittal Shashikant Thorat Executive Director (Finance) Company Secretary
Place: Mumbai Place: Mumbai Date: May 30, 2011 Date: May 30, 2011

62
As At As At March 31, 2011 March 31, 2010 (Rs. million) (Rs. million)
SCHEDULE 1 : CAPITAL
Authorised
125,000,000 (March 31, 2010: 125,000,000) Equity Shares of Rs. 10 each 1,250.00 1,250.00
500,000 (March 31, 2010 : 500,000) 0% Redeemable Cumulative Preference Shares of Rs. 100 each 50.00 50.00
1,300.00 1,300.00
Issued, Subscribed and Paid Up
88,976,269 (March 31, 2010 : 73,089,519) Equity Shares of Rs. 10 each fully paid up 889.76 730.90 (Refer Notes 1 (xv), 10(a) and 11 on Schedule 19)
500,000 (March 31, 2010 : 500,000) 0% Redeemable Cumulative Preference Shares of Rs. 100 each fully paid up (Refer Note 12 on Schedule 19) 50.00 50.00
939.76 780.90
SCHEDULE 2 : RESERVES AND SURPLUS
Securities Premium Account
As per last Balance Sheet 1,888.11 2,638.11
Add : Additions during the year ( Refer Note 10 (a) on Schedule 19) 1,411.53 -
3,299.64 2,638.11
Less : Adjustment on Demerger - 750.00
Less : Expenses on Qualified Institution Placement adjusted as per Section 78 of the Companies Act, 1956 (Refer Note 10(a) on Schedule 19) 87.64 -
3,212.00 1,888.11
Capital Redemption Reserve 428.38 428.38
Capital Reserve - Forfeiture of Equity Warrants 48.18 48.18
Hedging Reserve Account (Refer Note 21(b) on Schedule 19) - -
Foreign Exchange Translation Reserve
As per last Balance Sheet (12.89) -
Add : Additions during the year
- Realignment of subordinated loan of Welspun AG (22.36) (12.89)
- Realignment of Share Application Money pending allotment of Welspun USA Inc. (0.76) -
(36.01) (12.89)
Profit and Loss Account 2,030.14 3,046.18
5,682.69 5,397.96
SCHEDULE 3 : SECURED LOANS
From Banks (Refer Note 13(a) and 13(b) on Schedule 19)
- In Rupee 12,400.10 12,280.08
- In Foreign Currency 85.10 157.39
(Repayable within one year Rs. 2,507.56 million; March 31, 2010 : Rs. 1,001.39 million)
Working Capital Loans from Banks (Refer Notes 13(c) on Schedule 19) 3,886.48 3,726.12 16,371.68 16,163.59
SCHEDULE 4 : UNSECURED LOANS
Interest Free Sales Tax Loan - 0.01
(Repayable within one year Rs. Nil ; March 31, 2010 : Rs. 0.01 million)
Buyers’ Credit 745.70 328.57
Inter-Corporate Loan from Welspun Investments and Commercials Limited 88.80 88.80
(Repayable within one year : Rs. 8.80 million ; March 31, 2010 : Rs. Nil)
834.50 417.38
SCHEDULE 5 : DEFERRED TAX LIABILITIES (NET)
(Refer Notes 1(viii)(b) and 4 on Schedule 19)
Deferred Tax Liabilities arising on account of Timing differences in :
- Depreciation 2,152.01 2,063.49
- Others 9.37 -
2,161.38 2,063.49
Deferred Tax Assets arising on account of Timing differences in:
- Provision for Doubtful Debts/ Advances 3.55 3.64
- Provision for Unpaid Statutory Dues under Section 43B of the Income Tax Act, 1961 10.86 4.48
- Provision for Employee Benefits 20.16 12.03
- Unabsorbed Depreciation as per the Income Tax Act, 1961 (Refer Note below) 247.56 480.47
- Others 0.49 0.78
282.62 501.40
1,878.76 1,562.09
SCHEDULES ANNEXED TO AND FORMING PART OF THE BALANCE SHEET AS AT MARCH 31, 2011
Note:The Income Tax Department had disallowed certain expenditure claimed by the Company in its income tax return for the Assessment Years 2004-2005 and 2005-2006. During the year, the Income Tax Appellate Tribunal High Court decided the matter in the Company’s favour, consequent to which, the Company has recognised deferred tax asset ag-gregating Rs. 10.31 million on unabsorbed depreciation pertaining to the aforesaid assessment years.
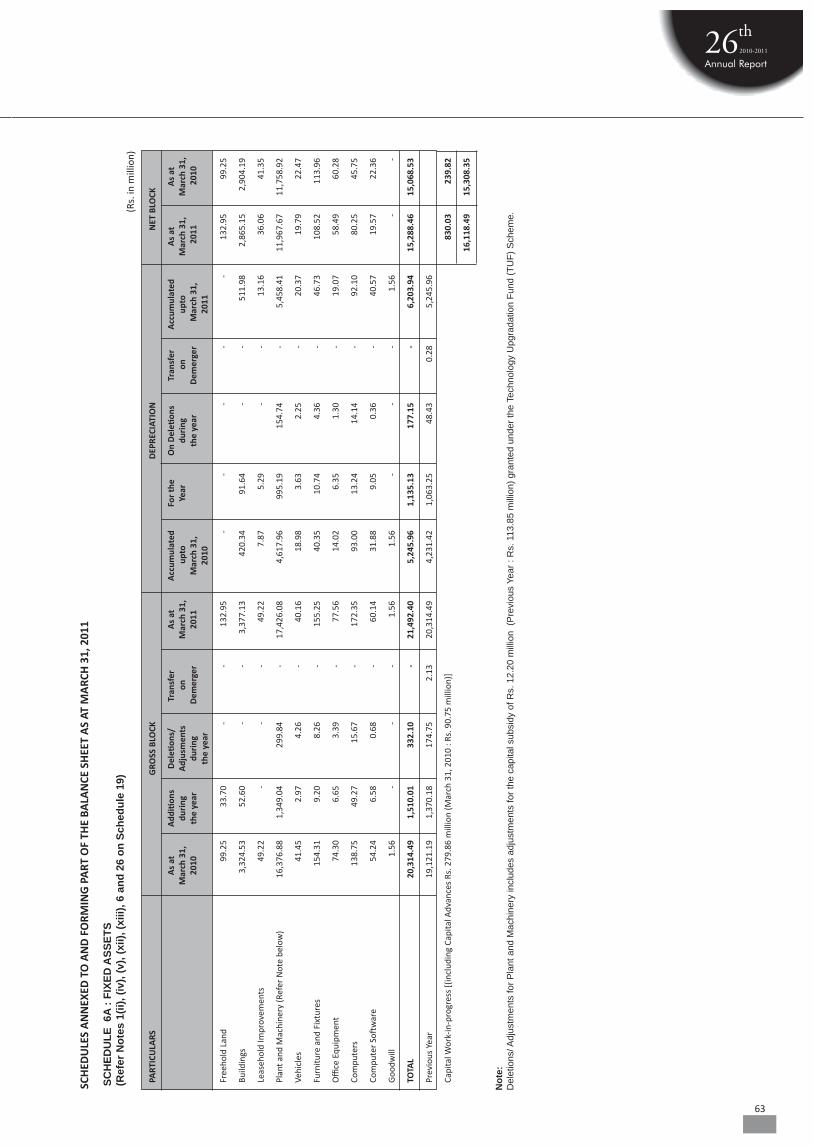
63
SCH
EDU
LES
AN
NEX
ED T
O A
ND
FO
RMIN
G P
ART
OF
THE
BALA
NCE
SH
EET
AS
AT M
ARC
H 3
1, 2
011
SC
HED
ULE
6A
: FIX
ED A
SSET
S (R
efer
Not
es 1
(ii),
(iv),
(v),
(xii)
, (xi
ii), 6
and
26
on S
ched
ule
19)
PART
ICU
LARS
G
ROSS
BLO
CK
DEP
RECI
ATIO
N
NET
BLO
CK
A
s at
A
dditi
ons
Del
etion
s/
Tran
sfer
A
s at
A
ccum
ulat
ed
For
the
On
Del
etion
s Tr
ansf
er
Acc
umul
ated
A
s at
A
s at
Mar
ch 3
1,
duri
ng
Adj
usm
ents
o
n M
arch
31,
u
pto
Ye
ar
duri
ng
on
upto
M
arch
31,
M
arch
31,
2010
th
e ye
ar
duri
ng
Dem
erge
r 20
11
Mar
ch 3
1,
th
e ye
ar
Dem
erge
r M
arch
31,
2
011
201
0
th
e ye
ar
2010
2011
Free
hold
Lan
d
99.
25
33.
70
-
-
132
.95
-
-
-
-
-
1
32.9
5
99.
25
Build
ings
3
,324
.53
5
2.60
-
-
3
,377
.13
4
20.3
4
91.
64
-
-
511
.98
2
,865
.15
2
,904
.19
Leas
ehol
d Im
prov
emen
ts
49.
22
-
-
-
49.
22
7.8
7
5.2
9
-
-
13.
16
36.
06
41.
35
Plan
t and
Mac
hine
ry (R
efer
Not
e be
low
) 1
6,37
6.88
1
,349
.04
2
99.8
4
-
17,
426.
08
4,6
17.9
6
995
.19
1
54.7
4
-
5,4
58.4
1
11,
967.
67
11,
758.
92
Vehi
cles
4
1.45
2
.97
4
.26
-
4
0.16
1
8.98
3
.63
2
.25
-
2
0.37
1
9.79
2
2.47
Furn
iture
and
Fix
ture
s
154
.31
9
.20
8
.26
-
1
55.2
5
40.
35
10.
74
4.3
6
-
46.
73
108
.52
1
13.9
6
Offi
ce E
quip
men
t
74.
30
6.6
5
3.3
9
-
77.
56
14.
02
6.3
5
1.3
0
-
19.
07
58.
49
60.
28
Com
pute
rs
138
.75
4
9.27
1
5.67
-
1
72.3
5
93.
00
13.
24
14.
14
-
92.
10
80.
25
45.
75
Com
pute
r So
ftw
are
5
4.24
6
.58
0
.68
-
6
0.14
3
1.88
9
.05
0
.36
-
4
0.57
1
9.57
2
2.36
Goo
dwill
1
.56
-
-
-
1
.56
1
.56
-
-
-
1
.56
-
-
TOTA
L
20,
314.
49
1,5
10.0
1
332
.10
-
2
1,49
2.40
5
,245
.96
1
,135
.13
1
77.1
5
-
6,2
03.9
4
15,
288.
46
15,
068.
53
Prev
ious
Yea
r
19,
121.
19
1,3
70.1
8
174
.75
2
.13
2
0,31
4.49
4
,231
.42
1
,063
.25
4
8.43
0
.28
5
,245
.96
Capi
tal W
ork-
in-p
rogr
ess
[(in
clud
ing
Capi
tal A
dvan
ces
Rs. 2
79.8
6 m
illio
n (M
arch
31,
201
0 : R
s. 9
0.75
mill
ion)
]
830.
03
239
.82
16
,118
.49
15
,308
.35
Not
e:
Del
etio
ns/ A
djus
tmen
ts fo
r Pla
nt a
nd M
achi
nery
incl
udes
adj
ustm
ents
for t
he c
apita
l sub
sidy
of R
s. 1
2.20
mill
ion
(Pre
viou
s Ye
ar :
Rs.
113
.85
mill
ion)
gra
nted
und
er th
e Te
chno
logy
Upg
rada
tion
Fund
(TU
F) S
chem
e.
(Rs.
in m
illio
n)
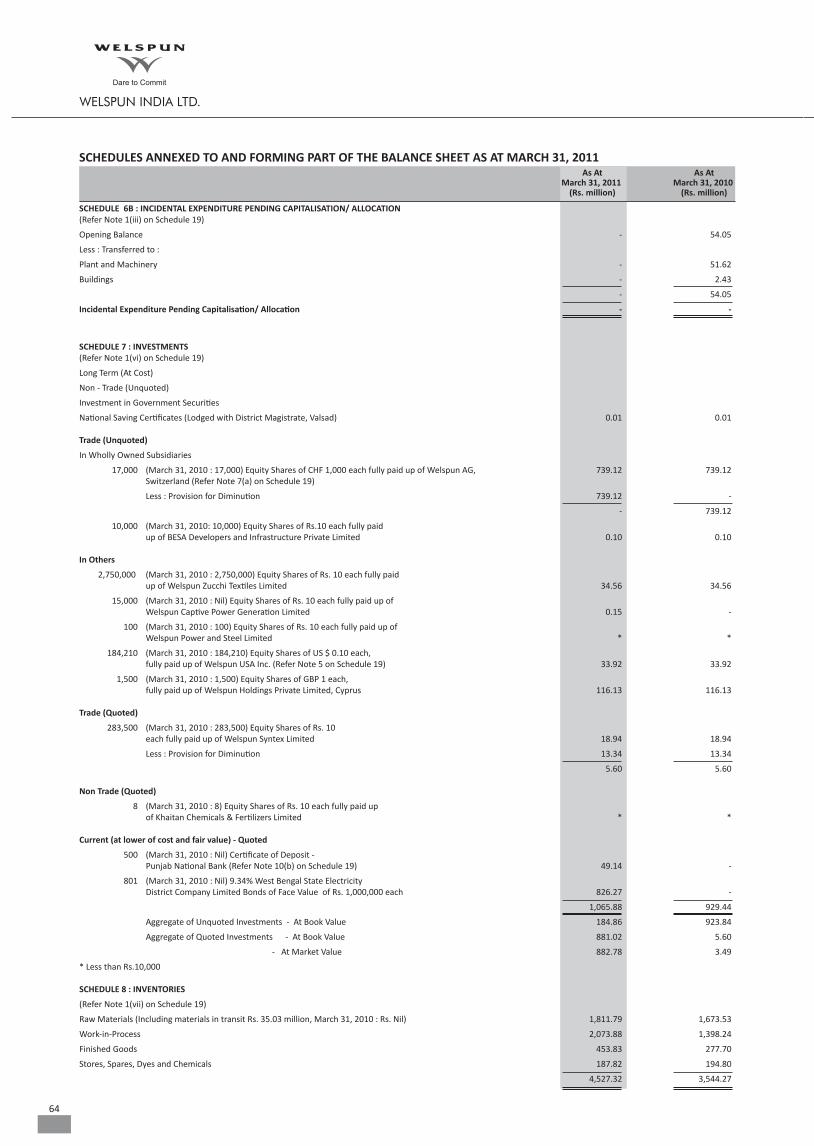
64
SCHEDULE 6B : INCIDENTAL EXPENDITURE PENDING CAPITALISATION/ ALLOCATION (Refer Note 1(iii) on Schedule 19)
Opening Balance - 54.05
Less : Transferred to :
Plant and Machinery - 51.62
Buildings - 2.43
- 54.05
Incidental Expenditure Pending Capitalisation/ Allocation - -
SCHEDULE 7 : INVESTMENTS (Refer Note 1(vi) on Schedule 19)
Long Term (At Cost)
Non - Trade (Unquoted)
Investment in Government Securities
National Saving Certificates (Lodged with District Magistrate, Valsad) 0.01 0.01
Trade (Unquoted)
In Wholly Owned Subsidiaries
17,000 (March 31, 2010 : 17,000) Equity Shares of CHF 1,000 each fully paid up of Welspun AG, 739.12 739.12 Switzerland (Refer Note 7(a) on Schedule 19)
Less : Provision for Diminution 739.12 -
- 739.12
10,000 (March 31, 2010: 10,000) Equity Shares of Rs.10 each fully paid up of BESA Developers and Infrastructure Private Limited 0.10 0.10
In Others
2,750,000 (March 31, 2010 : 2,750,000) Equity Shares of Rs. 10 each fully paid up of Welspun Zucchi Textiles Limited 34.56 34.56
15,000 (March 31, 2010 : Nil) Equity Shares of Rs. 10 each fully paid up of Welspun Captive Power Generation Limited 0.15 -
100 (March 31, 2010 : 100) Equity Shares of Rs. 10 each fully paid up of Welspun Power and Steel Limited * *
184,210 (March 31, 2010 : 184,210) Equity Shares of US $ 0.10 each, fully paid up of Welspun USA Inc. (Refer Note 5 on Schedule 19) 33.92 33.92
1,500 (March 31, 2010 : 1,500) Equity Shares of GBP 1 each, fully paid up of Welspun Holdings Private Limited, Cyprus 116.13 116.13
Trade (Quoted)
283,500 (March 31, 2010 : 283,500) Equity Shares of Rs. 10 each fully paid up of Welspun Syntex Limited 18.94 18.94
Less : Provision for Diminution 13.34 13.34
5.60 5.60
Non Trade (Quoted)
8 (March 31, 2010 : 8) Equity Shares of Rs. 10 each fully paid up of Khaitan Chemicals & Fertilizers Limited * *
Current (at lower of cost and fair value) - Quoted
500 (March 31, 2010 : Nil) Certificate of Deposit - Punjab National Bank (Refer Note 10(b) on Schedule 19) 49.14 -
801 (March 31, 2010 : Nil) 9.34% West Bengal State Electricity District Company Limited Bonds of Face Value of Rs. 1,000,000 each 826.27 -
1,065.88 929.44
Aggregate of Unquoted Investments - At Book Value 184.86 923.84
Aggregate of Quoted Investments - At Book Value 881.02 5.60
- At Market Value 882.78 3.49
* Less than Rs.10,000
SCHEDULE 8 : INVENTORIES
(Refer Note 1(vii) on Schedule 19)
Raw Materials (Including materials in transit Rs. 35.03 million, March 31, 2010 : Rs. Nil) 1,811.79 1,673.53
Work-in-Process 2,073.88 1,398.24
Finished Goods 453.83 277.70
Stores, Spares, Dyes and Chemicals 187.82 194.80
4,527.32 3,544.27
As At As At March 31, 2011 March 31, 2010 (Rs. million) (Rs. million)
SCHEDULES ANNEXED TO AND FORMING PART OF THE BALANCE SHEET AS AT MARCH 31, 2011
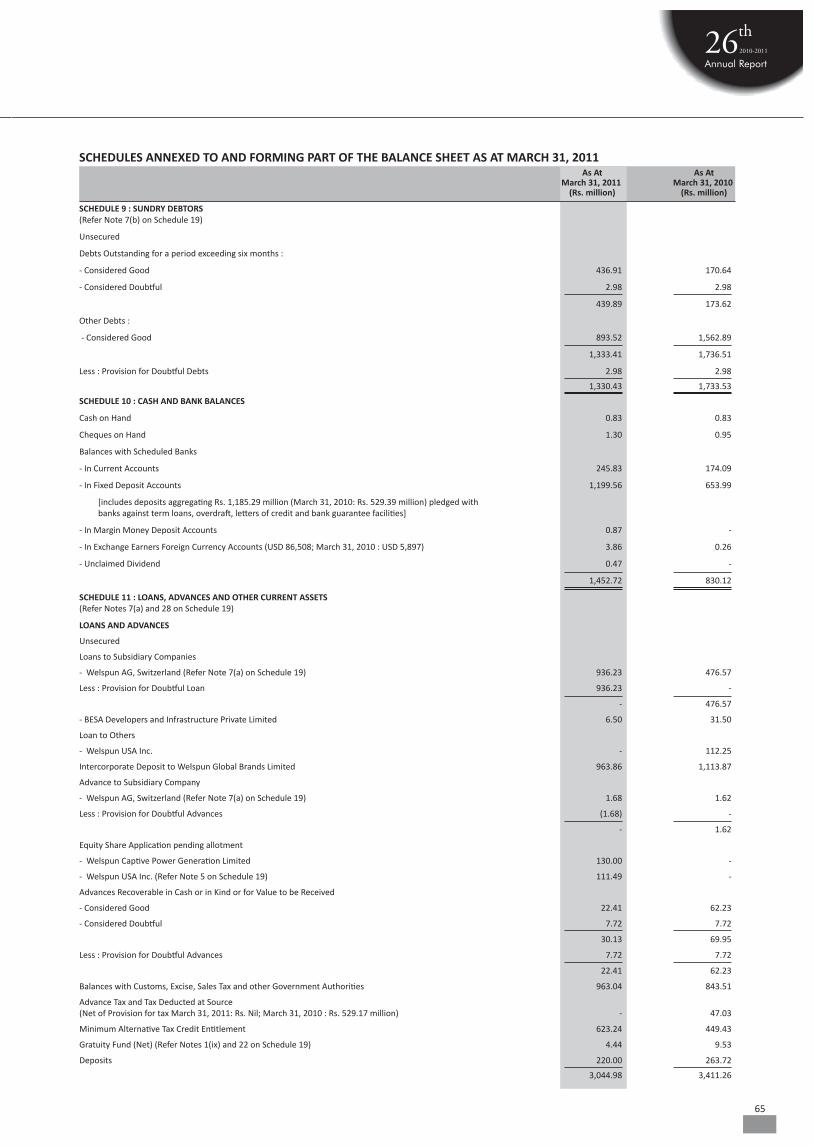
65
As At As At March 31, 2011 March 31, 2010 (Rs. million) (Rs. million)
SCHEDULES ANNEXED TO AND FORMING PART OF THE BALANCE SHEET AS AT MARCH 31, 2011
SCHEDULE 9 : SUNDRY DEBTORS (Refer Note 7(b) on Schedule 19)
Unsecured
Debts Outstanding for a period exceeding six months :
- Considered Good 436.91 170.64
- Considered Doubtful 2.98 2.98
439.89 173.62
Other Debts :
- Considered Good 893.52 1,562.89
1,333.41 1,736.51
Less : Provision for Doubtful Debts 2.98 2.98
1,330.43 1,733.53
SCHEDULE 10 : CASH AND BANK BALANCES
Cash on Hand 0.83 0.83
Cheques on Hand 1.30 0.95
Balances with Scheduled Banks
- In Current Accounts 245.83 174.09
- In Fixed Deposit Accounts 1,199.56 653.99
[includes deposits aggregating Rs. 1,185.29 million (March 31, 2010: Rs. 529.39 million) pledged with banks against term loans, overdraft, letters of credit and bank guarantee facilities]
- In Margin Money Deposit Accounts 0.87 -
- In Exchange Earners Foreign Currency Accounts (USD 86,508; March 31, 2010 : USD 5,897) 3.86 0.26
- Unclaimed Dividend 0.47 -
1,452.72 830.12
SCHEDULE 11 : LOANS, ADVANCES AND OTHER CURRENT ASSETS (Refer Notes 7(a) and 28 on Schedule 19)
LOANS AND ADVANCES
Unsecured
Loans to Subsidiary Companies
- Welspun AG, Switzerland (Refer Note 7(a) on Schedule 19) 936.23 476.57
Less : Provision for Doubtful Loan 936.23 -
- 476.57
- BESA Developers and Infrastructure Private Limited 6.50 31.50
Loan to Others
- Welspun USA Inc. - 112.25
Intercorporate Deposit to Welspun Global Brands Limited 963.86 1,113.87
Advance to Subsidiary Company
- Welspun AG, Switzerland (Refer Note 7(a) on Schedule 19) 1.68 1.62
Less : Provision for Doubtful Advances (1.68) -
- 1.62
Equity Share Application pending allotment
- Welspun Captive Power Generation Limited 130.00 -
- Welspun USA Inc. (Refer Note 5 on Schedule 19) 111.49 -
Advances Recoverable in Cash or in Kind or for Value to be Received
- Considered Good 22.41 62.23
- Considered Doubtful 7.72 7.72
30.13 69.95
Less : Provision for Doubtful Advances 7.72 7.72
22.41 62.23
Balances with Customs, Excise, Sales Tax and other Government Authorities 963.04 843.51
Advance Tax and Tax Deducted at Source (Net of Provision for tax March 31, 2011: Rs. Nil; March 31, 2010 : Rs. 529.17 million) - 47.03
Minimum Alternative Tax Credit Entitlement 623.24 449.43
Gratuity Fund (Net) (Refer Notes 1(ix) and 22 on Schedule 19) 4.44 9.53
Deposits 220.00 263.72
3,044.98 3,411.26
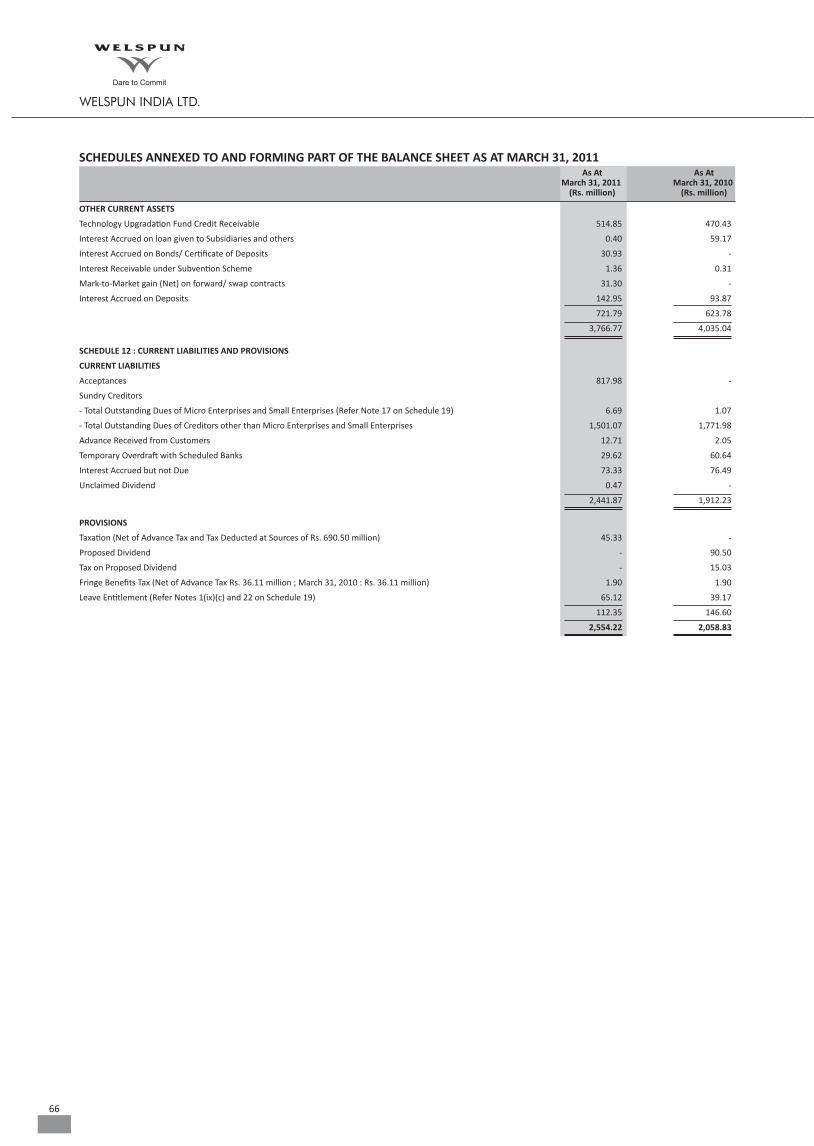
66
As At As At March 31, 2011 March 31, 2010 (Rs. million) (Rs. million)
SCHEDULES ANNEXED TO AND FORMING PART OF THE BALANCE SHEET AS AT MARCH 31, 2011
OTHER CURRENT ASSETS
Technology Upgradation Fund Credit Receivable 514.85 470.43
Interest Accrued on loan given to Subsidiaries and others 0.40 59.17
Interest Accrued on Bonds/ Certificate of Deposits 30.93 -
Interest Receivable under Subvention Scheme 1.36 0.31
Mark-to-Market gain (Net) on forward/ swap contracts 31.30 -
Interest Accrued on Deposits 142.95 93.87
721.79 623.78
3,766.77 4,035.04
SCHEDULE 12 : CURRENT LIABILITIES AND PROVISIONS
CURRENT LIABILITIES
Acceptances 817.98 -
Sundry Creditors
- Total Outstanding Dues of Micro Enterprises and Small Enterprises (Refer Note 17 on Schedule 19) 6.69 1.07
- Total Outstanding Dues of Creditors other than Micro Enterprises and Small Enterprises 1,501.07 1,771.98
Advance Received from Customers 12.71 2.05
Temporary Overdraft with Scheduled Banks 29.62 60.64
Interest Accrued but not Due 73.33 76.49
Unclaimed Dividend 0.47 -
2,441.87 1,912.23
PROVISIONS
Taxation (Net of Advance Tax and Tax Deducted at Sources of Rs. 690.50 million) 45.33 -
Proposed Dividend - 90.50
Tax on Proposed Dividend - 15.03
Fringe Benefits Tax (Net of Advance Tax Rs. 36.11 million ; March 31, 2010 : Rs. 36.11 million) 1.90 1.90
Leave Entitlement (Refer Notes 1(ix)(c) and 22 on Schedule 19) 65.12 39.17
112.35 146.60
2,554.22 2,058.83
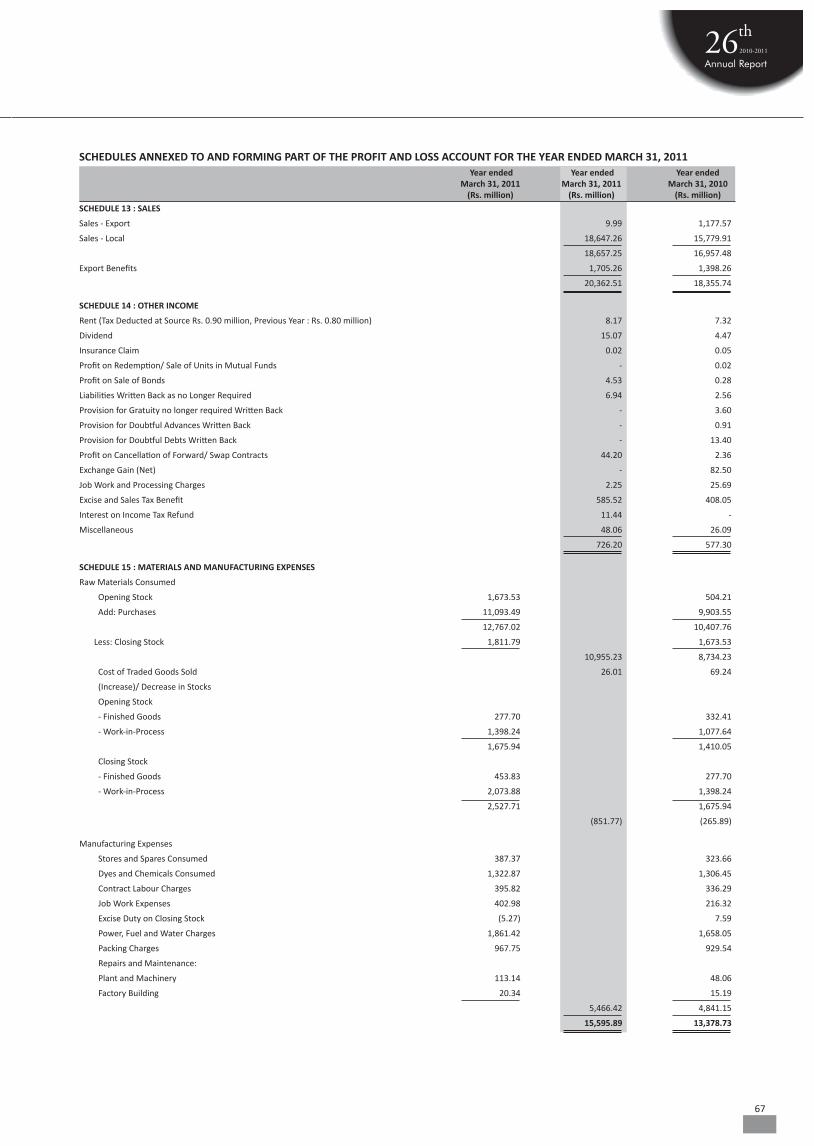
67
SCHEDULE 13 : SALES
Sales - Export 9.99 1,177.57
Sales - Local 18,647.26 15,779.91
18,657.25 16,957.48
Export Benefits 1,705.26 1,398.26
20,362.51 18,355.74
SCHEDULE 14 : OTHER INCOME
Rent (Tax Deducted at Source Rs. 0.90 million, Previous Year : Rs. 0.80 million) 8.17 7.32
Dividend 15.07 4.47
Insurance Claim 0.02 0.05
Profit on Redemption/ Sale of Units in Mutual Funds - 0.02
Profit on Sale of Bonds 4.53 0.28
Liabilities Written Back as no Longer Required 6.94 2.56
Provision for Gratuity no longer required Written Back - 3.60
Provision for Doubtful Advances Written Back - 0.91
Provision for Doubtful Debts Written Back - 13.40
Profit on Cancellation of Forward/ Swap Contracts 44.20 2.36
Exchange Gain (Net) - 82.50
Job Work and Processing Charges 2.25 25.69
Excise and Sales Tax Benefit 585.52 408.05
Interest on Income Tax Refund 11.44 -
Miscellaneous 48.06 26.09
726.20 577.30
SCHEDULE 15 : MATERIALS AND MANUFACTURING EXPENSES
Raw Materials Consumed
Opening Stock 1,673.53 504.21
Add: Purchases 11,093.49 9,903.55
12,767.02 10,407.76
Less: Closing Stock 1,811.79 1,673.53
10,955.23 8,734.23
Cost of Traded Goods Sold 26.01 69.24
(Increase)/ Decrease in Stocks
Opening Stock
- Finished Goods 277.70 332.41
- Work-in-Process 1,398.24 1,077.64
1,675.94 1,410.05
Closing Stock
- Finished Goods 453.83 277.70
- Work-in-Process 2,073.88 1,398.24
2,527.71 1,675.94
(851.77) (265.89)
Manufacturing Expenses
Stores and Spares Consumed 387.37 323.66
Dyes and Chemicals Consumed 1,322.87 1,306.45
Contract Labour Charges 395.82 336.29
Job Work Expenses 402.98 216.32
Excise Duty on Closing Stock (5.27) 7.59
Power, Fuel and Water Charges 1,861.42 1,658.05
Packing Charges 967.75 929.54
Repairs and Maintenance:
Plant and Machinery 113.14 48.06
Factory Building 20.34 15.19
5,466.42 4,841.15
15,595.89 13,378.73
Year ended Year ended Year ended March 31, 2011 March 31, 2011 March 31, 2010 (Rs. million) (Rs. million) (Rs. million)
SCHEDULES ANNEXED TO AND FORMING PART OF THE PROFIT AND LOSS ACCOUNT FOR THE YEAR ENDED MARCH 31, 2011
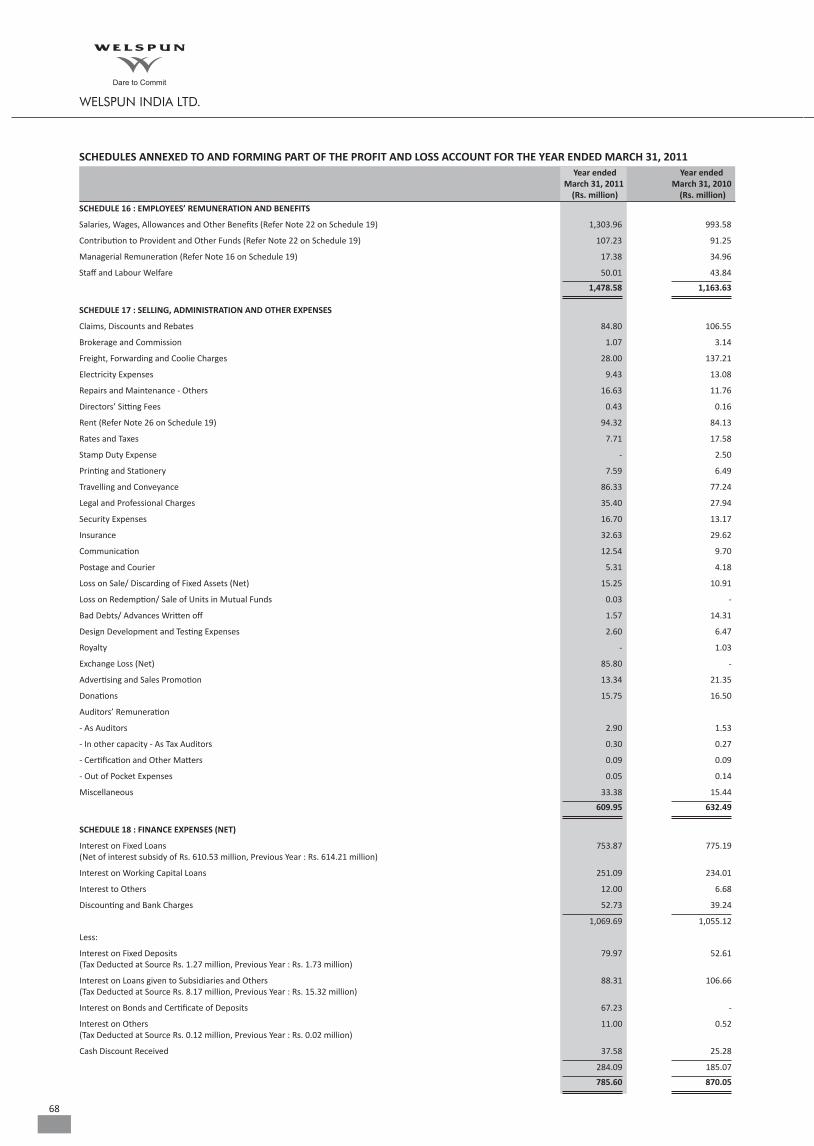
68
SCHEDULE 16 : EMPLOYEES’ REMUNERATION AND BENEFITS
Salaries, Wages, Allowances and Other Benefits (Refer Note 22 on Schedule 19) 1,303.96 993.58
Contribution to Provident and Other Funds (Refer Note 22 on Schedule 19) 107.23 91.25
Managerial Remuneration (Refer Note 16 on Schedule 19) 17.38 34.96
Staff and Labour Welfare 50.01 43.84
1,478.58 1,163.63
SCHEDULE 17 : SELLING, ADMINISTRATION AND OTHER EXPENSES
Claims, Discounts and Rebates 84.80 106.55
Brokerage and Commission 1.07 3.14
Freight, Forwarding and Coolie Charges 28.00 137.21
Electricity Expenses 9.43 13.08
Repairs and Maintenance - Others 16.63 11.76
Directors’ Sitting Fees 0.43 0.16
Rent (Refer Note 26 on Schedule 19) 94.32 84.13
Rates and Taxes 7.71 17.58
Stamp Duty Expense - 2.50
Printing and Stationery 7.59 6.49
Travelling and Conveyance 86.33 77.24
Legal and Professional Charges 35.40 27.94
Security Expenses 16.70 13.17
Insurance 32.63 29.62
Communication 12.54 9.70
Postage and Courier 5.31 4.18
Loss on Sale/ Discarding of Fixed Assets (Net) 15.25 10.91
Loss on Redemption/ Sale of Units in Mutual Funds 0.03 -
Bad Debts/ Advances Written off 1.57 14.31
Design Development and Testing Expenses 2.60 6.47
Royalty - 1.03
Exchange Loss (Net) 85.80 -
Advertising and Sales Promotion 13.34 21.35
Donations 15.75 16.50
Auditors’ Remuneration
- As Auditors 2.90 1.53
- In other capacity - As Tax Auditors 0.30 0.27
- Certification and Other Matters 0.09 0.09
- Out of Pocket Expenses 0.05 0.14
Miscellaneous 33.38 15.44
609.95 632.49
SCHEDULE 18 : FINANCE EXPENSES (NET)
Interest on Fixed Loans 753.87 775.19 (Net of interest subsidy of Rs. 610.53 million, Previous Year : Rs. 614.21 million)
Interest on Working Capital Loans 251.09 234.01
Interest to Others 12.00 6.68
Discounting and Bank Charges 52.73 39.24
1,069.69 1,055.12
Less:
Interest on Fixed Deposits 79.97 52.61 (Tax Deducted at Source Rs. 1.27 million, Previous Year : Rs. 1.73 million)
Interest on Loans given to Subsidiaries and Others 88.31 106.66 (Tax Deducted at Source Rs. 8.17 million, Previous Year : Rs. 15.32 million)
Interest on Bonds and Certificate of Deposits 67.23 -
Interest on Others 11.00 0.52 (Tax Deducted at Source Rs. 0.12 million, Previous Year : Rs. 0.02 million)
Cash Discount Received 37.58 25.28
284.09 185.07
785.60 870.05
SCHEDULES ANNEXED TO AND FORMING PART OF THE PROFIT AND LOSS ACCOUNT FOR THE YEAR ENDED MARCH 31, 2011 Year ended Year ended March 31, 2011 March 31, 2010 (Rs. million) (Rs. million)
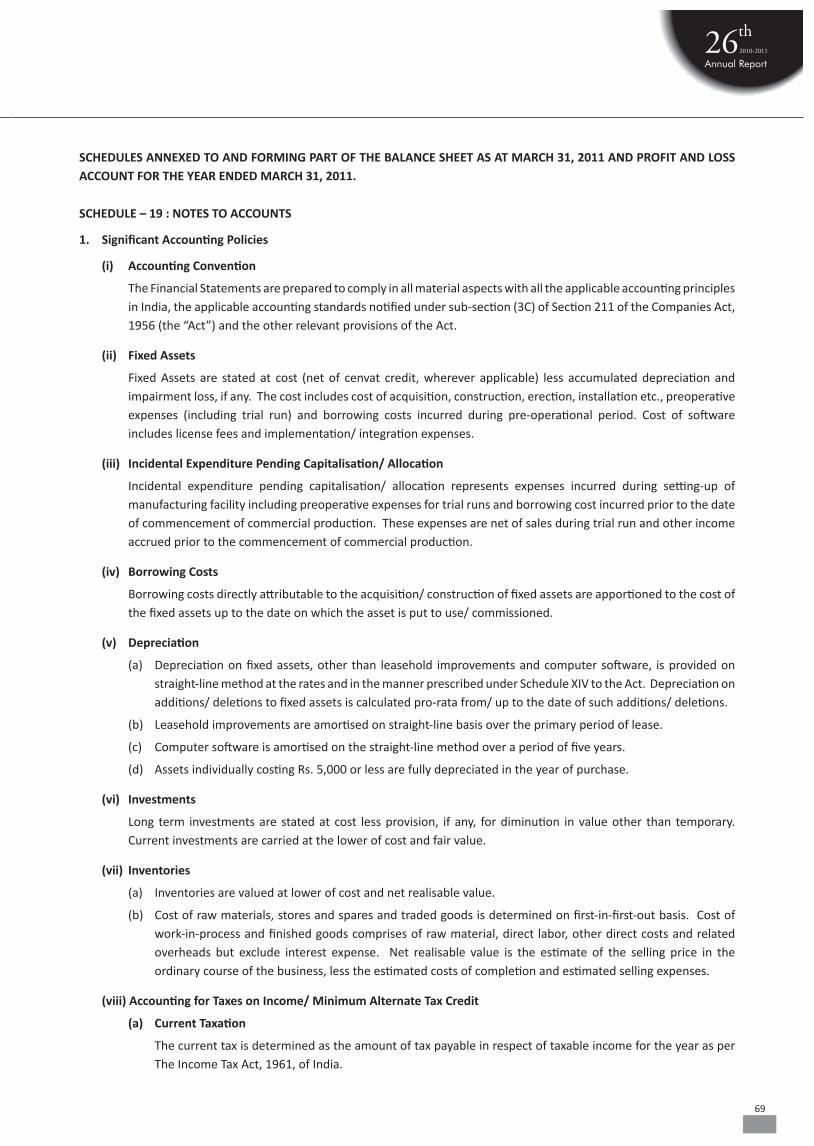
69
SCHEDULES ANNEXED TO AND FORMING PART OF THE BALANCE SHEET AS AT MARCH 31, 2011 AND PROFIT AND LOSS ACCOUNT FOR THE YEAR ENDED MARCH 31, 2011.
SCHEDULE – 19 : NOTES TO ACCOUNTS
1. Significant Accounting Policies
(i) Accounting Convention
The Financial Statements are prepared to comply in all material aspects with all the applicable accounting principles in India, the applicable accounting standards notified under sub-section (3C) of Section 211 of the Companies Act, 1956 (the “Act”) and the other relevant provisions of the Act.
(ii) Fixed Assets
Fixed Assets are stated at cost (net of cenvat credit, wherever applicable) less accumulated depreciation and impairment loss, if any. The cost includes cost of acquisition, construction, erection, installation etc., preoperative expenses (including trial run) and borrowing costs incurred during pre-operational period. Cost of software includes license fees and implementation/ integration expenses.
(iii) Incidental Expenditure Pending Capitalisation/ Allocation
Incidental expenditure pending capitalisation/ allocation represents expenses incurred during setting-up of manufacturing facility including preoperative expenses for trial runs and borrowing cost incurred prior to the date of commencement of commercial production. These expenses are net of sales during trial run and other income accrued prior to the commencement of commercial production.
(iv) Borrowing Costs
Borrowing costs directly attributable to the acquisition/ construction of fixed assets are apportioned to the cost of the fixed assets up to the date on which the asset is put to use/ commissioned.
(v) Depreciation
(a) Depreciation on fixed assets, other than leasehold improvements and computer software, is provided on straight-line method at the rates and in the manner prescribed under Schedule XIV to the Act. Depreciation on additions/ deletions to fixed assets is calculated pro-rata from/ up to the date of such additions/ deletions.
(b) Leasehold improvements are amortised on straight-line basis over the primary period of lease.
(c) Computer software is amortised on the straight-line method over a period of five years.
(d) Assets individually costing Rs. 5,000 or less are fully depreciated in the year of purchase.
(vi) Investments
Long term investments are stated at cost less provision, if any, for diminution in value other than temporary. Current investments are carried at the lower of cost and fair value.
(vii) Inventories
(a) Inventories are valued at lower of cost and net realisable value.
(b) Cost of raw materials, stores and spares and traded goods is determined on first-in-first-out basis. Cost of work-in-process and finished goods comprises of raw material, direct labor, other direct costs and related overheads but exclude interest expense. Net realisable value is the estimate of the selling price in the ordinary course of the business, less the estimated costs of completion and estimated selling expenses.
(viii) Accounting for Taxes on Income/ Minimum Alternate Tax Credit
(a) Current Taxation
The current tax is determined as the amount of tax payable in respect of taxable income for the year as per The Income Tax Act, 1961, of India.

70
(b) Deferred Taxation
• Deferred tax resulting from timing differences between book and tax profits is accounted for under the liability method, at the current/ substantially enacted rate of tax to the extent that the timing differences are expected to crystallise.
• Deferred tax assets arising in situations where there are brought forward losses and unabsorbed depreciation as per the Income Tax Act, 1961, of India to the extent deferred tax amount exceeds net deferred tax liabilities, are recognised only when there is a virtual certainty supported by convincing evidence that such assets will be realised.
(c) Minimum Alternate Tax Credit
Minimum Alternate Tax (MAT) paid in accordance with tax laws, which give rise to future economic benefits in the form of adjustment of future tax liability, is recognised as an asset only when, based on convincing evidence, it is probable that the future economic benefits associated with it will flow to the Company and the assets can be measured reliably.
(ix) Employee Benefits
(a) Defined Contribution Plans
The Company contributes on a defined contribution basis to Employee’s Provident Fund, Employee’s State Insurance Fund and Employee’s Pension Scheme towards post employment benefits, all of which are administered by the respective Government authorities, and has no further obligation beyond making its contribution, which is expensed in the year to which it pertains.
(b) Defined Benefit Plans
The Company has a Defined Benefit Plan namely Gratuity for all its employees. The liability for the defined benefit plan of Gratuity is determined on the basis of an actuarial valuation, calculated using projected unit credit method, by an independent actuary at the year end.
Gratuity Fund is recognised by the income tax authorities and is administered through trustees. The Employee’s Gratuity Trust takes group gratuity policies with insurance companies.
Actuarial gains and losses which comprise experience adjustments and the effect of changes in actuarial assumptions are recognised in the Profit and Loss Account.
(c) Employee Leave Entitlement
The employees of the Company are entitled to leave as per the leave policy of the Company. The liability in respect of unutilised leave balances is provided based on an actuarial valuation carried out by an independent actuary as at the year end and charged to the Profit and Loss Account.
(x) Foreign Currency Transactions, Derivative Instruments and Hedge Accounting
(a) Foreign currency transactions are recorded at the exchange rates prevailing on the date of such transactions. Monetary assets and liabilities as at the Balance Sheet date are translated at the rates of exchange prevailing at the date of the Balance Sheet. Gains and losses arising on account of differences in foreign exchange rates on settlement/ translation of monetary assets and liabilities are recognised in the Profit and Loss Account except for monetary items that in substance forms part of Company’s net investment in a non-integral foreign operation are recognised in Foreign Exchange Translation Reserve. Non-monetary foreign currency items are carried at cost.
(b) In respect of forward contracts, other than forward contracts in respect of firm commitments and highly probable forecast transactions, the premium or discount arising at the inception of forward exchange contract, is amortised as expense or income over the life of the contract. Exchange differences on such contracts are
SCHEDULES ANNEXED TO AND FORMING PART OF THE BALANCE SHEET AS AT MARCH 31, 2011 AND PROFIT AND LOSS ACCOUNT FOR THE YEAR ENDED MARCH 31, 2011.

71
recognised in the Profit and Loss Account in the reporting period in which the exchange rates change. Any profit or loss arising on cancellation or renewal of such a forward exchange contract is recognised as income or as expense for the period.
(c) In respect of forward contracts and currency options taken to hedge the risks associated with foreign currency fluctuations relating to firm commitments and highly probable forecast transactions, the Company has adopted Accounting Standard 30 ‘Financial Instruments: Recognition and Measurement”. Accordingly, foreign currency fluctuations relating to firm commitments and highly probable forecast transactions are fair valued at each reporting date.
Changes in the fair value of these hedging instruments that are designated and considered as effective hedges of highly probable forecasted transactions are recognised directly in shareholders’ funds under ‘Hedging Reserve Account’ to be recognised in the Profit and Loss Account when the underlying transaction occurs. Changes in the fair value of the hedging instruments that do not qualify for hedge accounting are recognised in the Profit and Loss Account as they arise.
(xi) Revenue Recognition
(a) Sales revenue is recognised on transfer of significant risks and rewards of ownership of the goods to the buyer. Domestic sales are recognised on dispatch to customers. Export sales are recognised on the date of cargo receipts, bill of lading or other relevant documents, in accordance with the terms and conditions for sales. Realised exchange differences on export debtors are included in sales.
(b) In case of sales made by the Company as Support Manufacturer, export benefits arising from Duty Entitlement Pass Book (DEPB) are recognised on export of such goods in accordance with the agreed terms and conditions with customers. In case of direct exports made by the Company export benefits arising from DEPB, Duty Drawback scheme and Focus Market Scheme are recognised on shipment of direct exports.
(c) Dividends are accounted for when the right to receive dividend is established.
(xii) Government Grants
Government grants are accounted for when it is reasonably certain that ultimate collection will be made. Capital grants relating to specific assets are reduced from the gross value of the Fixed Assets. Revenue grants, in the nature of interest subsidy under the Technology Upgradation Fund Scheme (TUFS) are adjusted against ‘Interest on Fixed Loans’.
(xiii) Impairment of Assets
The Company assesses at each Balance Sheet date whether there is any indication that an asset may be impaired. If any such indication exists, the Company estimates the recoverable amount of the asset. If such recoverable amount of the asset or recoverable amount of the cash generating unit to which the asset belongs is less than its carrying amount, the carrying amount is reduced to its recoverable amount. The reduction is treated as an impairment loss and is recognised in the Profit and Loss Account. If at the Balance Sheet date there is an indication that if a previously assessed impairment loss no longer exists, the recoverable amount is reassessed and the asset is reflected at the recoverable amount.
(xiv) Provisions and Contingent Liabilities
The Company recognises a provision when there is a present obligation as a result of a past event that probably requires an outflow of resources and a reliable estimate can be made of the amount of the obligation. A disclosure for a contingent liability is made when there is a possible obligation or a present obligation that may, but probably will not, require an outflow of resources. Where there is a possible obligation or a present obligation but the likelihood of outflow of resources is remote, no provision or disclosure is made as specified in Accounting Standard 29 – “ Provisions, Contingent Liabilities and Contingent Assets”, notified under Section 211(3C) of the Act.
SCHEDULES ANNEXED TO AND FORMING PART OF THE BALANCE SHEET AS AT MARCH 31, 2011 AND PROFIT AND LOSS ACCOUNT FOR THE YEAR ENDED MARCH 31, 2011.

72
(xv) Employees Stock Option Schemes
Stock options granted to employees under Employee Stock Option Schemes are accounted as per the accounting treatment prescribed in the Guidance Note on Accounting for Employee Share-based Payments issued by the Institute of Chartered Accountants of India.
(xvi) Accounting Estimates
The preparation of financial statements requires estimates and assumptions to be made that affect the reported amounts of assets and liabilities on the date of financial statements and the reported amounts of revenue and expenses during the reporting period. Difference between the actual results and the estimates are recognised in the period in which the results are known/ materialised.
2. Contingent Liabilities:
Description As at As at March 31, 2011 March 31, 2010 Rs. million Rs. million
Excise, Customs and Service Tax Alleged improper re-credit of duty paid through PLA under Notification no. 39/2001 –CE dated July 31, 2001 in respect of goods sold from the factory during the period from February 2006 to September 2007. The Assistant Commissioner of Central Excise passed the order against the Company. The Company paid pre-deposit of Rs. 100 million as required by Central Excise authorities and obtained stay on payment of remaining amount. The case was remanded back to the lower authority to consider the claim of the Company by Commissioner Appeals.
Further, separate show cause notice had been issued by Commissioner of Central Excise seeking recovery of allegedly improper re-credit of duty along with interest and penalty. The Company is in the process of filing reply against this show cause notice. The case is remanded back by Tribunal to lower authority and directed them for reassessments of liability vide order dated March 29, 2011.
Alleged improper grant of refund for duty paid through PLA by Assistant Commissioner under Rule 18 of Central Excise Rules during the period from September 2005 to July 2006. The Commissioner (Appeals) of Customs and Central Excise had passed the order against the Company. The Company has filed Revision Application with the Joint Secretary, Ministry of Finance, Department of Revenue.
Alleged improper Cenvat credit availed and non-payment of excise duty under Notification No. 214/86 – CE dated 25-03-1986, on furnace oil used for manufacturing of goods on job work during the period April 2002 to May 2005. The Company has filed its reply against the show cause notices issued by Joint Commissioner and Commissioner of Customs and Central Excise, Daman.
Alleged improper abatement of service tax on payments made to Goods Transport Agency under Notification No. 32/04-ST dated December 31, 2004. The Company has filed its reply against the show cause notice issued by the Commissioner of Central Excise and Customs, Daman.
Alleged availment of service tax credit based on improper documents. The Company has received an order from Commissioner, Central Excise and Customs, Daman demanding the amount of duty, interest and penalty. The Company filed an appeal against the order with Commissioner of Central Excise & Customs (Appeals), Daman
318.58 318.58
69.57 69.57
3.67 3.50
50.46 47.98
- 0.16
SCHEDULES ANNEXED TO AND FORMING PART OF THE BALANCE SHEET AS AT MARCH 31, 2011 AND PROFIT AND LOSS ACCOUNT FOR THE YEAR ENDED MARCH 31, 2011.

73
2.00 1.91
SCHEDULES ANNEXED TO AND FORMING PART OF THE BALANCE SHEET AS AT MARCH 31, 2011 AND PROFIT AND LOSS ACCOUNT FOR THE YEAR ENDED MARCH 31, 2011.
Description As at As at March 31, 2011 March 31, 2010 Rs. million Rs. million
- 0.04
10.52 96.40
3.04 3.04
20.24 -
7.49 -
0.04 -
0.20 -
1.14 -
0.35 -
1.24 -
Alleged improper Cenvat credit availed on “racks” classified as capital goods, which are used for storage of finished goods. The Company received an order from Additional Commissioner, Central Excise & Customs; Daman dated 11.02.2009 demanding the amount of duty, interest and penalty. The Company paid Rs. 0.69 million under protest and filed an appeal against the order with Commissioner of Central Excise & Customs (Appeals), Daman in March 2009. The Company has obtained stay order with respect to the payment of duty.
Alleged improper availment of Cenvat credit on service tax paid on insurance premium paid for availing insurance services that are not used in or in relation to manufacture of final products. During the year Commissioner of Central Excise and Customs (Appeals), Daman decided this matter in favour of the Company.
Alleged non-reversal of cenvat credit contained in raw material stock, raw material in process and raw material contained in finished stock on exit from cenvat scheme. The Commissioner of Central Excise issued a show cause notice seeking recovery of the non-reversed amount. During the year, the Company has received favorable order with respect to part of the amount in dispute. The Company has filed an appeal before Commissioner of Central Excise and Customs (Appeals) for the balance amount disallowed.
Alleged erroneous sanction of refund of service tax by Assistant Commissioner of Central Excise. The Deputy Commissioner of Central Excise issued a show cause notice regarding recovery of the refund erroneously sanctioned. The Company has submitted its reply to the Deputy Commissioner of Central Excise.
Alleged improper availment of Cenvat credit on service tax paid on sales commission. The Company has received a show-cause notice from Assistant Commissioner of Central Excise and Customs, Vapi against which a reply has been filed by the Company.
Alleged improper availment of Cenvat credit on service tax on outward freight of transportation for export clearance. The Company has received a show-cause notice from Additional Commissioner Central Excise Custom and Service Tax (Daman) against which reply has been submitted to Commissioner of Central Excise.
Alleged improper availment of Cenvat credit on service tax on commission on sales. The Company has submitted its reply for the show cause notice received to Commissioner of Central Excise.
Alleged misinterpretation of Notification No 4/ 2006-2007 under the Customs Act for which a reply to the show causes notice has been submitted.
Alleged availment of Cenvat credit on service tax. The Company has received an order from Commissioner, Central Excise and Customs, demanding the amount of duty, interest and penalty. The Company has filed an appeal against the order with Commissioner of Central Excise and Customs (Appeals).
Alleged dual availment of duty drawback and DEPB scheme simultaneously. Appeal of Central Excise department was rejected by Central Excise and Customs (Appeals). The Central Excise Department has filed appeal with Revisionary Authority, New Delhi.
Alleged improper payment of service tax on services received and used in export of goods and applied for refund under 17/2009-ST without taking credit of the same. The department has rejected the refund claims made by the Company and issued a show cause notice dated March 7, 2011. The Company has filed its reply against the show cause notice to Deputy Commissioner, Central Excise Division, Gandhidham.
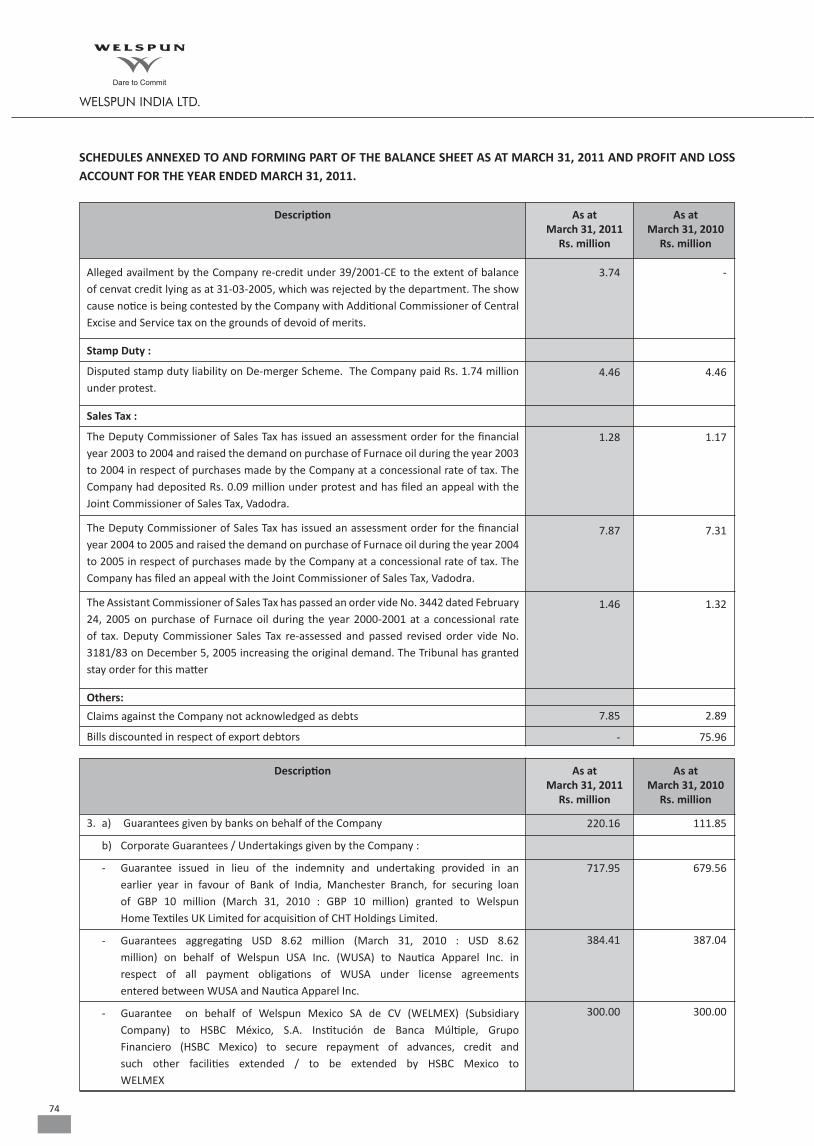
74
Description As at As at March 31, 2011 March 31, 2010 Rs. million Rs. million
4.46 4.46
1.28 1.17
7.87 7.31
1.46 1.32
7.85 2.89
- 75.96
Alleged availment by the Company re-credit under 39/2001-CE to the extent of balance of cenvat credit lying as at 31-03-2005, which was rejected by the department. The show cause notice is being contested by the Company with Additional Commissioner of Central Excise and Service tax on the grounds of devoid of merits.
Stamp Duty :
Disputed stamp duty liability on De-merger Scheme. The Company paid Rs. 1.74 million under protest.
Sales Tax :
The Deputy Commissioner of Sales Tax has issued an assessment order for the financial year 2003 to 2004 and raised the demand on purchase of Furnace oil during the year 2003 to 2004 in respect of purchases made by the Company at a concessional rate of tax. The Company had deposited Rs. 0.09 million under protest and has filed an appeal with the Joint Commissioner of Sales Tax, Vadodra.
The Deputy Commissioner of Sales Tax has issued an assessment order for the financial year 2004 to 2005 and raised the demand on purchase of Furnace oil during the year 2004 to 2005 in respect of purchases made by the Company at a concessional rate of tax. The Company has filed an appeal with the Joint Commissioner of Sales Tax, Vadodra.
The Assistant Commissioner of Sales Tax has passed an order vide No. 3442 dated February 24, 2005 on purchase of Furnace oil during the year 2000-2001 at a concessional rate of tax. Deputy Commissioner Sales Tax re-assessed and passed revised order vide No. 3181/83 on December 5, 2005 increasing the original demand. The Tribunal has granted stay order for this matter
Others:
Claims against the Company not acknowledged as debts
Bills discounted in respect of export debtors
Description As at As at March 31, 2011 March 31, 2010 Rs. million Rs. million
220.16 111.85
717.95 679.56
384.41 387.04
300.00 300.00
3. a) Guarantees given by banks on behalf of the Company
b) Corporate Guarantees / Undertakings given by the Company :
- Guarantee issued in lieu of the indemnity and undertaking provided in an earlier year in favour of Bank of India, Manchester Branch, for securing loan of GBP 10 million (March 31, 2010 : GBP 10 million) granted to Welspun Home Textiles UK Limited for acquisition of CHT Holdings Limited.
- Guarantees aggregating USD 8.62 million (March 31, 2010 : USD 8.62 million) on behalf of Welspun USA Inc. (WUSA) to Nautica Apparel Inc. in respect of all payment obligations of WUSA under license agreements entered between WUSA and Nautica Apparel Inc.
- Guarantee on behalf of Welspun Mexico SA de CV (WELMEX) (Subsidiary Company) to HSBC México, S.A. Institución de Banca Múltiple, Grupo Financiero (HSBC Mexico) to secure repayment of advances, credit and such other facilities extended / to be extended by HSBC Mexico to WELMEX
SCHEDULES ANNEXED TO AND FORMING PART OF THE BALANCE SHEET AS AT MARCH 31, 2011 AND PROFIT AND LOSS ACCOUNT FOR THE YEAR ENDED MARCH 31, 2011.
3.74 -

75
847.31 853.10
SCHEDULES ANNEXED TO AND FORMING PART OF THE BALANCE SHEET AS AT MARCH 31, 2011 AND PROFIT AND LOSS ACCOUNT FOR THE YEAR ENDED MARCH 31, 2011.
Description As at As at March 31, 2011 March 31, 2010 Rs. million Rs. million
49.95 50.29
- 210.00
891.90 # 808.20
3,593.00 3,593.00
900.00 * -
400.00 * -
654.00 * -
108.49 29.13
839.23 1,046.73
- Guarantee of USD 19 million (March 31, 2010: USD 19 million) on behalf of WUSA to Verde Chihuahua Industrial S de RL de CV (Verde), in respect of all payments by WUSA as a tenant under lease agreement between WUSA and Verde. Subsequently lease agreement was reassigned to WELMEX.
- Guarantee of USD 1.12 million (March 31, 2010: USD 1.12 million) on behalf of WELMEX to Nautica Apparel Inc. in respect of all payment obligations of WELMEX under the License Agreement entered between WELMEX and Nautica Apparel Inc.
- Guarantee on behalf of Welspun Global Brands Limited (WGBL) in favour of Bank of India to secure repayment of loans extended / to be extended by Bank of India to WGBL.
- Guarantee of USD 20 million (March 31, 2010: USD 18 million) on behalf of WUSA in favour of Bank of Baroda, New York Branch to secure repayment of loans extended/ to be extended by Bank of Baroda to WUSA.
- Guarantee on behalf of WGBL in favour of consortium of Bankers led by State Bank of Bikaner and Jaipur (“SBBJ Consortium”) to secure repayment of facilities extended/ to be extended by SBBJ Consortium to WGBL. In addition guarantee extends to facility of 20% of ad-hoc fund based Working Capital limit under the Gold Card Scheme .
- Guarantee on behalf of Welspun Captive Power Generation Limited (WCPGL) in favour of ICICI Bank to secure repayment of letter of credit facility from ICICI Bank.
- Guarantee on behalf of WGBL in favour of YES Bank to secure repayment of working capital facilities from Yes Bank.
- Guarantee on behalf of WGBL in favour of State Bank of Bikaner and Jaipur (SBBJ) to secure repayment of working capital facilities from SBBJ.
c) In accordance with the EPCG Scheme, imports of capital goods are allowed to be made duty free and under Advance License Scheme, imports of raw material are allowed to be made duty free, subject to the condition that the Company will fulfill, in future, a specified amount of export obligation within a specified time. Based on the current operating plan, the Company would fulfill its export obligation within the specified time period. Amount of duty saved on imports of above goods against which export obligation is yet to be fulfilled by the Company.
d) Estimated amount of contracts (net of advances) remaining to be executed on capital account and not provided for.
* These guarantees are subject to approval of the shareholders under Section 372A of the Act.# Includes guarantee given during the year of Rs. 91.19 million (USD 2 million), which is subject to approval of the shareholders under Section 372A of the Act.
4. During the year, the Company has recognised deferred tax assets aggregating Rs. 303.64 million on the incremental unabsorbed Income-tax depreciation arising out of its treatment of certain Excise and Value Added Tax incentives as ‘capital receipts’ for income tax purposes based on the favorable decision received from the Commissioner of Income Tax (Appeals) in its own case and judgment in re Commissioner of Income Tax, Mumbai v/s. Reliance Industries Limited of the Honourable High Court of Judicature at Bombay. However, the judgment given by the High Court of Judicatue
76
SCHEDULES ANNEXED TO AND FORMING PART OF THE BALANCE SHEET AS AT MARCH 31, 2011 AND PROFIT AND LOSS ACCOUNT FOR THE YEAR ENDED MARCH 31, 2011.
at Bombay has been challenged by the tax authorities in the apex court. If the final decision in the matter is eventually decided against the Company, then the carrying value of the deferred tax assets at the year end could be significantly impacted.
5. Pursuant to loan agreement with Welspun USA Inc., the loan outstanding as on March 31, 2011, aggregating Rs. 111.49 million recoverable from Welspun USA Inc. is to be converted into equity investments and pending conversion modalities, the same has been disclosed as Share Application Pending Allotment and grouped under Loans and Advances.
6. Borrowing Costs aggregating Rs. Nil (Previous Year: Rs. 15.46 million) (net of interest subsidy of Rs. Nil; Previous Year: Rs. 13.18 million) attributable to the acquisition or construction of qualifying assets are capitalised during the year as part of the cost of such assets.
7. (a) In the meeting of the Board of Directors of the Company held on May 11, 2011, it was resolved that the business of Welspun Mexico S.A. de C.V. (a wholly-owned downstream subsidiary of Welspun AG which, in turn, is a wholly owned subsidiary of the Company), involved in manufacturing decorative bedding products for Welspun AG, shall be re-organised in view of the adverse law and order conditions in the region in which the manufacturing premises of Welspun Mexico S.A. de C.V is situated which has severely impacted its business prospects and its ability to contain the sustained losses and reverse the accumulated losses. Further, there has been breach of the lease agreement by the landlord necessitating the vacating of the premises. The aforesaid business reorganization involves exiting the current manufacturing premises of Welspun Mexico S.A. de C.V. and setting up trading activities only in new premises, disposing of the assets and discontinuing the employment of the majority of its employees. The Board of Directors further resolved in the aforesaid meeting that the consequential impairment in the value of the Company’s investments in Welspun AG, and loans given to Welspun AG, shall be determined and recognized. Other than the business of Welspun Mexico S.A. de C.V., Welspun AG does not have any substantial business activities. As at March 31, 2011, the Company had investments, aggregating Rs. 739.12 million, in Welspun AG, and outstanding loans at zero rate of interest, aggregating Rs. 936.23 million, and other advances, aggregating Rs 1.68 million, due from Welspun AG. Accordingly, a provision of Rs. 739.12 million towards diminution in the value of investments in Welspun AG, and a provision of Rs 937.91 million towards the aforesaid loans and advances to Welspun AG, have been recognized and disclosed as extraordinary items in the Profit and Loss Account for the year.
(b) As at March 31, 2011, the Company has trade receivables aggregating Rs. 696.02 million, due from a related Company, Welspun Retail Limited (WRL), (March 31, 2010: Rs. 475.93 million). Of the said amount Rs. 108.33 million (March 31, 2010: Rs. 52.07 million) is outstanding for more than one year. WRL continues to incur significant losses from operations which could impact its ability to settle the aforesaid receivables. In order to turnaround its operations, WRL has made a robust plan for widening its reach in the market by using new marketing strategies with aggressive cost reduction programs. Accordingly, in the opinion of the Management, the aforesaid receivable from the said related Company as at March 31, 2011 is considered good and recoverable.
8. Consequent to the demerger of the marketing arm of the Company effective April 1, 2009, the Company is dependent upon Welspun Global Brands Limited (WGBL) for all marketing of its products and WGBL is the Company’s principal customer as regards international sales of its products. Most of the domestic sales of the Company are made to WRL, a subsidiary of WGBL. The Company does not have any long term definitive agreements with either WGBL or WRL for marketing the Company’s products. In the event that WGBL or WRL ceased to purchase or market the Company’s products, it could have an adverse effect on the business of the Company.
9. The Company has issued a corporate guarantee of Rs. 3,593 million (March 31, 2010: Rs. 3,593 million) on behalf of WGBL in favor of a consortium of bankers in relation to post-shipment debt facilities provided by them to WGBL. WGBL has also given a corporate guarantee of Rs. 5,887.40 million (March 31, 2010: Rs. 5,887.40 million) in favour of the consortium of bankers in relation to pre-shipment debt facilities provided by them to the Company. If WGBL is unable
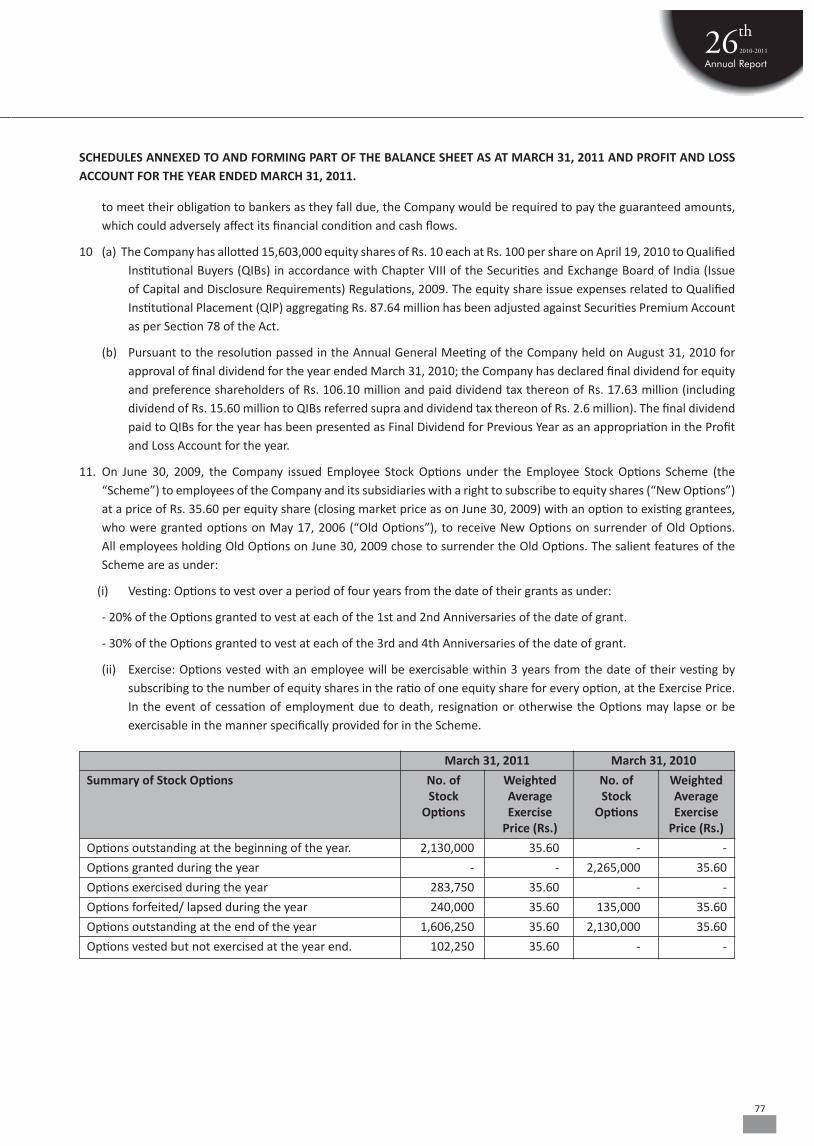
77
to meet their obligation to bankers as they fall due, the Company would be required to pay the guaranteed amounts, which could adversely affect its financial condition and cash flows.
10 (a) The Company has allotted 15,603,000 equity shares of Rs. 10 each at Rs. 100 per share on April 19, 2010 to Qualified Institutional Buyers (QIBs) in accordance with Chapter VIII of the Securities and Exchange Board of India (Issue of Capital and Disclosure Requirements) Regulations, 2009. The equity share issue expenses related to Qualified Institutional Placement (QIP) aggregating Rs. 87.64 million has been adjusted against Securities Premium Account as per Section 78 of the Act.
(b) Pursuant to the resolution passed in the Annual General Meeting of the Company held on August 31, 2010 for approval of final dividend for the year ended March 31, 2010; the Company has declared final dividend for equity and preference shareholders of Rs. 106.10 million and paid dividend tax thereon of Rs. 17.63 million (including dividend of Rs. 15.60 million to QIBs referred supra and dividend tax thereon of Rs. 2.6 million). The final dividend paid to QIBs for the year has been presented as Final Dividend for Previous Year as an appropriation in the Profit and Loss Account for the year.
11. On June 30, 2009, the Company issued Employee Stock Options under the Employee Stock Options Scheme (the “Scheme”) to employees of the Company and its subsidiaries with a right to subscribe to equity shares (“New Options”) at a price of Rs. 35.60 per equity share (closing market price as on June 30, 2009) with an option to existing grantees, who were granted options on May 17, 2006 (“Old Options”), to receive New Options on surrender of Old Options. All employees holding Old Options on June 30, 2009 chose to surrender the Old Options. The salient features of the Scheme are as under:
(i) Vesting: Options to vest over a period of four years from the date of their grants as under:
- 20% of the Options granted to vest at each of the 1st and 2nd Anniversaries of the date of grant.
- 30% of the Options granted to vest at each of the 3rd and 4th Anniversaries of the date of grant.
(ii) Exercise: Options vested with an employee will be exercisable within 3 years from the date of their vesting by subscribing to the number of equity shares in the ratio of one equity share for every option, at the Exercise Price. In the event of cessation of employment due to death, resignation or otherwise the Options may lapse or be exercisable in the manner specifically provided for in the Scheme.
SCHEDULES ANNEXED TO AND FORMING PART OF THE BALANCE SHEET AS AT MARCH 31, 2011 AND PROFIT AND LOSS ACCOUNT FOR THE YEAR ENDED MARCH 31, 2011.
March 31, 2011 March 31, 2010
Summary of Stock Options No. of Weighted No. of Weighted Stock Average Stock Average Options Exercise Options Exercise Price (Rs.) Price (Rs.)
Options outstanding at the beginning of the year. 2,130,000 35.60 - -
Options granted during the year - - 2,265,000 35.60
Options exercised during the year 283,750 35.60 - -
Options forfeited/ lapsed during the year 240,000 35.60 135,000 35.60
Options outstanding at the end of the year 1,606,250 35.60 2,130,000 35.60
Options vested but not exercised at the year end. 102,250 35.60 - -
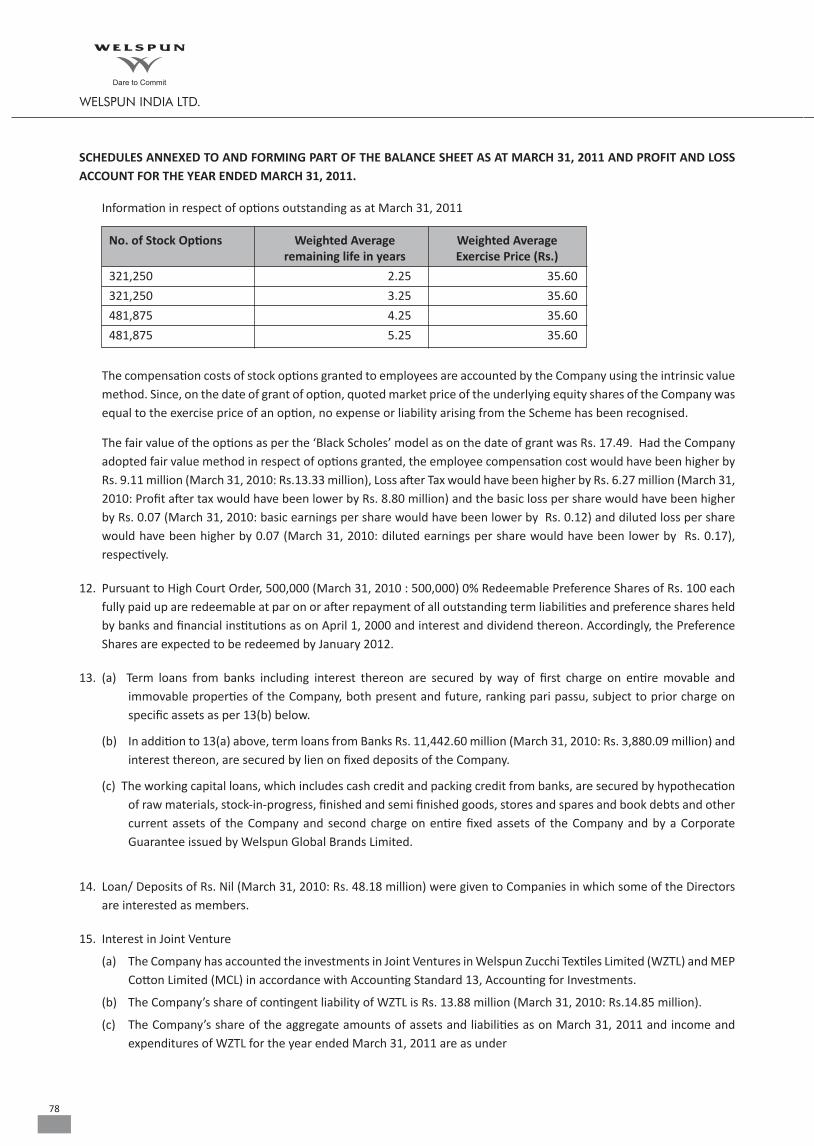
78
No. of Stock Options Weighted Average Weighted Average remaining life in years Exercise Price (Rs.)
321,250 2.25 35.60
321,250 3.25 35.60
481,875 4.25 35.60
481,875 5.25 35.60
The compensation costs of stock options granted to employees are accounted by the Company using the intrinsic value method. Since, on the date of grant of option, quoted market price of the underlying equity shares of the Company was equal to the exercise price of an option, no expense or liability arising from the Scheme has been recognised.
The fair value of the options as per the ‘Black Scholes’ model as on the date of grant was Rs. 17.49. Had the Company adopted fair value method in respect of options granted, the employee compensation cost would have been higher by Rs. 9.11 million (March 31, 2010: Rs.13.33 million), Loss after Tax would have been higher by Rs. 6.27 million (March 31, 2010: Profit after tax would have been lower by Rs. 8.80 million) and the basic loss per share would have been higher by Rs. 0.07 (March 31, 2010: basic earnings per share would have been lower by Rs. 0.12) and diluted loss per share would have been higher by 0.07 (March 31, 2010: diluted earnings per share would have been lower by Rs. 0.17), respectively.
12. Pursuant to High Court Order, 500,000 (March 31, 2010 : 500,000) 0% Redeemable Preference Shares of Rs. 100 each fully paid up are redeemable at par on or after repayment of all outstanding term liabilities and preference shares held by banks and financial institutions as on April 1, 2000 and interest and dividend thereon. Accordingly, the Preference Shares are expected to be redeemed by January 2012.
13. (a) Term loans from banks including interest thereon are secured by way of first charge on entire movable and immovable properties of the Company, both present and future, ranking pari passu, subject to prior charge on specific assets as per 13(b) below.
(b) In addition to 13(a) above, term loans from Banks Rs. 11,442.60 million (March 31, 2010: Rs. 3,880.09 million) and interest thereon, are secured by lien on fixed deposits of the Company.
(c) The working capital loans, which includes cash credit and packing credit from banks, are secured by hypothecation of raw materials, stock-in-progress, finished and semi finished goods, stores and spares and book debts and other current assets of the Company and second charge on entire fixed assets of the Company and by a Corporate Guarantee issued by Welspun Global Brands Limited.
14. Loan/ Deposits of Rs. Nil (March 31, 2010: Rs. 48.18 million) were given to Companies in which some of the Directors are interested as members.
15. Interest in Joint Venture
(a) The Company has accounted the investments in Joint Ventures in Welspun Zucchi Textiles Limited (WZTL) and MEP Cotton Limited (MCL) in accordance with Accounting Standard 13, Accounting for Investments.
(b) The Company’s share of contingent liability of WZTL is Rs. 13.88 million (March 31, 2010: Rs.14.85 million).
(c) The Company’s share of the aggregate amounts of assets and liabilities as on March 31, 2011 and income and expenditures of WZTL for the year ended March 31, 2011 are as under
SCHEDULES ANNEXED TO AND FORMING PART OF THE BALANCE SHEET AS AT MARCH 31, 2011 AND PROFIT AND LOSS ACCOUNT FOR THE YEAR ENDED MARCH 31, 2011.
Information in respect of options outstanding as at March 31, 2011

79
WZTL MCL*
Particulars March 31, March 31, March 31, March 31, 2011 2010 2011 2010
Assets 118.44 95.03 - -
Liabilities (excluding Share Capital and Reserves and Surplus) 49.45 26.74 - -
Income 144.29 131.53 - 374.58
Expenditure (including provision for taxes) 143.59 124.14 - 395.23
* Ceased to be Joint Venture effective January 31, 2010
(Rs. million)
SCHEDULES ANNEXED TO AND FORMING PART OF THE BALANCE SHEET AS AT MARCH 31, 2011 AND PROFIT AND LOSS ACCOUNT FOR THE YEAR ENDED MARCH 31, 2011.
16. Managerial Remuneration and Sitting Fees paid/ payable to directors:
Year ended Year ended March 31, 2011 March 31, 2010
Managing / Whole time directors
(i) Salary and Allowances 6.80 7.70
(ii) Perquisites 0.23 0.30
(iii) Commission to Managing Director and a Whole time Director 10.35 26.96
Total 17.38 34.96
Directors other than Managing / Whole time directors Sitting fees 0.43 0.16
Total 17.81 35.12
Note: Provisions for leave entitlement and post retirement benefits which are based on actuarial valuations done on an overall Company basis are ex-cluded above.
Year ended Year ended March 31, 2011 March 31, 2010
Net Profit/ (Loss) before taxation (648.36) 1,704.56
Add:
Managerial Remuneration and Sitting Fees 17.81 35.12
Depreciation as per the Profit and Loss Account 1,135.13 1,063.25
Loss on redemption/ sale of units in Mutual Funds 0.03 -
Provision for doubtful advances 937.91 -
Provision for diminution in value of Investments 739.12 -
2,181.64 2,802.93
Less:
Provision for doubtful debts/ advances written back - (14.31)
Profit on redemption/ sale of units in Mutual Funds - (0.02)
Liabilities no longer required written back (6.94) (2.56)
Profit on redemption/ sale of Bonds (4.53) (0.28)
Depreciation as per Section 350 of the Act (1,135.13) (1,063.25)
Net profit as per Section 198 of the Act 1,035.04 1,722.51
Maximum remuneration payable under the Act @ 10% of the above 103.51 172.25
Restricted to 17.38 34.96
Computation of Net Profit/ (Loss) for the year in accordance with Section 198 of the Companies Act, 1956:
(Rs. million)

80
Particulars Year ended Year ended March 31, 2011 March 31, 2010
i) the principal amount and the interest due thereon (to be shown separately) remaining unpaid to any supplier as at the end of each accounting year;
- Principal 6.42 1.05 - Interest due thereon 0.27 0.02
ii) the amount of interest paid by the buyer in terms of section 16 of the Micro, Small and Medium Enterprises Development Act, 2006, along with the amount of the payment made to the s upplier beyond the appointed day during each accounting year;
- Principal 62.25 1.40 - Interest 0.02 0.01
iii) the amount of interest due and payable for the period of delay 0.05 - in making payment (which have been paid but beyond the appointed day during the year) but without adding the interest specified under the Micro, Small and Medium Enterprises Development Act, 2006;
iv) the amount of interest accrued and remaining unpaid at the end of each accounting year;
- Total interest Accrued 0.27 0.02
- Interest remaining unpaid 0.27 0.02
v) the amount of further interest remaining due and payable even in the succeeding years, until such date when the interest dues as above are actually paid to the small enterprise, for the purpose 0.27 0.02 of disallowance as a deductible expenditure under section 23 of the Micro, Small and Medium Enterprises Development Act, 2006.
17. Disclosure for Micro and Small Enterprises: (Rs. million)
The above information and that given in Schedule 12 – “Current Liabilities and Provisions” regarding micro and small en-terprises has been determined to the extent such parties have been identified on the basis of information available with the Company.
18. Details of Purchase and Sale of Investments during the year ended March 31, 2011
INVESTMENTS Number of Shares/ Units Number of Shares/ Units Purchased during the Sold during the Year ended Year ended March 31, 2011 March 31, 2011
Welspun Captive Power Generation Limited 15,000 - Axis Liquid Fund - Institutional Plan - Daily Dividend Reinvestment 681,233 681,233 Birla Sun Life Cash Manager - Institutional Plan - Daily Dividend Reinvestment 41,364,337 41,364,337 Birla Sun Life Cash Plus - Institutional Premium - Daily Dividend Reinvestment 71,025,148 71,025,148 BOB Pioneer Liquid Fund - Daily Dividend Reinvestment 72,875,663 72,875,663 BOB Pioneer Liquid Fund - Institutional Plan - Daily Dividend Reinvestment 103,714,336 103,714,336 Daiwa Liquid Fund - Institutional Plan - Daily Dividend Reinvestment 14,316 14,316 DSP Black Rock Liquidity Fund - Institutional Plan - Daily Dividend Reinvestment 91,664 91,664 DWS Insta Cash Plus Fund - Institutional Plan - Daily Dividend Reinvestment 17,535,080 17,535,080 DWS Insta Cash Plus Fund - Regular Plan - Daily Dividend Reinvestment 334,635 334,635 DWS Insta Cash Plus Fund - Super Institutional Plan - Daily Dividend Reinvestment 54,441,352 54,441,352 DWS Treasury Fund - Cash - Institutional Plan - Daily Dividend Reinvestment 14,047,254 14,047,254 ING Liquid Fund Super Institutional - Daily Dividend Reinvestment Option 5,713,894 5,713,894 JM High Liquidity Fund - Super Institutional Plan - Daily Dividend Reinvestment Option 38,294,161 38,294,161 JP Morgan India Liquid Fund - Super Institutional Plan - Daily Dividend Reinvestment Option 200,304,123 200,304,123
SCHEDULES ANNEXED TO AND FORMING PART OF THE BALANCE SHEET AS AT MARCH 31, 2011 AND PROFIT AND LOSS ACCOUNT FOR THE YEAR ENDED MARCH 31, 2011.
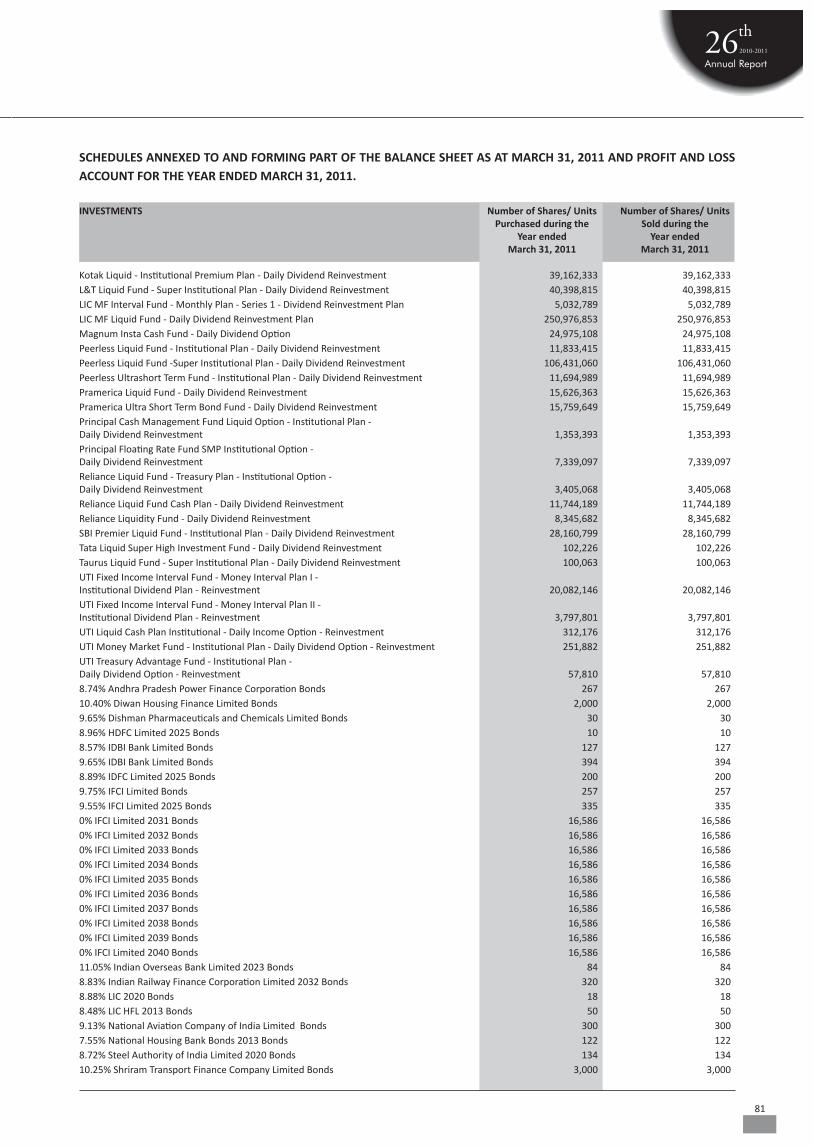
81
SCHEDULES ANNEXED TO AND FORMING PART OF THE BALANCE SHEET AS AT MARCH 31, 2011 AND PROFIT AND LOSS ACCOUNT FOR THE YEAR ENDED MARCH 31, 2011.
Kotak Liquid - Institutional Premium Plan - Daily Dividend Reinvestment 39,162,333 39,162,333 L&T Liquid Fund - Super Institutional Plan - Daily Dividend Reinvestment 40,398,815 40,398,815 LIC MF Interval Fund - Monthly Plan - Series 1 - Dividend Reinvestment Plan 5,032,789 5,032,789 LIC MF Liquid Fund - Daily Dividend Reinvestment Plan 250,976,853 250,976,853 Magnum Insta Cash Fund - Daily Dividend Option 24,975,108 24,975,108 Peerless Liquid Fund - Institutional Plan - Daily Dividend Reinvestment 11,833,415 11,833,415 Peerless Liquid Fund -Super Institutional Plan - Daily Dividend Reinvestment 106,431,060 106,431,060 Peerless Ultrashort Term Fund - Institutional Plan - Daily Dividend Reinvestment 11,694,989 11,694,989 Pramerica Liquid Fund - Daily Dividend Reinvestment 15,626,363 15,626,363 Pramerica Ultra Short Term Bond Fund - Daily Dividend Reinvestment 15,759,649 15,759,649 Principal Cash Management Fund Liquid Option - Institutional Plan - Daily Dividend Reinvestment 1,353,393 1,353,393 Principal Floating Rate Fund SMP Institutional Option - Daily Dividend Reinvestment 7,339,097 7,339,097 Reliance Liquid Fund - Treasury Plan - Institutional Option - Daily Dividend Reinvestment 3,405,068 3,405,068 Reliance Liquid Fund Cash Plan - Daily Dividend Reinvestment 11,744,189 11,744,189 Reliance Liquidity Fund - Daily Dividend Reinvestment 8,345,682 8,345,682 SBI Premier Liquid Fund - Institutional Plan - Daily Dividend Reinvestment 28,160,799 28,160,799 Tata Liquid Super High Investment Fund - Daily Dividend Reinvestment 102,226 102,226 Taurus Liquid Fund - Super Institutional Plan - Daily Dividend Reinvestment 100,063 100,063 UTI Fixed Income Interval Fund - Money Interval Plan I - Institutional Dividend Plan - Reinvestment 20,082,146 20,082,146 UTI Fixed Income Interval Fund - Money Interval Plan II - Institutional Dividend Plan - Reinvestment 3,797,801 3,797,801 UTI Liquid Cash Plan Institutional - Daily Income Option - Reinvestment 312,176 312,176 UTI Money Market Fund - Institutional Plan - Daily Dividend Option - Reinvestment 251,882 251,882 UTI Treasury Advantage Fund - Institutional Plan - Daily Dividend Option - Reinvestment 57,810 57,810 8.74% Andhra Pradesh Power Finance Corporation Bonds 267 267 10.40% Diwan Housing Finance Limited Bonds 2,000 2,000 9.65% Dishman Pharmaceuticals and Chemicals Limited Bonds 30 30 8.96% HDFC Limited 2025 Bonds 10 10 8.57% IDBI Bank Limited Bonds 127 127 9.65% IDBI Bank Limited Bonds 394 394 8.89% IDFC Limited 2025 Bonds 200 200 9.75% IFCI Limited Bonds 257 257 9.55% IFCI Limited 2025 Bonds 335 335 0% IFCI Limited 2031 Bonds 16,586 16,586 0% IFCI Limited 2032 Bonds 16,586 16,586 0% IFCI Limited 2033 Bonds 16,586 16,586 0% IFCI Limited 2034 Bonds 16,586 16,586 0% IFCI Limited 2035 Bonds 16,586 16,586 0% IFCI Limited 2036 Bonds 16,586 16,586 0% IFCI Limited 2037 Bonds 16,586 16,586 0% IFCI Limited 2038 Bonds 16,586 16,586 0% IFCI Limited 2039 Bonds 16,586 16,586 0% IFCI Limited 2040 Bonds 16,586 16,586 11.05% Indian Overseas Bank Limited 2023 Bonds 84 84 8.83% Indian Railway Finance Corporation Limited 2032 Bonds 320 320 8.88% LIC 2020 Bonds 18 18 8.48% LIC HFL 2013 Bonds 50 50 9.13% National Aviation Company of India Limited Bonds 300 300 7.55% National Housing Bank Bonds 2013 Bonds 122 122 8.72% Steel Authority of India Limited 2020 Bonds 134 134 10.25% Shriram Transport Finance Company Limited Bonds 3,000 3,000
INVESTMENTS Number of Shares/ Units Number of Shares/ Units Purchased during the Sold during the Year ended Year ended March 31, 2011 March 31, 2011

82
19. Additional information pursuant to Part II of Schedule VI to the Companies Act, 1956.
a) Licensed Capacity Not Applicable
As per the Industrial Policy declared in July 1991, as amended in April 1993, no licences are required for the products manufactured by the Company.
Installed Capacity as at March 31, 2011 (As certified by Management)
Cotton Terry Towels 41,500 (March 31, 2010 : 41,500) M.T.
Cotton Yarn 33,130 (March 31, 2010 : 33,130) M.T.
Bed Sheets 45,000 (March 31, 2010 : 45,000) 000’ Mtrs
Rugs 10,151 (March 31, 2010 : 10,151) M.T.
b) Detailed information in respect of opening and closing stocks, production, purchases and sales in respect of each class of goods produced and traded :
Class of Goods Unit
Quantity Quantity Quantity Quantity QuantityRs. million Rs. million Rs. million Rs. million
Stocks at Commencement
Production Purchases Sales Stocks at Close
Terry Towels (Refer Note 2) MT 551.82 115.61 39,416.38 - - 36,035.21 10,315.79 908.98 253.77 (687.30) (141.22) (38,966.67) - - (36,284.19) (9,656.95) (551.82) (115.61)
Cotton Yarn (Refer Note 3) MT 193.80 17.74 31,737.82 22.86 1.13 738.29 92.41 172.99 35.11 - - (31,387.30) - - (1,180.08) (104.40) (193.80) (17.74)
Bed Linen Products 000 Mtrs 1,159.42 120.92 37,203.42 - - 37,495.84 6,700.45 867.00 127.03 (1,784.72) (157.17) (39,304.56) - - (39,929.86) (6,078.93) (1,159.42) (120.92)
Grey Fabric - Bed Linen 000 Mtrs - - 2,871.24 - - 2,871.24 263.08 - - - - (2,105.00) - - (2,105.00) (152.55) - -
Rugs MT 132.24 17.86 5,078.87 - - 4,987.44 978.14 223.67 27.19 (140.61) (30.40) (2,921.96) - - (2,930.33) (636.49) (132.24) (17.86)
Others - - 5.57 4,199.64 - - 4,199.64 268.50 - 10.73 - (3.62) - - - - (257.59) - (5.57)
Traded Cotton MT - - - 157.55 13.79 157.55 21.69 - - - - - (155.49) (16.89) (155.49) (16.94) - -
Cotton Yarn MT - - - 26.55 1.31 26.55 4.93 - - - - - (91.17) (14.56) (91.17) (14.56) - -
Bed Linen Products 000 PCS - - - - - - - - - - - - (101.16) (37.22) (101.16) (38.50) - -
Others - - - - 271.22 9.78 271.22 12.26 - - - - - - (0.57) - (0.57) - -
Total 277.70 26.01 18,657.25 453.83 (332.41) (69.24) (16,957.48) (277.70)
Notes:1. Previous Year figures are given in brackets.2. Terry Towel production includes captive consumption of 3,024.01 MT (Previous Year : 2,817.96 MT)3. Cotton Yarn production includes captive consumption of 31,253.20 MT (Previous Year : 30,013.42 MT).
INVESTMENTS Number of Shares/ Units Number of Shares/ Units Purchased during the Sold during the Year ended Year ended March 31, 2011 March 31, 2011
SCHEDULES ANNEXED TO AND FORMING PART OF THE BALANCE SHEET AS AT MARCH 31, 2011 AND PROFIT AND LOSS ACCOUNT FOR THE YEAR ENDED MARCH 31, 2011.
9.90% Tata Motors Limited Bonds 75 75 10.80% The Lakshmi Vilas Bank 2015 Bonds 60 60 8.64% Tamilnadu Electricity Board 2020 Bonds 22 22 8.92% UCO Bank 2020 Bonds 1 1 8.90% UCO Bank 2025 Bonds 50 50 9.20% West Bengal Infrastructure Development Finance Corporation Limited 2020 Bonds 948 948 9.34% West Bengal State Electricity Distribution Company Limited Bonds 1,243 442 9.75% West Bengal State Electricity Transmission Company Limited Bonds 70 70 0% Certificate of Deposit - Punjab National Bank 500 -
Manufactured
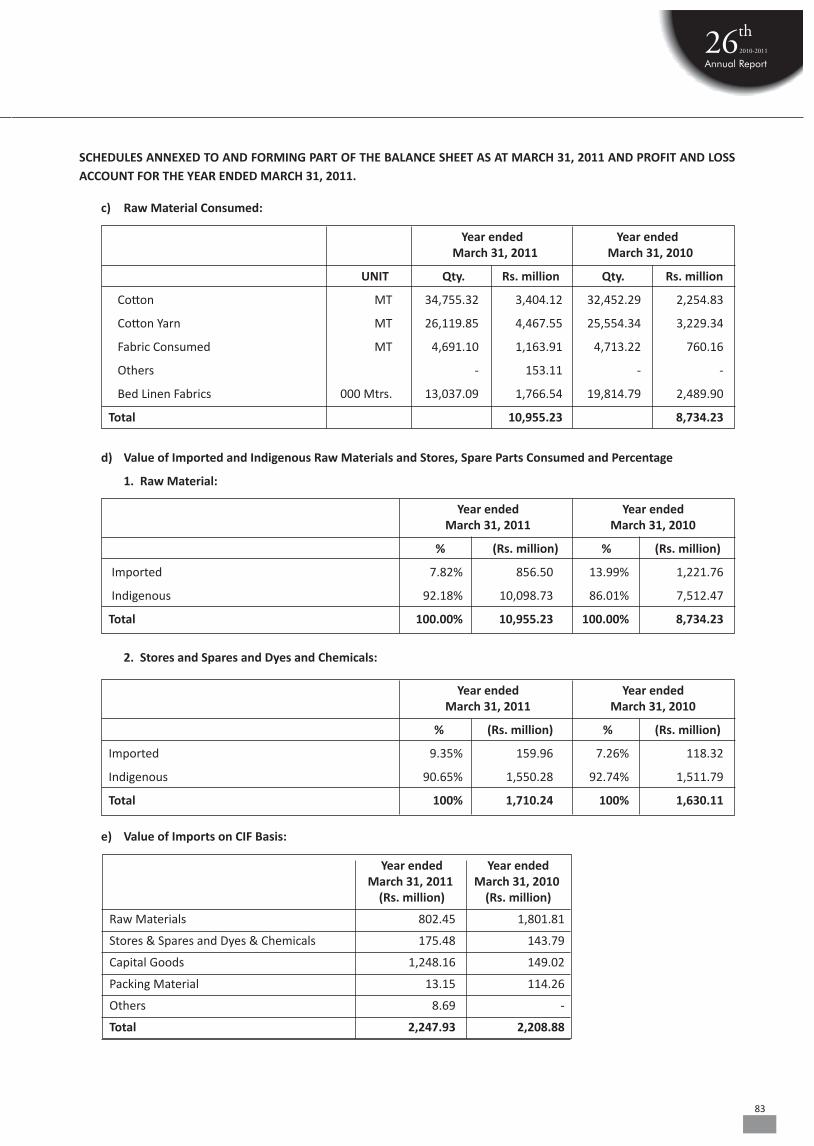
83
c) Raw Material Consumed:
Year ended Year ended March 31, 2011 March 31, 2010
UNIT Qty. Rs. million Qty. Rs. million
Cotton MT 34,755.32 3,404.12 32,452.29 2,254.83
Cotton Yarn MT 26,119.85 4,467.55 25,554.34 3,229.34
Fabric Consumed MT 4,691.10 1,163.91 4,713.22 760.16
Others - 153.11 - -
Bed Linen Fabrics 000 Mtrs. 13,037.09 1,766.54 19,814.79 2,489.90
Total 10,955.23 8,734.23
SCHEDULES ANNEXED TO AND FORMING PART OF THE BALANCE SHEET AS AT MARCH 31, 2011 AND PROFIT AND LOSS ACCOUNT FOR THE YEAR ENDED MARCH 31, 2011.
d) Value of Imported and Indigenous Raw Materials and Stores, Spare Parts Consumed and Percentage
1. Raw Material:
Year ended Year ended March 31, 2011 March 31, 2010
% (Rs. million) % (Rs. million)
Imported 7.82% 856.50 13.99% 1,221.76
Indigenous 92.18% 10,098.73 86.01% 7,512.47
Total 100.00% 10,955.23 100.00% 8,734.23
2. Stores and Spares and Dyes and Chemicals:
Year ended Year ended March 31, 2011 March 31, 2010
% (Rs. million) % (Rs. million)
Imported 9.35% 159.96 7.26% 118.32
Indigenous 90.65% 1,550.28 92.74% 1,511.79
Total 100% 1,710.24 100% 1,630.11
e) Value of Imports on CIF Basis:
Year ended Year ended March 31, 2011 March 31, 2010 (Rs. million) (Rs. million)
Raw Materials 802.45 1,801.81
Stores & Spares and Dyes & Chemicals 175.48 143.79
Capital Goods 1,248.16 149.02
Packing Material 13.15 114.26
Others 8.69 -
Total 2,247.93 2,208.88
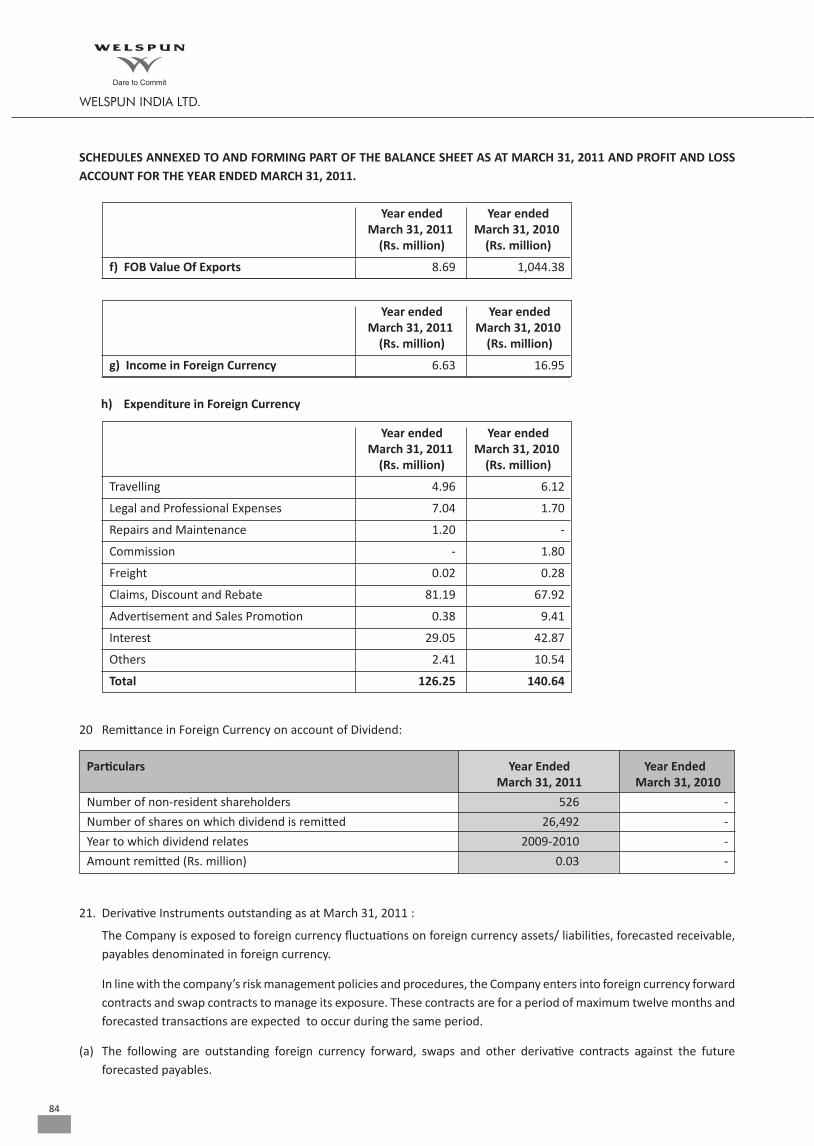
84
Year ended Year ended March 31, 2011 March 31, 2010 (Rs. million) (Rs. million)
f) FOB Value Of Exports 8.69 1,044.38
Year ended Year ended March 31, 2011 March 31, 2010 (Rs. million) (Rs. million)
g) Income in Foreign Currency 6.63 16.95
h) Expenditure in Foreign Currency
Year ended Year ended March 31, 2011 March 31, 2010 (Rs. million) (Rs. million)
Travelling 4.96 6.12
Legal and Professional Expenses 7.04 1.70
Repairs and Maintenance 1.20 -
Commission - 1.80
Freight 0.02 0.28
Claims, Discount and Rebate 81.19 67.92
Advertisement and Sales Promotion 0.38 9.41
Interest 29.05 42.87
Others 2.41 10.54
Total 126.25 140.64
20 Remittance in Foreign Currency on account of Dividend:
Particulars Year Ended Year Ended March 31, 2011 March 31, 2010
Number of non-resident shareholders 526 -
Number of shares on which dividend is remitted 26,492 -
Year to which dividend relates 2009-2010 -
Amount remitted (Rs. million) 0.03 -
21. Derivative Instruments outstanding as at March 31, 2011 :
The Company is exposed to foreign currency fluctuations on foreign currency assets/ liabilities, forecasted receivable, payables denominated in foreign currency.
In line with the company’s risk management policies and procedures, the Company enters into foreign currency forward contracts and swap contracts to manage its exposure. These contracts are for a period of maximum twelve months and forecasted transactions are expected to occur during the same period.
(a) The following are outstanding foreign currency forward, swaps and other derivative contracts against the future forecasted payables.
SCHEDULES ANNEXED TO AND FORMING PART OF THE BALANCE SHEET AS AT MARCH 31, 2011 AND PROFIT AND LOSS ACCOUNT FOR THE YEAR ENDED MARCH 31, 2011.
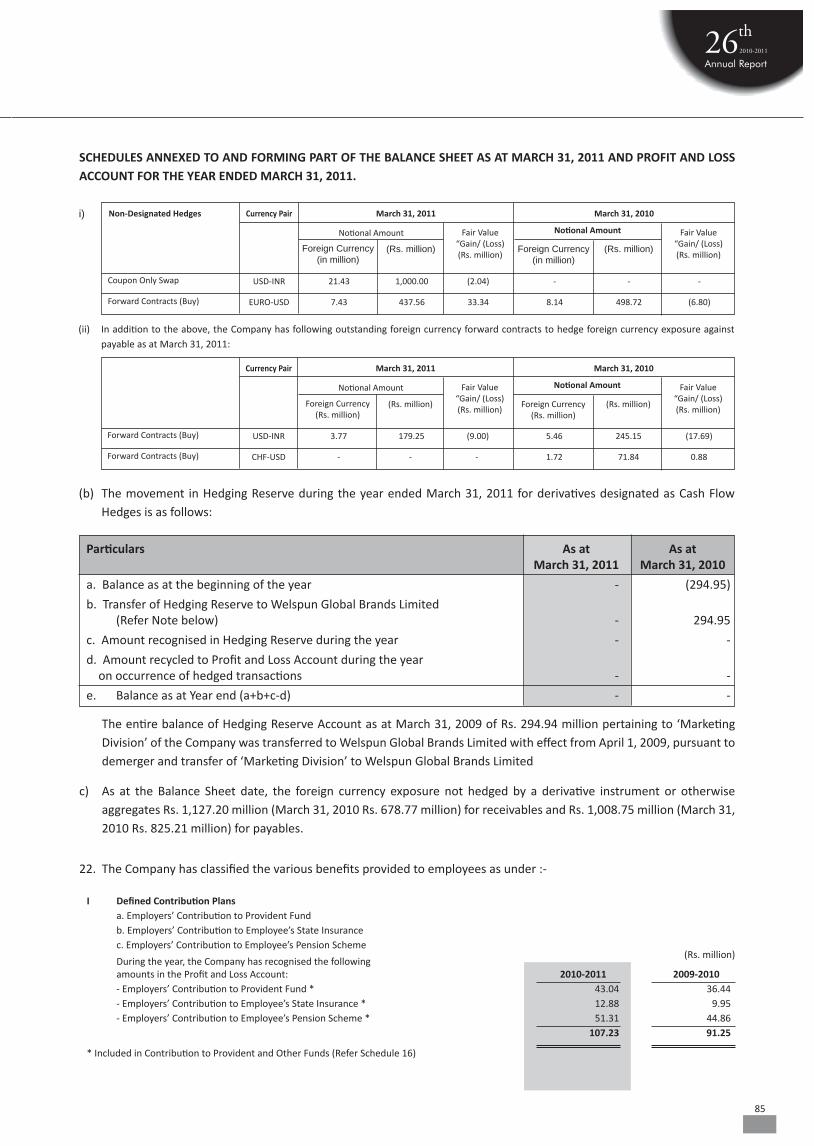
85
i) Non-Designated Hedges Currency Pair March 31, 2011 March 31, 2010
Notional Amount Fair Value “Gain/ (Loss) (Rs. million)
Fair Value “Gain/ (Loss) (Rs. million)
Notional Amount
Foreign Currency (in million)
Foreign Currency (in million)
(Rs. million) (Rs. million)
Coupon Only Swap
Forward Contracts (Buy)
USD-INR
EURO-USD
21.43
7.43
1,000.00
437.56
(2.04)
33.34
-
8.14
-
498.72
-
(6.80)
Currency Pair March 31, 2011 March 31, 2010
Notional Amount Fair Value “Gain/ (Loss) (Rs. million)
Fair Value “Gain/ (Loss) (Rs. million)
Notional Amount
Foreign Currency (Rs. million)
Foreign Currency (Rs. million)
(Rs. million) (Rs. million)
Forward Contracts (Buy)
Forward Contracts (Buy)
USD-INR
CHF-USD
3.77
-
179.25
-
(9.00)
-
5.46
1.72
245.15
71.84
(17.69)
0.88
(ii) In addition to the above, the Company has following outstanding foreign currency forward contracts to hedge foreign currency exposure against payable as at March 31, 2011:
SCHEDULES ANNEXED TO AND FORMING PART OF THE BALANCE SHEET AS AT MARCH 31, 2011 AND PROFIT AND LOSS ACCOUNT FOR THE YEAR ENDED MARCH 31, 2011.
(b) The movement in Hedging Reserve during the year ended March 31, 2011 for derivatives designated as Cash Flow Hedges is as follows:
Particulars As at As at March 31, 2011 March 31, 2010
a. Balance as at the beginning of the year - (294.95)
b. Transfer of Hedging Reserve to Welspun Global Brands Limited (Refer Note below) - 294.95
c. Amount recognised in Hedging Reserve during the year - -
d. Amount recycled to Profit and Loss Account during the year on occurrence of hedged transactions - -
e. Balance as at Year end (a+b+c-d) - -
The entire balance of Hedging Reserve Account as at March 31, 2009 of Rs. 294.94 million pertaining to ‘Marketing Division’ of the Company was transferred to Welspun Global Brands Limited with effect from April 1, 2009, pursuant to demerger and transfer of ‘Marketing Division’ to Welspun Global Brands Limited
c) As at the Balance Sheet date, the foreign currency exposure not hedged by a derivative instrument or otherwise aggregates Rs. 1,127.20 million (March 31, 2010 Rs. 678.77 million) for receivables and Rs. 1,008.75 million (March 31, 2010 Rs. 825.21 million) for payables.
I Defined Contribution Plans a. Employers’ Contribution to Provident Fund b. Employers’ Contribution to Employee’s State Insurance c. Employers’ Contribution to Employee’s Pension Scheme
During the year, the Company has recognised the following amounts in the Profit and Loss Account: 2010-2011 2009-2010 - Employers’ Contribution to Provident Fund * 43.04 36.44 - Employers’ Contribution to Employee’s State Insurance * 12.88 9.95 - Employers’ Contribution to Employee’s Pension Scheme * 51.31 44.86 107.23 91.25
* Included in Contribution to Provident and Other Funds (Refer Schedule 16)
(Rs. million)
22. The Company has classified the various benefits provided to employees as under :-
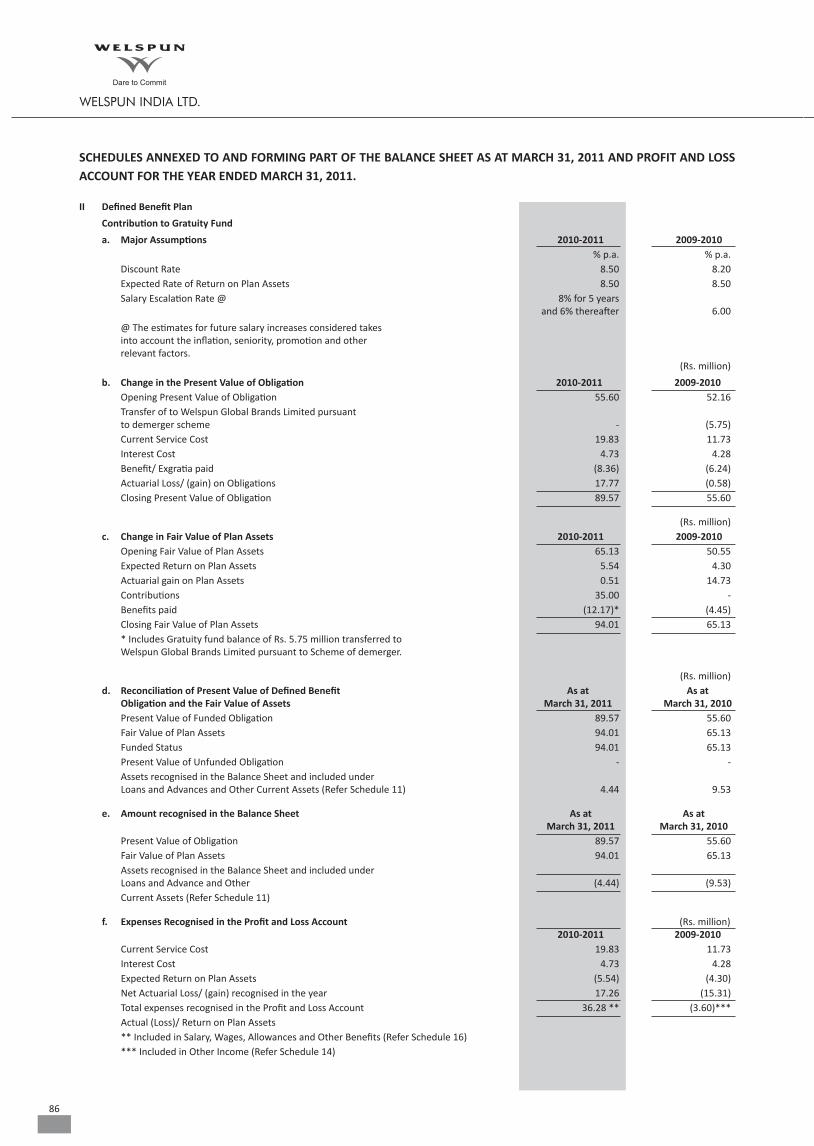
86
II Defined Benefit Plan
Contribution to Gratuity Fund
a. Major Assumptions 2010-2011 2009-2010 % p.a. % p.a. Discount Rate 8.50 8.20 Expected Rate of Return on Plan Assets 8.50 8.50 Salary Escalation Rate @ 8% for 5 years and 6% thereafter 6.00
@ The estimates for future salary increases considered takes into account the inflation, seniority, promotion and other relevant factors. (Rs. million)
b. Change in the Present Value of Obligation 2010-2011 2009-2010 Opening Present Value of Obligation 55.60 52.16 Transfer of to Welspun Global Brands Limited pursuant to demerger scheme - (5.75) Current Service Cost 19.83 11.73 Interest Cost 4.73 4.28 Benefit/ Exgratia paid (8.36) (6.24) Actuarial Loss/ (gain) on Obligations 17.77 (0.58) Closing Present Value of Obligation 89.57 55.60
(Rs. million) c. Change in Fair Value of Plan Assets 2010-2011 2009-2010 Opening Fair Value of Plan Assets 65.13 50.55 Expected Return on Plan Assets 5.54 4.30 Actuarial gain on Plan Assets 0.51 14.73 Contributions 35.00 - Benefits paid (12.17)* (4.45) Closing Fair Value of Plan Assets 94.01 65.13 * Includes Gratuity fund balance of Rs. 5.75 million transferred to Welspun Global Brands Limited pursuant to Scheme of demerger.
(Rs. million) d. Reconciliation of Present Value of Defined Benefit As at As at Obligation and the Fair Value of Assets March 31, 2011 March 31, 2010 Present Value of Funded Obligation 89.57 55.60 Fair Value of Plan Assets 94.01 65.13 Funded Status 94.01 65.13 Present Value of Unfunded Obligation - - Assets recognised in the Balance Sheet and included under Loans and Advances and Other Current Assets (Refer Schedule 11) 4.44 9.53
e. Amount recognised in the Balance Sheet As at As at March 31, 2011 March 31, 2010 Present Value of Obligation 89.57 55.60 Fair Value of Plan Assets 94.01 65.13 Assets recognised in the Balance Sheet and included under Loans and Advance and Other (4.44) (9.53) Current Assets (Refer Schedule 11)
f. Expenses Recognised in the Profit and Loss Account (Rs. million) 2010-2011 2009-2010 Current Service Cost 19.83 11.73 Interest Cost 4.73 4.28 Expected Return on Plan Assets (5.54) (4.30) Net Actuarial Loss/ (gain) recognised in the year 17.26 (15.31) Total expenses recognised in the Profit and Loss Account 36.28 ** (3.60)*** Actual (Loss)/ Return on Plan Assets ** Included in Salary, Wages, Allowances and Other Benefits (Refer Schedule 16) *** Included in Other Income (Refer Schedule 14)
SCHEDULES ANNEXED TO AND FORMING PART OF THE BALANCE SHEET AS AT MARCH 31, 2011 AND PROFIT AND LOSS ACCOUNT FOR THE YEAR ENDED MARCH 31, 2011.
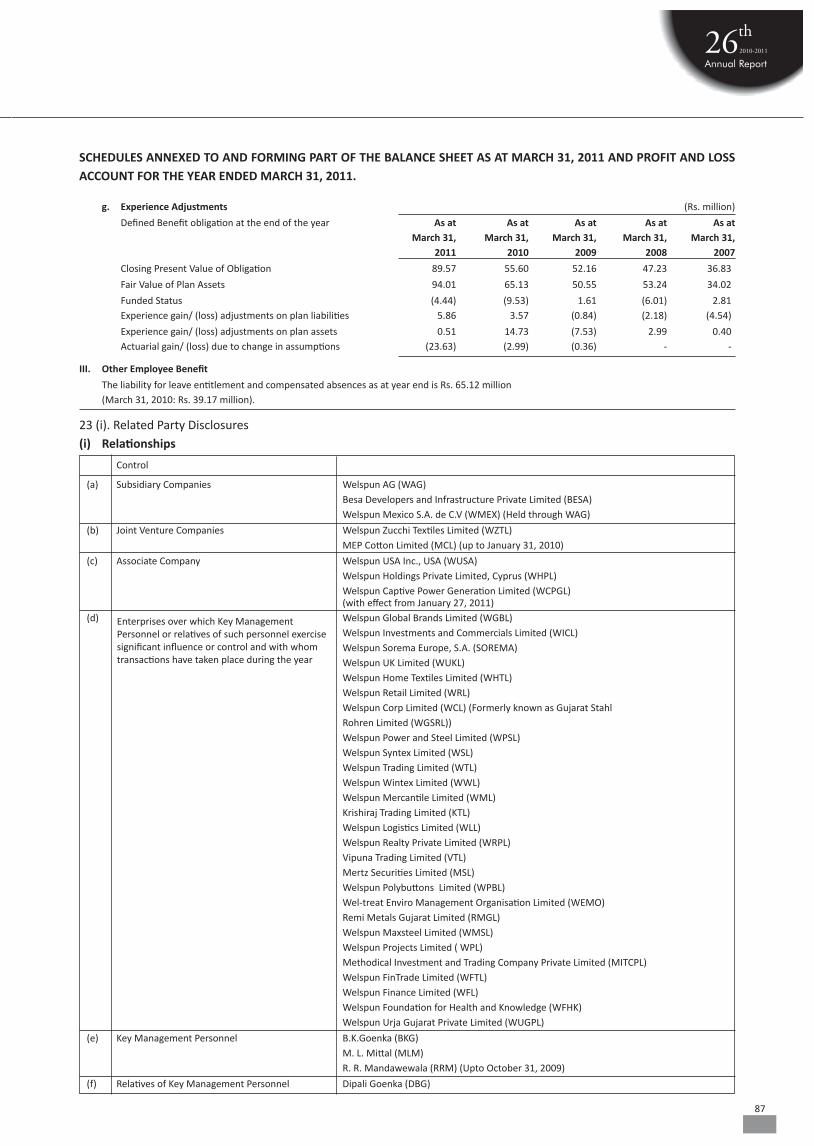
87
g. Experience Adjustments (Rs. million)
Defined Benefit obligation at the end of the year As at As at As at As at As at March 31, March 31, March 31, March 31, March 31, 2011 2010 2009 2008 2007
Closing Present Value of Obligation 89.57 55.60 52.16 47.23 36.83
Fair Value of Plan Assets 94.01 65.13 50.55 53.24 34.02
Funded Status (4.44) (9.53) 1.61 (6.01) 2.81 Experience gain/ (loss) adjustments on plan liabilities 5.86 3.57 (0.84) (2.18) (4.54)
Experience gain/ (loss) adjustments on plan assets 0.51 14.73 (7.53) 2.99 0.40 Actuarial gain/ (loss) due to change in assumptions (23.63) (2.99) (0.36) - -
III. Other Employee Benefit
The liability for leave entitlement and compensated absences as at year end is Rs. 65.12 million (March 31, 2010: Rs. 39.17 million).
SCHEDULES ANNEXED TO AND FORMING PART OF THE BALANCE SHEET AS AT MARCH 31, 2011 AND PROFIT AND LOSS ACCOUNT FOR THE YEAR ENDED MARCH 31, 2011.
Control
(a) Subsidiary Companies Welspun AG (WAG) Besa Developers and Infrastructure Private Limited (BESA) Welspun Mexico S.A. de C.V (WMEX) (Held through WAG)
(b) Joint Venture Companies Welspun Zucchi Textiles Limited (WZTL) MEP Cotton Limited (MCL) (up to January 31, 2010)
(c) Associate Company Welspun USA Inc., USA (WUSA) Welspun Holdings Private Limited, Cyprus (WHPL) Welspun Captive Power Generation Limited (WCPGL) (with effect from January 27, 2011)(d) Welspun Global Brands Limited (WGBL) Welspun Investments and Commercials Limited (WICL) Welspun Sorema Europe, S.A. (SOREMA) Welspun UK Limited (WUKL) Welspun Home Textiles Limited (WHTL) Welspun Retail Limited (WRL) Welspun Corp Limited (WCL) (Formerly known as Gujarat Stahl Rohren Limited (WGSRL)) Welspun Power and Steel Limited (WPSL) Welspun Syntex Limited (WSL) Welspun Trading Limited (WTL) Welspun Wintex Limited (WWL) Welspun Mercantile Limited (WML) Krishiraj Trading Limited (KTL) Welspun Logistics Limited (WLL) Welspun Realty Private Limited (WRPL) Vipuna Trading Limited (VTL) Mertz Securities Limited (MSL) Welspun Polybuttons Limited (WPBL) Wel-treat Enviro Management Organisation Limited (WEMO) Remi Metals Gujarat Limited (RMGL) Welspun Maxsteel Limited (WMSL) Welspun Projects Limited ( WPL) Methodical Investment and Trading Company Private Limited (MITCPL) Welspun FinTrade Limited (WFTL) Welspun Finance Limited (WFL) Welspun Foundation for Health and Knowledge (WFHK) Welspun Urja Gujarat Private Limited (WUGPL)
(e) Key Management Personnel B.K.Goenka (BKG) M. L. Mittal (MLM) R. R. Mandawewala (RRM) (Upto October 31, 2009)
(f) Relatives of Key Management Personnel Dipali Goenka (DBG)
Enterprises over which Key Management Personnel or relatives of such personnel exercise significant influence or control and with whom transactions have taken place during the year
23 (i). Related Party Disclosures(i) Relationships
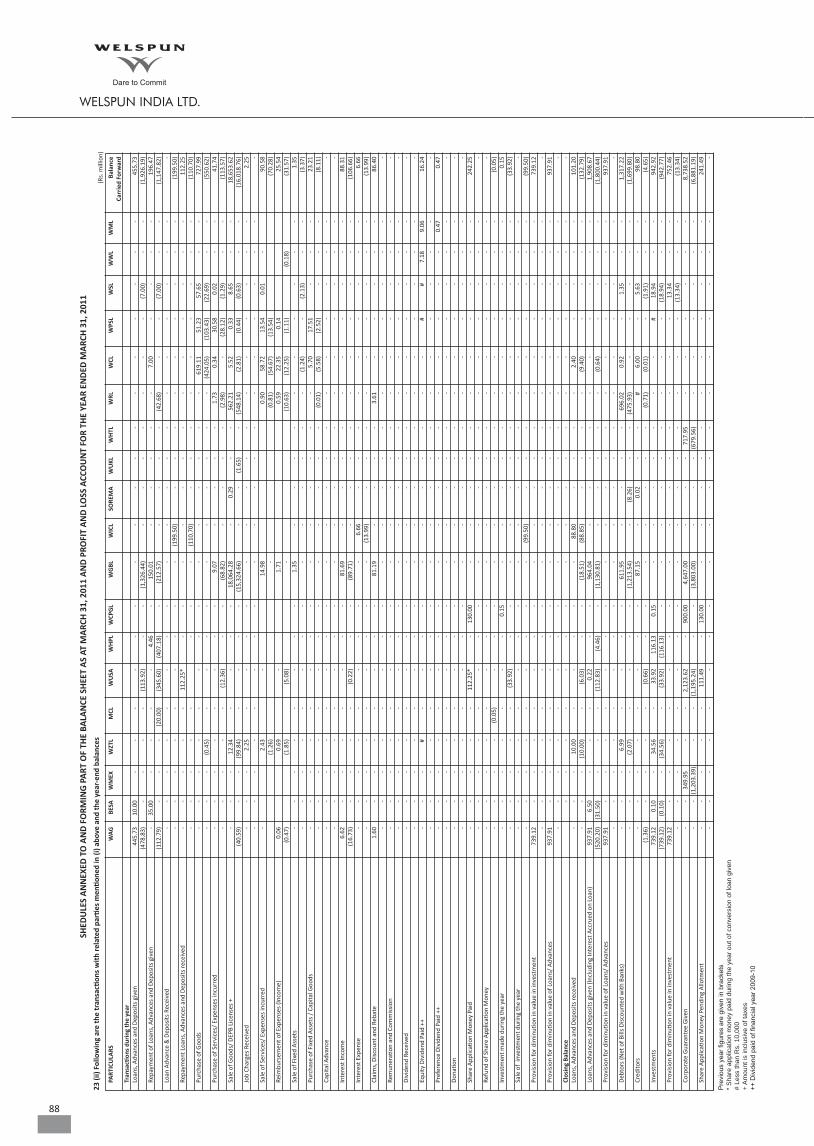
88
SHED
ULE
S A
NN
EXED
TO
AN
D F
ORM
ING
PA
RT O
F TH
E BA
LAN
CE S
HEE
T A
S AT
MA
RCH
31,
201
1 A
ND
PRO
FIT
AN
D L
OSS
ACC
OU
NT
FOR
THE
YEA
R EN
DED
MA
RCH
31,
201
123
(ii)
Follo
win
g ar
e th
e tr
ansa
ction
s w
ith
rela
ted
parti
es m
enti
oned
in (i
) abo
ve a
nd t
he y
ear-
end
bala
nces
PART
ICU
LARS
W
AG
B
ESA
W
MEX
W
ZTL
M
CL
WU
SA
WH
PL
WCP
GL
W
GBL
W
ICL
S
ORE
MA
W
UKL
W
HTL
W
RL
WCL
W
PSL
W
SL
WW
L W
ML
Bala
nce
Ca
rrie
d Fo
rwar
d Tr
ansa
ction
s du
ring
the
year
Loan
s, A
dvan
ces
and
Dep
osits
giv
en
445
.73
1
0.00
-
-
-
-
-
-
-
-
-
-
-
-
-
-
-
-
-
4
55.7
3
(478
.83)
-
-
-
-
(1
13.9
2)
-
-
(1,3
26.4
4)
-
-
-
-
-
-
-
(7.0
0)
-
-
(1,9
26.1
9)Re
paym
ent o
f Loa
ns, A
dvan
ces
and
Dep
osits
giv
en
-
35.
00
-
-
-
-
4.4
6
-
150
.01
-
-
-
-
-
7
.00
-
-
-
-
1
96.4
7
(112
.79)
-
-
-
(2
0.00
) (3
45.6
0)
(407
.18)
-
(2
12.5
7)
-
-
-
-
(42.
68)
-
-
(7.0
0)
-
-
(1,1
47.8
2)Lo
an A
dvan
ce &
Dep
osits
Rec
eive
d -
-
-
-
-
-
-
-
-
-
-
-
-
-
-
-
-
-
-
-
-
-
-
-
-
-
-
-
-
(199
.50)
-
-
-
-
-
-
-
-
-
(1
99.5
0)Re
paym
ent L
oans
, Adv
ance
s an
d D
epos
its re
ceiv
ed
-
-
-
-
-
112
.25*
-
-
-
-
-
-
-
-
-
-
-
-
-
1
12.2
5
-
-
-
-
-
-
-
-
(1
10.7
0)
-
-
-
-
-
-
-
-
-
(110
.70)
Purc
hase
of G
oods
-
-
-
-
-
-
-
-
-
-
-
-
-
-
6
19.1
1
51.
23
57.
65
-
-
727
.99
-
-
-
(0
.45)
-
-
-
-
-
-
-
-
-
-
(4
24.0
5)
(103
.43)
(2
2.69
) -
-
(5
50.6
2)Pu
rcha
se o
f Ser
vice
s/ E
xpen
ses
incu
rred
-
-
-
-
-
-
-
-
9
.07
-
-
-
-
1
.73
0
.34
3
0.58
0
.02
-
-
4
1.74
-
-
-
-
-
(12.
36)
-
-
(68.
82)
-
-
-
-
(2.9
8)
-
(28.
12)
(1.2
9)
-
-
(113
.57)
Sale
of G
oods
/ D
EPB
Lice
nses
+
-
-
-
12.
34
-
-
-
-
18,
064.
28
-
0.2
9
-
-
562
.21
5
.52
0
.33
8
.65
-
-
1
8,65
3.62
(40.
59)
-
-
(99.
84)
-
-
-
-
(15,
324.
66)
-
-
(1.6
5)
-
(548
.14)
(2
.81)
(0
.44)
(0
.63)
-
-
(1
6,01
8.76
)Jo
b Ch
arge
s Re
ceiv
ed
-
-
-
2.2
5
-
-
-
-
-
-
-
-
-
-
-
-
-
-
-
2.2
5
-
-
-
-
-
-
-
-
-
-
-
-
-
-
-
-
-
-
-
-
Sale
of S
ervi
ces/
Exp
ense
s in
curr
ed
-
2.4
3
-
1
4.98
0
.90
5
8.72
1
3.54
0
.01
-
90.
58
(1.2
6)
-
(0.8
1)
(54.
67)
(13.
54)
(7
0.28
)Re
imbu
rsem
ent o
f Exp
ense
s (In
com
e)
0.0
6
0.6
9
-
1
.71
0
.59
2
2.35
0
.14
25.
54
(0
.47)
(1
.85)
(5.0
8)
-
(10.
63)
(12.
25)
(1.1
1)
(0
.18)
(31.
57)
Sale
of F
ixed
Ass
ets
-
-
-
-
-
-
-
-
1.3
5
-
-
-
-
-
-
-
-
-
-
1.3
5
-
-
-
-
-
-
-
-
-
-
-
-
-
-
(1.2
4)
-
(2.1
3)
-
-
(3.3
7)Pu
rcha
se o
f Fix
ed A
sset
s /
Capi
tal G
oods
-
-
-
-
-
-
-
-
-
-
-
-
-
-
5
.70
1
7.51
-
-
-
2
3.21
-
-
-
-
-
-
-
-
-
-
-
-
-
(0.0
1)
(5.5
8)
(2.5
2)
-
-
-
(8.1
1)Ca
pita
l Adv
ance
-
-
-
-
-
-
-
-
-
-
-
-
-
-
-
-
-
-
-
-
-
-
-
-
-
-
-
-
-
-
-
-
-
-
-
-
-
-
-
-
Inte
rest
Inco
me
6.6
2
-
-
-
-
-
-
-
81.
69
-
-
-
-
-
-
-
-
-
-
88.
31
(1
6.73
) -
-
-
-
(0
.22)
-
-
(8
9.71
) -
-
-
-
-
-
-
-
-
-
(1
06.6
6)In
tere
st E
xpen
se
-
-
-
-
-
-
-
-
-
6.6
6
-
-
-
-
-
-
-
-
-
6.6
6
-
-
-
-
-
-
-
-
-
(13.
99)
-
-
-
-
-
-
-
-
-
(13.
99)
Clai
ms,
Dis
coun
t and
Reb
ate
1.6
0
-
-
-
-
-
-
-
81.
19
-
-
-
-
3.6
1
-
-
-
-
-
86.
40
-
-
-
-
-
-
-
-
-
-
-
-
-
-
-
-
-
-
-
-
Re
mun
erati
on a
nd C
omm
issi
on
-
-
-
-
-
-
-
-
-
-
-
-
-
-
-
-
-
-
-
-
-
-
-
-
-
-
-
-
-
-
-
-
-
-
-
-
-
-
-
-
D
ivid
end
Rece
ived
-
-
-
-
-
-
-
-
-
-
-
-
-
-
-
-
-
-
-
-
-
-
-
-
-
-
-
-
-
-
-
-
-
-
-
-
-
-
-
-
Equi
ty D
ivid
end
Paid
++
-
-
-
#
-
-
-
-
-
-
-
-
-
-
-
#
#
7.1
8
9.0
6
16.
24
-
-
-
-
-
-
-
-
-
-
-
-
-
-
-
-
-
-
-
-
Pr
efer
ence
Div
iden
d Pa
id +
+ -
-
-
-
-
-
-
-
-
-
-
-
-
-
-
-
-
-
0
.47
0
.47
-
-
-
-
-
-
-
-
-
-
-
-
-
-
-
-
-
-
-
-
D
onati
on
-
-
-
-
-
-
-
-
-
-
-
-
-
-
-
-
-
-
-
-
-
-
-
-
-
-
-
-
-
-
-
-
-
-
-
-
-
-
-
-
Sh
are
App
licati
on M
oney
Pai
d
-
-
-
-
-
112
.25*
-
1
30.0
0
-
-
-
-
-
-
-
-
-
-
-
242
.25
-
-
-
-
-
-
-
-
-
-
-
-
-
-
-
-
-
-
-
-
Re
fund
of S
hare
App
licati
on M
oney
-
-
-
-
-
-
-
-
-
-
-
-
-
-
-
-
-
-
-
-
-
-
-
-
(0.0
5)
-
-
-
-
-
-
-
-
-
-
-
-
-
-
(0.0
5)In
vest
men
t mad
e du
ring
the
year
-
-
-
-
-
-
-
0
.15
-
-
-
-
-
-
-
-
-
-
-
0
.15
-
-
-
-
-
(3
3.92
) -
-
-
-
-
-
-
-
-
-
-
-
-
(3
3.92
)Sa
le o
f in
vest
men
t dur
ing
the
year
-
-
-
-
-
-
-
-
-
-
-
-
-
-
-
-
-
-
-
-
-
-
-
-
-
-
-
-
-
(99.
50)
-
-
-
-
-
-
-
-
-
(99.
50)
Prov
isio
n fo
r di
min
ution
in v
alue
in in
vest
men
t 7
39.1
2
-
-
-
-
-
-
-
-
-
-
-
-
-
-
-
-
-
-
739
.12
-
-
-
-
-
-
-
-
-
-
-
-
-
-
-
-
-
-
-
-
Pr
ovis
ion
for
dim
inuti
on in
val
ue o
f Loa
ns/
Adv
ance
s
937
.91
-
-
-
-
-
-
-
-
-
-
-
-
-
-
-
-
-
-
9
37.9
1
-
-
-
-
-
-
-
-
-
-
-
-
-
-
-
-
-
-
-
-
Clos
ing
Bala
nce
-
-
-
-
-
-
-
-
-
-
-
-
-
-
-
-
-
-
-
Lo
ans,
Adv
ance
s an
d D
epos
its re
ceiv
ed
-
-
-
10.
00
-
-
-
-
-
88.
80
-
-
-
-
2.4
0
-
-
-
-
101
.20
-
-
-
(1
0.00
) -
(6
.03)
-
-
(1
8.51
) (8
8.85
) -
-
-
-
(9
.40)
-
-
-
-
(1
32.7
9)Lo
ans,
Adv
ance
s an
d D
epos
its g
iven
(Inc
ludi
ng In
tere
st A
ccru
ed o
n Lo
an)
937
.91
6
.50
-
-
-
0
.22
-
-
9
64.0
4
-
-
-
-
-
-
-
-
-
-
1,9
08.6
7
(520
.20)
(3
1.50
) -
-
-
(1
12.8
3)
(4.4
6)
-
(1,1
30.8
1)
-
-
-
-
-
(0.6
4)
-
-
-
-
(1,8
00.4
4)Pr
ovis
ion
for
dim
inuti
on in
val
ue o
f Loa
ns/
Adv
ance
s
937
.91
-
-
-
-
-
-
-
-
-
-
-
-
-
-
-
-
-
-
9
37.9
1
-
-
-
-
-
-
-
-
-
-
-
-
-
-
-
-
-
-
-
-
Deb
tors
(Net
of B
ills
Dis
coun
ted
with
Ban
ks)
-
-
-
6.9
9
-
-
-
-
611
.95
-
-
-
-
6
96.0
2
0.9
2
-
1.3
5
-
-
1,3
17.2
2
-
-
-
(2.0
7)
-
-
-
-
(1,2
13.5
4)
-
(8.2
6)
-
-
(475
.93)
-
-
-
-
-
(1
,699
.80)
Cred
itors
-
-
-
-
-
-
-
-
8
7.15
-
0
.02
-
-
#
6
.00
-
5
.63
-
-
9
8.80
(1.3
6)
-
-
-
-
(0.6
6)
-
-
-
-
-
-
-
(0.7
1)
(0.0
1)
-
(1.9
1)
-
-
(4.6
5)In
vest
men
ts
739
.12
0
.10
-
3
4.56
-
3
3.92
1
16.1
3
0.1
5
-
-
-
-
-
-
-
#
18.
94
-
-
942
.92
(7
39.1
2)
(0.1
0)
-
(34.
56)
-
(33.
92)
(116
.13)
-
-
-
-
-
-
-
-
-
(1
8.94
) -
-
(9
42.7
7)Pr
ovis
ion
for
dim
inuti
on in
val
ue in
inve
stm
ent
739
.12
-
-
-
-
-
-
-
-
-
-
-
-
-
-
-
1
3.34
-
-
7
52.4
6
-
-
-
-
-
-
-
-
-
-
-
-
-
-
-
-
(13.
34)
-
-
(13.
34)
Corp
orat
e G
uara
ntee
Giv
en
-
-
349
.95
-
-
2
,123
.62
-
9
00.0
0
4,6
47.0
0
-
-
-
717
.95
-
-
-
-
-
-
8
,738
.52
-
-
(1
,203
.39)
-
-
(1
,195
.24)
-
-
(3
,803
.00)
-
-
-
(6
79.5
6)
-
-
-
-
-
-
(6,8
81.1
9)Sh
are
App
licati
on M
oney
Pen
ding
Allo
tmen
t -
-
-
-
-
1
11.4
9
-
130
.00
-
-
-
-
-
-
-
-
-
-
-
2
41.4
9
-
-
-
-
-
-
-
-
-
-
-
-
-
-
-
-
-
-
-
-
Pre
viou
s ye
ar fi
gure
s ar
e gi
ven
in b
rack
ets
*
Sha
re a
pplic
atio
n m
oney
pai
d du
ring
the
year
out
of c
onve
rsio
n of
loan
giv
en
# Le
ss th
an R
s. 1
0,00
0
+ A
mou
nt is
incl
usiv
e of
taxe
s
++ D
ivid
end
paid
of fi
nanc
ial y
ear 2
009-
10
(Rs.
mill
ion)
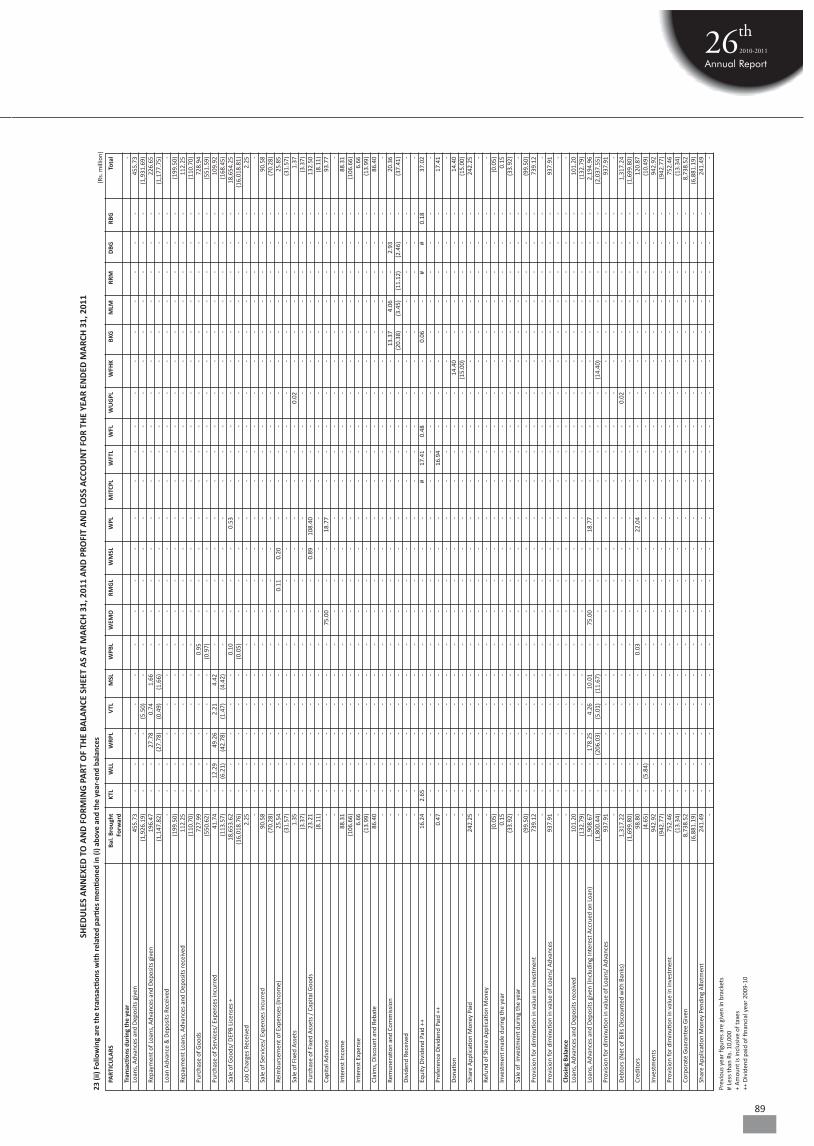
89
SHED
ULE
S A
NN
EXED
TO
AN
D F
ORM
ING
PA
RT O
F TH
E BA
LAN
CE S
HEE
T A
S AT
MA
RCH
31,
201
1 A
ND
PRO
FIT
AN
D L
OSS
ACC
OU
NT
FOR
THE
YEA
R EN
DED
MA
RCH
31,
201
123
(ii)
Follo
win
g ar
e th
e tr
ansa
ction
s w
ith
rela
ted
parti
es m
enti
oned
in (i
) abo
ve a
nd t
he y
ear-
end
bala
nces
PART
ICU
LARS
Ba
l. Br
ough
t KT
L W
LL
WRP
L
VTL
M
SL
WPB
L
WEM
O
RM
GL
W
MSL
W
PL
MIT
CPL
WFT
L W
FL
WU
GPL
W
FHK
B
KG
MLM
R
RM
DBG
RB
G
Tota
l
Forw
ard
Tran
sacti
ons
duri
ng th
e ye
ar
-
Lo
ans,
Adv
ance
s an
d D
epos
its g
iven
4
55.7
3
-
-
-
-
-
-
-
-
-
-
-
-
-
-
-
-
-
-
-
-
455
.73
(1
,926
.19)
-
-
-
(5
.50)
-
-
-
-
-
-
-
-
-
-
-
-
-
-
-
-
(1
,931
.69)
Repa
ymen
t of L
oans
, Adv
ance
s an
d D
epos
its g
iven
1
96.4
7
-
-
27.
78
0.7
4
1.6
6
-
-
-
-
-
-
-
-
-
-
-
-
-
-
-
226
.65
(1
,147
.82)
-
-
(2
7.78
) (0
.49)
(1
.66)
-
-
-
-
-
-
-
-
-
-
-
-
-
-
-
(1
,177
.75)
Loan
Adv
ance
& D
epos
its R
ecei
ved
-
-
-
-
-
-
-
-
-
-
-
-
-
-
-
-
-
-
-
-
-
-
(1
99.5
0)
-
-
-
-
-
-
-
-
-
-
-
-
-
-
-
-
-
-
-
-
(199
.50)
Repa
ymen
t Loa
ns, A
dvan
ces
and
Dep
osits
rece
ived
1
12.2
5
-
-
-
-
-
-
-
-
-
-
-
-
-
-
-
-
-
-
-
-
112
.25
(1
10.7
0)
-
-
-
-
-
-
-
-
-
-
-
-
-
-
-
-
-
-
-
-
(110
.70)
Purc
hase
of G
oods
7
27.9
9
-
-
-
-
-
0.9
5
-
-
-
-
-
-
-
-
-
-
-
-
-
-
728
.94
(5
50.6
2)
-
-
-
-
-
(0.9
7)
-
-
-
-
-
-
-
-
-
-
-
-
-
-
(551
.59)
Purc
hase
of S
ervi
ces/
Exp
ense
s in
curr
ed
41.
74
-
12.
29
49.
26
2.2
1
4.4
2
-
-
-
-
-
-
-
-
-
-
-
-
-
-
-
109
.92
(1
13.5
7)
-
(6.2
1)
(42.
78)
(1.4
7)
(4.4
2)
-
-
-
-
-
-
-
-
-
-
-
-
-
-
-
(168
.45)
Sale
of G
oods
/ D
EPB
Lice
nses
+
18,
653.
62
-
-
-
-
-
0.1
0
-
-
-
0.5
3
-
-
-
-
-
-
-
-
-
-
18,
654.
25
(1
6,01
8.76
) -
-
-
-
-
(0
.05)
-
-
-
-
-
-
-
-
-
-
-
-
-
-
(1
6,01
8.81
)Jo
b Ch
arge
s Re
ceiv
ed
2.2
5
-
-
-
-
-
-
-
-
-
-
-
-
-
-
-
-
-
-
-
-
2.2
5
-
-
-
-
-
-
-
-
-
-
-
-
-
-
-
-
-
-
-
-
-
-
Sale
of S
ervi
ces/
Exp
ense
s in
curr
ed
90.
58
- -
- -
- -
- -
-
- -
- -
- -
- -
- -
- 9
0.58
(70.
28)
- -
- -
- -
- -
-
- -
- -
- -
- -
- -
- (7
0.28
)Re
imbu
rsem
ent o
f Exp
ense
s (In
com
e)
25.
54
- -
- -
- -
- 0
.11
0
.20
-
-
- -
- -
- -
- -
- 2
5.85
(31.
57)
- -
- -
- -
- -
-
- -
- -
- -
- -
- -
- (3
1.57
)Sa
le o
f Fix
ed A
sset
s 1
.35
-
-
-
-
-
-
-
-
-
-
-
-
-
0
.02
-
-
-
-
-
-
1
.37
(3
.37)
-
-
-
-
-
-
-
-
-
-
-
-
-
-
-
-
-
-
-
-
(3
.37)
Purc
hase
of F
ixed
Ass
ets
/ Ca
pita
l Goo
ds
23.
21
-
-
-
-
-
-
-
-
0.8
9
108
.40
-
-
-
-
-
-
-
-
-
-
1
32.5
0
(8.1
1)
-
-
-
-
-
-
-
-
-
-
-
-
-
-
-
-
-
-
-
-
(8.1
1)Ca
pita
l Adv
ance
-
-
-
-
-
-
-
7
5.00
-
-
1
8.77
-
-
-
-
-
-
-
-
-
-
9
3.77
-
-
-
-
-
-
-
-
-
-
-
-
-
-
-
-
-
-
-
-
-
-
Inte
rest
Inco
me
88.
31
-
-
-
-
-
-
-
-
-
-
-
-
-
-
-
-
-
-
-
-
88.
31
(1
06.6
6)
-
-
-
-
-
-
-
-
-
-
-
-
-
-
-
-
-
-
-
-
(106
.66)
Inte
rest
Exp
ense
6
.66
-
-
-
-
-
-
-
-
-
-
-
-
-
-
-
-
-
-
-
-
6
.66
(1
3.99
) -
-
-
-
-
-
-
-
-
-
-
-
-
-
-
-
-
-
-
-
(1
3.99
)Cl
aim
s, D
isco
unt a
nd R
ebat
e 8
6.40
-
-
-
-
-
-
-
-
-
-
-
-
-
-
-
-
-
-
-
-
8
6.40
-
-
-
-
-
-
-
-
-
-
-
-
-
-
-
-
-
-
-
-
-
-
Rem
uner
ation
and
Com
mis
sion
-
-
-
-
-
-
-
-
-
-
-
-
-
-
-
-
1
3.37
4
.06
-
2
.93
-
2
0.36
-
-
-
-
-
-
-
-
-
-
-
-
-
-
-
-
(20.
38)
(3.4
5)
(11.
12)
(2.4
6)
-
(37.
41)
Div
iden
d Re
ceiv
ed
-
-
-
-
-
-
-
-
-
-
-
-
-
-
-
-
-
-
-
-
-
-
-
-
-
-
-
-
-
-
-
-
-
-
-
-
-
-
-
-
-
-
-
-
Eq
uity
Div
iden
d Pa
id +
+ 1
6.24
2
.65
-
-
-
-
-
-
-
-
-
#
1
7.41
0
.48
-
-
0
.06
-
#
#
0
.18
3
7.02
-
-
-
-
-
-
-
-
-
-
-
-
-
-
-
-
-
-
-
-
-
-
Pref
eren
ce D
ivid
end
Paid
++
0.4
7
-
-
-
-
-
-
-
-
-
-
-
16.
94
-
-
-
-
-
-
-
-
17.
41
-
-
-
-
-
-
-
-
-
-
-
-
-
-
-
-
-
-
-
-
-
-
D
onati
on
-
-
-
-
-
-
-
-
-
-
-
-
-
-
-
14.
40
-
-
-
-
-
14.
40
-
-
-
-
-
-
-
-
-
-
-
-
-
-
-
(1
5.00
) -
-
-
-
-
(1
5.00
)Sh
are
App
licati
on M
oney
Pai
d
242
.25
-
-
-
-
-
-
-
-
-
-
-
-
-
-
-
-
-
-
-
-
2
42.2
5
-
-
-
-
-
-
-
-
-
-
-
-
-
-
-
-
-
-
-
-
-
-
Refu
nd o
f Sha
re A
pplic
ation
Mon
ey
-
-
-
-
-
-
-
-
-
-
-
-
-
-
-
-
-
-
-
-
-
-
(0
.05)
-
-
-
-
-
-
-
-
-
-
-
-
-
-
-
-
-
-
-
-
(0
.05)
Inve
stm
ent m
ade
duri
ng th
e ye
ar
0.1
5
-
-
-
-
-
-
-
-
-
-
-
-
-
-
-
-
-
-
-
-
0.1
5
(33.
92)
-
-
-
-
-
-
-
-
-
-
-
-
-
-
-
-
-
-
-
-
(33.
92)
Sale
of
inve
stm
ent d
urin
g th
e ye
ar
-
-
-
-
-
-
-
-
-
-
-
-
-
-
-
-
-
-
-
-
-
-
(9
9.50
) -
-
-
-
-
-
-
-
-
-
-
-
-
-
-
-
-
-
-
-
(9
9.50
)Pr
ovis
ion
for
dim
inuti
on in
val
ue in
inve
stm
ent
739
.12
-
-
-
-
-
-
-
-
-
-
-
-
-
-
-
-
-
-
-
-
7
39.1
2
-
-
-
-
-
-
-
-
-
-
-
-
-
-
-
-
-
-
-
-
-
-
Prov
isio
n fo
r di
min
ution
in v
alue
of L
oans
/ A
dvan
ces
9
37.9
1
-
-
-
-
-
-
-
-
-
-
-
-
-
-
-
-
-
-
-
-
937
.91
-
-
-
-
-
-
-
-
-
-
-
-
-
-
-
-
-
-
-
-
-
-
Cl
osin
g Ba
lanc
e -
-
-
-
-
-
-
-
-
-
-
-
-
-
-
-
-
-
-
-
-
-
Lo
ans,
Adv
ance
s an
d D
epos
its re
ceiv
ed
101
.20
-
-
-
-
-
-
-
-
-
-
-
-
-
-
-
-
-
-
-
-
1
01.2
0
(132
.79)
-
-
-
-
-
-
-
-
-
-
-
-
-
-
-
-
-
-
-
-
(1
32.7
9)Lo
ans,
Adv
ance
s an
d D
epos
its g
iven
(Inc
ludi
ng In
tere
st A
ccru
ed o
n Lo
an)
1,9
08.6
7
-
-
178
.25
4
.26
1
0.01
-
7
5.00
-
-
1
8.77
-
-
-
-
-
-
-
-
-
-
2
,194
.96
(1
,800
.44)
-
-
(2
06.0
3)
(5.0
1)
(11.
67)
-
-
-
-
-
-
-
-
-
(14.
40)
-
-
-
-
-
(2,0
37.5
5)Pr
ovis
ion
for
dim
inuti
on in
val
ue o
f Loa
ns/
Adv
ance
s
937
.91
-
-
-
-
-
-
-
-
-
-
-
-
-
-
-
-
-
-
-
-
9
37.9
1
-
-
-
-
-
-
-
-
-
-
-
-
-
-
-
-
-
-
-
-
-
-
Deb
tors
(Net
of B
ills
Dis
coun
ted
with
Ban
ks)
1,3
17.2
2
-
-
-
-
-
-
-
-
-
-
-
-
-
0.0
2
-
-
-
-
-
-
1,3
17.2
4
(1,6
99.8
0)
-
-
-
-
-
-
-
-
-
-
-
-
-
-
-
-
-
-
-
-
(1,6
99.8
0)Cr
edito
rs
98.
80
-
-
-
-
-
0.0
3
-
-
-
22.
04
-
-
-
-
-
-
-
-
-
-
120
.87
(4
.65)
-
(5
.84)
-
-
-
-
-
-
-
-
-
-
-
-
-
-
-
-
-
-
(1
0.49
)In
vest
men
ts
942
.92
-
-
-
-
-
-
-
-
-
-
-
-
-
-
-
-
-
-
-
-
9
42.9
2
(942
.77)
-
-
-
-
-
-
-
-
-
-
-
-
-
-
-
-
-
-
-
-
(9
42.7
7)Pr
ovis
ion
for
dim
inuti
on in
val
ue in
inve
stm
ent
752
.46
-
-
-
-
-
-
-
-
-
-
-
-
-
-
-
-
-
-
-
-
7
52.4
6
(13.
34)
-
-
-
-
-
-
-
-
-
-
-
-
-
-
-
-
-
-
-
-
(13.
34)
Corp
orat
e G
uara
ntee
Giv
en
8,7
38.5
2
-
-
-
-
-
-
-
-
-
-
-
-
-
-
-
-
-
-
-
-
8,7
38.5
2
(6,8
81.1
9)
-
-
-
-
-
-
-
-
-
-
-
-
-
-
-
-
-
-
-
-
(6,8
81.1
9)Sh
are
App
licati
on M
oney
Pen
ding
Allo
tmen
t 2
41.4
9
-
-
-
-
-
-
-
-
-
-
-
-
-
-
-
-
-
-
-
-
241
.49
-
-
-
-
-
-
-
-
-
-
-
-
-
-
-
-
-
-
-
-
-
-
Prev
ious
yea
r fig
ures
are
giv
en in
bra
cket
s#
Less
than
Rs.
10,
000
+ A
mou
nt is
incl
usiv
e of
taxe
s++
Div
iden
d pa
id o
f fina
ncia
l yea
r 20
09-1
0
(Rs.
mill
ion)

90
24. In accordance with the Company’s policy given in Note 1(x) (a) above, net exchange loss of Rs. 42.64 million (Previous Year: net exchange gain Rs. 104.29 million) has been accounted in the Profit and Loss Account.
25. Segment Information for the year ended March 31, 2011.
(i) Information about Primary Business Segment
The Company is exclusively engaged in the business of Home Textiles which, in the context of Accounting Standard 17 on Segment Reporting, issued by the Institute of Chartered Accountants of India, is considered to constitute a single primary segment. Thus, the segment revenue, carrying amount of segment assets and capital expenditure incurred to acquire segment assets during the year are all as reflected in the financial statements for the year ended March 31, 2011 and as on that date.
(ii) Information about Secondary Geographical Segments
India Outside India Total
March March March March March March 31, 2011 31, 2010 31, 2011 31, 2010 31, 2011 31, 2010
Revenue 19,896.80 16,963.30 10.82 1,272.11 19,907.62 18,235.41
Carrying Amount of Segment Assets 27,810.78 24,701.28 450.83 1,679.47 28,261.61 26,380.75
Capital Expenditure incurred to acquire segment assets 2,100.22 725.97 - - 2,100.22 725.97
(iii) Notes:
(a) The Segment revenue in the geographical segments considered for disclosure are as follows:
- Revenue within India includes sales to customers located within India and earnings in India.
- Revenue outside India includes sales to customers located outside India, earnings outside India and export benefits on sales made to customers located outside India.
(b) Segment revenue and assets include the respective amounts identified to each of the segments and amounts allocated on a reasonable basis.
26. Leases
A. Where the Company is a lessor:
Operating Lease
The Company has given certain buildings and plant and machinery on operating lease, details of which are as under:
Particulars March 31, 2011 March 31, 2010
Buildings
Gross Block 13.89 10.25
Accumulated Depreciation 2.99 1.98
Depreciation recognised in the Profit and Loss Account for the year 0.23 0.16
Plant and Machinery
Gross Block 42.49 42.49
Accumulated Depreciation 32.60 31.89
Depreciation recognised in the Profit and Loss Account for the year 0.71 1.26
(Rs. million)
SCHEDULES ANNEXED TO AND FORMING PART OF THE BALANCE SHEET AS AT MARCH 31, 2011 AND PROFIT AND LOSS ACCOUNT FOR THE YEAR ENDED MARCH 31, 2011.
(Rs. million)

91
SCHEDULES ANNEXED TO AND FORMING PART OF THE BALANCE SHEET AS AT MARCH 31, 2011 AND PROFIT AND LOSS ACCOUNT FOR THE YEAR ENDED MARCH 31, 2011.
B. Where the Company is a lessee:
Operating Lease
The Company has taken various residential, office premises, godowns, equipment and vehicles under operating lease agreements that are renewable on a periodic basis at the option of both the lessor and the lessee. The initial tenure of lease is generally for eleven months to sixty months.
The aggregate rental expenses of all the operating leases for the year are Rs. 94.32 million (Previous Year: Rs. 84.13 million).
27. Earnings/ (Loss) per Share
Particulars Year Ended Year Ended March 31, 2011 March 31, 2010
Profit after Tax and before extraordinary item (A) (Rs. in million) 679.19 1,150.06
Less: Extraordinary items (1,677.03) -
Profit/ (Loss) after tax and extraordinary items (B) (Rs. in million) (997.84) 1,150.06
Weighted average number of equity shares outstanding during the year (C) 88,043,039 73,089,519
Add: Weighted average outstanding employee stock options 571,829 -
Number of Shares for Diluted Earnings Per Share (D) 88,614,868 73,089,519
Basic earnings per share before extraordinary items (A)/(C) 7.71 15.73
Basic earnings/ (loss) per share after extraordinary items (B)/(C) (11.33) 15.73
Diluted earnings per share before extraordinary items (A)/(D) 7.67 15.73
Diluted earnings/ (loss) per share after extraordinary items (B)/(D) (11.33)* 15.73
Nominal value of an equity share (Rs.) 10 10
(Rs. million)
* Anti dilutive earning per share
28. As required by the Clause 32 of the listing agreement, the following disclosure is made:
March 31, 2011 March 31, 2010 Balance Maximum Balance Maximum
as at amount as at amount March 31, outstanding March 31, outstanding 2011 during the 2010 during the year ended year ended March 31, March 31, 2011 2010
i. Loans and advances in the nature of loans to subsidiary, (excluding interest accrued)
- Welspun AG 936.23* 936.23 476.57 596.17
- Besa Developers and Infrastructure Private Limited 6.50 41.50 31.50 31.50
ii. Loans and advances in the nature of loans to associates
- Welspun USA Inc. - 112.25 112.25 113.92
iii. Loans and advances in the nature of loans where there is no repayment schedule, or interest below rate specified as per Section 372A of the Act. - - - -
iv. Loans and advances in the nature of loans to firms/ companies in which directors are interested - - - -
v. Investments by the Loanee in the shares of the Company as at March 31, 2011 - - - -
* Provision for doubtful loans and advance of Rs. 936.23 million (March 31, 2010: Rs. Nil) has been made.
(Rs. million)
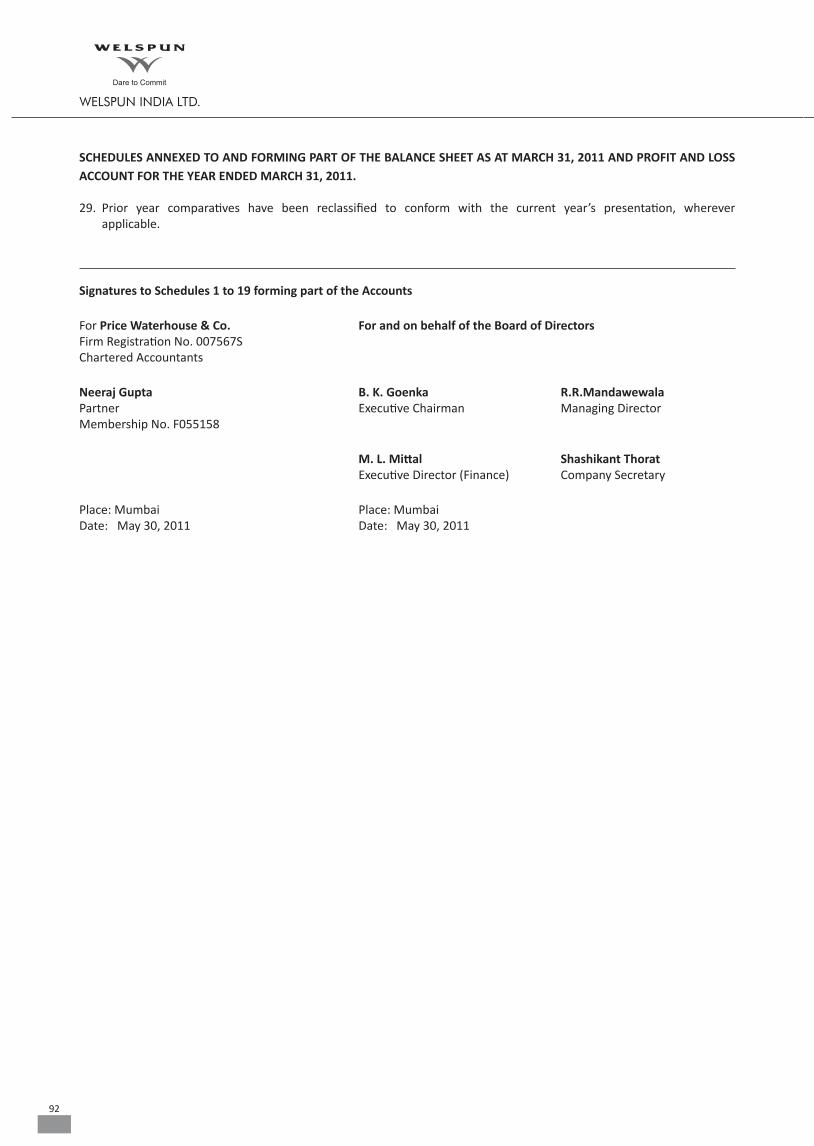
92
29. Prior year comparatives have been reclassified to conform with the current year’s presentation, wherever applicable.
Signatures to Schedules 1 to 19 forming part of the Accounts
For Price Waterhouse & Co. For and on behalf of the Board of Directors Firm Registration No. 007567S Chartered Accountants
Neeraj Gupta B. K. Goenka R.R.Mandawewala Partner Executive Chairman Managing Director Membership No. F055158
M. L. Mittal Shashikant Thorat Executive Director (Finance) Company Secretary
Place: Mumbai Place: Mumbai Date: May 30, 2011 Date: May 30, 2011
SCHEDULES ANNEXED TO AND FORMING PART OF THE BALANCE SHEET AS AT MARCH 31, 2011 AND PROFIT AND LOSS ACCOUNT FOR THE YEAR ENDED MARCH 31, 2011.

93
For the Year Ended For the Year Ended March 31, 2011 March 31, 2010 Rs. million Rs. million Rs. million A. CASH FLOW FROM OPERATING ACTIVITIES Net Profit Before Tax from Ordinary Activities 1,028.67 1,704.56 Adjustments for : Depreciation 1,135.13 1,063.25 Unrealised Foreign Exchange Differences (61.22) (85.08) Loss on Sale of Fixed Assets 15.25 10.91 Loss/ (Profit) on Redemption/ Sale of Units in Mutual Funds 0.03 (0.02) Profit on Sale of Bonds (4.53) (0.28) Dividend (15.07) (4.47) Liabilities Written Back as no Longer Required (6.94) (6.16) Provision for Doubtful Debts/ Advances Written Back - (14.31) Debts/ Advances Written off 1.57 14.31 Interest Income and Cash Discount Received (295.53) (185.07) Interest and Other Expenses 1,069.69 1,055.12 1,838.38 1,848.20 Operating Profit Before Working Capital Changes 2,867.05 3,552.76
Adjustments for changes in working capital : Trade Receivables 401.53 (224.38) Loans and Advances and Other Current Assets (383.40) (909.37) Inventories (983.05) (1,438.64) Current Liabilities and Provisions 611.61 717.51 (353.31) (1,854.88) Cash Flow Generated from Operations 2,513.74 1,697.88 Income taxes paid (net of refunds) (102.82) (274.74) Net Cash Flow from Operating Activities 2,410.92 1,423.14
B. CASH FLOW USED IN INVESTING ACTIVITIES Purchase of Fixed Assets (Including Capital Work-in-progress) (2,100.22) (673.75) Sale of Fixed Assets 127.49 3.41 Capital Subsidy 12.20 113.85 (Purchase) / Sales of Investments (Net) (871.06) (149.75) Share Application Money Pending Allotment (net of refund) (130.00) 0.05 Dividend Received 15.07 4.47 Interest Received 203.41 52.61
Net Cash Flow used in Investing Activities (2,743.11) (649.11)
C. CASH FLOW USED IN / FROM FINANCING ACTIVITIES
Final Dividend Paid (105.63) - Tax on Final Dividend Paid (17.63) - Proceeds from Issue of Equity Shares 1,482.75 - Proceeds from Borrowings (Net) 668.15 90.62 Interest and Other Finance Expenses (1,072.85) (922.66) Net Cash Flow from / (used in) Financing Activities 954.79 (832.04)
( A + B + C ) 622.60 (58.01)
Cash and Cash Equivalents at the beginning of the year 830.12 888.13 Cash and Cash Equivalents at the end of the year 1,452.72 830.12 Net Increase / (Decrease) in Cash and Cash Equivalents 622.60 (58.01)
CASH FLOW STATEMENT FOR THE YEAR ENDED MARCH 31, 2011
NOTES : 1. The Cash Flow Statement has been prepared under the “Indirect method” as set out in Accounting Standard - 3 on Cash Flow Statements. 2. Previous year’s comparatives have been reclassified to conform with the current year’s presentation, wherever applicable.
This is the Cash Flow statements referred to in our report of the even date.
For Price Waterhouse & Co. For and on behalf of the Board of Directors Firm Registration No. 007567S Chartered Accountants
Neeraj Gupta B. K. Goenka R.R.Mandawewala Partner Executive Chairman Managing Director Membership No. F055158
M. L. Mittal Shashikant Thorat Executive Director (Finance) Company Secretary
Place: Mumbai Place: Mumbai Date: May 30, 2011 Date: May 30, 2011

94
Additional Information pursuant to Part IV of Schedule VI to the Act. Balance Sheet Abstract and Company’s General Business Profile
WELSPUN INDIA LIMITED
ANNEXURE
I Registration Details
Registration No.
Balance Sheet Date
II Capital Raised During the Year (Amount in Rs. Thousands)
State Code
Date
Public Issue Rights Issue N I L
L 1 7 1 1 0 G J 1 9 8 5 P L C 0 3 3 2 7 1
N I L
0 4
Month Year
Bonus Issue Private Placement N I L
III Position of Mobilisation and Deployment of Funds (Amount in Rs. Thousands)
IV Performance of Company (Amount in Rs. Thousands)
V Generic Names of Three Principal Products / Services of Company (as per monetary terms)
Total Liabilities
Turnover (including Other Income)
Item Code No. (ITC Code) Product Description
Total Assets
Total Expenditure
2 5 7 0 7 3 9 0
2 0 6 3 3 8 2 0
9 3 9 7 6 0
6 4 8 3 6 0
1 1 . 3 3
1 6 1 1 8 4 9 0
5 6 8 2 6 9 0
1 0 6 5 8 8 0
8 3 4 5 0 0
N I L
2 5 7 0 7 3 9 0
1 9 6 0 5 1 5 0
N I L
9 9 7 8 4 0
N I L
1 6 3 7 1 6 8 0
8 5 2 3 0 2 0
1 8 7 8 7 6 0
N I L
N I L
Paid-up Capital
Profit/Loss Before Tax
(Please tick appropriate box + for positive, - for Negative Earnings per Share after extraordinary
items (Basic and Diluted) (In Rs.)
(Please tick appropriate box + for positive, - for Negative
Dividend Rate %
Net Fixed Assets
Reserves and Surplus
Investments
Unsecured Loans
Accumulated Losses
Sources of Funds
+ -
+ -
+ -
Application of Funds
Equity Warrants
Profit/Loss after Tax
Incidental Expenditure Pending Capitalisation/ Allocation
Secured Loans
Net Current Assets
Deferred Tax Liability (Net)
Miscellaneous Expenditure
P
P
P
3 1 0 3 2 0 1 1
Annexure (continued)
6 3 0 4 9 2 5 0 C O T T O N T E R R Y T O W E L
6 3 0 4 1 9 1 0 C O T T O N B E D S H E E T
5 2 0 5 1 1 0 0 C O T T O N Y A R N
On behalf of the Board of Directors
B. K. Goenka R.R.Mandawewala Executive Chairman Managing Director
M. L. Mittal Shashikant Thorat Executive Director (Finance) Company Secretary Place: Mumbai Date: May 30, 2011
1 5 8 8 6 8
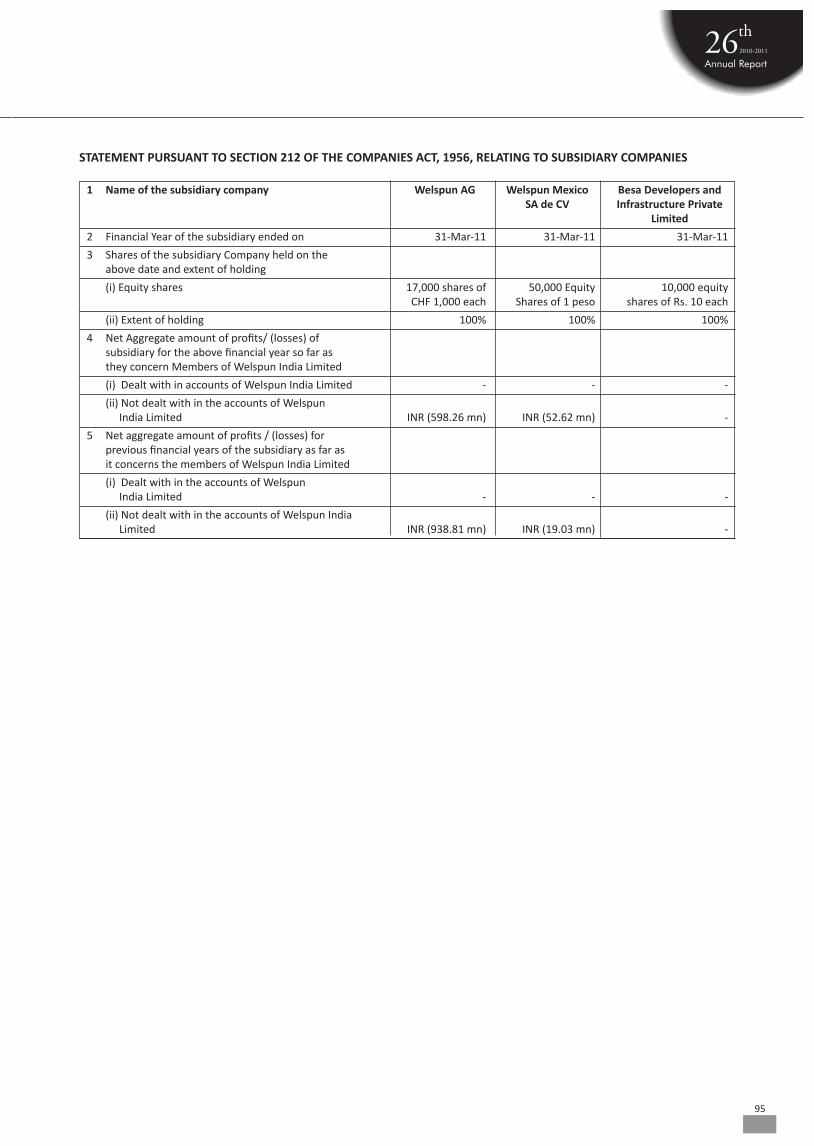
95
STATEMENT PURSUANT TO SECTION 212 OF THE COMPANIES ACT, 1956, RELATING TO SUBSIDIARY COMPANIES
1 Name of the subsidiary company Welspun AG Welspun Mexico Besa Developers and SA de CV Infrastructure Private Limited
2 Financial Year of the subsidiary ended on 31-Mar-11 31-Mar-11 31-Mar-11
3 Shares of the subsidiary Company held on the above date and extent of holding
(i) Equity shares 17,000 shares of 50,000 Equity 10,000 equity CHF 1,000 each Shares of 1 peso shares of Rs. 10 each
(ii) Extent of holding 100% 100% 100%
4 Net Aggregate amount of profits/ (losses) of subsidiary for the above financial year so far as they concern Members of Welspun India Limited
(i) Dealt with in accounts of Welspun India Limited - - -
(ii) Not dealt with in the accounts of Welspun India Limited INR (598.26 mn) INR (52.62 mn) -
5 Net aggregate amount of profits / (losses) for previous financial years of the subsidiary as far as it concerns the members of Welspun India Limited
(i) Dealt with in the accounts of Welspun India Limited - - -
(ii) Not dealt with in the accounts of Welspun India Limited INR (938.81 mn) INR (19.03 mn) -
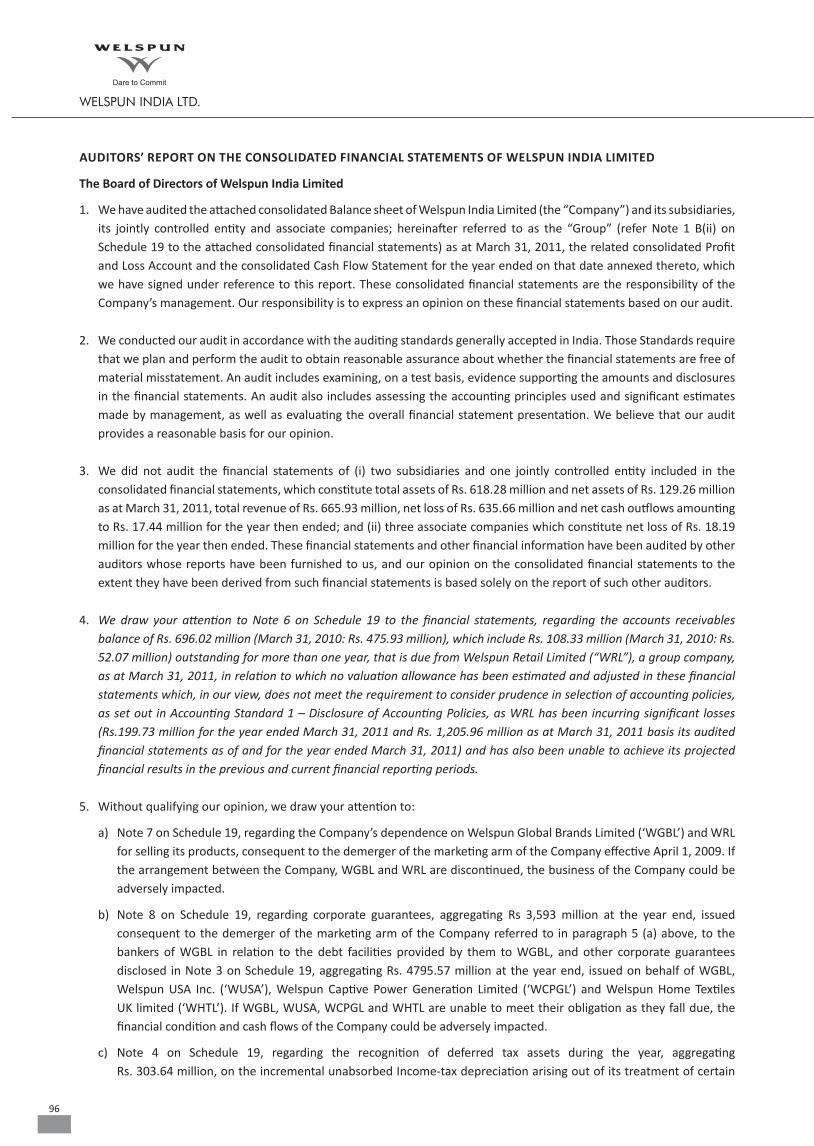
96
AUDITORS’ REPORT ON THE CONSOLIDATED FINANCIAL STATEMENTS OF WELSPUN INDIA LIMITED
The Board of Directors of Welspun India Limited
1. We have audited the attached consolidated Balance sheet of Welspun India Limited (the “Company”) and its subsidiaries, its jointly controlled entity and associate companies; hereinafter referred to as the “Group” (refer Note 1 B(ii) on Schedule 19 to the attached consolidated financial statements) as at March 31, 2011, the related consolidated Profit and Loss Account and the consolidated Cash Flow Statement for the year ended on that date annexed thereto, which we have signed under reference to this report. These consolidated financial statements are the responsibility of the Company’s management. Our responsibility is to express an opinion on these financial statements based on our audit.
2. We conducted our audit in accordance with the auditing standards generally accepted in India. Those Standards require that we plan and perform the audit to obtain reasonable assurance about whether the financial statements are free of material misstatement. An audit includes examining, on a test basis, evidence supporting the amounts and disclosures in the financial statements. An audit also includes assessing the accounting principles used and significant estimates made by management, as well as evaluating the overall financial statement presentation. We believe that our audit provides a reasonable basis for our opinion.
3. We did not audit the financial statements of (i) two subsidiaries and one jointly controlled entity included in the consolidated financial statements, which constitute total assets of Rs. 618.28 million and net assets of Rs. 129.26 million as at March 31, 2011, total revenue of Rs. 665.93 million, net loss of Rs. 635.66 million and net cash outflows amounting to Rs. 17.44 million for the year then ended; and (ii) three associate companies which constitute net loss of Rs. 18.19 million for the year then ended. These financial statements and other financial information have been audited by other auditors whose reports have been furnished to us, and our opinion on the consolidated financial statements to the extent they have been derived from such financial statements is based solely on the report of such other auditors.
4. We draw your attention to Note 6 on Schedule 19 to the financial statements, regarding the accounts receivables balance of Rs. 696.02 million (March 31, 2010: Rs. 475.93 million), which include Rs. 108.33 million (March 31, 2010: Rs. 52.07 million) outstanding for more than one year, that is due from Welspun Retail Limited (“WRL”), a group company, as at March 31, 2011, in relation to which no valuation allowance has been estimated and adjusted in these financial statements which, in our view, does not meet the requirement to consider prudence in selection of accounting policies, as set out in Accounting Standard 1 – Disclosure of Accounting Policies, as WRL has been incurring significant losses (Rs.199.73 million for the year ended March 31, 2011 and Rs. 1,205.96 million as at March 31, 2011 basis its audited financial statements as of and for the year ended March 31, 2011) and has also been unable to achieve its projected financial results in the previous and current financial reporting periods.
5. Without qualifying our opinion, we draw your attention to:
a) Note 7 on Schedule 19, regarding the Company’s dependence on Welspun Global Brands Limited (‘WGBL’) and WRL for selling its products, consequent to the demerger of the marketing arm of the Company effective April 1, 2009. If the arrangement between the Company, WGBL and WRL are discontinued, the business of the Company could be adversely impacted.
b) Note 8 on Schedule 19, regarding corporate guarantees, aggregating Rs 3,593 million at the year end, issued consequent to the demerger of the marketing arm of the Company referred to in paragraph 5 (a) above, to the bankers of WGBL in relation to the debt facilities provided by them to WGBL, and other corporate guarantees disclosed in Note 3 on Schedule 19, aggregating Rs. 4795.57 million at the year end, issued on behalf of WGBL, Welspun USA Inc. (‘WUSA’), Welspun Captive Power Generation Limited (‘WCPGL’) and Welspun Home Textiles UK limited (‘WHTL’). If WGBL, WUSA, WCPGL and WHTL are unable to meet their obligation as they fall due, the financial condition and cash flows of the Company could be adversely impacted.
c) Note 4 on Schedule 19, regarding the recognition of deferred tax assets during the year, aggregating Rs. 303.64 million, on the incremental unabsorbed Income-tax depreciation arising out of its treatment of certain
97
excise and Value Added Tax incentives as ‘capital receipts’ for income tax purposes based on the judgement in re Commissioner of Income Tax, Mumbai v/s. Reliance Industries Limited of the Honourable High Court of Judicature at Bombay. However, this case has not attained finality as the judgement has been challenged by the tax authorities in the apex court. If the final decision in the matter is eventually decided against the Company, then the carrying value of the deferred tax assets at the period end could be significantly impacted.
6. We report that the consolidated financial statements have been prepared by the Company’s Management in accordance with the requirements of Accounting Standard (AS) 21- Consolidated Financial Statements, Accounting Standard (AS) 23 - Accounting for Investments in Associates in Consolidated Financial Statements, and Accounting Standard (AS) 27 - Financial Reporting of Interests in Joint Ventures notified under sub-section 3C of Section 211 of the Companies Act, 1956.
7. Based on our audit and on consideration of reports of other auditors on separate financial statements and on the other financial information of the components of the Group as referred to above, and to the best of our information and according to the explanations given to us, in our opinion, the attached consolidated financial statements give, except for the indeterminate effects of the matter referred to in paragraph 4 above, a true and fair view in conformity with the accounting principles generally accepted in India:
a) in the case of the consolidated Balance Sheet, of the state of affairs of the Group as at March 31, 2011;
b) in the case of the consolidated Profit and Loss Account, of the profit of the Group for the year ended on that date and
c) in the case of the consolidated Cash Flow Statement, of the cash flows of the Group for the year ended on that date.
For Price Waterhouse & Co. Firm Registration Number: 007567S
Chartered Accountants
Neeraj Gupta Partner
Membership Number F055158
Place: Mumbai Date: May 30, 2011
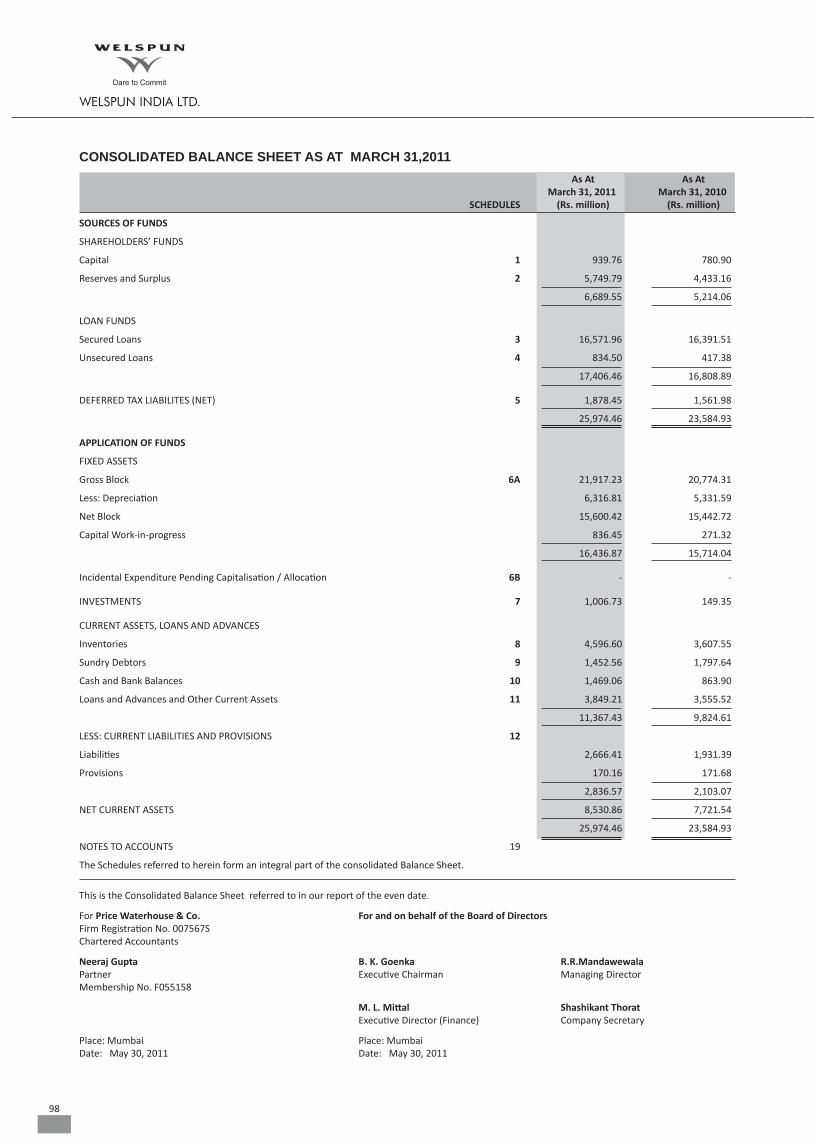
98
As At As At March 31, 2011 March 31, 2010 SCHEDULES (Rs. million) (Rs. million)
SOURCES OF FUNDS
SHAREHOLDERS’ FUNDS
Capital 1 939.76 780.90
Reserves and Surplus 2 5,749.79 4,433.16
6,689.55 5,214.06
LOAN FUNDS
Secured Loans 3 16,571.96 16,391.51
Unsecured Loans 4 834.50 417.38
17,406.46 16,808.89
DEFERRED TAX LIABILITES (NET) 5 1,878.45 1,561.98
25,974.46 23,584.93
APPLICATION OF FUNDS
FIXED ASSETS
Gross Block 6A 21,917.23 20,774.31
Less: Depreciation 6,316.81 5,331.59
Net Block 15,600.42 15,442.72
Capital Work-in-progress 836.45 271.32
16,436.87 15,714.04
Incidental Expenditure Pending Capitalisation / Allocation 6B - -
INVESTMENTS 7 1,006.73 149.35
CURRENT ASSETS, LOANS AND ADVANCES
Inventories 8 4,596.60 3,607.55
Sundry Debtors 9 1,452.56 1,797.64
Cash and Bank Balances 10 1,469.06 863.90
Loans and Advances and Other Current Assets 11 3,849.21 3,555.52
11,367.43 9,824.61
LESS: CURRENT LIABILITIES AND PROVISIONS 12
Liabilities 2,666.41 1,931.39
Provisions 170.16 171.68
2,836.57 2,103.07
NET CURRENT ASSETS 8,530.86 7,721.54
25,974.46 23,584.93
NOTES TO ACCOUNTS 19
The Schedules referred to herein form an integral part of the consolidated Balance Sheet.
CONSOLIDATED BALANCE SHEET AS AT MARCH 31,2011
This is the Consolidated Balance Sheet referred to in our report of the even date.
For Price Waterhouse & Co. For and on behalf of the Board of Directors Firm Registration No. 007567S Chartered Accountants
Neeraj Gupta B. K. Goenka R.R.Mandawewala Partner Executive Chairman Managing Director Membership No. F055158
M. L. Mittal Shashikant Thorat Executive Director (Finance) Company Secretary
Place: Mumbai Place: Mumbai Date: May 30, 2011 Date: May 30, 2011
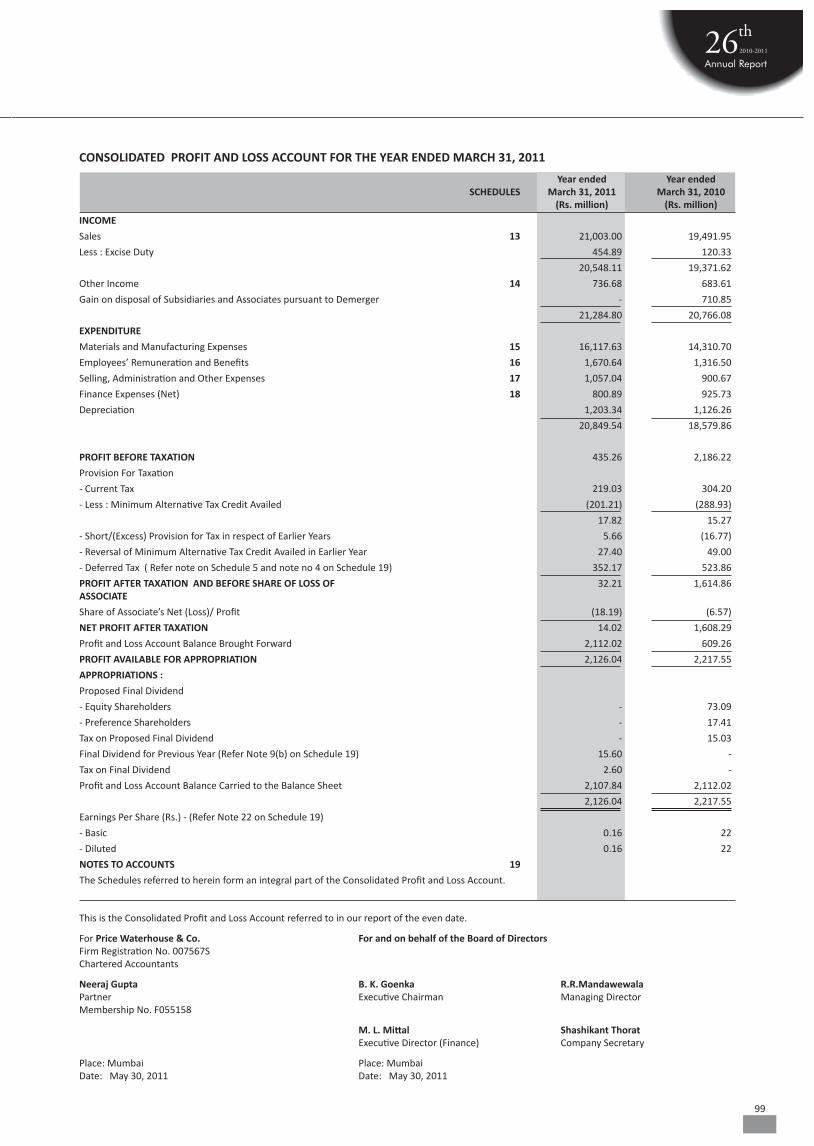
99
Year ended Year ended SCHEDULES March 31, 2011 March 31, 2010 (Rs. million) (Rs. million)
INCOME
Sales 13 21,003.00 19,491.95
Less : Excise Duty 454.89 120.33
20,548.11 19,371.62
Other Income 14 736.68 683.61
Gain on disposal of Subsidiaries and Associates pursuant to Demerger - 710.85
21,284.80 20,766.08
EXPENDITURE
Materials and Manufacturing Expenses 15 16,117.63 14,310.70
Employees’ Remuneration and Benefits 16 1,670.64 1,316.50
Selling, Administration and Other Expenses 17 1,057.04 900.67
Finance Expenses (Net) 18 800.89 925.73
Depreciation 1,203.34 1,126.26
20,849.54 18,579.86
PROFIT BEFORE TAXATION 435.26 2,186.22
Provision For Taxation
- Current Tax 219.03 304.20
- Less : Minimum Alternative Tax Credit Availed (201.21) (288.93)
17.82 15.27
- Short/(Excess) Provision for Tax in respect of Earlier Years 5.66 (16.77)
- Reversal of Minimum Alternative Tax Credit Availed in Earlier Year 27.40 49.00
- Deferred Tax ( Refer note on Schedule 5 and note no 4 on Schedule 19) 352.17 523.86
PROFIT AFTER TAXATION AND BEFORE SHARE OF LOSS OF 32.21 1,614.86 ASSOCIATE
Share of Associate’s Net (Loss)/ Profit (18.19) (6.57)
NET PROFIT AFTER TAXATION 14.02 1,608.29
Profit and Loss Account Balance Brought Forward 2,112.02 609.26
PROFIT AVAILABLE FOR APPROPRIATION 2,126.04 2,217.55
APPROPRIATIONS :
Proposed Final Dividend
- Equity Shareholders - 73.09
- Preference Shareholders - 17.41
Tax on Proposed Final Dividend - 15.03
Final Dividend for Previous Year (Refer Note 9(b) on Schedule 19) 15.60 -
Tax on Final Dividend 2.60 -
Profit and Loss Account Balance Carried to the Balance Sheet 2,107.84 2,112.02
2,126.04 2,217.55
Earnings Per Share (Rs.) - (Refer Note 22 on Schedule 19)
- Basic 0.16 22
- Diluted 0.16 22
NOTES TO ACCOUNTS 19
The Schedules referred to herein form an integral part of the Consolidated Profit and Loss Account.
CONSOLIDATED PROFIT AND LOSS ACCOUNT FOR THE YEAR ENDED MARCH 31, 2011
This is the Consolidated Profit and Loss Account referred to in our report of the even date.
For Price Waterhouse & Co. For and on behalf of the Board of Directors Firm Registration No. 007567S Chartered Accountants
Neeraj Gupta B. K. Goenka R.R.Mandawewala Partner Executive Chairman Managing Director Membership No. F055158
M. L. Mittal Shashikant Thorat Executive Director (Finance) Company Secretary
Place: Mumbai Place: Mumbai Date: May 30, 2011 Date: May 30, 2011

100
As At As At March 31, 2011 March 31, 2010 (Rs. million) (Rs. million) SCHEDULE 1 : CAPITAL Authorised 125,000,000 (March 31, 2010: 125,000,000) Equity Shares of Rs. 10 each 1,250.00 1,250.00 500,000 (March 31, 2010 : 500,000) 0% Redeemable Cumulative 50.00 50.00 Preference Shares of Rs. 100 each 1,300.00 1,300.00 Issued, Subscribed and Paid Up 88,976,269 (March 31, 2010 : 73,089,519) Equity Shares of Rs. 10 each fully paid up 889.76 730.90 (Refer Notes 1 C (xiv), 9(a) and 10 on Schedule 19) 500,000 (March 31, 2010 : 500,000) 0% 50.00 50.00 Redeemable Cumulative Preference Shares of Rs.100 each fully paid up (Refer Note 11 on Schedule 19) 939.76 780.90 Less: Adjustment for 50 Equity Shares representing 50% of 100 equity shares of Welspun India * * Limited held by Welspun Zucchi Textiles Limited, a jointly controlled entity.
* Less than Rs. 1,000 939.76 780.90
SCHEDULE 2 : RESERVES AND SURPLUS Securities Premium Account As per last Balance Sheet 1,888.11 2,638.11 Add : Additions during the year ( Refer Note 9 (a) on Schedule 19) 1,411.53 - 3,299.64 2,638.11 Less : Adjustment on demerger - 750.00 Less : Expenses on Qualified Institution Placement adjusted as per Section 78 of the Companies Act, 1956 87.64 - (Refer Note 9(a) on Schedule 19) 3,212.00 1,888.11 Capital Redemption Reserve 428.38 428.38 Capital Reserve - Forfeiture of Equity Warrants 48.18 48.18 - Arising on Acquisition of Shareholding of Associate Company 0.25 0.25 Foreign Exchange Translation Reserve (46.86) (43.78)Profit and Loss Account 2,107.84 2,112.02 [includes Share in Joint Ventures - Profit of Rs. 36.42 million (March 31, 2010 : Profit of Rs. 33.90 million)] 5,749.79 4,433.16
SCHEDULE 3 : SECURED LOANS From Banks - In Rupee 12,400.10 12,280.08 - In Foreign Currency 262.80 385.31 Working Capital Loans from Banks 3,886.48 3,726.12 16,549.38 16,391.51 Share in Joint Venture 22.58 - 16,571.96 16,391.51
SCHEDULE 4 : UNSECURED LOANS Interest Free Sales Tax Loan - 0.01 (Repayable within one year Rs. Nil ; March 31, 2010 : Rs. 0.01 million) Buyers’ Credit 745.70 328.57 Inter-Corporate Loan from Welspun Investments and Commercials Limited 88.80 88.80 (Repayable within one year : Rs. 8.80 million; March 31, 2010 : Rs. Nil) 834.50 417.38
SCHEDULE 5 : DEFERRED TAX LIABILITES (NET) (Refer Note 1 C (vii)(b) on Schedule 19) Deferred Tax Liability arising on account of Timing differences in : - Depreciation 2,152.01 2,063.49 - Others 9.37 - 2,161.38 2,063.49 Deferred Tax Asset arising on account of Timing differences in: - Provision for Doubtful Debts/ Advances 3.55 3.64 - Provision for Unpaid Statutory Dues under Section 43B of the Income Tax Act, 1961 10.89 4.48 - Provision for Employee Benefits 20.16 12.03 - Unabsorbed Depreciation as per the Income Tax Act, 1961 (Refer Note below) 247.56 480.47 - Others 0.49 0.78 282.65 501.40 Share in Joint Venture (0.28) (0.11) 1,878.45 1,561.98
SCHEDULES ANNEXED TO AND FORMING PART OF THE CONSOLIDATED BALANCE SHEET AS AT MARCH 31,2011
Note: The Income Tax Department had disallowed certain expenditure claimed by the Company in its income tax return for the Assessment Years 2004-2005 and 2005-2006. During the year, the Income Tax Appellate Tribunal High Court decided the matter in the Company’s favour, consequent to which, the Company has recognised deferred tax asset aggregating Rs. 10.31 million on unabsorbed depreciation pertaining to the aforesaid assessment years.
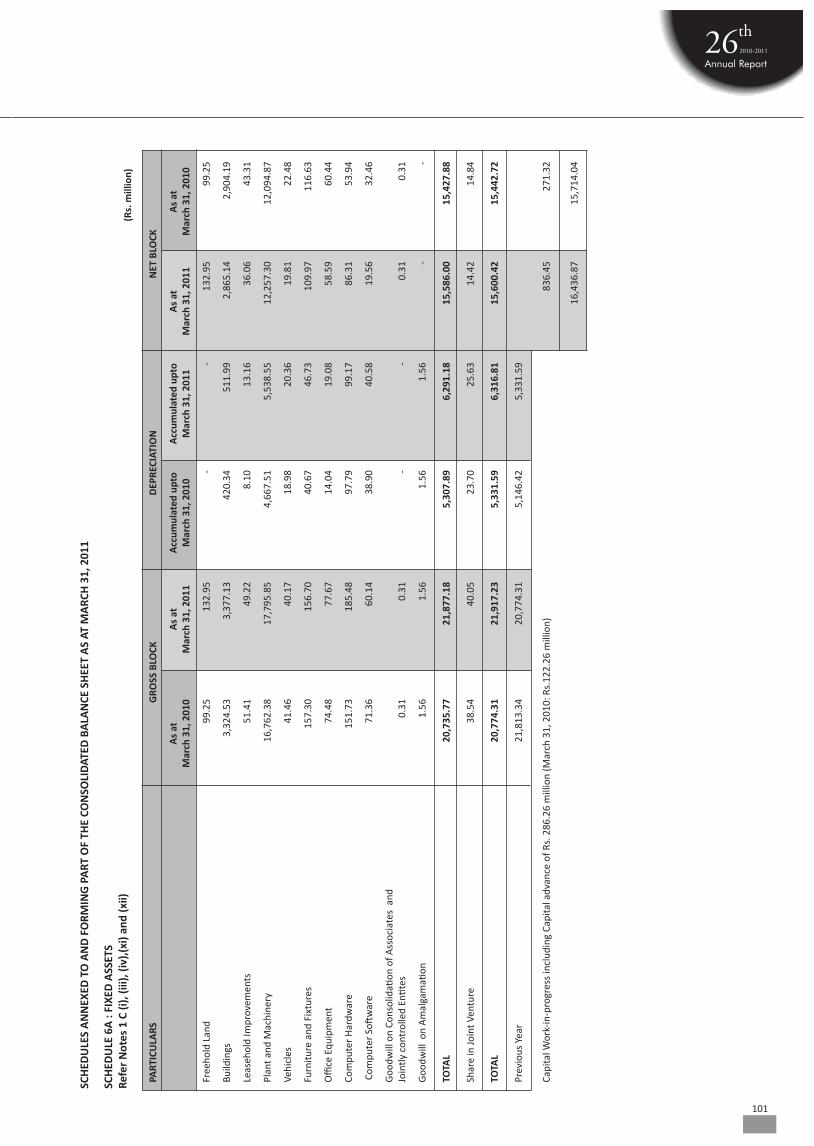
101
(R
s. m
illio
n)
SCH
EDU
LES
AN
NEX
ED T
O A
ND
FO
RMIN
G P
ART
OF
THE
CON
SOLI
DAT
ED B
ALA
NCE
SH
EET
AS
AT M
ARC
H 3
1, 2
011
SCH
EDU
LE 6
A :
FIXE
D A
SSET
S
Refe
r N
otes
1 C
(i),
(iii),
(iv)
,(xi)
and
(xii)
PART
ICU
LARS
GRO
SS B
LOCK
D
EPRE
CIAT
ION
NET
BLO
CK
A
s at
A
s at
A
ccum
ulat
ed u
pto
Acc
umul
ated
upt
o A
s at
A
s at
Mar
ch 3
1, 2
010
Mar
ch 3
1, 2
011
Mar
ch 3
1, 2
010
Mar
ch 3
1, 2
011
Mar
ch 3
1, 2
011
Mar
ch 3
1, 2
010
Free
hold
Lan
d
99.
25
132
.95
-
-
1
32.9
5
99.
25
Build
ings
3
,324
.53
3
,377
.13
4
20.3
4
511
.99
2
,865
.14
2
,904
.19
Leas
ehol
d Im
prov
emen
ts
51.
41
49.
22
8.1
0
13.
16
36.
06
43.
31
Plan
t and
Mac
hine
ry
16,
762.
38
17,
795.
85
4,6
67.5
1
5,5
38.5
5
12,
257.
30
12,
094.
87
Vehi
cles
4
1.46
4
0.17
1
8.98
2
0.36
1
9.81
2
2.48
Furn
iture
and
Fix
ture
s
157
.30
1
56.7
0
40.
67
46.
73
109
.97
1
16.6
3
Offi
ce E
quip
men
t 7
4.48
7
7.67
1
4.04
1
9.08
5
8.59
6
0.44
Com
pute
r H
ardw
are
1
51.7
3
185
.48
9
7.79
9
9.17
8
6.31
5
3.94
Com
pute
r So
ftw
are
7
1.36
6
0.14
3
8.90
4
0.58
1
9.56
3
2.46
Goo
dwill
on
Cons
olid
ation
of A
ssoc
iate
s a
nd
Join
tly c
ontr
olle
d En
tites
0
.31
0
.31
-
-
0
.31
0
.31
Goo
dwill
on
Am
alga
mati
on
1.5
6
1.5
6
1.5
6
1.5
6
-
-
TOTA
L
20,
735.
77
21,
877.
18
5,3
07.8
9
6,2
91.1
8
15,
586.
00
15,
427.
88
Shar
e in
Join
t Ven
ture
3
8.54
4
0.05
2
3.70
2
5.63
1
4.42
1
4.84
TOTA
L
20,
774.
31
21,
917.
23
5,3
31.5
9
6,3
16.8
1
15,
600.
42
15,
442.
72
Prev
ious
Yea
r
21,
813.
34
20,
774.
31
5,1
46.4
2
5,3
31.5
9
Capi
tal W
ork-
in-p
rogr
ess
incl
udin
g Ca
pita
l adv
ance
of R
s. 2
86.2
6 m
illio
n (M
arch
31,
201
0: R
s.12
2.26
mill
ion)
836.
45
271.
32
16
,436
.87
15,7
14.0
4
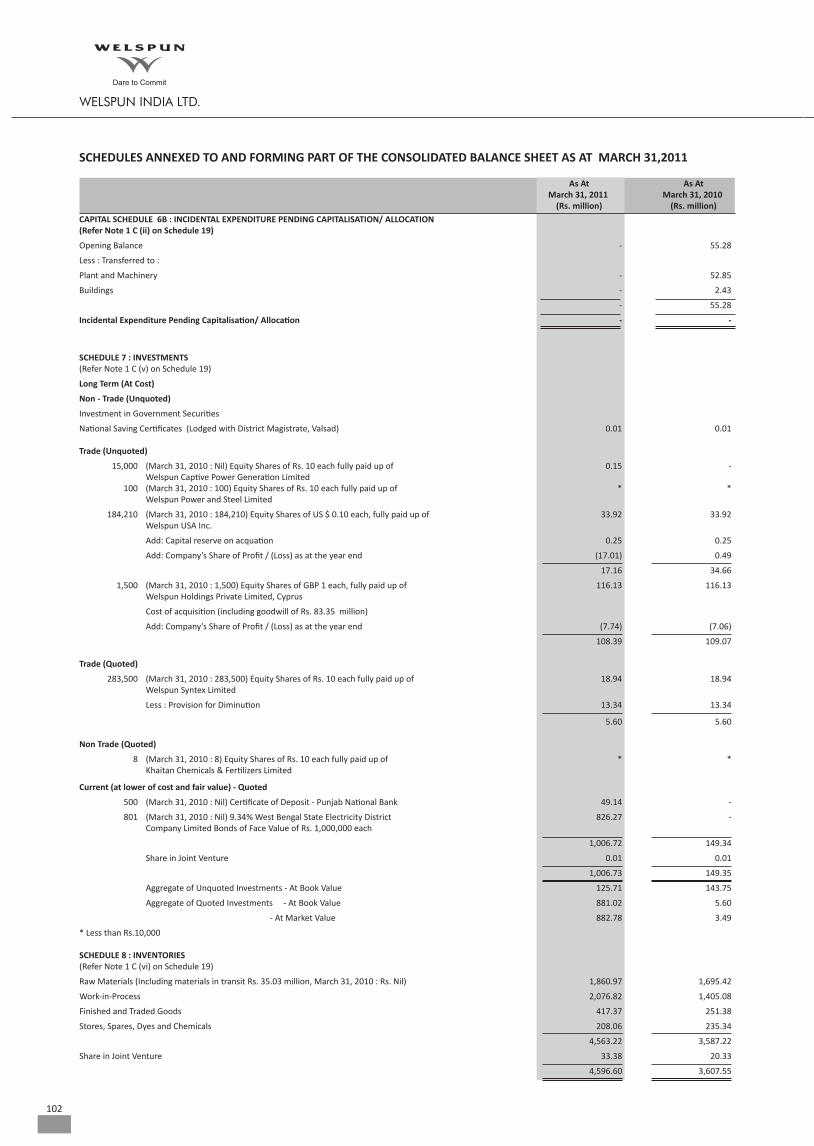
102
CAPITAL SCHEDULE 6B : INCIDENTAL EXPENDITURE PENDING CAPITALISATION/ ALLOCATION (Refer Note 1 C (ii) on Schedule 19)
Opening Balance - 55.28
Less : Transferred to :
Plant and Machinery - 52.85
Buildings - 2.43
- 55.28
Incidental Expenditure Pending Capitalisation/ Allocation - -
SCHEDULE 7 : INVESTMENTS (Refer Note 1 C (v) on Schedule 19)
Long Term (At Cost)
Non - Trade (Unquoted)
Investment in Government Securities
National Saving Certificates (Lodged with District Magistrate, Valsad) 0.01 0.01
Trade (Unquoted)
15,000 (March 31, 2010 : Nil) Equity Shares of Rs. 10 each fully paid up of 0.15 - Welspun Captive Power Generation Limited 100 (March 31, 2010 : 100) Equity Shares of Rs. 10 each fully paid up of * * Welspun Power and Steel Limited
184,210 (March 31, 2010 : 184,210) Equity Shares of US $ 0.10 each, fully paid up of 33.92 33.92 Welspun USA Inc.
Add: Capital reserve on acquation 0.25 0.25
Add: Company’s Share of Profit / (Loss) as at the year end (17.01) 0.49
17.16 34.66
1,500 (March 31, 2010 : 1,500) Equity Shares of GBP 1 each, fully paid up of 116.13 116.13 Welspun Holdings Private Limited, Cyprus
Cost of acquisition (including goodwill of Rs. 83.35 million)
Add: Company’s Share of Profit / (Loss) as at the year end (7.74) (7.06)
108.39 109.07
Trade (Quoted)
283,500 (March 31, 2010 : 283,500) Equity Shares of Rs. 10 each fully paid up of 18.94 18.94 Welspun Syntex Limited
Less : Provision for Diminution 13.34 13.34
5.60 5.60
Non Trade (Quoted)
8 (March 31, 2010 : 8) Equity Shares of Rs. 10 each fully paid up of * * Khaitan Chemicals & Fertilizers Limited
Current (at lower of cost and fair value) - Quoted
500 (March 31, 2010 : Nil) Certificate of Deposit - Punjab National Bank 49.14 -
801 (March 31, 2010 : Nil) 9.34% West Bengal State Electricity District 826.27 - Company Limited Bonds of Face Value of Rs. 1,000,000 each
1,006.72 149.34
Share in Joint Venture 0.01 0.01
1,006.73 149.35
Aggregate of Unquoted Investments - At Book Value 125.71 143.75
Aggregate of Quoted Investments - At Book Value 881.02 5.60
- At Market Value 882.78 3.49
* Less than Rs.10,000
SCHEDULE 8 : INVENTORIES (Refer Note 1 C (vi) on Schedule 19)
Raw Materials (Including materials in transit Rs. 35.03 million, March 31, 2010 : Rs. Nil) 1,860.97 1,695.42
Work-in-Process 2,076.82 1,405.08
Finished and Traded Goods 417.37 251.38
Stores, Spares, Dyes and Chemicals 208.06 235.34
4,563.22 3,587.22
Share in Joint Venture 33.38 20.33
4,596.60 3,607.55
As At As At March 31, 2011 March 31, 2010 (Rs. million) (Rs. million)
SCHEDULES ANNEXED TO AND FORMING PART OF THE CONSOLIDATED BALANCE SHEET AS AT MARCH 31,2011

103
As At As At March 31, 2011 March 31, 2010 (Rs. million) (Rs. million)
SCHEDULES ANNEXED TO AND FORMING PART OF THE CONSOLIDATED BALANCE SHEET AS AT MARCH 31,2011
SCHEDULE 9 : SUNDRY DEBTORS (Refer Note 6 on Schedule 19)
Unsecured
Debts Outstanding for a period exceeding six months :
- Considered Good 433.43 170.67
- Considered Doubtful 2.98 2.98
436.41 173.65
Other Debts :
- Considered Good 988.03 1,610.50
Less : Provision for Doubtful Debts 2.98 2.98
1,421.46 1,781.17
Share in Joint Venture 31.10 16.47
1,452.56 1,797.64
SCHEDULE 10 : CASH AND BANK BALANCES
Cash on Hand 0.91 1.01
Cheques on Hand 1.30 0.95
Balances with Scheduled Banks
- In Current Accounts 245.83 174.17
- In Fixed Deposit Accounts 1,199.56 653.99 [includes deposits aggregating Rs. 1,185.29 million; (March 31, 2010: Rs. 529.39 million) pledged with banks against term loans, overdraft, letters of credit and bank guarantee facilities]
- In Margin Money Deposit Accounts 0.87 -
With Others :
- In Current Accounts Foreign Currency 15.42 26.20
- In Exchange Earners Foreign Currency Accounts (USD 86,508 March 31, 2010 : USD 5,897) 3.86 0.26
- Unclaimed Dividend 0.47 -
1,468.22 856.58
Share in Joint Venture 0.84 7.32
1,469.06 863.90
SCHEDULE 11 : LOANS AND ADVANCES AND OTHER CURRENT ASSETS
LOANS AND ADVANCES
Unsecured
Loans
- Welspun USA Inc. - 112.25
- Welspun Global Brands Limited 963.86 1,113.87
Equity Share Application pending allotment
- Welspun Captive Power Generation Limited 130.00 -
- Welspun USA Inc. ( Refer Note no 5. on Schedule 19) 111.49 -
Advances Recoverable in Cash or in Kind or for Value to be Received
- Considered Good 29.61 97.75
- Considered Doubtful 7.72 7.72
37.33 105.47
Less : Provision for Doubtful Advances 7.72 7.72
29.61 97.75
Balances with Customs, Excise, Sales Tax and other Government Authorities 963.04 752.43
Advance Tax and Tax Deducted at Source Rs. Nil (Net of Provision for tax March 31, 2010 : Rs. 529.17 million) - 54.90
Minimum Alternative Tax Credit Entitlement 623.24 441.55
Gratuity Fund (Net) (Refer Notes 1 C (viii) and 16 on Schedule 19) 4.44 -
Deposits 220.00 370.06
3,045.68 2,942.81
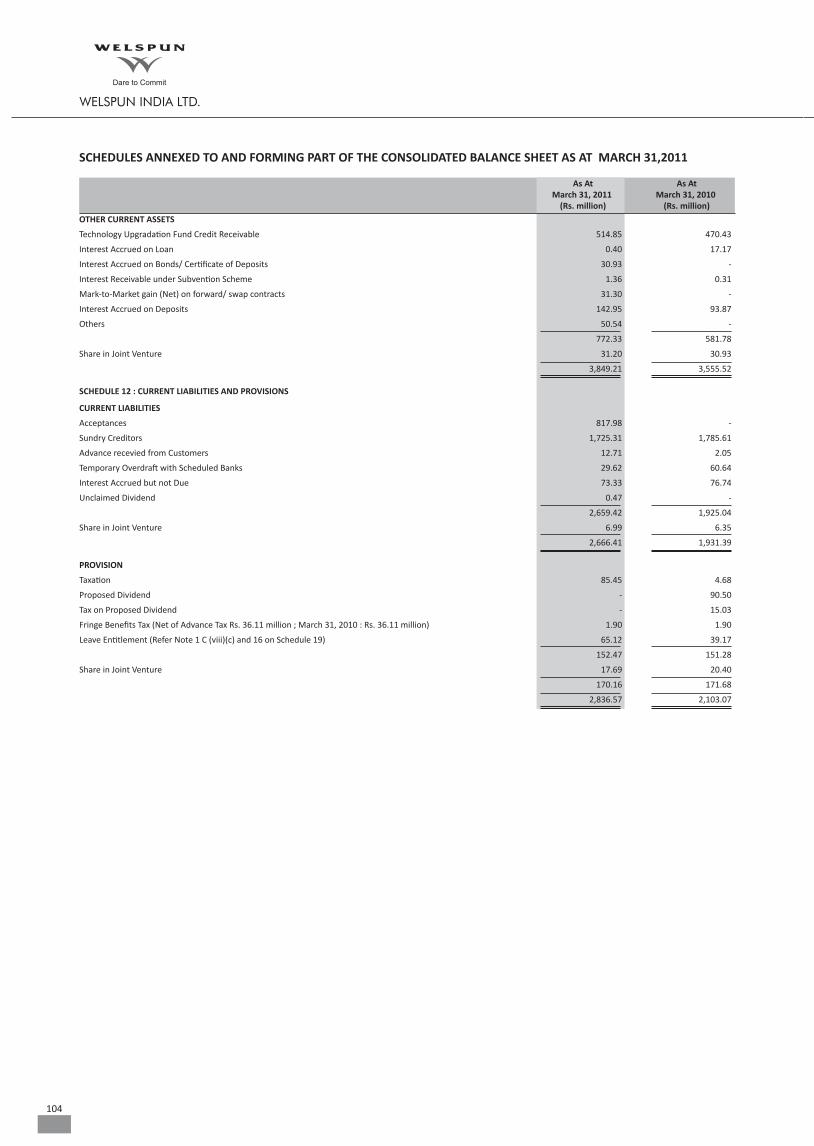
104
As At As At March 31, 2011 March 31, 2010 (Rs. million) (Rs. million)
SCHEDULES ANNEXED TO AND FORMING PART OF THE CONSOLIDATED BALANCE SHEET AS AT MARCH 31,2011
OTHER CURRENT ASSETS
Technology Upgradation Fund Credit Receivable 514.85 470.43
Interest Accrued on Loan 0.40 17.17
Interest Accrued on Bonds/ Certificate of Deposits 30.93 -
Interest Receivable under Subvention Scheme 1.36 0.31
Mark-to-Market gain (Net) on forward/ swap contracts 31.30 -
Interest Accrued on Deposits 142.95 93.87
Others 50.54 -
772.33 581.78
Share in Joint Venture 31.20 30.93
3,849.21 3,555.52
SCHEDULE 12 : CURRENT LIABILITIES AND PROVISIONS
CURRENT LIABILITIES
Acceptances 817.98 -
Sundry Creditors 1,725.31 1,785.61
Advance recevied from Customers 12.71 2.05
Temporary Overdraft with Scheduled Banks 29.62 60.64
Interest Accrued but not Due 73.33 76.74
Unclaimed Dividend 0.47 -
2,659.42 1,925.04
Share in Joint Venture 6.99 6.35
2,666.41 1,931.39
PROVISION
Taxation 85.45 4.68
Proposed Dividend - 90.50
Tax on Proposed Dividend - 15.03
Fringe Benefits Tax (Net of Advance Tax Rs. 36.11 million ; March 31, 2010 : Rs. 36.11 million) 1.90 1.90
Leave Entitlement (Refer Note 1 C (viii)(c) and 16 on Schedule 19) 65.12 39.17
152.47 151.28
Share in Joint Venture 17.69 20.40
170.16 171.68
2,836.57 2,103.07
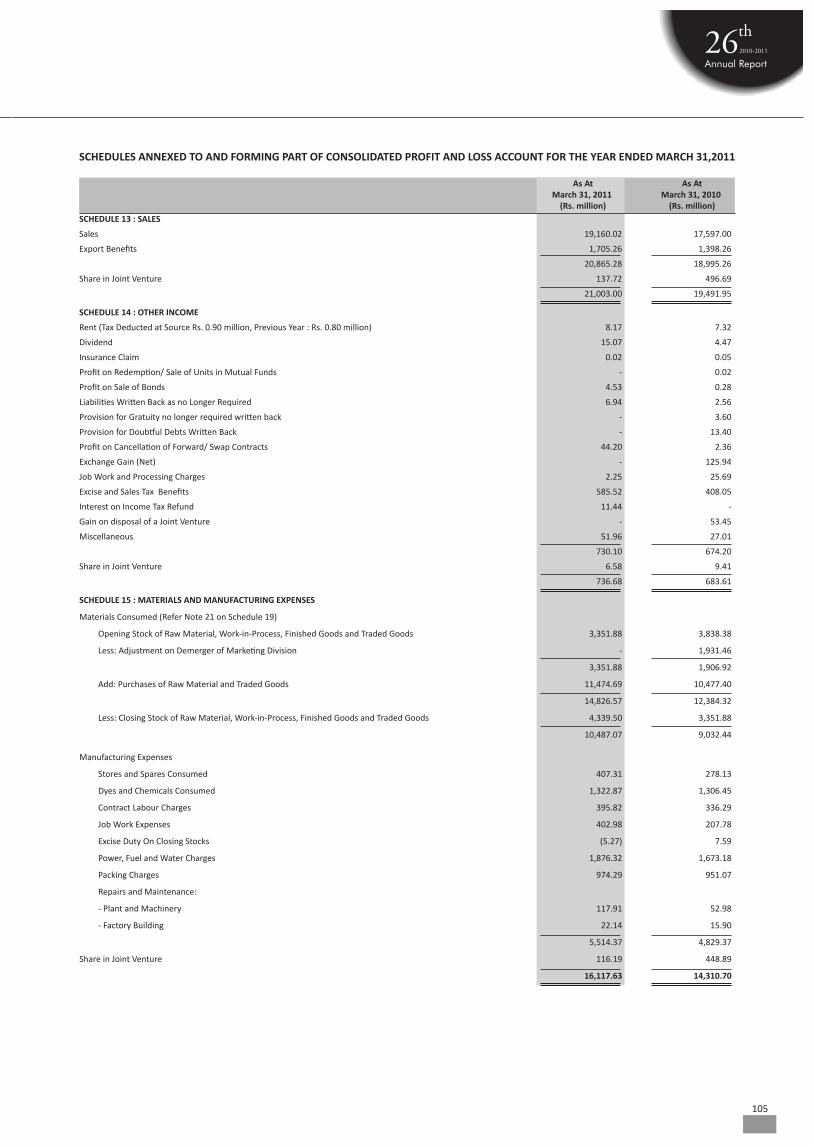
105
As At As At March 31, 2011 March 31, 2010 (Rs. million) (Rs. million)
SCHEDULES ANNEXED TO AND FORMING PART OF CONSOLIDATED PROFIT AND LOSS ACCOUNT FOR THE YEAR ENDED MARCH 31,2011
SCHEDULE 13 : SALES
Sales 19,160.02 17,597.00
Export Benefits 1,705.26 1,398.26
20,865.28 18,995.26
Share in Joint Venture 137.72 496.69
21,003.00 19,491.95
SCHEDULE 14 : OTHER INCOME
Rent (Tax Deducted at Source Rs. 0.90 million, Previous Year : Rs. 0.80 million) 8.17 7.32
Dividend 15.07 4.47
Insurance Claim 0.02 0.05
Profit on Redemption/ Sale of Units in Mutual Funds - 0.02
Profit on Sale of Bonds 4.53 0.28
Liabilities Written Back as no Longer Required 6.94 2.56
Provision for Gratuity no longer required written back - 3.60
Provision for Doubtful Debts Written Back - 13.40
Profit on Cancellation of Forward/ Swap Contracts 44.20 2.36
Exchange Gain (Net) - 125.94
Job Work and Processing Charges 2.25 25.69
Excise and Sales Tax Benefits 585.52 408.05
Interest on Income Tax Refund 11.44 -
Gain on disposal of a Joint Venture - 53.45
Miscellaneous 51.96 27.01
730.10 674.20
Share in Joint Venture 6.58 9.41
736.68 683.61
SCHEDULE 15 : MATERIALS AND MANUFACTURING EXPENSES
Materials Consumed (Refer Note 21 on Schedule 19)
Opening Stock of Raw Material, Work-in-Process, Finished Goods and Traded Goods 3,351.88 3,838.38
Less: Adjustment on Demerger of Marketing Division - 1,931.46
3,351.88 1,906.92
Add: Purchases of Raw Material and Traded Goods 11,474.69 10,477.40
14,826.57 12,384.32
Less: Closing Stock of Raw Material, Work-in-Process, Finished Goods and Traded Goods 4,339.50 3,351.88
10,487.07 9,032.44
Manufacturing Expenses
Stores and Spares Consumed 407.31 278.13
Dyes and Chemicals Consumed 1,322.87 1,306.45
Contract Labour Charges 395.82 336.29
Job Work Expenses 402.98 207.78
Excise Duty On Closing Stocks (5.27) 7.59
Power, Fuel and Water Charges 1,876.32 1,673.18
Packing Charges 974.29 951.07
Repairs and Maintenance:
- Plant and Machinery 117.91 52.98
- Factory Building 22.14 15.90
5,514.37 4,829.37
Share in Joint Venture 116.19 448.89
16,117.63 14,310.70

106
As At As At March 31, 2011 March 31, 2010 (Rs. million) (Rs. million)
SCHEDULES ANNEXED TO AND FORMING PART OF CONSOLIDATED PROFIT AND LOSS ACCOUNT FOR THE YEAR ENDED MARCH 31,2011
SCHEDULE 16 : EMPLOYEES’ REMUNERATION AND BENEFITS
Salaries, Wages, Allowances and Other Benefits 1,424.56 1,106.39
Contribution to Provident and Other Funds (Refer Note 16 on Schedule 19) 148.19 99.16
Managerial Remuneration 17.43 34.96
Staff and Labour Welfare 67.45 59.37
1,657.63 1,299.88
Share in Joint Venture 13.01 16.62
1,670.64 1,316.50
SCHEDULE 17 : SELLING, ADMINISTRATION AND OTHER EXPENSES
Claims, Discounts and Rebates 107.75 111.43
Brokerage and Commission 20.37 9.07
Freight, Forwarding and Coolie Charges 97.53 161.70
Repairs and Maintenance - Others 16.63 11.76
Directors’ Sitting Fees 0.43 0.16
Rent (Refer Note 19 on Schedule 19) 212.37 177.34
Rates and Taxes 60.93 62.23
Stamp Duty Expense - 2.50
Printing and Stationery 8.64 7.20
Travelling and Conveyance 94.14 85.96
Legal and Professional Charges 79.65 51.40
Security Expenses 16.70 13.17
Insurance 38.79 34.53
Communication 14.13 10.39
Postage and Courier 5.31 4.18
Loss on Sale/ Discarding of Fixed Assets (Net) 15.25 10.91
Loss on Redemption/ Sale of Units in Mutual Funds 0.03 -
Bad Debts 1.57 13.40
Design Development and Testing Expenses 25.60 10.41
Royalty 12.98 11.89
Advertising and Sales Promotion 21.75 27.36
Donations 15.75 16.50
Auditors’ Remuneration
- As Auditors 8.97 3.97
- In other capacity - As Tax Auditors 0.30 0.27
- Certification and Other Matters 1.61 0.86
- Out of Pocket Expenses 0.01 0.14
Exchange Loss (Net) 78.13 -
Miscellaneous 91.82 48.23
1,047.14 886.96
Share in Joint Venture 9.90 13.71
1,057.04 900.67
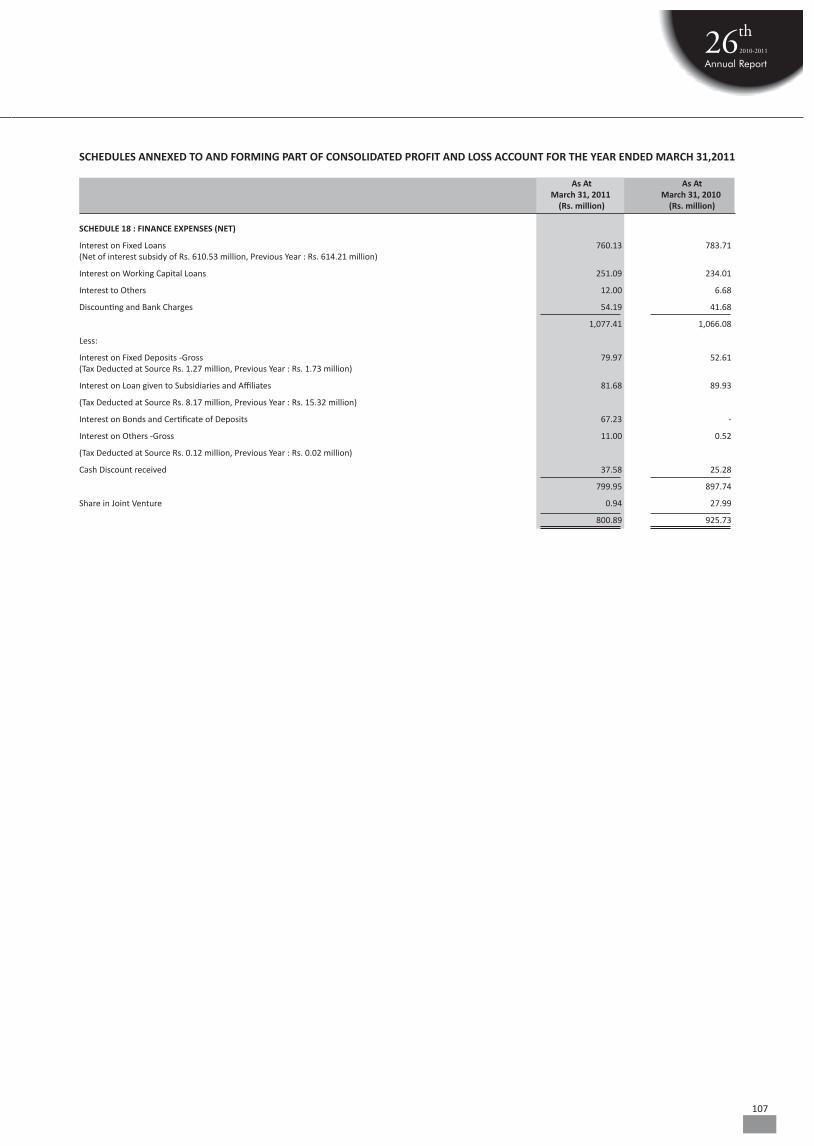
107
As At As At March 31, 2011 March 31, 2010 (Rs. million) (Rs. million)
SCHEDULES ANNEXED TO AND FORMING PART OF CONSOLIDATED PROFIT AND LOSS ACCOUNT FOR THE YEAR ENDED MARCH 31,2011
SCHEDULE 18 : FINANCE EXPENSES (NET)
Interest on Fixed Loans 760.13 783.71 (Net of interest subsidy of Rs. 610.53 million, Previous Year : Rs. 614.21 million)
Interest on Working Capital Loans 251.09 234.01
Interest to Others 12.00 6.68
Discounting and Bank Charges 54.19 41.68
1,077.41 1,066.08
Less:
Interest on Fixed Deposits -Gross 79.97 52.61 (Tax Deducted at Source Rs. 1.27 million, Previous Year : Rs. 1.73 million)
Interest on Loan given to Subsidiaries and Affiliates 81.68 89.93
(Tax Deducted at Source Rs. 8.17 million, Previous Year : Rs. 15.32 million)
Interest on Bonds and Certificate of Deposits 67.23 -
Interest on Others -Gross 11.00 0.52
(Tax Deducted at Source Rs. 0.12 million, Previous Year : Rs. 0.02 million)
Cash Discount received 37.58 25.28
799.95 897.74
Share in Joint Venture 0.94 27.99
800.89 925.73

108
SCHEDULE – 19 : NOTES TO ACCOUNTS
1) Significant Accounting Policies
A. Basis of Accounting
The consolidated financial statements are prepared under historical cost convention in accordance with generally accepted accounting principles applicable in India and the Accounting Standards notified under Sub Section (3C) of Section 211 of the Companies Act, 1956 (“The Act”) and other relevant provisions of the Act .
B. Principles of Consolidation
(i) The consolidated financial statements relate to Welspun India Limited (the “Company”), its Subsidiary Companies, Joint Venture Company and Associate Companies. The consolidated financial statements have been prepared on the following basis:
(a) The financial statements of the Company and its Subsidiary Companies have been combined on a line-by-line basis by adding together the book values of like items of assets, liabilities, income and expenses, after fully eliminating intra-group balances, intra-group transactions and resulting unrealised profits or losses on intra-group transactions.
(b) The difference between the cost of investment in the subsidiaries over the Company’s portion of equity of the subsidiary is recognised in the financial statements as Goodwill or Capital Reserve.
(c) In the consolidated financial statements, the Company has reported its interest in the Joint Venture Companies, using proportionate consolidation method whereby the Company’s share of each of the assets, liabilities, income and expenses of the jointly controlled entities is reported as separate line items, after eliminating proportionate unrealised profits or losses attributable to the interest of the Company.
(d) Investments in Associates have been accounted for under AS-23 using equity method whereby the investment is initially recorded at cost, identifying any goodwill/ capital reserve arising at the time of acquisition. The carrying amount of the investment is adjusted thereafter for the post acquisition change in the investor’s share of net assets of the investee.
The consolidated statement of profit and loss reflects the investor’s share of the results of operations of the investee.
(e) The consolidated financial statements have been prepared using uniform accounting policies for like transactions and other events in similar circumstances and are prepared to the extent possible, in the same manner as the Company’s separate financial statements.
(ii) The Subsidiary Companies, Joint Venture Company and Associate Companies considered in the consolidated financial statements are:
Name of the Company Relationship Country of % Voting Power Incorporation held as at March 31, 2011
Welspun AG (WAG) Subsidiary Switzerland 100.00
Welspun Mexico S.A. de C.V (WMEX) (Held through WAG) Subsidiary Mexico 100.00
Besa Developers and Infrastructure Private Limited (BESA) Subsidiary India 100.00
Welspun Zucchi Textiles Limited (WZTL) Joint Venture India 50.00
Welspun USA Inc. (WUSA) Associate U.S.A. 10.94
SCHEDULES ANNEXED TO AND FORMING PART OF THE CONSOLIDATED BALANCE SHEET AS AT MARCH 31, 2011 AND CONSOLIDATED PROFIT AND LOSS ACCOUNT FOR THE YEAR ENDED MARCH, 2011
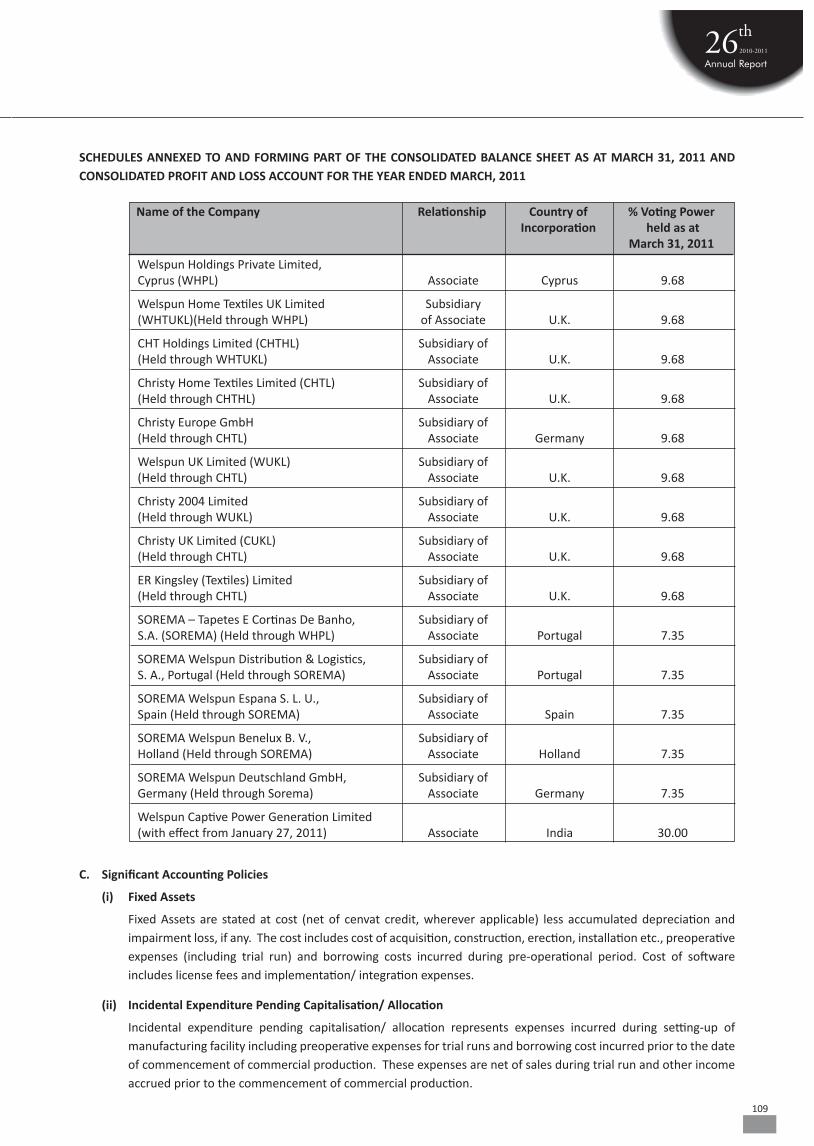
109
SCHEDULES ANNEXED TO AND FORMING PART OF THE CONSOLIDATED BALANCE SHEET AS AT MARCH 31, 2011 AND CONSOLIDATED PROFIT AND LOSS ACCOUNT FOR THE YEAR ENDED MARCH, 2011
Name of the Company Relationship Country of % Voting Power Incorporation held as at March 31, 2011
Welspun Holdings Private Limited, Cyprus (WHPL) Associate Cyprus 9.68
Welspun Home Textiles UK Limited Subsidiary (WHTUKL)(Held through WHPL) of Associate U.K. 9.68
CHT Holdings Limited (CHTHL) Subsidiary of (Held through WHTUKL) Associate U.K. 9.68
Christy Home Textiles Limited (CHTL) Subsidiary of (Held through CHTHL) Associate U.K. 9.68
Christy Europe GmbH Subsidiary of (Held through CHTL) Associate Germany 9.68
Welspun UK Limited (WUKL) Subsidiary of (Held through CHTL) Associate U.K. 9.68
Christy 2004 Limited Subsidiary of (Held through WUKL) Associate U.K. 9.68
Christy UK Limited (CUKL) Subsidiary of (Held through CHTL) Associate U.K. 9.68
ER Kingsley (Textiles) Limited Subsidiary of (Held through CHTL) Associate U.K. 9.68
SOREMA – Tapetes E Cortinas De Banho, Subsidiary of S.A. (SOREMA) (Held through WHPL) Associate Portugal 7.35
SOREMA Welspun Distribution & Logistics, Subsidiary of S. A., Portugal (Held through SOREMA) Associate Portugal 7.35
SOREMA Welspun Espana S. L. U., Subsidiary of Spain (Held through SOREMA) Associate Spain 7.35
SOREMA Welspun Benelux B. V., Subsidiary of Holland (Held through SOREMA) Associate Holland 7.35
SOREMA Welspun Deutschland GmbH, Subsidiary of Germany (Held through Sorema) Associate Germany 7.35
Welspun Captive Power Generation Limited (with effect from January 27, 2011) Associate India 30.00
C. Significant Accounting Policies
(i) Fixed Assets
Fixed Assets are stated at cost (net of cenvat credit, wherever applicable) less accumulated depreciation and impairment loss, if any. The cost includes cost of acquisition, construction, erection, installation etc., preoperative expenses (including trial run) and borrowing costs incurred during pre-operational period. Cost of software includes license fees and implementation/ integration expenses.
(ii) Incidental Expenditure Pending Capitalisation/ Allocation
Incidental expenditure pending capitalisation/ allocation represents expenses incurred during setting-up of manufacturing facility including preoperative expenses for trial runs and borrowing cost incurred prior to the date of commencement of commercial production. These expenses are net of sales during trial run and other income accrued prior to the commencement of commercial production.

110
SCHEDULES ANNEXED TO AND FORMING PART OF THE CONSOLIDATED BALANCE SHEET AS AT MARCH 31, 2011 AND CONSOLIDATED PROFIT AND LOSS ACCOUNT FOR THE YEAR ENDED MARCH, 2011
(iii) Borrowing Costs
Borrowing costs directly attributable to the acquisition/ construction of fixed assets are apportioned to the cost of the fixed assets up to the date on which the asset is put to use/ commissioned.
(iv) Depreciation and Amortisation
(a) Depreciation on Fixed Assets is provided on the straight-line method so as to write off the cost of fixed assets over estimated useful lives of the assets. Depreciation on additions/ deletions to fixed assets is calculated pro-rata from/ up to the date of such additions/ deletions.
(b) Computer software is amortised on the straight-line method over a period of five years.
(c) Leasehold Land is amortised over the period of lease in case of a jointly controlled entity.
(d) Amortisation of leasehold improvements is computed on the straight line method over the term of the related lease including extensions which are reasonably expected to occur, which is not in excess of the estimated useful lives of such improvements.
(e) Goodwill on consolidation is tested for impairment on an annual basis.
(f) Development Expenditure is amortised on a straight line basis over a period of 3 years.
(v) Investments
(a) Long term investments are stated at cost less provision, if any, for permanent diminution in value. Current investments are carried at the lower of cost and fair value.
(b) Investment in Associate is accounted for using the equity method (Refer note 1(B)(i)(e) above).
(vi) Inventories
(a) Inventories are valued at lower of cost and net realisable value.
(b) Cost of raw materials and stores and spares is determined on weighted average basis except in case of jointly controlled entities, where the same is determined on first-in-first-out basis. Cost of traded goods is determined on weighted average basis. Cost of work-in-process and finished goods comprises of raw material, direct labour, other direct costs and related overheads but exclude interest expense. Net realisable value is the estimate of the selling price in the ordinary course of the business, less the estimated costs of completion and estimated selling expenses.
(vii) Accounting for Taxes on Income/ Minimum Alternate Tax Credit
(a) Current Taxation
The current tax is determined as the amount of tax payable in respect of taxable income for the year.
(b) Deferred Taxation
• Deferred tax resulting from timing differences between book and tax profits is accounted for under the liability method, at the current/ substantially enacted rate of tax to the extent that the timing differences are expected to crystallise.
• Deferred tax assets arising in situations where there are brought forward losses and unabsorbed depreciation, to the extent deferred tax amount exceeds net deferred tax liabilities, are recognised only when there is a virtual certainty supported by convincing evidence that such assets will be realised.
(c) Minimum Alternate Tax Credit
Minimum Alternate Tax (MAT) paid in accordance with tax laws, which give rise to future economic benefits in the form of adjustment of future tax liability, is recognized as an asset only when, based on convincing
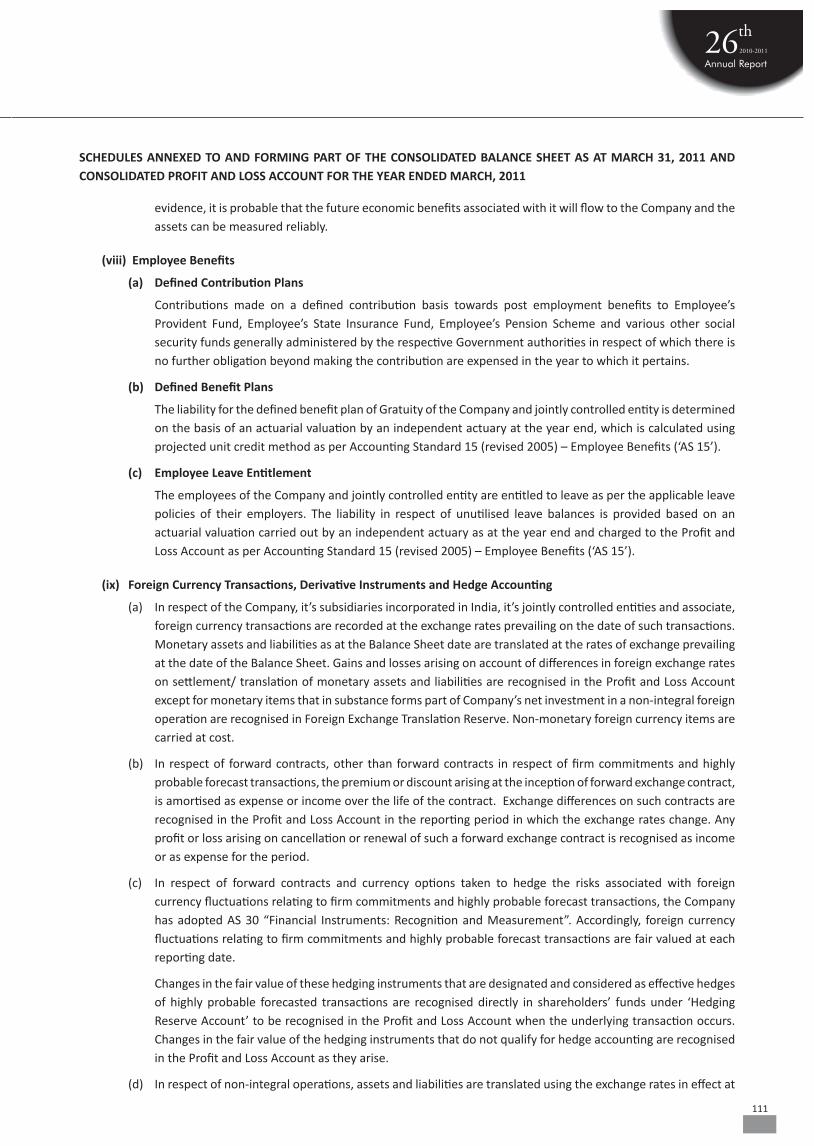
111
SCHEDULES ANNEXED TO AND FORMING PART OF THE CONSOLIDATED BALANCE SHEET AS AT MARCH 31, 2011 AND CONSOLIDATED PROFIT AND LOSS ACCOUNT FOR THE YEAR ENDED MARCH, 2011
evidence, it is probable that the future economic benefits associated with it will flow to the Company and the assets can be measured reliably.
(viii) Employee Benefits
(a) Defined Contribution Plans
Contributions made on a defined contribution basis towards post employment benefits to Employee’s Provident Fund, Employee’s State Insurance Fund, Employee’s Pension Scheme and various other social security funds generally administered by the respective Government authorities in respect of which there is no further obligation beyond making the contribution are expensed in the year to which it pertains.
(b) Defined Benefit Plans
The liability for the defined benefit plan of Gratuity of the Company and jointly controlled entity is determined on the basis of an actuarial valuation by an independent actuary at the year end, which is calculated using projected unit credit method as per Accounting Standard 15 (revised 2005) – Employee Benefits (‘AS 15’).
(c) Employee Leave Entitlement
The employees of the Company and jointly controlled entity are entitled to leave as per the applicable leave policies of their employers. The liability in respect of unutilised leave balances is provided based on an actuarial valuation carried out by an independent actuary as at the year end and charged to the Profit and Loss Account as per Accounting Standard 15 (revised 2005) – Employee Benefits (‘AS 15’).
(ix) Foreign Currency Transactions, Derivative Instruments and Hedge Accounting
(a) In respect of the Company, it’s subsidiaries incorporated in India, it’s jointly controlled entities and associate, foreign currency transactions are recorded at the exchange rates prevailing on the date of such transactions. Monetary assets and liabilities as at the Balance Sheet date are translated at the rates of exchange prevailing at the date of the Balance Sheet. Gains and losses arising on account of differences in foreign exchange rates on settlement/ translation of monetary assets and liabilities are recognised in the Profit and Loss Account except for monetary items that in substance forms part of Company’s net investment in a non-integral foreign operation are recognised in Foreign Exchange Translation Reserve. Non-monetary foreign currency items are carried at cost.
(b) In respect of forward contracts, other than forward contracts in respect of firm commitments and highly probable forecast transactions, the premium or discount arising at the inception of forward exchange contract, is amortised as expense or income over the life of the contract. Exchange differences on such contracts are recognised in the Profit and Loss Account in the reporting period in which the exchange rates change. Any profit or loss arising on cancellation or renewal of such a forward exchange contract is recognised as income or as expense for the period.
(c) In respect of forward contracts and currency options taken to hedge the risks associated with foreign currency fluctuations relating to firm commitments and highly probable forecast transactions, the Company has adopted AS 30 “Financial Instruments: Recognition and Measurement”. Accordingly, foreign currency fluctuations relating to firm commitments and highly probable forecast transactions are fair valued at each reporting date.
Changes in the fair value of these hedging instruments that are designated and considered as effective hedges of highly probable forecasted transactions are recognised directly in shareholders’ funds under ‘Hedging Reserve Account’ to be recognised in the Profit and Loss Account when the underlying transaction occurs. Changes in the fair value of the hedging instruments that do not qualify for hedge accounting are recognised in the Profit and Loss Account as they arise.
(d) In respect of non-integral operations, assets and liabilities are translated using the exchange rates in effect at
112
SCHEDULES ANNEXED TO AND FORMING PART OF THE CONSOLIDATED BALANCE SHEET AS AT MARCH 31, 2011 AND CONSOLIDATED PROFIT AND LOSS ACCOUNT FOR THE YEAR ENDED MARCH, 2011
the balance sheet date, for revenue, costs and expenses using the average exchange rates prevailing during the reporting periods and for share capital, using the exchange rate at the date of transaction. The resultant translation exchange gain/ loss has been disclosed as Foreign Exchange Translation Reserve under Reserves and Surplus.
(x) Revenue Recognition
i. Sales revenue is recognised on transfer of significant risks and rewards of ownership of the goods to the buyer. Domestic sales are recognised on dispatch to customers. Export sales are recognised on the date of cargo receipts, bill of lading or other relevant documents, in accordance with the terms and conditions for sales. Realised exchange differences on export debtors are included in sales.
ii. In case of sales made by the Company as Support Manufacturer, export benefits arising from Duty Entitlement Pass Book (DEPB) are recognised on export of such goods in accordance with the agreed terms and conditions with customers. In case of direct exports made by the Company export benefits arising from DEPB, Duty Drawback scheme and Focus Market Scheme are recognised on shipment of direct exports.
iii. Dividends are accounted for when the right to receive dividend is established.
(xi) Government Grants
Government grants are accounted for when it is reasonably certain that ultimate collection will be made. Capital grants relating to specific assets are reduced from the gross value of the Fixed Assets. Revenue grants, in the nature of interest subsidy under the Technology Upgradation Fund Scheme (TUFS) are adjusted against ‘Interest on Fixed Loans’.
(xii) Impairment of Assets
The Company assesses at each balance sheet date whether there is any indication that an asset may be impaired. If any such indication exists, the Company estimate the recoverable amount of the asset. If such recoverable amount of the asset or recoverable amount of the cash generating unit to which the asset belongs is less than its carrying amount, the carrying amount is reduced to its recoverable amount. The reduction is treated as an impairment loss and is recognised in the Profit and Loss Account. If at the Balance Sheet date there is an indication that if a previously assessed impairment loss no longer exists, the recoverable amount is reassessed and the asset is reflected at the recoverable amount.
(xiii) Provisions and Contingent Liabilities
The Company recognizes a provision when there is a present obligation as a result of a past event that probably requires an outflow of resources and a reliable estimate can be made of the amount of the obligation. A disclosure for a contingent liability is made when there is a possible obligation or a present obligation that may, but probably will not, require an outflow of resources. Where there is a possible obligation or a present obligation but the likelihood of outflow of resources is remote, no provision or disclosure as specified in Accounting Standard 29 – “ Provisions, Contingent Liabilities and Contingent Assets”, issued by the Institute of Chartered Accountants of India is made.
(xiv) Employees Stock Option Schemes
Stock options granted to employees under Employee Stock Option Schemes are accounted as per the accounting treatment prescribed in the Guidance Note on Accounting for Employee Share-based Payments issued by the Institute of Chartered Accountants of India.
(xv) Accounting Estimates
The preparation of financial statements requires estimates and assumptions to be made that affect the reported

113
amounts of assets and liabilities on the date of financial statements and the reported amounts of revenue and expenses during the reporting period. Difference between the actual results and the estimates are recognized in the period in which the results are known/ materialised.
SCHEDULES ANNEXED TO AND FORMING PART OF THE CONSOLIDATED BALANCE SHEET AS AT MARCH 31, 2011 AND CONSOLIDATED PROFIT AND LOSS ACCOUNT FOR THE YEAR ENDED MARCH, 2011
2) Contingent Liabilities:
Description As at As at March 31, 2011 March 31, 2010 Rs. million Rs. million
318.58 318.58
69.57 69.57
3.67 3.50
50.46 47.98
0.16 0.16
2.00 1.91
Excise, Customs and Service Tax Alleged improper re-credit of duty paid through PLA under Notification no. 39/2001 –CE dated July 31, 2001 in respect of goods sold from the factory during the period from February 2006 to September 2007. The Assistant Commissioner of Central Excise passed the order against the Company. The Company paid pre-deposit of Rs. 100 million as required by Central Excise authorities and obtained stay on payment of remaining amount. The case was remanded back to the lower authority to consider the claim of the Company by Commissioner Appeals.
Further, separate show cause notice had been issued by Commissioner of Central Excise seeking recovery of allegedly improper re-credit of duty along with interest and penalty. The Company is in the process of filing reply against this show cause notice. The case is remanded back by Tribunal to lower authority and directed them for reassessments of liability vide order dated March 29, 2011.
Alleged improper grant of refund for duty paid through PLA by Assistant Commissioner under Rule 18 of Central Excise Rules during the period from September 2005 to July 2006. The Commissioner (Appeals) of Customs and Central Excise had passed the order against the Company. The Company has filed Revision Application with the Joint Secretary, Ministry of Finance, Department of Revenue.
Alleged improper Cenvat credit availed and non-payment of excise duty under Notification No. 214/86 – CE dated 25-03-1986, on furnace oil used for manufacturing of goods on job work during the period April 2002 to May 2005. The Company has filed its reply against the show cause notices issued by Joint Commissioner and Commissioner of Customs and Central Excise, Daman.
Alleged improper abatement of service tax on payments made to Goods Transport Agency under Notification No. 32/04-ST dated December 31, 2004. The Company has filed its reply against the show cause notice issued by the Commissioner of Central Excise and Customs, Daman.
Alleged availment of service tax credit based on improper documents. The Company has received an order from Commissioner, Central Excise and Customs, Daman demanding the amount of duty, interest and penalty. The Company filed an appeal against the order with Commissioner of Central Excise & Customs (Appeals), Daman
Alleged improper Cenvat credit availed on “racks” classified as capital goods, which are used for storage of finished goods. The Company received an order from Additional Commissioner, Central Excise & Customs; Daman dated 11.02.2009 demanding the amount of duty, interest and penalty. The Company paid Rs. 0.69 million under protest and filed an appeal against the order with Commissioner of Central Excise & Customs (Appeals), Daman in March 2009. The Company has obtained stay order with respect to the payment of duty.
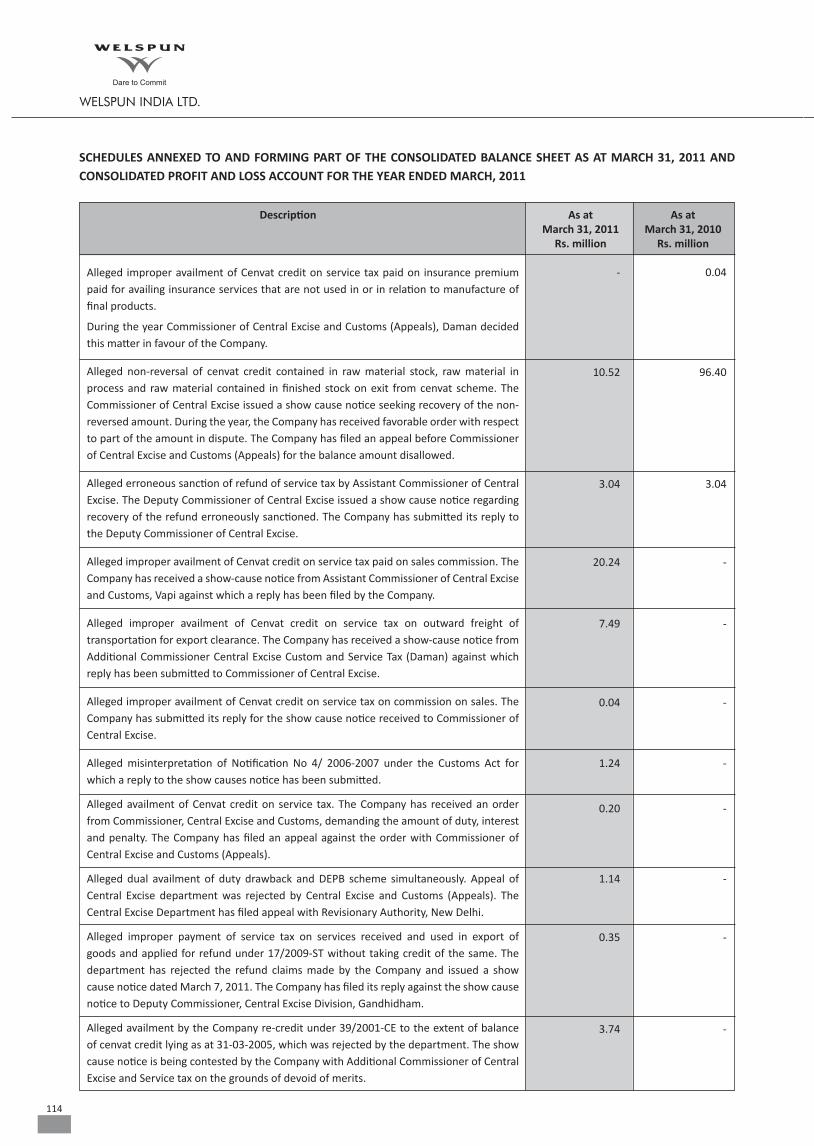
114
SCHEDULES ANNEXED TO AND FORMING PART OF THE CONSOLIDATED BALANCE SHEET AS AT MARCH 31, 2011 AND CONSOLIDATED PROFIT AND LOSS ACCOUNT FOR THE YEAR ENDED MARCH, 2011
- 0.04
Description As at As at March 31, 2011 March 31, 2010 Rs. million Rs. million
10.52 96.40
3.04 3.04
20.24 -
0.04 -
1.24 -
1.14 -
0.35 -
3.74 -
0.20 -
7.49 -
Alleged improper availment of Cenvat credit on service tax paid on insurance premium paid for availing insurance services that are not used in or in relation to manufacture of final products.
During the year Commissioner of Central Excise and Customs (Appeals), Daman decided this matter in favour of the Company.
Alleged non-reversal of cenvat credit contained in raw material stock, raw material in process and raw material contained in finished stock on exit from cenvat scheme. The Commissioner of Central Excise issued a show cause notice seeking recovery of the non-reversed amount. During the year, the Company has received favorable order with respect to part of the amount in dispute. The Company has filed an appeal before Commissioner of Central Excise and Customs (Appeals) for the balance amount disallowed.
Alleged erroneous sanction of refund of service tax by Assistant Commissioner of Central Excise. The Deputy Commissioner of Central Excise issued a show cause notice regarding recovery of the refund erroneously sanctioned. The Company has submitted its reply to the Deputy Commissioner of Central Excise.
Alleged improper availment of Cenvat credit on service tax paid on sales commission. The Company has received a show-cause notice from Assistant Commissioner of Central Excise and Customs, Vapi against which a reply has been filed by the Company.
Alleged improper availment of Cenvat credit on service tax on outward freight of transportation for export clearance. The Company has received a show-cause notice from Additional Commissioner Central Excise Custom and Service Tax (Daman) against which reply has been submitted to Commissioner of Central Excise.
Alleged improper availment of Cenvat credit on service tax on commission on sales. The Company has submitted its reply for the show cause notice received to Commissioner of Central Excise.
Alleged misinterpretation of Notification No 4/ 2006-2007 under the Customs Act for which a reply to the show causes notice has been submitted.
Alleged availment of Cenvat credit on service tax. The Company has received an order from Commissioner, Central Excise and Customs, demanding the amount of duty, interest and penalty. The Company has filed an appeal against the order with Commissioner of Central Excise and Customs (Appeals).
Alleged dual availment of duty drawback and DEPB scheme simultaneously. Appeal of Central Excise department was rejected by Central Excise and Customs (Appeals). The Central Excise Department has filed appeal with Revisionary Authority, New Delhi.
Alleged improper payment of service tax on services received and used in export of goods and applied for refund under 17/2009-ST without taking credit of the same. The department has rejected the refund claims made by the Company and issued a show cause notice dated March 7, 2011. The Company has filed its reply against the show cause notice to Deputy Commissioner, Central Excise Division, Gandhidham.
Alleged availment by the Company re-credit under 39/2001-CE to the extent of balance of cenvat credit lying as at 31-03-2005, which was rejected by the department. The show cause notice is being contested by the Company with Additional Commissioner of Central Excise and Service tax on the grounds of devoid of merits.
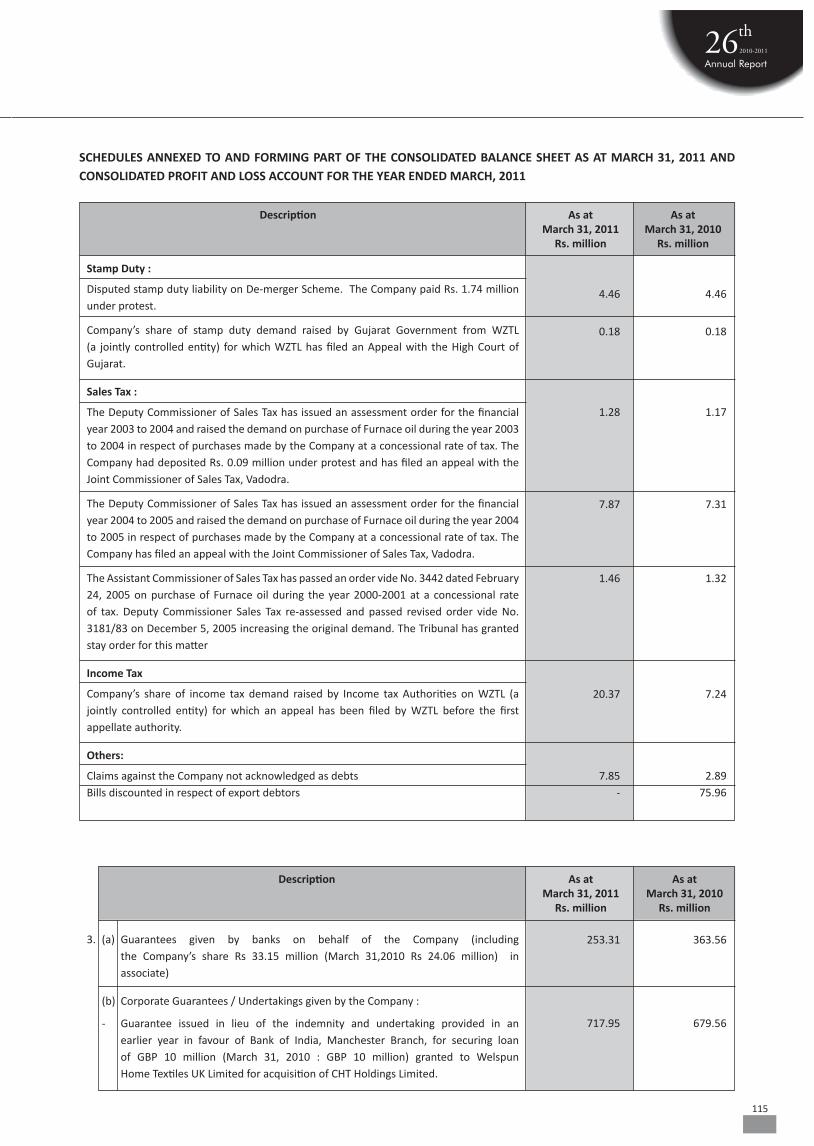
115
SCHEDULES ANNEXED TO AND FORMING PART OF THE CONSOLIDATED BALANCE SHEET AS AT MARCH 31, 2011 AND CONSOLIDATED PROFIT AND LOSS ACCOUNT FOR THE YEAR ENDED MARCH, 2011
Description As at As at March 31, 2011 March 31, 2010 Rs. million Rs. million
4.46 4.46
0.18 0.18
1.28 1.17
7.87 7.31
1.46 1.32
20.37 7.24
7.85 2.89 - 75.96
Stamp Duty :
Disputed stamp duty liability on De-merger Scheme. The Company paid Rs. 1.74 million under protest.
Company’s share of stamp duty demand raised by Gujarat Government from WZTL (a jointly controlled entity) for which WZTL has filed an Appeal with the High Court of Gujarat.
Sales Tax :
The Deputy Commissioner of Sales Tax has issued an assessment order for the financial year 2003 to 2004 and raised the demand on purchase of Furnace oil during the year 2003 to 2004 in respect of purchases made by the Company at a concessional rate of tax. The Company had deposited Rs. 0.09 million under protest and has filed an appeal with the Joint Commissioner of Sales Tax, Vadodra.
The Deputy Commissioner of Sales Tax has issued an assessment order for the financial year 2004 to 2005 and raised the demand on purchase of Furnace oil during the year 2004 to 2005 in respect of purchases made by the Company at a concessional rate of tax. The Company has filed an appeal with the Joint Commissioner of Sales Tax, Vadodra.
The Assistant Commissioner of Sales Tax has passed an order vide No. 3442 dated February 24, 2005 on purchase of Furnace oil during the year 2000-2001 at a concessional rate of tax. Deputy Commissioner Sales Tax re-assessed and passed revised order vide No. 3181/83 on December 5, 2005 increasing the original demand. The Tribunal has granted stay order for this matter
Income Tax
Company’s share of income tax demand raised by Income tax Authorities on WZTL (a jointly controlled entity) for which an appeal has been filed by WZTL before the first appellate authority.
Others:
Claims against the Company not acknowledged as debts Bills discounted in respect of export debtors
Description As at As at March 31, 2011 March 31, 2010 Rs. million Rs. million
253.31 363.56
717.95 679.56
3. (a) Guarantees given by banks on behalf of the Company (including the Company’s share Rs 33.15 million (March 31,2010 Rs 24.06 million) in associate)
(b) Corporate Guarantees / Undertakings given by the Company :
- Guarantee issued in lieu of the indemnity and undertaking provided in an earlier year in favour of Bank of India, Manchester Branch, for securing loan of GBP 10 million (March 31, 2010 : GBP 10 million) granted to Welspun Home Textiles UK Limited for acquisition of CHT Holdings Limited.

116
SCHEDULES ANNEXED TO AND FORMING PART OF THE CONSOLIDATED BALANCE SHEET AS AT MARCH 31, 2011 AND CONSOLIDATED PROFIT AND LOSS ACCOUNT FOR THE YEAR ENDED MARCH, 2011
384.41 387.04
847.31 853.10
- 210.00
891.90 # 808.20
3,593.00 3,593.00
900.00 * -
400.00 * -
654.00 * -
108.49 29.13
839.23 1,046.73
- Guarantees aggregating USD 8.62 million (March 31, 2010 : USD 8.62 million) on behalf of Welspun USA Inc. (WUSA) to Nautica Apparel Inc. in respect of all payment obligations of WUSA under license agreements entered between WUSA and Nautica Apparel Inc.
- Guarantee of USD 19 million (March 31, 2010: USD 19 million) on behalf of WELUSA to Verde Chihuahua Industrial S de RL de CV (Verde), in respect of all payments by WUSA as a tenant under lease agreement between WELUSA and Verde.
- Guarantee on behalf of Welspun Global Brands Limited (WGBL) in favour of Bank of India to secure repayment of loans extended / to be extended by Bank of India to WGBL.
- Guarantee of USD 20 million (March 31, 2010: USD 18 million) on behalf of WUSA in favour of Bank of Baroda, New York Branch to secure repayment of loans extended/ to be extended by Bank of Baroda to WUSA.
- Guarantee on behalf of WGBL in favour of consortium of Bankers led by State Bank of Bikaner and Jaipur (“SBBJ Consortium”) to secure repayment of facilities extended/ to be extended by SBBJ Consortium to WGBL. In addition guarantee extends to facility of 20% of ad-hoc fund based Working Capital limit under the Gold Card Scheme .
- Guarantee on behalf of Welspun Captive Power Generation Limited (WCPGL) in favour of ICICI Bank to secure repayment of letter of credit facility from ICICI Bank.
- Guarantee on behalf of WGBL in favour of YES Bank to secure repayment of working capital facilities from Yes Bank.
- Guarantee on behalf of WGBL in favour of State Bank of Bikaner and Jaipur (SBBJ) to secure repayment of working capital facilities from SBBJ.
(c) In accordance with the EPCG Scheme, imports of capital goods are allowed to be made duty free and under Advance License Scheme, imports of raw material are allowed to be made duty free, subject to the condition that the Company will fulfill, in future, a specified amount of export obligation within a specified time. Based on the current operating plan, the Company would fulfill its export obligation within the specified time period. Amount of duty saved on imports of above goods against which export obligation is yet to be fulfilled by the Company.
(d) Estimated amount of contracts (net of advances) remaining to be executed on capital account and not provided for.
* These guarantees are subject to approval of the shareholders under Section 372A of the Act.
# Guarantee given during the year of USD 2 million is subject to approval of the shareholders under Section 372A of the Act.
Description As at As at March 31, 2011 March 31, 2010 Rs. million Rs. million

117
4. During the year, the Company has recognised deferred tax assets aggregating Rs. 303.64 million on the incremental unabsorbed Income-tax depreciation arising out of its treatment of certain Excise and Value Added Tax incentives as ‘capital receipts’ for income tax purposes based on the favorable decision received from the Commissioner of Income Tax (Appeals) in its own case and judgment in re Commissioner of Income Tax, Mumbai v/s. Reliance Industries Limited of the Honourable High Court of Judicature at Bombay. However, the judgment given by the High Court of Judicatue at Bombay has been challenged by the tax authorities in the apex court. If the final decision in the matter is eventually decided against the Company, then the carrying value of the deferred tax assets at the period end could be significantly impacted.
5. Pursuant to loan agreement with Welspun USA Inc., the loan outstanding as on March 31, 2011, aggregating Rs. 111.49 million recoverable from Welspun USA Inc. is to be converted into equity investments and pending conversion modalities are completed, the same has been disclosed as Share Application Pending Allotment and grouped under Loans and Advances.
6. As at March 31, 2011, the Company has trade receivables aggregating Rs. 696.02 million, due from a related Company, Welspun Retail Limited (WRL), (March 31, 2010: Rs. 475.93 million). Of the said amount Rs. 108.33 million (March 31, 2010: Rs. 52.07 million) is outstanding for more than one year. WRL continues to incur significant losses from operations which could impact its ability to settle the aforesaid receivables. In order to turnaround its operations, WRL has made a robust plan for widening its reach in the market by using new marketing strategies with aggressive cost reduction programs. Accordingly, in the opinion of the Management, the aforesaid receivable from the said related Company as at March 31, 2011 is considered good and recoverable.
7. Consequent to the demerger of the marketing arm of the Company effective April 1, 2009, the Company is dependent upon Welspun Global Brands Limited (WGBL) for all marketing of its products and WGBL is the Company’s principal customer as regards international sales of its products. Most of the domestic sales of the Company are made to WRL, a subsidiary of WGBL. The Company does not have any long term definitive agreements with either WGBL or WRL for marketing the Company’s products. In the event that WGBL or WRL ceased to purchase or market the Company’s products, it could have an adverse effect on the business of the Company.
8. The Company has issued a corporate guarantee of Rs. 3,593 million (March 31, 2010: Rs. 3,593 million) on behalf of WGBL in favor of a consortium of bankers in relation to post-shipment debt facilities provided by them to WGBL. WGBL has also given a corporate guarantee of Rs. 5,887.40 million (March 31, 2010: Rs. 5,887.40 million) in favour of the consortium of bankers in relation to pre-shipment debt facilities provided by them to the Company. If WGBL is unable to meet their obligation to bankers as they fall due, the Company would be required to pay the guaranteed amounts, which could adversely affect its financial condition and cash flows.
9. (a) The Company has allotted 15,603,000 equity shares of Rs. 10 each at Rs. 100 per share on April 19, 2010 to Qualified Institutional Buyers (QIBs) in accordance with Chapter VIII of the Securities and Exchange Board of India (Issue of Capital and Disclosure Requirements) Regulations, 2009. The equity share issue expenses related to Qualified Institutional Placement (QIP) aggregating to Rs. 87.64 million has been adjusted against Securities Premium Account as per Section 78 of the Act.
(b) Pursuant to the resolution passed in the Annual General Meeting of the Company held on August 31, 2010 for approval of final equity dividend for the year ended March 31, 2010; the Company has paid final dividend of Rs. 88.69 million, including Rs. 15.60 million to QIBs referred supra. The final dividend paid to QIBs has been presented as Final Dividend for earlier year as appropriation from the Profit and Loss Account Balance.
10. On June 30, 2009, the Company issued Employee Stock Options under the Employee Stock Options Scheme (the “Scheme”) to employees of the Company and its subsidiaries with a right to subscribe to equity shares (“New Options”) at a price of Rs. 35.60 per equity share (closing market price as on June 30, 2009) with an option to existing grantees, who were granted options on May 17, 2006 (“Old Options”), to receive New Options on surrender of Old Options.
SCHEDULES ANNEXED TO AND FORMING PART OF THE CONSOLIDATED BALANCE SHEET AS AT MARCH 31, 2011 AND CONSOLIDATED PROFIT AND LOSS ACCOUNT FOR THE YEAR ENDED MARCH, 2011
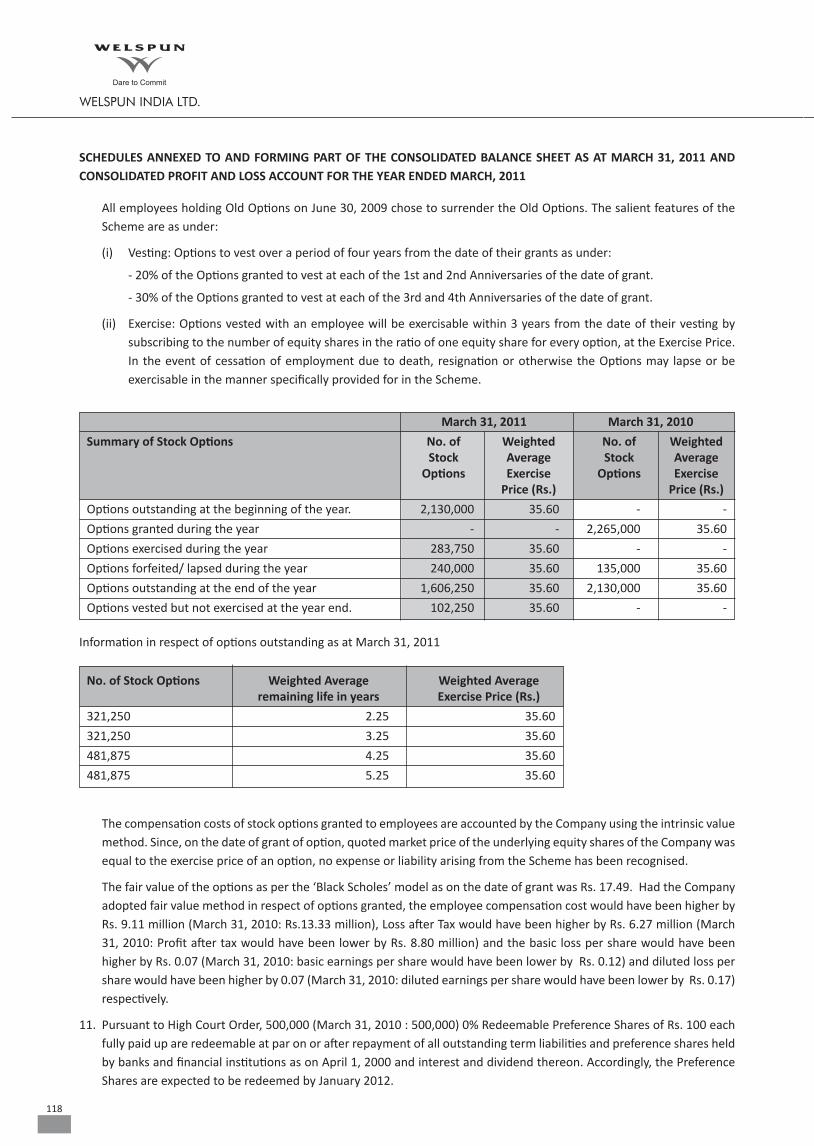
118
SCHEDULES ANNEXED TO AND FORMING PART OF THE CONSOLIDATED BALANCE SHEET AS AT MARCH 31, 2011 AND CONSOLIDATED PROFIT AND LOSS ACCOUNT FOR THE YEAR ENDED MARCH, 2011
All employees holding Old Options on June 30, 2009 chose to surrender the Old Options. The salient features of the Scheme are as under:
(i) Vesting: Options to vest over a period of four years from the date of their grants as under:
- 20% of the Options granted to vest at each of the 1st and 2nd Anniversaries of the date of grant.
- 30% of the Options granted to vest at each of the 3rd and 4th Anniversaries of the date of grant.
(ii) Exercise: Options vested with an employee will be exercisable within 3 years from the date of their vesting by subscribing to the number of equity shares in the ratio of one equity share for every option, at the Exercise Price. In the event of cessation of employment due to death, resignation or otherwise the Options may lapse or be exercisable in the manner specifically provided for in the Scheme.
March 31, 2011 March 31, 2010
Summary of Stock Options No. of Weighted No. of Weighted Stock Average Stock Average Options Exercise Options Exercise Price (Rs.) Price (Rs.)
Options outstanding at the beginning of the year. 2,130,000 35.60 - -
Options granted during the year - - 2,265,000 35.60
Options exercised during the year 283,750 35.60 - -
Options forfeited/ lapsed during the year 240,000 35.60 135,000 35.60
Options outstanding at the end of the year 1,606,250 35.60 2,130,000 35.60
Options vested but not exercised at the year end. 102,250 35.60 - -
Information in respect of options outstanding as at March 31, 2011
No. of Stock Options Weighted Average Weighted Average remaining life in years Exercise Price (Rs.)
321,250 2.25 35.60
321,250 3.25 35.60
481,875 4.25 35.60
481,875 5.25 35.60
The compensation costs of stock options granted to employees are accounted by the Company using the intrinsic value method. Since, on the date of grant of option, quoted market price of the underlying equity shares of the Company was equal to the exercise price of an option, no expense or liability arising from the Scheme has been recognised.
The fair value of the options as per the ‘Black Scholes’ model as on the date of grant was Rs. 17.49. Had the Company adopted fair value method in respect of options granted, the employee compensation cost would have been higher by Rs. 9.11 million (March 31, 2010: Rs.13.33 million), Loss after Tax would have been higher by Rs. 6.27 million (March 31, 2010: Profit after tax would have been lower by Rs. 8.80 million) and the basic loss per share would have been higher by Rs. 0.07 (March 31, 2010: basic earnings per share would have been lower by Rs. 0.12) and diluted loss per share would have been higher by 0.07 (March 31, 2010: diluted earnings per share would have been lower by Rs. 0.17) respectively.
11. Pursuant to High Court Order, 500,000 (March 31, 2010 : 500,000) 0% Redeemable Preference Shares of Rs. 100 each fully paid up are redeemable at par on or after repayment of all outstanding term liabilities and preference shares held by banks and financial institutions as on April 1, 2000 and interest and dividend thereon. Accordingly, the Preference Shares are expected to be redeemed by January 2012.

119
SCHEDULES ANNEXED TO AND FORMING PART OF THE CONSOLIDATED BALANCE SHEET AS AT MARCH 31, 2011 AND CONSOLIDATED PROFIT AND LOSS ACCOUNT FOR THE YEAR ENDED MARCH, 2011
12. In accordance with the Company’s policy given in Note 1(C)(ix)(a) above, net exchange loss of Rs.29.62 million (Previous Year: net exchange gain of Rs. 109.98 million) which includes the Company’s share of net exchange gain of Rs.5.34 million (Previous Year: net exchange loss of Rs. 3.36 million) in jointly controlled entities, has been accounted in the Profit and Loss Account.
13. Borrowing Costs aggregating Rs. Nil (Previous Year: Rs. 23.43 million) (net of interest subsidy of Rs. Nil; Previous Year: Rs. 13.18 million) attributable to the acquisition or construction of qualifying assets are capitalised during the year as part of the cost of such assets.
14. Segment Information for the year ended March 31, 2011:
(i) Information about Primary Business Segment
The Company is exclusively engaged in the business of Home Textiles which, in the context of Accounting Standard 17 on Segment Reporting, issued by the Institute of Chartered Accountants of India, is considered to constitute a single primary segment. Thus, the segment revenue, segment results, total carrying amount of segment assets, total carrying amount of segment liabilities, total cost incurred to acquire segment assets, total amount of charge for depreciation during the year are all as reflected in the financial statements for the year ended March 31, 2011 and as on that date.
(ii) Information about Secondary Geographical Segments
India Outside India Total
March March March March March March 31, 2011 31, 2010 31, 2011 31, 2010 31, 2011 31, 2010
Revenue 19,890.10 17,243.86 658.01 2,127.76 20,548.11 19,371.62
Carrying Amount of Segment Assets 27,847.57 23,488.55 963.46 2,199.44 28,811.03 25,687.99
Capital Expenditure Incurred to acquired segment assets 2,076.65 728.62 8.95 38.67 2,085.60 767.29
(iii) Notes:
(a) The Segment revenue in the geographical segments considered for disclosure are as follows:
- Revenue within India includes sales to customers located within India and earnings in India.
- Revenue outside India includes sales to customers located outside India, earnings outside India and export benefits on sales made to customers located outside India.
(b) Segment revenue and assets include the respective amounts identified to each of the segments and amounts allocated on a reasonable basis.
15. A subsidiary of the Company has one trademark licensing agreement, under which it could utilize certain name on towels.
The future minimum annual royalty obligation as at March 31, 2011 for year ending on March 2012 is Rs 14.67 million.
(Rs. million)

120
SCHEDULES ANNEXED TO AND FORMING PART OF THE CONSOLIDATED BALANCE SHEET AS AT MARCH 31, 2011 AND CONSOLIDATED PROFIT AND LOSS ACCOUNT FOR THE YEAR ENDED MARCH, 2011
I Defined Contribution Plans
a. Employers’ Contribution to Provident Fund
b. Employers’ Contribution to Employee’s State Insurance
c. Employers’ Contribution to Employee’s Pension Scheme, 1995
d Other Social Security Funds *
(Rs. million)
During the year, the Company has recognised the following amounts in the Profit and Loss Account: 2010-2011 2009-2010
- Employers’ Contribution to Provident Fund * 43.04 36.44
- Employers’ Contribution to Employee’s State Insurance * 12.88 9.95
- Employers’ Contribution to Employee’s Pension Scheme * 51.31 44.86
- Other Social Security Funds * 40.96 7.91
148.19 99.16
The Company’s share of expenses in jointly controlled entities recognised in the Profit and Loss Account. 1.24 1.21
* Included in Contribution to Provident and Other Funds (Refer Schedule 16)
II Defined Benefit Plan
Contribution to Gratuity Fund
a. Major Assumptions 2010-2011 2009-2010
% p.a. % p.a.
Discount Rate 8.50 8.20
Expected Rate of Return on Plan Assets 8.50 8.50
Salary Escalation Rate @ 8% for 5 years 6.00 and 6% thereafter
@ The estimates for future salary increases considered takes into account the inflation, seniority, promotion and other relevant factors.
b. Change in the Present Value of Obligation 2010-2011 2009-2010
Opening Present Value of Obligation 55.60 52.16
Transfer of to Welspun Global Brands Limited pursuant to demerger scheme - (5.75)
Current Service Cost 19.83 11.73
Interest Cost 4.73 4.28
Benefit/ Exgratia paid (8.37) (6.24)
Actuarial Loss/ (gain) on Obligations 17.77 (0.58)
Closing Present Value of Obligation 89.56 55.60
c. Change in Fair Value of Plan Assets 2010-2011 2009-2010
Opening Fair Value of Plan Assets 65.13 50.55
Expected Return on Plan Assets 5.54 4.30
Actuarial (loss)/ gain on Plan Assets 0.51 14.73
Contributions 35.00 -
Benefits paid (12.17)* (4.45)
Closing Fair Value of Plan Assets 94.01 65.13
of Welspun India Limited. * Includes Gratuity fund balance of Rs. 5.75 million transferred to Welspun Global Brands Limited pursuant to Scheme of demerger
d. Reconciliation of Present Value of Defined Benefit Obligation and As at As at the Fair Value of Assets March 31, March 31, 2011 2010
Present Value of Funded Obligation 89.56 55.60
Fair Value of Plan Assets 94.01 65.13
Funded Status 94.01 65.13
Present Value of Unfunded Obligation - -
Assets recognised in the Balance Sheet and included under Loans and 4.44 9.53 Advances and Other Current Assets (Refer Schedule 11)
16. The Company has classified the various benefits provided to employees as under :-
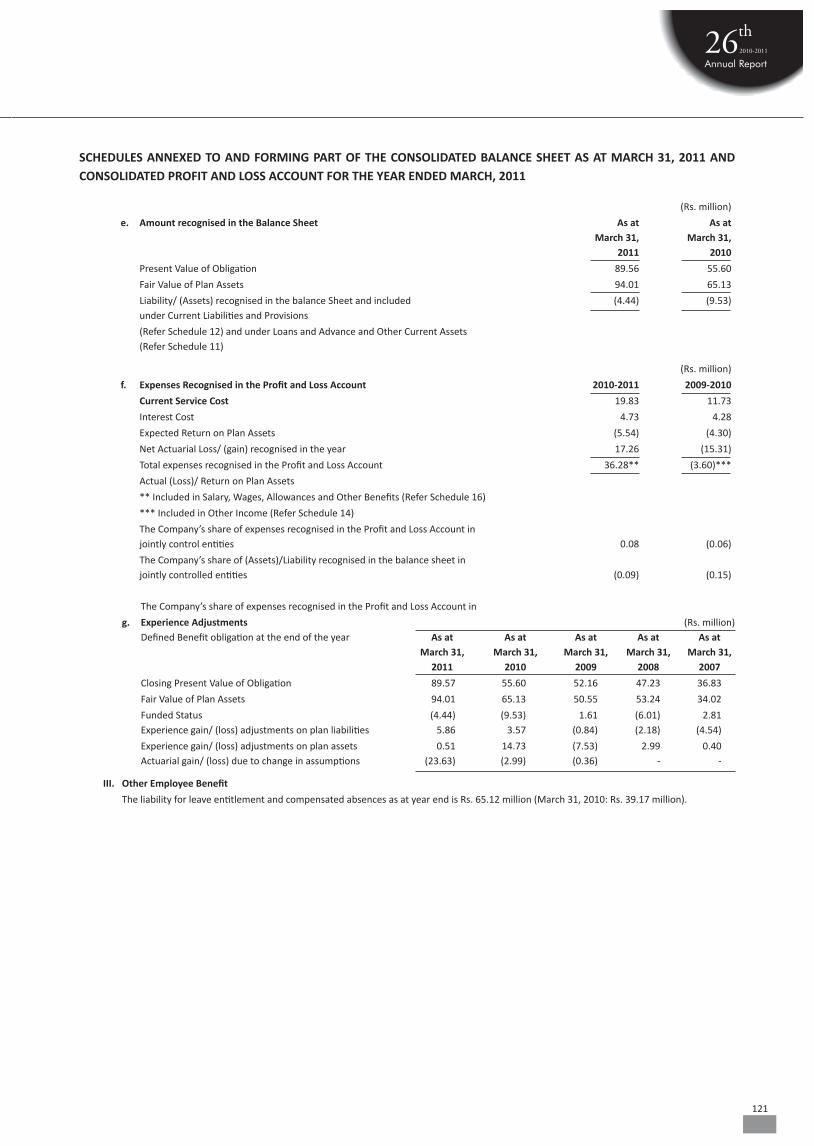
121
(Rs. million)
e. Amount recognised in the Balance Sheet As at As at March 31, March 31, 2011 2010
Present Value of Obligation 89.56 55.60
Fair Value of Plan Assets 94.01 65.13
Liability/ (Assets) recognised in the balance Sheet and included (4.44) (9.53) under Current Liabilities and Provisions
(Refer Schedule 12) and under Loans and Advance and Other Current Assets (Refer Schedule 11)
(Rs. million)
f. Expenses Recognised in the Profit and Loss Account 2010-2011 2009-2010
Current Service Cost 19.83 11.73
Interest Cost 4.73 4.28
Expected Return on Plan Assets (5.54) (4.30)
Net Actuarial Loss/ (gain) recognised in the year 17.26 (15.31)
Total expenses recognised in the Profit and Loss Account 36.28** (3.60)***
Actual (Loss)/ Return on Plan Assets
** Included in Salary, Wages, Allowances and Other Benefits (Refer Schedule 16)
*** Included in Other Income (Refer Schedule 14)
The Company’s share of expenses recognised in the Profit and Loss Account in jointly control entities 0.08 (0.06)
The Company’s share of (Assets)/Liability recognised in the balance sheet in jointly controlled entities (0.09) (0.15)
SCHEDULES ANNEXED TO AND FORMING PART OF THE CONSOLIDATED BALANCE SHEET AS AT MARCH 31, 2011 AND CONSOLIDATED PROFIT AND LOSS ACCOUNT FOR THE YEAR ENDED MARCH, 2011
The Company’s share of expenses recognised in the Profit and Loss Account in
g. Experience Adjustments (Rs. million) Defined Benefit obligation at the end of the year As at As at As at As at As at March 31, March 31, March 31, March 31, March 31, 2011 2010 2009 2008 2007
Closing Present Value of Obligation 89.57 55.60 52.16 47.23 36.83
Fair Value of Plan Assets 94.01 65.13 50.55 53.24 34.02
Funded Status (4.44) (9.53) 1.61 (6.01) 2.81 Experience gain/ (loss) adjustments on plan liabilities 5.86 3.57 (0.84) (2.18) (4.54)
Experience gain/ (loss) adjustments on plan assets 0.51 14.73 (7.53) 2.99 0.40 Actuarial gain/ (loss) due to change in assumptions (23.63) (2.99) (0.36) - -
III. Other Employee Benefit
The liability for leave entitlement and compensated absences as at year end is Rs. 65.12 million (March 31, 2010: Rs. 39.17 million).
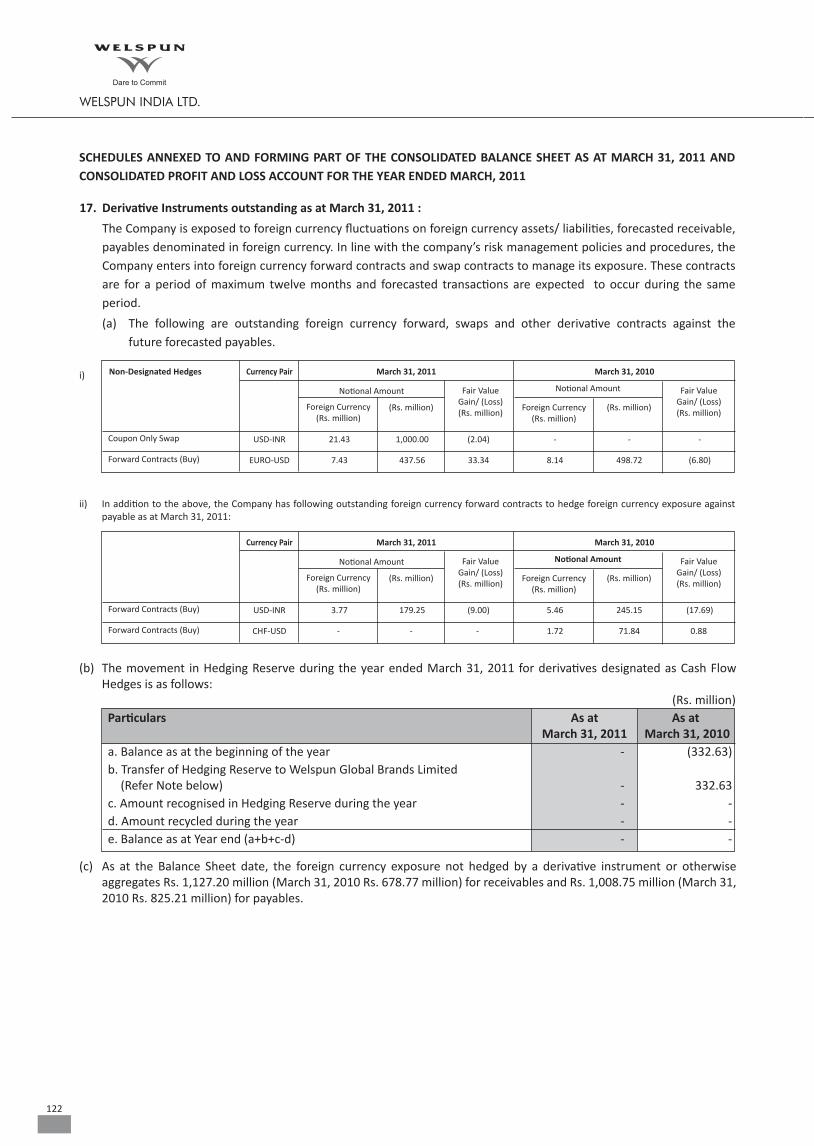
122
(b) The movement in Hedging Reserve during the year ended March 31, 2011 for derivatives designated as Cash Flow Hedges is as follows: (Rs. million) Particulars As at As at March 31, 2011 March 31, 2010 a. Balance as at the beginning of the year - (332.63) b. Transfer of Hedging Reserve to Welspun Global Brands Limited (Refer Note below) - 332.63 c. Amount recognised in Hedging Reserve during the year - - d. Amount recycled during the year - - e. Balance as at Year end (a+b+c-d) - -
(c) As at the Balance Sheet date, the foreign currency exposure not hedged by a derivative instrument or otherwise aggregates Rs. 1,127.20 million (March 31, 2010 Rs. 678.77 million) for receivables and Rs. 1,008.75 million (March 31, 2010 Rs. 825.21 million) for payables.
SCHEDULES ANNEXED TO AND FORMING PART OF THE CONSOLIDATED BALANCE SHEET AS AT MARCH 31, 2011 AND CONSOLIDATED PROFIT AND LOSS ACCOUNT FOR THE YEAR ENDED MARCH, 2011
i) Non-Designated Hedges
Currency Pair
Currency Pair
March 31, 2011
March 31, 2011
March 31, 2010
March 31, 2010
Notional Amount
Notional Amount
Fair Value Gain/ (Loss) (Rs. million)
Fair Value Gain/ (Loss) (Rs. million)
Fair Value Gain/ (Loss) (Rs. million)
Fair Value Gain/ (Loss) (Rs. million)
Notional Amount
Notional Amount
Foreign Currency (Rs. million)
Foreign Currency (Rs. million)
Foreign Currency (Rs. million)
Foreign Currency (Rs. million)
(Rs. million)
(Rs. million)
(Rs. million)
(Rs. million)
Forward Contracts (Buy)
Coupon Only Swap
Forward Contracts (Buy)
Forward Contracts (Buy)
USD-INR
USD-INR
CHF-USD
EURO-USD
3.77
21.43
-
7.43
179.25
1,000.00
-
437.56
(9.00)
(2.04)
-
33.34
5.46
-
1.72
8.14
245.15
-
71.84
498.72
(17.69)
-
0.88
(6.80)
ii) In addition to the above, the Company has following outstanding foreign currency forward contracts to hedge foreign currency exposure against payable as at March 31, 2011:
17. Derivative Instruments outstanding as at March 31, 2011 :
The Company is exposed to foreign currency fluctuations on foreign currency assets/ liabilities, forecasted receivable, payables denominated in foreign currency. In line with the company’s risk management policies and procedures, the Company enters into foreign currency forward contracts and swap contracts to manage its exposure. These contracts are for a period of maximum twelve months and forecasted transactions are expected to occur during the same period.
(a) The following are outstanding foreign currency forward, swaps and other derivative contracts against the future forecasted payables.

123
(a) Joint Venture Companies Welspun Zucchi Textiles Limited (WZTL)
MEP Cotton Limited (MCL) (upto January 31, 2010)
(b) Associate Companies Welspun USA Inc., USA (WUSA)
Welspun Holdings Private Limited, Cyprus (WHPL)
Welspun Captive Power Generation Limited (WCPGL) (with effect from January 27, 2011)
(c) Welspun Global Brands Limited (WGBL)
Welspun Investments and Commercials Limited (WICL)
Welspun Sorema Europe, S.A. (SOREMA)
Welspun UK Limited (WUKL)
Welspun Home Textiles UK Limited (WHTL)
Welspun Retail Limited (WRL)
Welspun Corp Limited (WCL)
Welspun Power and Steel Limited (WPSL)
Welspun Syntex Limited (WSL)
Welspun Trading Limited (WTL)
Welspun Wintex Limited (WWL)
Welspun Mercantile Limited (WML)
Krishiraj Trading Limited (KTL)
Welspun Logistics Limited (WLL)
Welspun Realty Private Limited (WRPL)
Vipuna Trading Limited (VTL)
Mertz Securities Limited (MSL)
Welspun Polybuttons Limited (WPBL)
Weltreat Enviromanagement Organisation Limited (WEMO)
Remi Metals Gujarat Limited (RMGL)
Welspun Maxsteel Limited (WMSL)
Welspun Projects Limited ( WPL)
Methodical Investment and Trading Company Pvt Ltd (MITCPL)
Welspun FinTrade Limited(WFTL)
Welspun Finance Limited (WFL)
Welspun Urja Gujarat Private Limited (WUGPL)
Welspun Foundation for Health and Knowledge (WFHK)
(d) Key Management Personnel B.K.Goenka (BKG)
M. L. Mittal (MLM)
(e) Relatives of Key Management Personnel Deepali Goenka (DBG)
Enterprises over which Key Management Personnel or relatives of such personnel exercise significant influence or control and with whom transactions have taken place during the year
18. Related Party Disclosures
(i) Relationships
SCHEDULES ANNEXED TO AND FORMING PART OF THE CONSOLIDATED BALANCE SHEET AS AT MARCH 31, 2011 AND CONSOLIDATED PROFIT AND LOSS ACCOUNT FOR THE YEAR ENDED MARCH, 2011
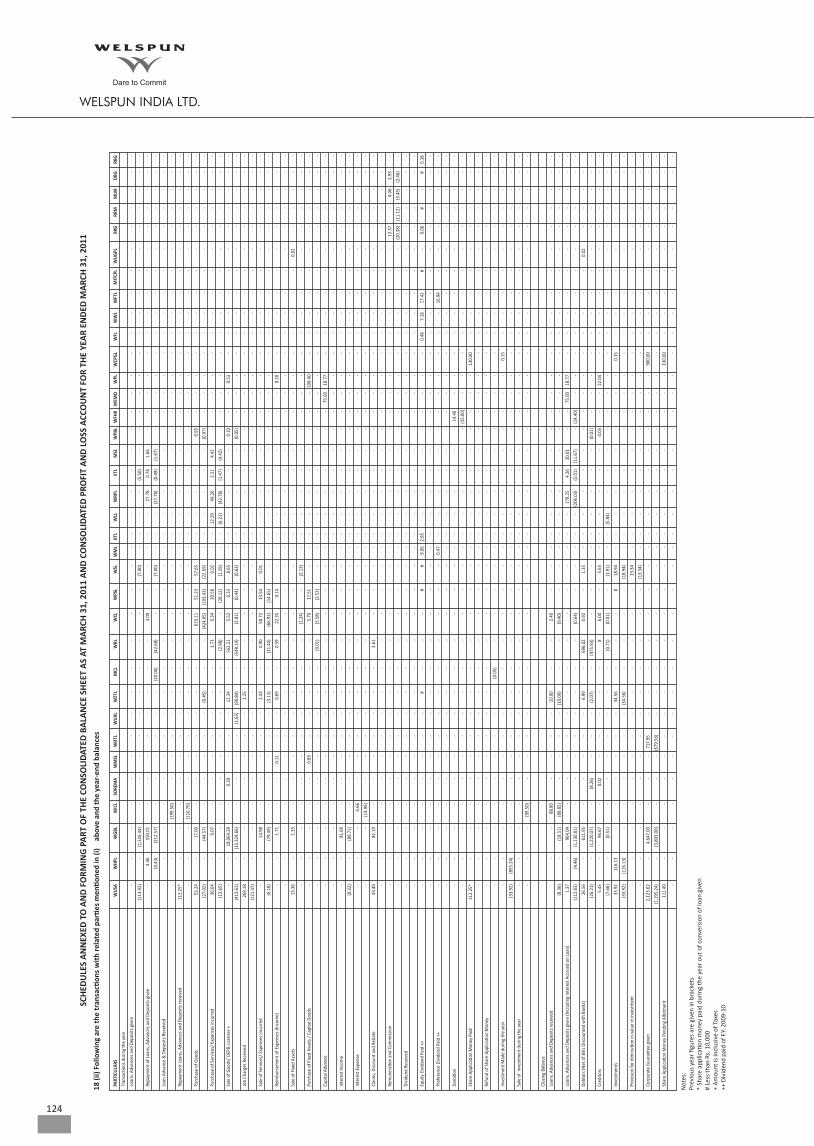
124
SCH
EDU
LES
AN
NEX
ED T
O A
ND
FO
RMIN
G P
ART
OF
THE
CON
SOLI
DAT
ED B
ALA
NCE
SH
EET
AS
AT M
ARC
H 3
1, 2
011
AN
D C
ON
SOLI
DAT
ED P
ROFI
T A
ND
LO
SS A
CCO
UN
T FO
R TH
E YE
AR
END
ED M
ARC
H 3
1, 2
011
18 (i
i) Fo
llow
ing
are
the
tran
sacti
ons
wit
h re
late
d pa
rties
men
tion
ed in
(i)
abo
ve a
nd th
e ye
ar-e
nd b
alan
ces
PART
ICU
LARS
W
USA
W
HPL
W
GBL
W
ICL
S
ORE
MA
W
MSL
W
HTL
W
UKL
W
ZTL
M
CL
WRL
W
CL
WPS
L
WSL
W
ML
K
TL
WLL
W
RPL
V
TL
MSL
W
PBL
W
FHK
W
EMO
W
PL
WCP
GL
W
FL
WW
L
WFT
L
MIT
CPL
W
UG
PL
BKG
R
RM
MLM
D
BG
RBG
Tran
sacti
ons d
urin
g th
e ye
ar
Loan
s, A
dvan
ces a
nd D
epos
its g
iven
-
-
-
-
-
-
-
-
-
-
-
-
-
-
-
-
-
-
-
-
-
-
-
-
-
-
-
-
-
-
-
-
-
-
-
(1
13.9
2)
-
(1,3
26.4
4)
-
-
-
-
-
-
-
-
-
-
(7.0
0)
-
-
-
-
(5.5
0)
-
-
-
-
-
-
-
-
-
-
-
-
-
-
-
-
Repa
ymen
t of L
oans
, Adv
ance
s and
Dep
osits
giv
en
-
4.4
6
150
.01
-
-
-
-
-
-
-
-
3
.00
-
-
-
-
-
2
7.78
0
.74
1
.66
-
-
-
-
-
-
-
-
-
-
-
-
-
-
-
-
(0
.43)
(2
12.5
7)
-
-
-
-
-
-
(20.
00)
(42.
68)
-
-
(7.0
0)
-
-
-
(27.
78)
(0.4
9)
(1.6
7)
-
-
-
-
-
-
-
-
-
-
-
-
-
-
-
Loan
Adv
ance
& D
epos
its R
ecei
ved
-
-
-
-
-
-
-
-
-
-
-
-
-
-
-
-
-
-
-
-
-
-
-
-
-
-
-
-
-
-
-
-
-
-
-
-
-
-
(1
99.5
0)
-
-
-
-
-
-
-
-
-
-
-
-
-
-
-
-
-
-
-
-
-
-
-
-
-
-
-
-
-
-
-
Repa
ymen
t Loa
ns, A
dvan
ces a
nd D
epos
its re
ceiv
ed
112
.25*
-
-
-
-
-
-
-
-
-
-
-
-
-
-
-
-
-
-
-
-
-
-
-
-
-
-
-
-
-
-
-
-
-
-
-
-
-
(1
10.7
0)
-
-
-
-
-
-
-
-
-
-
-
-
-
-
-
-
-
-
-
-
-
-
-
-
-
-
-
-
-
-
-
Purc
hase
of G
oods
5
2.24
-
1
7.00
-
-
-
-
-
-
-
-
6
19.1
1
51.
23
57.
65
-
-
-
-
-
-
0.9
5
-
-
-
-
-
-
-
-
-
-
-
-
-
-
(2
7.02
) -
(4
4.57
) -
-
-
-
-
(0
.45)
-
-
(4
24.0
5)
(103
.43)
(2
2.69
) -
-
-
-
-
-
(0
.97)
-
-
-
-
-
-
-
-
-
-
-
-
-
-
Purc
hase
of S
ervi
ces/
Exp
ense
s inc
urre
d 3
6.64
-
9
.07
-
-
-
-
-
-
-
1
.73
0
.34
3
0.58
0
.02
-
-
1
2.29
4
9.26
2
.21
4
.42
-
-
-
-
-
-
-
-
-
-
-
-
-
-
-
(1
3.65
) -
-
-
-
-
-
-
-
-
(2
.98)
-
(2
8.12
) (1
.29)
-
-
(6
.21)
(4
2.78
) (1
.47)
(4
.42)
-
-
-
-
-
-
-
-
-
-
-
-
-
-
-
Sale
of G
oods
/ DEP
B Li
cens
es +
-
-
1
8,06
4.28
-
0
.29
-
-
-
1
2.34
-
5
62.2
1
5.5
2
0.3
3
8.6
5
-
-
-
-
-
-
0.1
0
-
-
0.5
3
-
-
-
-
-
-
-
-
-
-
-
(4
13.6
1)
-
(15,
324.
66)
-
-
-
-
(1.6
5)
(99.
84)
-
(548
.14)
(2
.81)
(0
.44)
(0
.63)
-
-
-
-
-
-
(0
.05)
-
-
-
-
-
-
-
-
-
-
-
-
-
-
Job
Char
ges R
ecei
ved
269
.18
-
-
-
-
-
-
-
2
.25
-
-
-
-
-
-
-
-
-
-
-
-
-
-
-
-
-
-
-
-
-
-
-
-
-
-
(1
21.4
7)
-
-
-
-
-
-
-
-
-
-
-
-
-
-
-
-
-
-
-
-
-
-
-
-
-
-
-
-
-
-
-
-
-
-
Sale
of S
ervi
ces/
Exp
ense
s inc
urre
d -
-
1
4.98
-
-
-
-
-
2
.43
-
0
.90
5
8.72
1
3.54
0
.01
-
-
-
-
-
-
-
-
-
-
-
-
-
-
-
-
-
-
-
-
-
(6
.18)
-
(7
9.49
) -
-
-
-
-
(3
.11)
-
(1
1.44
) (6
6.92
) (1
4.65
) -
-
-
-
-
-
-
-
-
-
-
-
-
-
-
-
-
-
-
-
-
-
Reim
burs
emen
t of E
xpen
ses (
Inco
me)
-
-
1
.71
-
-
0
.11
-
-
0
.69
-
0
.59
2
2.35
0
.14
-
-
-
-
-
-
-
-
-
-
0
.20
-
-
-
-
-
-
-
-
-
-
-
-
-
-
-
-
-
-
-
-
-
-
-
-
-
-
-
-
-
-
-
-
-
-
-
-
-
-
-
-
-
-
-
-
-
Sale
of F
ixed
Asse
ts
15.
36
-
1.3
5
-
-
-
-
-
-
-
-
-
-
-
-
-
-
-
-
-
-
-
-
-
-
-
-
-
-
0.0
2
-
-
-
-
-
-
-
-
-
-
-
-
-
-
-
-
(1
.24)
-
(2
.13)
-
-
-
-
-
-
-
-
-
-
-
-
-
-
-
-
-
-
-
-
-
Purc
hase
of F
ixed
Asse
ts /
Capi
tal G
oods
-
-
-
-
-
0
.89
-
-
-
-
-
5
.70
1
7.51
-
-
-
-
-
-
-
-
-
-
10
8.40
-
-
-
-
-
-
-
-
-
-
-
-
-
-
-
-
-
-
-
-
-
(0
.01)
(5
.58)
(2
.52)
-
-
-
-
-
-
-
-
-
-
-
-
-
-
-
-
-
-
-
-
-
-
Capi
tal A
dvan
ce
-
-
-
-
-
-
-
-
-
-
-
-
-
-
-
-
-
-
-
-
-
-
75.
00
18.
77
-
-
-
-
-
-
-
-
-
-
-
-
-
-
-
-
-
-
-
-
-
-
-
-
-
-
-
-
-
-
-
-
-
-
-
-
-
-
-
-
-
-
-
-
-
-
Inte
rest
Inco
me
-
-
81.
69
-
-
-
-
-
-
-
-
-
-
-
-
-
-
-
-
-
-
-
-
-
-
-
-
-
-
-
-
-
-
-
-
(0
.22)
-
(8
9.71
) -
-
-
-
-
-
-
-
-
-
-
-
-
-
-
-
-
-
-
-
-
-
-
-
-
-
-
-
-
-
-
-
Inte
rest
Exp
ense
-
-
-
6
.66
-
-
-
-
-
-
-
-
-
-
-
-
-
-
-
-
-
-
-
-
-
-
-
-
-
-
-
-
-
-
-
-
-
-
(1
3.99
) -
-
-
-
-
-
-
-
-
-
-
-
-
-
-
-
-
-
-
-
-
-
-
-
-
-
-
-
-
-
-
Clai
ms,
Disc
ount
and
Reb
ate
43.
49
-
81.
19
-
-
-
-
-
-
-
3.6
1
-
-
-
-
-
-
-
-
-
-
-
-
-
-
-
-
-
-
-
-
-
-
-
-
-
-
-
-
-
-
-
-
-
-
-
-
-
-
-
-
-
-
-
-
-
-
-
-
-
-
-
-
-
-
-
-
-
-
-
Rem
uner
ation
and
Com
miss
ion
-
-
-
-
-
-
-
-
-
-
-
-
-
-
-
-
-
-
-
-
-
-
-
-
-
-
-
-
-
-
13.
37
-
4.0
6
2.9
3
-
-
-
-
-
-
-
-
-
-
-
-
-
-
-
-
-
-
-
-
-
-
-
-
-
-
-
-
-
-
-
(2
0.38
) (1
1.12
) (3
.45)
(2
.46)
-
Divi
dend
Rec
eive
d -
-
-
-
-
-
-
-
-
-
-
-
-
-
-
-
-
-
-
-
-
-
-
-
-
-
-
-
-
-
-
-
-
-
-
-
-
-
-
-
-
-
-
-
-
-
-
-
-
-
-
-
-
-
-
-
-
-
-
-
-
-
-
-
-
-
-
-
-
-
Equi
ty D
ivid
end
Paid
++
-
-
-
-
-
-
-
-
#
-
-
-
#
#
9.0
6
2.65
-
-
-
-
-
-
-
-
-
0
.48
7
.18
1
7.41
#
-
0
.06
#
-
#
0
.18
-
-
-
-
-
-
-
-
-
-
-
-
-
-
-
-
-
-
-
-
-
-
-
-
-
-
-
-
-
-
-
-
-
-
-
Pref
eren
ce D
ivid
end
Paid
++
-
-
-
-
-
-
-
-
-
-
-
-
-
-
0.4
7
-
-
-
-
-
-
-
-
-
-
-
-
16.
94
-
-
-
-
-
-
-
-
-
-
-
-
-
-
-
-
-
-
-
-
-
-
-
-
-
-
-
-
-
-
-
-
-
-
-
-
-
-
-
-
-
-
Dona
tion
-
-
-
-
-
-
-
-
-
-
-
-
-
-
-
-
-
-
-
-
-
14.
40
-
-
-
-
-
-
-
-
-
-
-
-
-
-
-
-
-
-
-
-
-
-
-
-
-
-
-
-
-
-
-
-
-
-
(1
5.00
) -
-
-
-
-
-
-
-
-
-
-
-
-
Shar
e Ap
plic
ation
Mon
ey P
aid
112
.25*
-
-
-
-
-
-
-
-
-
-
-
-
-
-
-
-
-
-
-
-
-
-
-
1
30.0
0
-
-
-
-
-
-
-
-
-
-
-
-
-
-
-
-
-
-
-
-
-
-
-
-
-
-
-
-
-
-
-
-
-
-
-
-
-
-
-
-
-
-
-
-
-
Refu
nd o
f Sha
re A
pplic
ation
Mon
ey
-
-
-
-
-
-
-
-
-
-
-
-
-
-
-
-
-
-
-
-
-
-
-
-
-
-
-
-
-
-
-
-
-
-
-
-
-
-
-
-
-
-
-
-
(0
.05)
-
-
-
-
-
-
-
-
-
-
-
-
-
-
-
-
-
-
-
-
-
-
-
-
-
Inve
stm
ent M
ade
durin
g th
e ye
ar
-
-
-
-
-
-
-
-
-
-
-
-
-
-
-
-
-
-
-
-
-
-
-
-
0.1
5
-
-
-
-
-
-
-
-
-
-
(3
3.92
) (8
55.2
4)
-
-
-
-
-
-
-
-
-
-
-
-
-
-
-
-
-
-
-
-
-
-
-
-
-
-
-
-
-
-
-
-
-
Sale
of
inve
stm
ent d
urin
g th
e ye
ar
-
-
-
-
-
-
-
-
-
-
-
-
-
-
-
-
-
-
-
-
-
-
-
-
-
-
-
-
-
-
-
-
-
-
-
-
-
-
(9
9.50
) -
-
-
-
-
-
-
-
-
-
-
-
-
-
-
-
-
-
-
-
-
-
-
-
-
-
-
-
-
-
-
Clos
ing
Bala
nce
Loan
s, A
dvan
ces a
nd D
epos
its re
ceiv
ed
-
-
8
8.80
-
-
-
-
1
0.00
-
-
2
.40
-
-
-
-
-
-
-
-
-
-
-
-
-
-
-
-
-
-
-
-
-
-
-
(8
.36)
-
(1
8.51
) (8
8.85
) -
-
-
-
(1
0.00
) -
-
(9
.40)
-
-
-
-
-
-
-
-
-
-
-
-
-
-
-
-
-
-
-
-
-
-
-
Loan
s, A
dvan
ces a
nd D
epos
its g
iven
(Inc
ludi
ng In
tere
st A
ccru
ed o
n Lo
an)
1.3
7
-
964
.04
-
-
-
-
-
-
-
-
-
-
-
-
-
-
1
78.2
5
4.2
6
10.
01
-
-
75.
00
18.
77
-
-
-
-
-
-
-
-
-
-
-
(1
12.8
3)
(4.4
6)
(1,1
30.8
1)
-
-
-
-
-
-
-
-
(0.6
4)
-
-
-
-
-
(206
.03)
(5
.01)
(1
1.67
) -
(1
4.40
) -
-
-
-
-
-
-
-
-
-
-
-
-
Debt
ors (
Net
of B
ills D
iscou
nted
with
Ban
ks)
26.
56
-
611
.95
-
-
-
-
-
6
.99
-
6
96.0
2
0.9
2
-
1.3
5
-
-
-
-
-
-
-
-
-
-
-
-
-
-
-
0.0
2
-
-
-
-
(2
6.21
) -
(1
,220
.07)
-
(8
.26)
-
-
-
(2
.07)
-
(4
75.9
3)
-
-
-
-
-
-
-
-
-
(0.0
1)
-
-
-
-
-
-
-
-
-
-
-
-
-
-
Cred
itors
5
.45
-
9
6.67
-
0
.02
-
-
-
-
-
#
6
.00
-
5
.63
-
-
-
-
-
-
0
.03
-
-
2
2.04
-
-
-
-
-
-
-
-
-
-
-
(7
.66)
-
(0
.51)
-
-
-
-
-
-
-
(0
.71)
(0
.01)
-
(1
.91)
-
-
(5
.84)
-
-
-
-
-
-
-
-
-
-
-
-
-
-
-
-
-
-
Inve
stm
ents
3
3.92
1
16.1
3
-
-
-
-
-
-
34.
56
-
-
-
#
18.
94
-
-
-
-
-
-
-
-
-
-
0.1
5
-
-
-
-
-
-
-
-
-
-
(3
3.92
) (1
16.1
3)
-
-
-
-
-
-
(34.
56)
-
-
-
-
(18.
94)
-
-
-
-
-
-
-
-
-
-
-
-
-
-
-
-
-
-
-
-
-
Prov
ision
for d
imin
ution
in v
alue
in in
vest
men
t -
-
-
-
-
-
-
-
-
-
-
-
-
1
3.34
-
-
-
-
-
-
-
-
-
-
-
-
-
-
-
-
-
-
-
-
-
-
-
-
-
-
-
-
-
-
-
-
-
-
(1
3.34
) -
-
-
-
-
-
-
-
-
-
-
-
-
-
-
-
-
-
-
-
-
Corp
orat
e Gu
aran
tee
give
n 2
,123
.62
-
4
,647
.00
-
-
-
7
17.9
5
-
-
-
-
-
-
-
-
-
-
-
-
-
-
-
-
-
900
.00
-
-
-
-
-
-
-
-
-
-
(1
,195
.24)
-
(3
,803
.00)
-
-
-
(6
79.5
6)
-
-
-
-
-
-
-
-
-
-
-
-
-
-
-
-
-
-
-
-
-
-
-
-
-
-
-
-
Shar
e Ap
plic
ation
Mon
ey P
endi
ng A
llotm
ent
111
.49
-
-
-
-
-
-
-
-
-
-
-
-
-
-
-
-
-
-
-
-
-
-
-
1
30.0
0
-
-
-
-
-
-
-
-
-
-
-
-
-
-
-
-
-
-
-
-
-
-
-
-
-
-
-
-
-
-
-
-
-
-
-
-
-
-
-
-
-
-
-
-
-
Not
es:
Prev
ious
yea
r fig
ures
are
giv
en in
bra
cket
s*
Shar
e ap
plic
ation
mon
ey p
aid
duri
ng th
e ye
ar o
ut o
f con
vers
ion
of lo
an g
iven
# Le
ss th
an R
s. 1
0,00
0+
Am
ount
is in
clus
ive
of T
axes
++ D
ivid
end
paid
of F
.Y. 2
009-
10
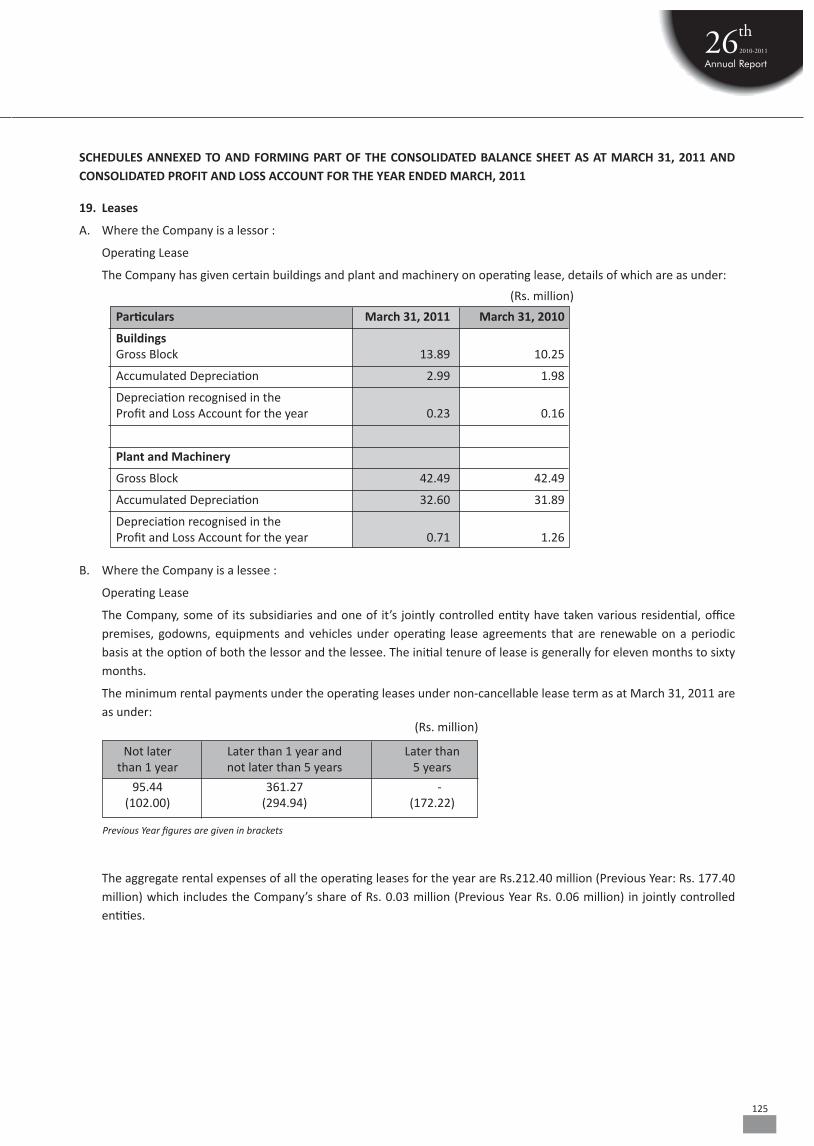
125
19. Leases
A. Where the Company is a lessor :
Operating Lease
The Company has given certain buildings and plant and machinery on operating lease, details of which are as under:
SCHEDULES ANNEXED TO AND FORMING PART OF THE CONSOLIDATED BALANCE SHEET AS AT MARCH 31, 2011 AND CONSOLIDATED PROFIT AND LOSS ACCOUNT FOR THE YEAR ENDED MARCH, 2011
Particulars March 31, 2011 March 31, 2010
Buildings Gross Block 13.89 10.25
Accumulated Depreciation 2.99 1.98
Depreciation recognised in the Profit and Loss Account for the year 0.23 0.16
Plant and Machinery
Gross Block 42.49 42.49
Accumulated Depreciation 32.60 31.89
Depreciation recognised in the Profit and Loss Account for the year 0.71 1.26
(Rs. million)
B. Where the Company is a lessee :
Operating Lease
The Company, some of its subsidiaries and one of it’s jointly controlled entity have taken various residential, office premises, godowns, equipments and vehicles under operating lease agreements that are renewable on a periodic basis at the option of both the lessor and the lessee. The initial tenure of lease is generally for eleven months to sixty months.
The minimum rental payments under the operating leases under non-cancellable lease term as at March 31, 2011 are as under:
Not later Later than 1 year and Later than than 1 year not later than 5 years 5 years
95.44 361.27 - (102.00) (294.94) (172.22)
Previous Year figures are given in brackets
(Rs. million)
The aggregate rental expenses of all the operating leases for the year are Rs.212.40 million (Previous Year: Rs. 177.40 million) which includes the Company’s share of Rs. 0.03 million (Previous Year Rs. 0.06 million) in jointly controlled entities.
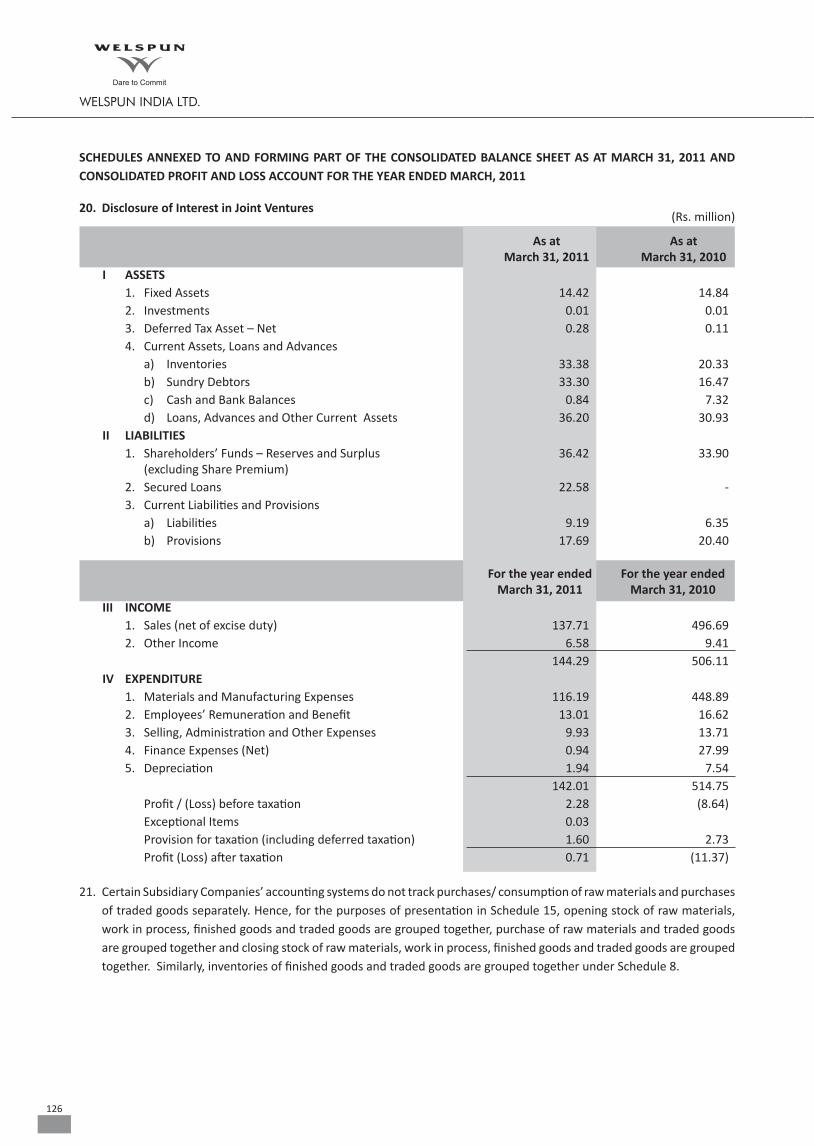
126
As at As at March 31, 2011 March 31, 2010I ASSETS 1. Fixed Assets 14.42 14.84 2. Investments 0.01 0.01 3. Deferred Tax Asset – Net 0.28 0.11 4. Current Assets, Loans and Advances a) Inventories 33.38 20.33 b) Sundry Debtors 33.30 16.47 c) Cash and Bank Balances 0.84 7.32 d) Loans, Advances and Other Current Assets 36.20 30.93II LIABILITIES 1. Shareholders’ Funds – Reserves and Surplus 36.42 33.90 (excluding Share Premium) 2. Secured Loans 22.58 - 3. Current Liabilities and Provisions a) Liabilities 9.19 6.35 b) Provisions 17.69 20.40
(Rs. million)
For the year ended For the year ended March 31, 2011 March 31, 2010III INCOME 1. Sales (net of excise duty) 137.71 496.69 2. Other Income 6.58 9.41 144.29 506.11IV EXPENDITURE 1. Materials and Manufacturing Expenses 116.19 448.89 2. Employees’ Remuneration and Benefit 13.01 16.62 3. Selling, Administration and Other Expenses 9.93 13.71 4. Finance Expenses (Net) 0.94 27.99 5. Depreciation 1.94 7.54 142.01 514.75 Profit / (Loss) before taxation 2.28 (8.64) Exceptional Items 0.03 Provision for taxation (including deferred taxation) 1.60 2.73 Profit (Loss) after taxation 0.71 (11.37)
21. Certain Subsidiary Companies’ accounting systems do not track purchases/ consumption of raw materials and purchases of traded goods separately. Hence, for the purposes of presentation in Schedule 15, opening stock of raw materials, work in process, finished goods and traded goods are grouped together, purchase of raw materials and traded goods are grouped together and closing stock of raw materials, work in process, finished goods and traded goods are grouped together. Similarly, inventories of finished goods and traded goods are grouped together under Schedule 8.
20. Disclosure of Interest in Joint Ventures
SCHEDULES ANNEXED TO AND FORMING PART OF THE CONSOLIDATED BALANCE SHEET AS AT MARCH 31, 2011 AND CONSOLIDATED PROFIT AND LOSS ACCOUNT FOR THE YEAR ENDED MARCH, 2011
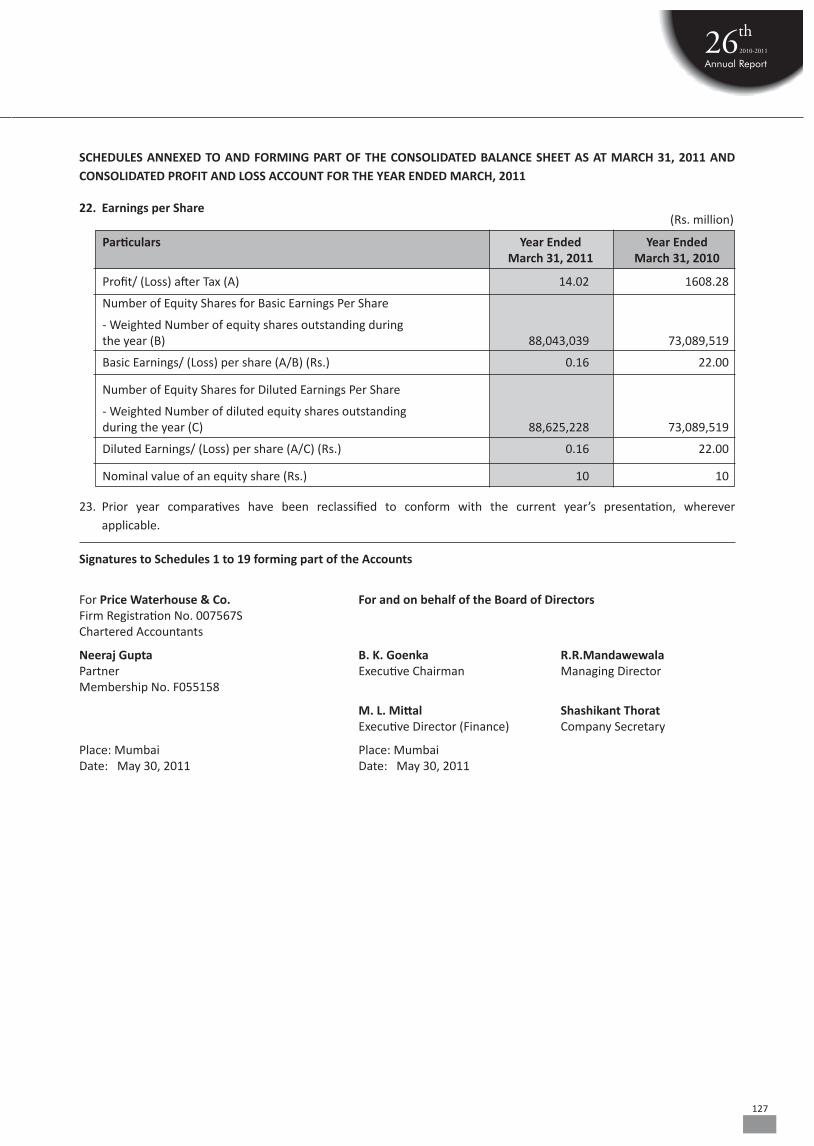
127
Particulars Year Ended Year Ended March 31, 2011 March 31, 2010
Profit/ (Loss) after Tax (A) 14.02 1608.28
Number of Equity Shares for Basic Earnings Per Share
- Weighted Number of equity shares outstanding during the year (B) 88,043,039 73,089,519
Basic Earnings/ (Loss) per share (A/B) (Rs.) 0.16 22.00
Number of Equity Shares for Diluted Earnings Per Share
- Weighted Number of diluted equity shares outstanding during the year (C) 88,625,228 73,089,519
Diluted Earnings/ (Loss) per share (A/C) (Rs.) 0.16 22.00
Nominal value of an equity share (Rs.) 10 10
23. Prior year comparatives have been reclassified to conform with the current year’s presentation, wherever applicable.
SCHEDULES ANNEXED TO AND FORMING PART OF THE CONSOLIDATED BALANCE SHEET AS AT MARCH 31, 2011 AND CONSOLIDATED PROFIT AND LOSS ACCOUNT FOR THE YEAR ENDED MARCH, 2011
22. Earnings per Share
For Price Waterhouse & Co. For and on behalf of the Board of Directors Firm Registration No. 007567S Chartered Accountants
Neeraj Gupta B. K. Goenka R.R.Mandawewala Partner Executive Chairman Managing Director Membership No. F055158
M. L. Mittal Shashikant Thorat Executive Director (Finance) Company Secretary
Place: Mumbai Place: Mumbai Date: May 30, 2011 Date: May 30, 2011
Signatures to Schedules 1 to 19 forming part of the Accounts
(Rs. million)
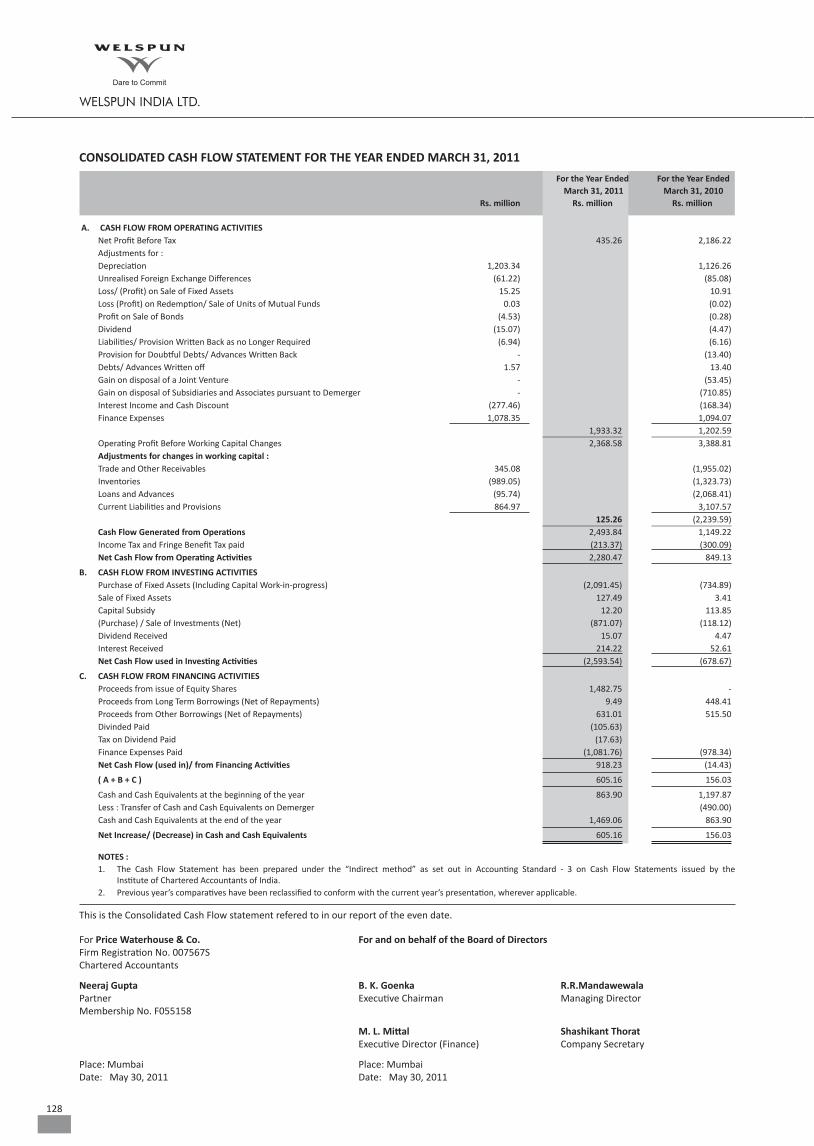
128
For the Year Ended For the Year Ended March 31, 2011 March 31, 2010 Rs. million Rs. million Rs. million A. CASH FLOW FROM OPERATING ACTIVITIES Net Profit Before Tax 435.26 2,186.22 Adjustments for : Depreciation 1,203.34 1,126.26 Unrealised Foreign Exchange Differences (61.22) (85.08) Loss/ (Profit) on Sale of Fixed Assets 15.25 10.91 Loss (Profit) on Redemption/ Sale of Units of Mutual Funds 0.03 (0.02) Profit on Sale of Bonds (4.53) (0.28) Dividend (15.07) (4.47) Liabilities/ Provision Written Back as no Longer Required (6.94) (6.16) Provision for Doubtful Debts/ Advances Written Back - (13.40) Debts/ Advances Written off 1.57 13.40 Gain on disposal of a Joint Venture - (53.45) Gain on disposal of Subsidiaries and Associates pursuant to Demerger - (710.85) Interest Income and Cash Discount (277.46) (168.34) Finance Expenses 1,078.35 1,094.07 1,933.32 1,202.59 Operating Profit Before Working Capital Changes 2,368.58 3,388.81 Adjustments for changes in working capital : Trade and Other Receivables 345.08 (1,955.02) Inventories (989.05) (1,323.73) Loans and Advances (95.74) (2,068.41) Current Liabilities and Provisions 864.97 3,107.57 125.26 (2,239.59) Cash Flow Generated from Operations 2,493.84 1,149.22 Income Tax and Fringe Benefit Tax paid (213.37) (300.09) Net Cash Flow from Operating Activities 2,280.47 849.13
B. CASH FLOW FROM INVESTING ACTIVITIES Purchase of Fixed Assets (Including Capital Work-in-progress) (2,091.45) (734.89) Sale of Fixed Assets 127.49 3.41 Capital Subsidy 12.20 113.85 (Purchase) / Sale of Investments (Net) (871.07) (118.12) Dividend Received 15.07 4.47 Interest Received 214.22 52.61 Net Cash Flow used in Investing Activities (2,593.54) (678.67)
C. CASH FLOW FROM FINANCING ACTIVITIES Proceeds from issue of Equity Shares 1,482.75 - Proceeds from Long Term Borrowings (Net of Repayments) 9.49 448.41 Proceeds from Other Borrowings (Net of Repayments) 631.01 515.50 Divinded Paid (105.63) Tax on Dividend Paid (17.63) Finance Expenses Paid (1,081.76) (978.34) Net Cash Flow (used in)/ from Financing Activities 918.23 (14.43)
( A + B + C ) 605.16 156.03
Cash and Cash Equivalents at the beginning of the year 863.90 1,197.87 Less : Transfer of Cash and Cash Equivalents on Demerger (490.00) Cash and Cash Equivalents at the end of the year 1,469.06 863.90
Net Increase/ (Decrease) in Cash and Cash Equivalents 605.16 156.03
CONSOLIDATED CASH FLOW STATEMENT FOR THE YEAR ENDED MARCH 31, 2011
NOTES : 1. The Cash Flow Statement has been prepared under the “Indirect method” as set out in Accounting Standard - 3 on Cash Flow Statements issued by the Institute of Chartered Accountants of India. 2. Previous year’s comparatives have been reclassified to conform with the current year’s presentation, wherever applicable.
For Price Waterhouse & Co. For and on behalf of the Board of Directors Firm Registration No. 007567S Chartered Accountants
Neeraj Gupta B. K. Goenka R.R.Mandawewala Partner Executive Chairman Managing Director Membership No. F055158
M. L. Mittal Shashikant Thorat Executive Director (Finance) Company Secretary
Place: Mumbai Place: Mumbai Date: May 30, 2011 Date: May 30, 2011
This is the Consolidated Cash Flow statement refered to in our report of the even date.
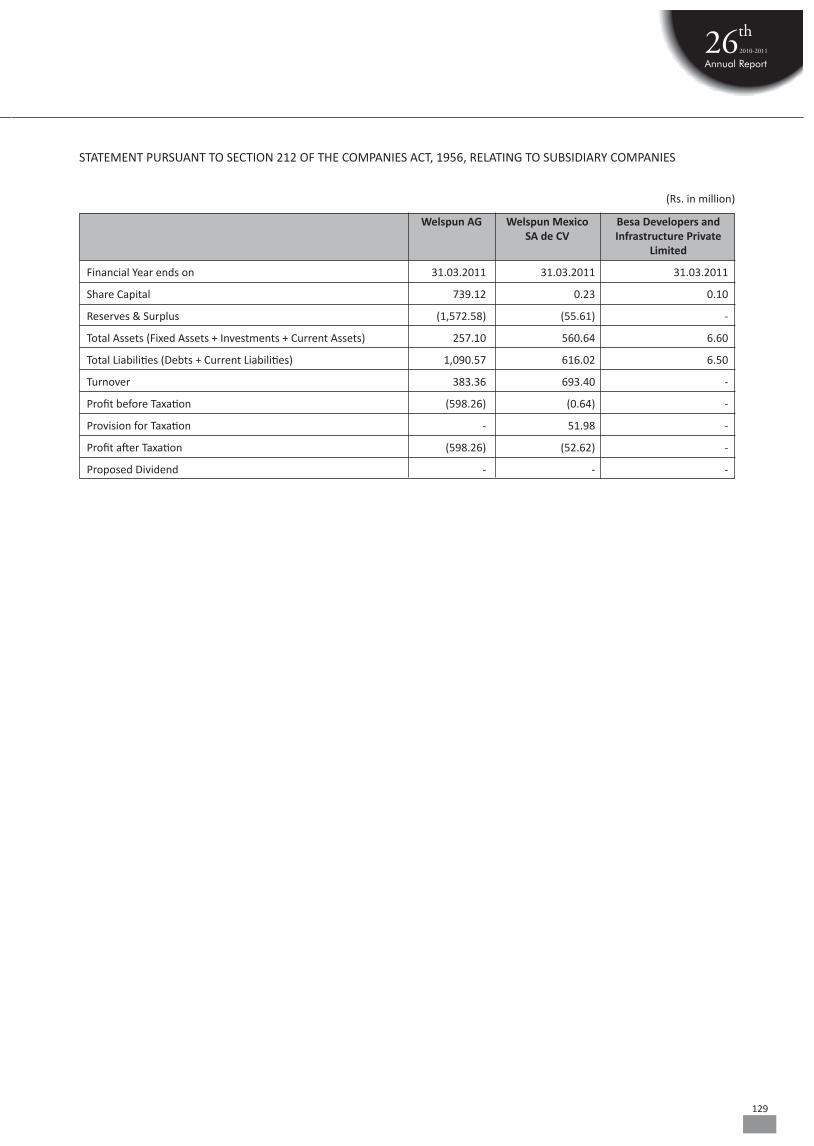
129
STATEMENT PURSUANT TO SECTION 212 OF THE COMPANIES ACT, 1956, RELATING TO SUBSIDIARY COMPANIES
Welspun AG Welspun Mexico Besa Developers and SA de CV Infrastructure Private Limited
Financial Year ends on 31.03.2011 31.03.2011 31.03.2011
Share Capital 739.12 0.23 0.10
Reserves & Surplus (1,572.58) (55.61) -
Total Assets (Fixed Assets + Investments + Current Assets) 257.10 560.64 6.60
Total Liabilities (Debts + Current Liabilities) 1,090.57 616.02 6.50
Turnover 383.36 693.40 -
Profit before Taxation (598.26) (0.64) -
Provision for Taxation - 51.98 -
Profit after Taxation (598.26) (52.62) -
Proposed Dividend - - -
(Rs. in million)