Proyecto CARE de WIC - PHFE WIC Hosted Applications | PHFE WIC

Source of Data Number %
WIC 212,233 100.0EPSDT 0 0.0Child Health-MCH 0 0.0Child Health-HMO 0 0.0HeadStart 0 0.0School Health 0 0.0Other 0 0.0
Total 212,233 100.0
Total Records Number
Individual Children 212,233
Total Records (All Visits) 340,840
Race/Ethnic Distribution Number %
White, Not Hispanic 99,793 47.0Black, Not Hispanic 58,637 27.6Hispanic 28,818 13.6American Indian/Alaska Native 643 0.3Asian/Pacific Islander 4,297 2.0Multiple Races 19,546 9.2All Other 71 0.0
Total 211,805 100.0
Age Distribution (4) Number %
0 - 5 Months 37,802 17.8
6 - 11 Months 26,605 12.5
12 - 23 Months 45,847 21.6
24 - 35 Months 35,696 16.8
3 - 4 Years 66,283 31.2
Total 212,233 100.0
Migrant Status Number %
Yes 1,547 0.7No 210,686 99.3
Total 212,233 100.0Excluded Unknown 0 0.0 %
% of Poverty Level Number %
0 - 50 83,752 39.951 - 100 63,747 30.4101 - 130 28,019 13.4131 - 150 11,718 5.6151 - 185 14,404 6.9186 - 200 1,909 0.9Over 200 6,287 3.0Adjunctive Eligibility 1 0.0
Total 209,837 100.0Excluded Unknown 2,396 1.1 %
Program Participation Number %
WIC 212,233 100.0SNAP 210,862 44.5Medicaid 208,468 82.4Tanf 211,107 3.5Excluded UnknownWIC 0 0.0SNAP 1,371 0.6Medicaid 3,765 1.8Tanf 1,126 0.5
Excluded Unknown 0 0.0 %
Excluded Unknown 428 0.2 %
(1) Reporting period is January 1 through December 31(2) Analyses based on one record per child(3) Excludes records with unknown data or errors.(4) Records rejected if date of birth and date of visit unknown
Children Aged < 5 Years
2018 Pediatric Nutrition Surveillance
Summary of Demographic Indicators
Table 1C (1)
Michigan
Run Date: 6/4/2019
(2,3)
WIC PNNS & PedNSS
Page : 1

MichiganPrevalence
Number % Birthweight Low 48,804 11.0 High 48,804 6.6 Height and Weight (5,6) (3) < 5 Yrs Short Stature 205,990 7.6 < 5 Yrs Underweight 205,990 3.2 < 5 Yrs Obese 205,990 10.7 >= 2 Yrs Overweight 85,908 16.3 >=2 Yrs Obese 85,908 13.5 Anemia (7) Low Hb 136,885 23.4 Low Hct 32 * Low Hb/Hct 136,909 23.4 Breastfeeding (8) Ever Breastfed 49,377 66.8 Breastfed At Least 6 Months 38,049 31.4 Breastfed At Least 12 Months 32,543 12.7 Smoking in Household 210,908 2.9 <= 2 Hours TV Viewing/ Day (9) 100,561 82.1
National (10)Prevalence(Prior Year)
Number %
64,446 10.864,446 7.0
313,489 7.4313,489 2.9313,489 10.9133,678 16.4133,678 13.4
211,675 19.335 54.3211,699 19.3
64,536 70.256,977 28.647,523 14.6295,248 3.4141,591 83.5
Summary of Health Indicators (3)
(1) Reporting period is January 1 through December 31.(2) Analyses based on one record per child.(3) Excludes records with unknown data or errors.(4) Infants born during the reporting period included in the analysis. Low birthweight is defined as < 2500 grams and high birthweight is defined as > 4000 grams.(5) Based on 2006 WHO growth chart percentiles for children under 2 years of age; short stature is defined as length-for-age <= 2.3rd percentile, underweight is defined as weight-for-length <= 2.3rd percentile, and high weight-for-length (labeled as "Obese") is defined as >= 97.7th percentile.(6) Based on 2000 CDC growth chart percentiles for children 2 years of age and older; short stature is defined as height-for-age < 5th percentile, underweight is defined as BMI-for-age < 5th percentile, overweight is defined as BMI-for-age >= 85th to < 95th percentile, and obesity is defined as >= 95th percentile.(7) Based on 1998 CDC MMWR, "Recommendations to Prevent and Control Iron Deficiency in the United States", altitude adjusted, children 6 months of age and older included in the analysis.(8) Infants born during the reporting period included in the Ever Breastfed analysis. Infants who turned 6 months of age during the reporting period by/on their date of visit included in the Breastfed At Least 6 Months analysis. Children who turned 12 months of age during the reporting period by/on their date of visit included in the Breastfed At Least 12 Months analysis.(9) Children aged 2 years and older included in the analysis.(10) National includes previous year’s data for all participating States and ITOs.* Percentages are not calculated if < 100 records are available for analysis after exclusions.
Children Aged < 5 Years
2018 Pediatric Nutrition Surveillance
Summary of Health Indicators
Table 2C (1)
Michigan
Run Date: 6/4/2019
(2)
WIC PNNS & PedNSS
Page : 2

Summary of Breastfeeding Indicators (3)
MichiganPrevalence
Number %
Breastfeeding Duration (4,5)
Ever Breastfed 49,377 66.8 Breastfed 1+ Weeks 42,134 61.1 Breastfed 2+ Weeks 35,952 56.8 Breastfed 3+ Weeks 32,475 53.2 Breastfed 4+ Weeks 30,778 50.3 Breastfed 6+ Weeks 29,957 46.0 Breastfed 2+ Months 30,817 44.0 Breastfed 3+ Months 33,683 40.0 Breastfed 4+ Months 37,093 37.0 Breastfed 5+ Months 40,867 34.4 Breastfed 6+ Months 38,049 31.4 Breastfed 9+ Months 28,883 16.1 Breastfed 12+ Months 32,543 12.7 Breastfed 18+ Months 23,631 8.2
Exclusive Breastfeeding (6)
Exclusively Breastfed at Least 3 Months 26,949 16.3 Exclusively Breastfed at Least 6 Months 31,907 9.2
National (7)Prevalence(Prior Year)
Number %
64,536 70.259,469 63.753,099 59.449,893 55.148,350 51.547,591 45.749,137 41.852,440 37.556,223 34.260,984 31.456,977 28.643,656 17.847,523 14.635,426 9.8
45,032 16.450,544 8.8
(1) Reporting period is January 1 through December 31.(2) Analyses based on one record per child.(3) Excludes records with unknown data or errors.(4) Infants born during the reporting period included in the Ever Breastfed analysis. For each breastfeding duration category, the analysis includes only children who turned that age during the reporting period by/on their date of visit. For example, infants who turned 9 months old during the reporting period by/on their date of visit are included in the 9+ months analysis.(5) It is possible the analysis will show that slightly more infants are breastfed at older ages, e.g. 1+ weeks of age, than at younger ages, e.g. at birth (ever breastfed), due to variation in infants included in each breastfeeding analysis category.(6) The analysis includes infants who were ever breastfed and who turned that age during the reporting period by/on their date of visit.(7) National includes previous year’s data for all participating States and ITOs.* Percentages are not calculated if < 100 records are available for analysis after exclusions.
Children Aged < 5 Years
2018 Pediatric Nutrition Surveillance
Summary of Breastfeeding Indicators
Table 3C (1)
Michigan
Run Date: 6/4/2019
(2)
WIC PNNS & PedNSS
Page : 3

National (Prior Year) 323,319 46.5 21.0 14.9 2.1 2.2 7.7 5.6
Comparison of Racial and Ethnic DistributionContributor Number
Included in Analysis
(3)
White, Not Hispanic
%
Black, Not Hispanic
%
Hispanic
%
American Indian/Alaska
Native%
Asian/Pacific Islander
%
Multiple Races
%
All Other/Unknown
%
Michigan 212,233 47.0 27.6 13.6 0.3 2.0 9.2 0.2
(1) Reporting period is January 1 through December 31.(2) Analyses based on one record per child.(3) Excludes records with errors.(4) National includes previous year’s data for all participating States and ITOs.* Percentages are not calculated if < 100 records are available for analysis after exclusions.
Children Aged < 5 Years
2018 Pediatric Nutrition Surveillance
Comparison of Racial and Ethnic Distribution by Contributor to National
Table 4C (1)
Michigan
Run Date: 6/4/2019
(2)
WIC PNNS & PedNSS
(4)
Page : 4
Comparison of Age DistributionContributor Number
Included in Analysis
(3,4)
0 - 11 Months
%
12 - 23 Months
%
24 - 59 Months
%
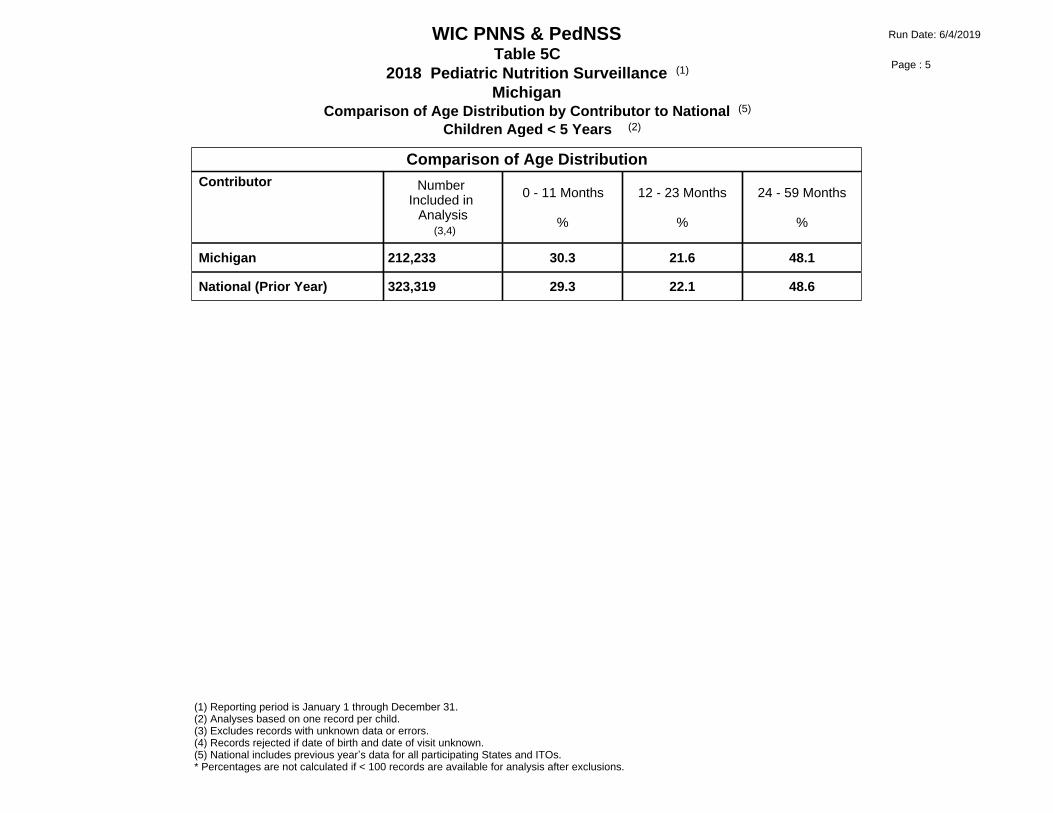
Michigan 212,233 30.3 21.6 48.1
National (Prior Year) 323,319 29.3 22.1 48.6
(1) Reporting period is January 1 through December 31.(2) Analyses based on one record per child.(3) Excludes records with unknown data or errors.(4) Records rejected if date of birth and date of visit unknown.(5) National includes previous year’s data for all participating States and ITOs.* Percentages are not calculated if < 100 records are available for analysis after exclusions.
Children Aged < 5 Years
2018 Pediatric Nutrition SurveillanceTable 5C
(1)
Michigan
Run Date: 6/4/2019
(2)
WIC PNNS & PedNSS
Comparison of Age Distribution by Contributor to National (5)
Page : 5

Comparison of Growth and Anemia Indicators (3)
ContributorBirth Weight
(4)Height and Weight
(5,6)
AnemiaLow Hb/Hct
(7)
Low High ShortStature
Under-Weight
Obese > 2 YrsOverweight and Obese
Number %<2500 g
%>4000 g
Number % % % Number %Overweight
%Obese
Number %
Michigan 48,804 11.0 6.6 205,990 7.6 3.2 10.7 85,908 16.3 13.5 136,909 23.4
National (Prior Year) 64,446 10.8 7.0 313,489 7.4 2.9 10.9 133,678 16.4 13.4 211,699 19.3
(1) Reporting period is January 1 through December 31.(2) Analyses based on one record per child.(3) Excludes records with unknown data or errors.(4) Infants born during the reporting period included in the analysis.(5) Based on 2006 WHO growth chart percentiles for children under 2 years of age; short stature is defined as length-for-age <= 2.3rd percentile, underweight is defined as weight-for-length <= 2.3rd percentile, and high weight-for-length (labeled as "Obese") is defined as >= 97.7th percentile.(6) Based on 2000 CDC growth chart percentiles for children 2 years of age and older; short stature is defined as height-for-age < 5th percentile, underweight is defined as BMI-for-age < 5th percentile, overweight is defined as BMI-for-age >= 85th to < 95th percentile, and obesity is defined as >= 95th percentile.(7) Based on 1998 CDC MMWR, ''Recommendations to Prevent and Control Iron Deficiency in the United States'', altitude adjusted, children 6 months of age and older included in the analysis.(8) National includes previous year’s data for all participating States and ITOs.* Percentages and ranks are not calculated if < 100 records are available for analysis after exclusions.
Children Aged < 5 Years
2018 Pediatric Nutrition Surveillance
Comparison of Growth and Anemia Indicators by Contributor to National
Table 6C (1)
Michigan
Run Date: 6/4/2019
(2)
WIC PNNS & PedNSS
(8)
Page : 6

Comparison of Breastfeeding, TV Viewing, and Smoking in Household (4)
ContributorBreastfeeding
(5)Exclusive Breastfeeding
(6)
< 2 Hours TVViewing/Day
(7)
Smoking in Household
Number %Ever
Breastfed
Number %BreastfedAt Least
6Months
Number %BreastfedAt Least
12Months
Number %BreastfedAt Least
3Months
Number %BreastfedAt Least
6Months
Number % Number %
Michigan 49,377 66.8 38,049 31.4 32,543 12.7 26,949 16.3 31,907 9.2 100,561 82.1 210,908 2.9
National (Prior Year) 64,536 70.2 56,977 28.6 47,523 14.6 45,032 16.4 50,544 8.8 141,591 83.5 295,248 3.4
(1) Reporting period is January 1 through December 31.(2) TV Viewing and Smoking in Household data are not reported by all contributors.(3) Analyses based on one record per child.(4) Excludes records with unknown data or errors.(5) Infants born during the reporting period included in the Ever Breastfed analysis. Infants who turned 6 months of age during the reporting period by/on their date of visit included in the Breastfed At Least 6 Months analysis. Children who turned 12 months of age during the reporting period by/on their date of visit included in the Breastfed At Least 12 Months analysis.(6) The analysis includes infants who were ever breastfed and who turned that age during the reporting period by/on their date of visit.(7) Children aged 2 years and older included in the analyses.(8) National includes previous year’s data for all participating States and ITOs.* Percentages and ranks are not calculated if < 100 records are available for analysis after exclusions.
Children Aged < 5 Years
2018 Pediatric Nutrition Surveillance
Comparison of Breastfeeding, TV Viewing, and Smoking in Household by Contributor to National
Table 7C (1)
Michigan
Run Date: 6/4/2019
(3)
WIC PNNS & PedNSS
(2,8)
Page : 7

Growth and Anemia Indicators by Race/Ethnicity or Age (3)
Birth Weight(4)
Height and Weight(5,6)
AnemiaLow Hb/Hct
(7)
Low High ShortStature
Under-Weight
Obese > 2 YrsOverweight and Obese
Number %<2500 g
%>4000 g
Number % % % Number %Overweight
%Obese
Number %
Race/Ethnicity White, Not Hispanic 22,119 9.0 8.1 97,159 7.5 2.8 10.6 41,027 17.0 13.5 65,413 17.9 Black, Not Hispanic 14,851 15.1 3.6 56,653 8.2 4.2 9.1 22,575 13.9 11.1 36,297 35.3 Hispanic 6,171 8.4 7.3 27,928 7.1 2.3 13.5 12,216 18.0 18.1 19,012 20.2 American Indian/Alaska Native 182 5.5 10.4 619 8.1 3.4 17.9 233 18.5 23.2 363 22.3 Asian/Pacific Islander 898 11.9 4.2 4,171 7.5 3.8 9.5 1,807 13.2 11.8 2,918 20.7 Multiple Races 4,332 10.9 7.8 18,979 7.5 2.9 11.4 7,947 17.1 13.5 12,747 23.0 All Other 25 * * 66 * * * 21 * * 37 * Total 48,804 11.0 6.6 205,990 7.6 3.2 10.7 85,908 16.3 13.5 136,909 23.4
Age 0 - 11 Months - * * 62,004 12.4 5.4 5.8 - * * 5,483 27.9 12 - 23 Months - * * 45,577 8.7 0.8 11.0 - * * 44,518 26.6 24 - 35 Months - * * 35,240 5.2 2.0 12.9 22,746 15.7 12.3 31,365 25.3 36 - 47 Months - * * 29,802 4.0 3.3 13.4 29,798 16.0 13.4 28,408 21.6 48 - 59 Months - * * 33,367 3.1 3.4 14.5 33,364 16.9 14.5 27,135 17.0 Total - * * 205,990 7.6 3.2 10.7 85,908 16.3 13.5 136,909 23.4
(1) Reporting period is January 1 through December 31.(2) Analyses based on one record per child.(3) Excludes records with unknown data or errors.(4) Infants born during the reporting period included in the analysis.(5) Based on 2006 WHO growth chart percentiles for children under 2 years of age; short stature is defined as length-for-age <= 2.3rd percentile, underweight is defined as weight-for-length <= 2.3rd percentile, and high weight-for-length (labeled as "Obese") is defined as >= 97.7th percentile.(6) Based on 2000 CDC growth chart percentiles for children 2 years of age and older; short stature is defined as height-for-age < 5th percentile, underweight is defined as BMI-for-age < 5th percentile, overweight is defined as BMI-for-age >= 85th to < 95th percentile, and obesity is defined as >= 95th percentile.(7) Based on 1998 CDC MMWR, "Recommendations to Prevent and Control Iron Deficiency in the United States", altitude adjusted, children 6 months of age and older included in the analysis.* Percentages are not calculated if < 100 records are available for analysis after exclusions.
Children Aged < 5 Years
2018 Pediatric Nutrition Surveillance
Growth and Anemia Indicators by Race/Ethnicity or Age
Table 8C (1)
Michigan
Run Date: 6/4/2019
(2)
WIC PNNS & PedNSS
Page : 8

Age 0 - 11 Months - * - * - * - * 63,722 2.2 12 - 23 Months - * - * - * - * 45,717 2.9 24 - 35 Months - * - * - * 35,133 83.8 35,572 3.2 36 - 47 Months - * - * - * 31,917 81.7 32,118 3.5 48 - 59 Months - * - * - * 33,511 80.8 33,779 3.5 Total 49,377 66.8 38,049 31.4 32,543 12.7 100,561 82.1 210,908 2.9
Breastfeeding, TV Viewing, and Smoking in Household by Race/Ethnicity or Age (4)
Breastfeeding(5)
< 2 Hours TVViewing/Day
(7)
Smoking in Household
Number %Ever
Breastfed
Number %BreastfedAt Least
6Months
Number %BreastfedAt Least
12Months
Number % Number %
Race/Ethnicity White, Not Hispanic 22,367 71.8 17,658 35.0 15,817 15.1 48,424 87.5 99,293 2.8 Black, Not Hispanic 15,051 56.8 11,001 24.8 8,378 7.4 25,831 71.1 58,219 3.9 Hispanic 6,223 70.9 4,931 31.7 4,400 14.1 14,414 83.7 28,629 1.5 American Indian/Alaska Native 186 68.8 123 42.3 85 * 264 88.6 615 7.3 Asian/Pacific Islander 922 78.4 719 42.4 678 24.3 2,161 78.4 4,270 0.7 Multiple Races 4,372 66.7 3,441 30.3 3,155 10.5 9,356 83.3 19,410 3.4 All Other/Unknown 27 * 15 * 5 * 29 * 69 * Total 49,377 66.8 38,049 31.4 32,543 12.7 100,561 82.1 210,908 2.9
(1) Reporting period is January 1 through December 31.(2) TV Viewing and Smoking in Household are not reported by all contributors.(3) Analyses based on one record per child.(4) Excludes records with unknown data or errors.(5) Infants born during the reporting period included in the Ever Breastfed analysis. Infants who turned 6 months of age during the reporting period by/on their date of visit included in the Breastfed At Least 6 Months analysis. Children who turned 12 months of age during the reporting period by/on their date of visit included in the Breastfed At Least 12 Months analysis.(6) Children aged 2 years and older included in the analysis* Percentages are not calculated if < 100 records are available for analysis after exclusions.
Children Aged < 5 Years
2018 Pediatric Nutrition Surveillance
Breastfeeding, TV Viewing, and Smoking in Household by Race/Ethnicity or Age
Table 9C (1)
Michigan
Run Date: 6/4/2019
(3)
WIC PNNS & PedNSS
(2)
Page : 9

Summary of Trends in Racial and Ethnic DistributionYear Number
Included in Analysis
(3)
White, Not Hispanic
%
Black, Not Hispanic
%
Hispanic
%
American Indian/Alaska
Native%
Asian/Pacific Islander
%
Multiple Races
%
All Other/Unknown
%
2018 212,233 47.0 27.6 13.6 0.3 2.0 9.2 0.2
2017 208,288 47.7 27.8 13.5 0.3 2.0 8.5 0.1
2016 231,594 48.5 27.2 13.6 0.3 2.0 8.3 0.2
2015 240,590 49.0 27.1 13.5 0.3 1.9 8.1 0.2
2014 250,091 49.4 26.9 13.4 0.3 1.8 8.1 0.1
2013 253,913 49.6 26.8 13.6 0.3 1.6 7.9 0.1
2012 257,024 50.4 26.2 13.7 0.3 1.6 7.8 0.1
2011 257,910 51.0 25.7 14.0 0.3 1.5 7.5 0.1
(1) Reporting period is January 1 through December 31.(2) Analyses based on one record per child.(3) Excludes records with errors.
Children Aged < 5 Years
2018 Pediatric Nutrition Surveillance
Summary of Trends in Racial and Ethnic Distribution
Table 10C (1)
Michigan
Run Date: 6/4/2019
(2)
WIC PNNS & PedNSS
Page : 10

Summary of Trends in Age Distribution (3)
Year Number Included in
Analysis (4)
0 - 11 Months
%
12 - 23 Months
%
24 - 59 Months
%
2018 212,233 30.3 21.6 48.1
2017 208,288 26.1 22.9 51.0
2016 231,594 29.8 22.1 48.1
2015 240,590 29.7 22.3 48.0
2014 250,091 29.6 22.0 48.4
2013 253,913 29.3 22.5 48.3
2012 257,024 29.3 22.0 48.7
2011 257,910 29.5 21.9 48.7
(1) Reporting period is January 1 through December 31.(2) Analyses based on one record per child.(3) Records rejected if date of birth and date of visit unknown.(4) Excludes records with unknown data or errors.* Percentages are not calculated if < 100 records are available for analysis after exclusions.
Children Aged < 5 Years
2018 Pediatric Nutrition Surveillance
Summary of Trends in Age Distribution
Table 11C (1)
Michigan
Run Date: 6/4/2019
(2)
WIC PNNS & PedNSS
Page : 11

Summary of Trends in Growth and Anemia Indicators (3)
YearBirth Weight
(4)Height and Weight
(5,6)
AnemiaLow Hb/Hct
(7)
Low High ShortStature
Under-Weight
Obese > 2 YrsOverweight and Obese
Number %<2500 g
%>4000 g
Number % % % Number %Overweight
%Obese
Number %
2018 48,804 11.0 6.6 205,990 7.6 3.2 10.7 85,908 16.3 13.5 136,909 23.4
2017 38,606 11.8 6.5 202,447 7.2 3.0 10.7 89,268 16.2 13.2 142,864 22.8
2016 52,567 10.8 6.8 225,134 7.3 3.1 10.4 93,377 16.1 13.1 151,630 21.2
2015 55,089 10.5 6.8 234,036 6.8 3.0 10.1 97,204 16.3 12.9 157,509 19.6
2014 57,712 9.8 6.8 243,452 6.5 2.9 10.2 101,840 16.8 13.3 165,162 19.1
2013 58,430 9.6 6.9 247,235 6.4 3.0 10.3 103,993 16.8 13.2 163,964 19.2
2012 58,707 9.7 7.1 249,969 6.2 3.1 10.4 105,902 16.4 13.2 167,212 17.9
2011 59,582 9.4 6.9 251,251 6.1 3.1 10.4 106,051 16.5 13.2 166,650 16.4
(1) Reporting period is January 1 through December 31.(2) Analyses based on one record per child.(3) Excludes records with unknown data or errors.(4) Infants born during the reporting period included in the analysis.(5) Based on 2006 WHO growth chart percentiles for children under 2 years of age; short stature is defined as length-for-age <= 2.3rd percentile, underweight is defined as weight-for-length <= 2.3rd percentile, and high weight-for-length (labeled as "Obese") is defined as >= 97.7th percentile.(6) Based on 2000 CDC growth chart percentiles for children 2 years of age and older; short stature is defined as height-for-age < 5th percentile, underweight is defined as BMI-for-age < 5th percentile, overweight is defined as BMI-for-age >= 85th to < 95th percentile, and obesity is defined as >= 95th percentile.(7) Based on 1998 CDC MMWR, "Recommendations to Prevent and Control Iron Deficiency in the United States", altitude adjusted, children 6 months of age and older included in the analysis.* Percentages are not calculated if < 100 records are available for analysis after exclusions.
Children Aged < 5 Years
2018 Pediatric Nutrition Surveillance
Summary of Trends in Growth and Anemia Indicators
Table 12C (1)
Michigan
Run Date: 6/4/2019
(2)
WIC PNNS & PedNSS
Page : 12

Summary of Trends in Breastfeeding (3)
YearBreastfeeding
(4)
Number %Ever
Breastfed
Number %BreastfedAt Least6 Months
Number %BreastfedAt Least
12 Months
2018 49,377 66.8 38,049 31.4 32,543 12.7
2017 39,192 66.1 39,435 28.8 33,989 12.4
2016 53,465 65.3 42,533 19.7 37,529 11.6
2015 55,956 64.3 44,452 18.4 38,816 10.8
2014 58,296 62.9 45,723 18.5 40,540 9.9
2013 59,096 62.2 46,092 17.6 41,082 9.1
2012 59,352 60.7 46,180 17.7 42,029 8.9
2011 60,153 59.5 46,409 18.4 41,436 8.5
(1) Reporting period is January 1 through December 31.(2) Analyses based on one record per child.(3) Excludes records with unknown data or errors.(4) Infants born during the reporting period included in the Ever Breastfed analysis. Infants who turned 6 months of age during the reporting period by/on their date of visit included in the Breastfed At Least 6 Months analysis. Children who turned 12 months of age during the reporting period by/on their date of visit included in the Breastfed At Least 12 Months analysis.* Percentages are not calculated if < 100 records are available for analysis after exclusions.
Children Aged < 5 Years
2018 Pediatric Nutrition Surveillance
Summary of Trends in Breastfeeding
Table 13C (1)
Michigan
Run Date: 6/4/2019
(2)
WIC PNNS & PedNSS
Page : 13

Growth Indicators by Race/Ethnicity and Age (3)
Short Stature(4,5)
Underweight(4,5)
Obese(4,5)
> 2 Yrs Overweight and Obese(4,5)
Number % Number % Number % Number %Overweight
%Obese
White, Not Hispanic 0 - 11 Months 36,560 11.5 36,560 4.2 36,560 6.0 0 * *
12 - 23 Months 19,572 7.4 19,572 0.3 19,572 13.3 0 * *
24 - 59 Months 40,840 4.0 40,840 2.7 40,840 13.5 40,840 17.0 13.5
Total 96,972 7.5 96,972 2.8 96,972 10.6 96,972 7.2 5.7
Black, Not Hispanic 0 - 11 Months 23,712 13.3 23,712 5.3 23,712 6.3 0 * *
12 - 23 Months 10,366 7.0 10,366 0.7 10,366 11.4 0 * *
24 - 59 Months 22,430 3.2 22,430 4.7 22,430 11.1 22,430 13.9 11.1
Total 56,508 8.2 56,508 4.2 56,508 9.1 22,430 13.9 11.1
Hispanic 0 - 11 Months 10,114 10.1 10,114 3.9 10,114 7.3 0 * *
12 - 23 Months 5,598 7.7 5,598 0.2 5,598 14.6 0 * *
24 - 59 Months 12,156 4.2 12,156 2.0 12,156 18.2 12,156 17.9 18.2
Total 27,868 7.1 27,868 2.4 27,868 13.5 12,156 17.9 18.2
American Indian/Alaska Native 0 - 11 Months 280 12.5 280 5.4 280 8.9 0 * *
12 - 23 Months 106 6.6 106 0.9 106 30.2 0 * *
24 - 59 Months 230 3.5 230 2.2 230 23.5 230 18.7 23.5
Total 616 8.1 616 3.4 616 18.0 230 18.7 23.5
(1) Reporting period is January 1 through December 31.(2) Analyses based on one record per child.(3) Excludes records with unknown data or errors.(4) Based on 2006 WHO growth chart percentiles for children under 2 years of age; short stature is defined as length-for-age <= 2.3rd percentile, underweight is defined as weight-for-length <= 2.3rd percentile, and high weight-for-length (labeled as "Obese") is defined as >= 97.7th percentile.(5) Based on 2000 CDC growth chart percentiles for children 2 years of age and older; short stature is defined as height-for-age < 5th percentile, underweight is defined as BMI-for-age < 5th percentile, overweight is defined as BMI-for-age >= 85th to < 95th percentile, and obesity is defined as >= 95th percentile.* Percentages are not calculated if < 100 records are available for analysis after exclusions.
Children Aged < 5 Years
2018 Pediatric Nutrition Surveillance
Growth Indicators by Race/Ethnicity and Age
Table 16C (1)
Michigan
Run Date: 6/4/2019
(2)
WIC PNNS & PedNSS
Page : 14

Growth Indicators by Race/Ethnicity and Age (3)
Short Stature(4,5)
Underweight(4,5)
Obese(4,5)
> 2 Yrs Overweight and Obese(4,5)
Number % Number % Number % Number %Overweight
%Obese
Asian/Pacific Islander 0 - 11 Months 1,538 10.9 1,538 3.1 1,538 6.2 0 * *
12 - 23 Months 826 8.0 826 0.8 826 10.8 0 * *
24 - 59 Months 1,796 4.3 1,796 5.7 1,796 11.9 1,822 13.0 11.7
Total 4,160 7.5 4,160 3.8 4,160 9.5 1,796 13.1 11.9
Multiple Races 0 - 11 Months 7,110 12.6 7,110 4.2 7,110 7.0 0 * *
12 - 23 Months 3,922 6.9 3,922 0.6 3,922 15.0 0 * *
24 - 59 Months 7,907 3.2 7,907 3.0 7,907 13.5 7,907 17.1 14.7
Total 18,939 7.5 18,939 2.9 18,939 11.4 7,907 17.1 13.5
All Other/Unknown 0 - 11 Months 30 * 30 * 30 * 0 * *
12 - 23 Months 15 * 15 * 15 * 0 * *
24 - 59 Months 21 * 21 * 21 * 21 * *
Total 66 * 66 * 66 * 21 * *
Total All Race/Ethnic Groups 0 - 11 Months 79,629 12.0 79,629 4.5 79,629 6.3 0 * *
12 - 23 Months 40,453 7.3 40,453 0.4 40,453 13.1 0 * *
24 - 59 Months 85,460 3.8 85,460 3.2 85,460 13.5 85,460 16.3 13.5
Total 205,542 7.6 205,542 3.2 205,542 10.7 85,460 16.3 13.5
(1) Reporting period is January 1 through December 31.(2) Analyses based on one record per child.(3) Excludes records with unknown data or errors.(4) Based on 2006 WHO growth chart percentiles for children under 2 years of age; short stature is defined as length-for-age <= 2.3rd percentile, underweight is defined as weight-for-length <= 2.3rd percentile, and high weight-for-length (labeled as "Obese") is defined as >= 97.7th percentile.(5) Based on 2000 CDC growth chart percentiles for children 2 years of age and older; short stature is defined as height-for-age < 5th percentile, underweight is defined as BMI-for-age < 5th percentile, overweight is defined as BMI-for-age >= 85th to < 95th percentile, and obesity is defined as >= 95th percentile.* Percentages are not calculated if < 100 records are available for analysis after exclusions.
Children Aged < 5 Years
2018 Pediatric Nutrition Surveillance
Growth Indicators by Race/Ethnicity and Age
Table 16C (1)
Michigan
Run Date: 6/4/2019
(2)
WIC PNNS & PedNSS
Page : 15

AnemiaLow Hb/Hct
Number %Asian/Pacific Islander 6 - 11 Months 108 21.3 12 - 17 Months 515 21.7 18 - 23 Months 390 22.3 24 - 35 Months 653 20.4 36 - 59 Months 1,252 19.9 Total 2,918 20.7
Black, Not Hispanic 6 - 11 Months 1,892 37.1 12 - 17 Months 6,832 35.5 18 - 23 Months 4,915 38.1 24 - 35 Months 8,204 39.5 36 - 59 Months 14,454 31.6 Total 36,297 35.3
Multiple Races 6 - 11 Months 429 25.4 12 - 17 Months 2,515 25.6 18 - 23 Months 1,746 26.0 24 - 35 Months 3,042 25.8 36 - 59 Months 5,015 18.8 Total 12,747 23.0
Hispanic 6 - 11 Months 671 22.4 12 - 17 Months 3,460 25.1 18 - 23 Months 2,529 22.9 24 - 35 Months 4,387 21.6 36 - 59 Months 7,965 16.3 Total 19,012 20.2
All Other/Unknown 6 - 11 Months 4 * 12 - 17 Months 16 * 18 - 23 Months 38 * 24 - 35 Months 38 * 36 - 59 Months 63 * Total 159 17.0
American Indian/Alaska Native 6 - 11 Months 17 * 12 - 17 Months 69 * 18 - 23 Months 48 * 24 - 35 Months 79 * 36 - 59 Months 150 17.3 Total 363 22.3
Total All Race/Ethnic Groups 6 - 11 Months 5,482 27.9 12 - 17 Months 26,035 26.4 18 - 23 Months 18,483 26.8 24 - 35 Months 31,365 25.3 36 - 59 Months 55,543 19.3 Total 136,908 23.4
Anemia Indicators by Race/Ethnicity and Age (3,4)
AnemiaLow Hb/Hct
Number %White, Not Hispanic 6 - 11 Months 2,361 22.8 12 - 17 Months 12,628 22.2 18 - 23 Months 8,817 22.1 24 - 35 Months 14,962 18.7 36 - 59 Months 26,644 13.7 Total 65,412 17.9
(1) Reporting period is January 1 through December 31.(2) Analyses based on one record per child.(3) Excludes records with unknown data or errors.(4) Based on 1998 CDC MMWR, "Recommendations to Prevent and Control Iron Deficiency in the United States", altitude adjusted, children 6 months of age and older included in the analysis.* Percentages are not calculated if < 100 records are available for analysis after exclusions
Children Aged < 5 Years
2018 Pediatric Nutrition Surveillance
Anemia Indicators by Race/Ethnicity and Age
Table 17C (1)
Michigan
Run Date: 6/4/2019
(2)
WIC PNNS & PedNSS
Page : 16

Race/Ethnicity YearBirth Weight
(4)Height and Weight
(5,6)
AnemiaLow Hb/Hct
(7)
Low High ShortStature
Under-Weight
Obese > 2 YrsOverweight and Obese
Number %<2500 g
%>4000 g
Number % % % Number %Overweight
%Obese
Number %
White, Not Hispanic 2018 22,119 9.0 8.1 97,159 7.5 2.8 10.6 41,027 17.0 13.5 65,413 17.9
2017 17,655 9.9 8.3 96,835 7.0 2.6 10.8 43,079 16.8 13.3 68,808 17.3
2016 24,718 9.0 8.8 109,421 7.1 2.6 10.3 45,659 16.9 13.1 74,240 15.9
2015 26,289 8.8 8.6 114,948 6.7 2.6 9.9 47,623 16.9 12.9 77,714 14.3
2014 28,393 8.1 8.3 120,575 6.4 2.5 9.9 49,937 17.2 13.0 82,042 14.2
2013 28,825 8.2 8.6 123,092 6.4 2.7 9.9 51,046 17.2 12.8 81,420 14.2
2012 29,759 8.2 8.8 126,315 6.0 2.8 9.9 52,887 17.0 12.9 83,708 13.3
2011 30,418 7.8 8.4 128,453 5.9 2.8 9.9 54,175 16.9 12.6 84,861 12.1
Summary of Trends in Growth and Anemia Indicators by Race/Ethnicity (3)
Black, Not Hispanic 2018 14,851 15.1 3.6 56,653 8.2 4.2 9.1 22,575 13.9 11.1 36,297 35.3
2017 11,946 15.8 3.2 55,990 7.6 4.0 8.9 23,897 14.1 10.5 38,405 34.8
2016 15,331 15.1 3.5 60,949 7.9 4.2 8.7 24,395 13.9 10.4 39,952 33.0
2015 16,219 14.9 3.4 63,104 7.5 4.1 8.4 25,277 14.0 10.1 41,390 31.6
2014 16,486 13.9 3.7 65,179 7.0 4.0 8.6 26,469 14.7 10.6 43,113 30.3
2013 17,015 13.1 3.7 65,995 6.8 4.0 8.9 26,866 14.8 10.9 42,551 30.4
2012 16,431 13.6 3.7 65,159 6.8 4.3 9.0 26,658 13.9 10.4 42,673 28.4
2011 16,616 13.6 4.0 64,322 7.0 4.2 9.0 25,699 13.9 10.6 41,184 26.5
(1) Reporting period is January 1 through December 31.(2) Analyses based on one record per child.(3) Excludes records with unknown data or errors.(4) Infants born during the reporting period included in the analysis.(5) Based on 2006 WHO growth chart percentiles for children under 2 years of age; short stature is defined as length-for-age <= 2.3rd percentile, underweight is defined as weight-for-length <= 2.3rd percentile, and high weight-for-length (labeled as "Obese") is defined as >= 97.7th percentile.(6) Based on 2000 CDC growth chart percentiles for children 2 years of age and older; short stature is defined as height-for-age < 5th percentile, underweight is defined as BMI-for-age < 5th percentile, overweight is defined as BMI-for-age >= 85th to < 95th percentile, and obesity is defined as >= 95th percentile.(7) Based on 1998 CDC MMWR, "Recommendations to Prevent and Control Iron Deficiency in the United States", altitude adjusted, children 6 months of age and older included in the analysis.* Percentages are not calculated if < 100 records are available for analysis after exclusions.
Children Aged < 5 Years
2018 Pediatric Nutrition Surveillance
Summary of Trends in Growth and Anemia Indicators by Race/Ethnicity
Table 18C (1)
Michigan
Run Date: 6/4/2019
(2)
WIC PNNS & PedNSS
Page : 17

Race/Ethnicity YearBirth Weight
(4)Height and Weight
(5,6)
AnemiaLow Hb/Hct
(7)
Low High ShortStature
Under-Weight
Obese > 2 YrsOverweight and Obese
Number %<2500 g
%>4000 g
Number % % % Number %Overweight
%Obese
Number %
Hispanic 2018 6,171 8.4 7.3 27,928 7.1 2.3 13.5 12,216 18.0 18.1 19,012 20.2
2017 4,802 9.1 7.3 27,285 7.0 2.2 13.4 12,530 18.3 17.1 19,815 19.8
2016 6,692 8.5 7.5 30,497 6.8 2.1 13.7 13,337 18.3 17.7 21,198 18.1
2015 6,913 7.9 8.0 31,467 6.4 2.2 13.6 14,101 18.4 17.4 21,962 16.7
2014 6,941 7.4 8.0 32,579 6.2 1.9 14.4 14,826 19.2 18.5 23,001 16.6
2013 6,946 7.3 8.0 33,576 6.0 1.9 13.9 15,510 19.1 18.0 23,582 16.8
2012 7,159 7.2 8.0 34,292 5.9 2.2 14.1 15,878 18.6 18.4 24,421 16.4
2011 7,298 7.3 7.5 35,084 5.5 2.1 14.3 16,192 19.2 18.4 24,944 14.9
Summary of Trends in Growth and Anemia Indicators by Race/Ethnicity (3)
American Indian/Alaska Native 2018 182 5.5 10.4 619 8.1 3.4 17.9 233 18.5 23.2 363 22.3
2017 128 10.9 8.6 627 5.7 3.2 18.3 276 21.0 20.7 425 23.1
2016 151 10.6 7.3 672 6.7 3.6 18.0 285 21.1 21.1 438 20.5
2015 185 6.5 9.2 735 6.7 2.4 16.1 294 23.5 19.7 467 16.1
2014 179 11.2 10.1 745 5.6 2.7 16.6 304 21.7 23.4 466 20.4
2013 157 5.1 12.7 669 5.5 2.7 17.3 276 21.7 22.1 416 19.7
2012 159 6.3 15.7 695 5.6 2.7 14.5 279 22.6 16.5 420 14.8
2011 153 5.2 13.1 685 4.1 1.6 15.9 306 21.9 19.0 416 15.4
(1) Reporting period is January 1 through December 31.(2) Analyses based on one record per child.(3) Excludes records with unknown data or errors.(4) Infants born during the reporting period included in the analysis.(5) Based on 2006 WHO growth chart percentiles for children under 2 years of age; short stature is defined as length-for-age <= 2.3rd percentile, underweight is defined as weight-for-length <= 2.3rd percentile, and high weight-for-length (labeled as "Obese") is defined as >= 97.7th percentile.(6) Based on 2000 CDC growth chart percentiles for children 2 years of age and older; short stature is defined as height-for-age < 5th percentile, underweight is defined as BMI-for-age < 5th percentile, overweight is defined as BMI-for-age >= 85th to < 95th percentile, and obesity is defined as >= 95th percentile.(7) Based on 1998 CDC MMWR, "Recommendations to Prevent and Control Iron Deficiency in the United States", altitude adjusted, children 6 months of age and older included in the analysis.* Percentages are not calculated if < 100 records are available for analysis after exclusions.
Children Aged < 5 Years
2018 Pediatric Nutrition Surveillance
Summary of Trends in Growth and Anemia Indicators by Race/Ethnicity
Table 18C (1)
Michigan
Run Date: 6/4/2019
(2)
WIC PNNS & PedNSS
Page : 18

Race/Ethnicity YearBirth Weight
(4)Height and Weight
(5,6)
AnemiaLow Hb/Hct
(7)
Low High ShortStature
Under-Weight
Obese > 2 YrsOverweight and Obese
Number %<2500 g
%>4000 g
Number % % % Number %Overweight
%Obese
Number %
Asian/Pacific Islander 2018 898 11.9 4.2 4,171 7.5 3.8 9.5 1,807 13.2 11.8 2,918 20.7
2017 712 13.5 5.6 4,123 7.1 5.4 8.9 1,885 11.7 11.7 3,035 19.3
2016 948 11.3 3.8 4,400 6.3 4.5 8.1 1,952 10.9 10.8 3,144 19.9
2015 949 10.4 3.4 4,350 6.0 4.2 8.7 1,918 11.0 11.1 3,044 18.5
2014 977 10.2 5.2 4,447 6.4 4.0 8.7 1,916 12.4 13.1 3,138 17.2
2013 957 9.4 3.9 4,075 6.9 4.0 8.8 1,718 12.8 12.2 2,781 16.9
2012 917 11.6 3.8 3,903 6.8 4.2 8.0 1,693 14.1 11.3 2,676 17.2
2011 842 9.4 2.7 3,678 7.3 4.3 8.7 1,521 13.3 11.9 2,504 16.3
Summary of Trends in Growth and Anemia Indicators by Race/Ethnicity (3)
Multiple Races 2018 4,332 10.9 7.8 18,979 7.5 2.9 11.4 7,947 17.1 13.5 12,747 23.0
2017 3,294 10.8 7.3 17,304 7.0 2.7 11.6 7,518 16.4 14.5 12,240 22.2
2016 4,545 9.9 6.8 18,771 6.9 2.7 11.5 7,660 16.3 14.4 12,509 20.5
2015 4,403 9.0 7.2 19,078 6.7 2.6 11.4 7,916 17.0 14.2 12,810 18.8
2014 4,665 9.5 7.4 19,661 6.4 2.5 11.1 8,307 17.7 14.1 13,289 18.3
2013 4,427 9.2 7.6 19,581 6.0 2.6 11.4 8,523 17.3 14.3 13,135 18.2
2012 4,224 9.7 7.2 19,472 5.7 2.6 11.5 8,485 17.0 14.5 13,283 16.6
2011 4,198 9.0 7.1 18,898 5.4 2.9 11.7 8,139 17.2 14.7 12,711 15.9
(1) Reporting period is January 1 through December 31.(2) Analyses based on one record per child.(3) Excludes records with unknown data or errors.(4) Infants born during the reporting period included in the analysis.(5) Based on 2006 WHO growth chart percentiles for children under 2 years of age; short stature is defined as length-for-age <= 2.3rd percentile, underweight is defined as weight-for-length <= 2.3rd percentile, and high weight-for-length (labeled as "Obese") is defined as >= 97.7th percentile.(6) Based on 2000 CDC growth chart percentiles for children 2 years of age and older; short stature is defined as height-for-age < 5th percentile, underweight is defined as BMI-for-age < 5th percentile, overweight is defined as BMI-for-age >= 85th to < 95th percentile, and obesity is defined as >= 95th percentile.(7) Based on 1998 CDC MMWR, "Recommendations to Prevent and Control Iron Deficiency in the United States", altitude adjusted, children 6 months of age and older included in the analysis.* Percentages are not calculated if < 100 records are available for analysis after exclusions.
Children Aged < 5 Years
2018 Pediatric Nutrition Surveillance
Summary of Trends in Growth and Anemia Indicators by Race/Ethnicity
Table 18C (1)
Michigan
Run Date: 6/4/2019
(2)
WIC PNNS & PedNSS
Page : 19

Race/Ethnicity YearBirth Weight
(4)Height and Weight
(5,6)
AnemiaLow Hb/Hct
(7)
Low High ShortStature
Under-Weight
Obese > 2 YrsOverweight and Obese
Number %<2500 g
%>4000 g
Number % % % Number %Overweight
%Obese
Number %
All Other/Unknown 2018 25 * * 66 * * * 21 * * 37 *
2017 7 * * 51 * * * 21 * * 44 *
2016 18 * * 56 * * * 21 * * 34 *
2015 15 * * 50 * * * 18 * * 28 *
2014 15 * * 48 * * * 21 * * 31 *
2013 13 * * 45 * * * 22 * * 31 *
2012 7 * * 45 * * * 19 * * 25 *
2011 10 * * 45 * * * 17 * * 28 *
Summary of Trends in Growth and Anemia Indicators by Race/Ethnicity (3)
Total All Race/Ethnic Groups 2018 48,804 11.0 6.6 205,990 7.6 3.2 10.7 85,908 16.3 13.5 136,909 23.4
2017 38,606 11.8 6.5 202,447 7.2 3.0 10.7 89,268 16.2 13.2 142,864 22.8
2016 52,567 10.8 6.8 225,134 7.3 3.1 10.4 93,377 16.1 13.1 151,630 21.2
2015 55,089 10.5 6.8 234,036 6.8 3.0 10.1 97,204 16.3 12.9 157,509 19.6
2014 57,712 9.8 6.8 243,452 6.5 2.9 10.2 101,840 16.8 13.3 165,162 19.1
2013 58,430 9.6 6.9 247,235 6.4 3.0 10.3 103,993 16.8 13.2 163,964 19.2
2012 58,707 9.7 7.1 249,969 6.2 3.1 10.4 105,902 16.4 13.2 167,212 17.9
2011 59,582 9.4 6.9 251,251 6.1 3.1 10.4 106,051 16.5 13.2 166,650 16.4
(1) Reporting period is January 1 through December 31.(2) Analyses based on one record per child.(3) Excludes records with unknown data or errors.(4) Infants born during the reporting period included in the analysis.(5) Based on 2006 WHO growth chart percentiles for children under 2 years of age; short stature is defined as length-for-age <= 2.3rd percentile, underweight is defined as weight-for-length <= 2.3rd percentile, and high weight-for-length (labeled as "Obese") is defined as >= 97.7th percentile.(6) Based on 2000 CDC growth chart percentiles for children 2 years of age and older; short stature is defined as height-for-age < 5th percentile, underweight is defined as BMI-for-age < 5th percentile, overweight is defined as BMI-for-age >= 85th to < 95th percentile, and obesity is defined as >= 95th percentile.(7) Based on 1998 CDC MMWR, "Recommendations to Prevent and Control Iron Deficiency in the United States", altitude adjusted, children 6 months of age and older included in the analysis.* Percentages are not calculated if < 100 records are available for analysis after exclusions.
Children Aged < 5 Years
2018 Pediatric Nutrition Surveillance
Summary of Trends in Growth and Anemia Indicators by Race/Ethnicity
Table 18C (1)
Michigan
Run Date: 6/4/2019
(2)
WIC PNNS & PedNSS
Page : 20

Race/Ethnicity YearBreastfeeding
(4)
Number %Ever
Breastfed
Number %BreastfedAt Least6 Months
Number %BreastfedAt Least
12 Months
White, Not Hispanic 2018 22,367 71.8 17,658 35.0 15,817 15.1
2017 18,018 71.6 18,693 33.3 16,797 14.8
2016 25,269 70.4 20,561 23.1 18,792 14.2
2015 26,851 69.9 22,041 22.2 19,870 13.1
2014 28,707 69.0 22,860 22.2 20,845 12.2
2013 29,213 68.4 23,565 21.0 21,192 11.0
2012 30,142 66.9 23,888 20.7 21,888 10.6
2011 30,730 65.7 23,705 21.0 21,483 9.8
Summary of Trends in Breastfeeding Indicators by Race/Ethnicity (3)
Black, Not Hispanic 2018 15,051 56.8 11,001 24.8 8,378 7.4
2017 12,058 54.7 11,296 20.6 8,719 7.0
2016 15,514 53.5 11,753 12.4 9,661 6.0
2015 16,379 51.6 12,371 11.1 9,769 5.8
2014 16,595 49.7 12,610 11.6 10,364 4.8
2013 17,129 49.0 12,468 11.0 10,403 4.7
2012 16,564 47.4 12,264 11.2 10,525 4.4
2011 16,729 46.3 12,617 11.9 10,329 4.6
(1) Reporting period is January 1 through December 31.(2) Analyses based on one record per child.(3) Excludes records with unknown data or errors.(4) Infants born during the reporting period included in the Ever Breastfed analysis. Infants who turned 6 months of age during the reporting period by/on their date of visit included in the Breastfed At Least 6 Months analysis. Children who turned 12 months of age during the reporting period by/on their date of visit included in the Breastfed At Least 12 Months analysis.* Percentages are not calculated if < 100 records are available for analysis after exclusions.
Children Aged < 5 Years
2018 Pediatric Nutrition Surveillance
Summary of Trends in Breastfeeding Indicators by Race/Ethnicity
Table 19C (1)
Michigan
Run Date: 6/4/2019
(2)
WIC PNNS & PedNSS
Page : 21

Race/Ethnicity YearBreastfeeding
(4)
Number %Ever
Breastfed
Number %BreastfedAt Least6 Months
Number %BreastfedAt Least
12 Months
Hispanic 2018 6,223 70.9 4,931 31.7 4,400 14.1
2017 4,843 71.9 5,023 30.1 4,576 13.4
2016 6,768 72.4 5,500 21.4 5,006 12.0
2015 6,995 70.4 5,364 19.1 5,014 10.5
2014 7,028 68.2 5,525 18.6 5,174 10.0
2013 7,043 67.1 5,616 17.5 5,461 9.3
2012 7,236 64.3 5,580 19.3 5,527 10.2
2011 7,377 62.7 5,755 22.3 5,676 10.1
Summary of Trends in Breastfeeding Indicators by Race/Ethnicity (3)
American Indian/Alaska Native 2018 186 68.8 123 42.3 85 *
2017 128 75.8 112 28.6 100 17.0
2016 151 68.9 136 23.5 125 13.6
2015 188 67.6 127 20.5 135 11.9
2014 182 60.4 156 19.2 129 10.9
2013 165 58.8 123 23.6 112 12.5
2012 162 67.3 143 14.7 112 9.8
2011 167 57.5 127 18.9 106 10.4
(1) Reporting period is January 1 through December 31.(2) Analyses based on one record per child.(3) Excludes records with unknown data or errors.(4) Infants born during the reporting period included in the Ever Breastfed analysis. Infants who turned 6 months of age during the reporting period by/on their date of visit included in the Breastfed At Least 6 Months analysis. Children who turned 12 months of age during the reporting period by/on their date of visit included in the Breastfed At Least 12 Months analysis.* Percentages are not calculated if < 100 records are available for analysis after exclusions.
Children Aged < 5 Years
2018 Pediatric Nutrition Surveillance
Summary of Trends in Breastfeeding Indicators by Race/Ethnicity
Table 19C (1)
Michigan
Run Date: 6/4/2019
(2)
WIC PNNS & PedNSS
Page : 22
Race/Ethnicity YearBreastfeeding
(4)
Number %Ever
Breastfed
Number %BreastfedAt Least6 Months
Number %BreastfedAt Least
12 Months
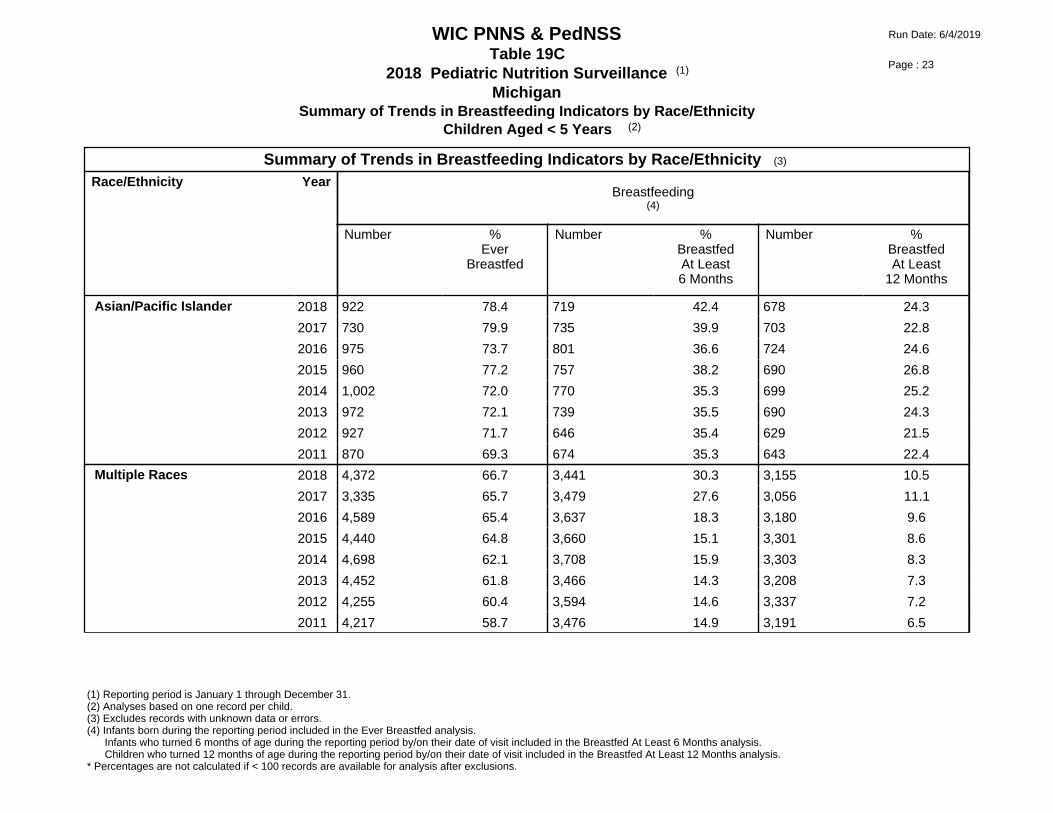
Asian/Pacific Islander 2018 922 78.4 719 42.4 678 24.3
2017 730 79.9 735 39.9 703 22.8
2016 975 73.7 801 36.6 724 24.6
2015 960 77.2 757 38.2 690 26.8
2014 1,002 72.0 770 35.3 699 25.2
2013 972 72.1 739 35.5 690 24.3
2012 927 71.7 646 35.4 629 21.5
2011 870 69.3 674 35.3 643 22.4
Summary of Trends in Breastfeeding Indicators by Race/Ethnicity (3)
Multiple Races 2018 4,372 66.7 3,441 30.3 3,155 10.5
2017 3,335 65.7 3,479 27.6 3,056 11.1
2016 4,589 65.4 3,637 18.3 3,180 9.6
2015 4,440 64.8 3,660 15.1 3,301 8.6
2014 4,698 62.1 3,708 15.9 3,303 8.3
2013 4,452 61.8 3,466 14.3 3,208 7.3
2012 4,255 60.4 3,594 14.6 3,337 7.2
2011 4,217 58.7 3,476 14.9 3,191 6.5
(1) Reporting period is January 1 through December 31.(2) Analyses based on one record per child.(3) Excludes records with unknown data or errors.(4) Infants born during the reporting period included in the Ever Breastfed analysis. Infants who turned 6 months of age during the reporting period by/on their date of visit included in the Breastfed At Least 6 Months analysis. Children who turned 12 months of age during the reporting period by/on their date of visit included in the Breastfed At Least 12 Months analysis.* Percentages are not calculated if < 100 records are available for analysis after exclusions.
Children Aged < 5 Years
2018 Pediatric Nutrition Surveillance
Summary of Trends in Breastfeeding Indicators by Race/Ethnicity
Table 19C (1)
Michigan
Run Date: 6/4/2019
(2)
WIC PNNS & PedNSS
Page : 23

Race/Ethnicity YearBreastfeeding
(4)
Number %Ever
Breastfed
Number %BreastfedAt Least6 Months
Number %BreastfedAt Least
12 Months
All Other/Unknown 2018 27 * 15 * 5 *
2017 7 * 14 * 11 *
2016 18 * 13 * 8 *
2015 15 * 6 * 9 *
2014 16 * 9 * 10 *
2013 13 * 6 * 7 *
2012 7 * 12 * 11 *
2011 10 * 8 * 8 *
Summary of Trends in Breastfeeding Indicators by Race/Ethnicity (3)
Total All Race/Ethnic Groups 2018 49,377 66.8 38,049 31.4 32,543 12.7
2017 39,192 66.1 39,435 28.8 33,989 12.4
2016 53,465 65.3 42,533 19.7 37,529 11.6
2015 55,956 64.3 44,452 18.4 38,816 10.8
2014 58,296 62.9 45,723 18.5 40,540 9.9
2013 59,096 62.2 46,092 17.6 41,082 9.1
2012 59,352 60.7 46,180 17.7 42,029 8.9
2011 60,153 59.5 46,409 18.4 41,436 8.5
(1) Reporting period is January 1 through December 31.(2) Analyses based on one record per child.(3) Excludes records with unknown data or errors.(4) Infants born during the reporting period included in the Ever Breastfed analysis. Infants who turned 6 months of age during the reporting period by/on their date of visit included in the Breastfed At Least 6 Months analysis. Children who turned 12 months of age during the reporting period by/on their date of visit included in the Breastfed At Least 12 Months analysis.* Percentages are not calculated if < 100 records are available for analysis after exclusions.
Children Aged < 5 Years
2018 Pediatric Nutrition Surveillance
Summary of Trends in Breastfeeding Indicators by Race/Ethnicity
Table 19C (1)
Michigan
Run Date: 6/4/2019
(2)
WIC PNNS & PedNSS
Page : 24

Age Year Height and Weight (4,5)
ShortStature
Under-Weight
Obese > 2 YrsOverweight and Obese
Number % % % Number %Overweight
%Obese
0 - 11 Months
2018 62,004 12.4 5.4 5.8 0 * *
2017 52,268 12.3 5.3 5.8 0 * *
2016 66,609 12.0 5.2 5.6 0 * *
2015 68,629 11.2 5.2 5.3 0 * *
2014 71,262 10.7 5.4 5.3 0 * *
2013 71,638 10.4 5.7 5.5 0 * *
2012 72,641 10.0 5.9 5.5 0 * *
2011 73,544 10.1 5.6 5.5 0 * *
2010 0 * * * 0 * *
Summary of Trends in Growth Indicators by Age (3)
Age Year Height and Weight (4,5)
ShortStature
Under-Weight
Obese > 2 YrsOverweight and Obese
Number % % % Number %Overweight
%Obese
24 - 35 Months
2018 35,240 5.2 2.0 12.9 22,746 15.7 12.3
2017 37,023 5.0 1.9 12.4 23,658 16.1 11.6
2016 39,147 4.6 2.0 12.5 24,917 16.2 11.9
2015 40,356 4.4 2.0 12.0 25,567 15.8 11.2
2014 42,023 4.5 1.8 12.1 26,576 16.4 11.5
2013 42,016 4.2 1.8 12.1 27,183 16.3 11.4
2012 42,357 4.4 2.0 11.8 27,135 15.7 11.1
2011 42,939 4.1 2.0 12.1 27,397 15.8 11.2
2010 0 * * * 0 * *
36 - 47 Months
2018 29,802 4.0 3.3 13.4 29,798 16.0 13.4
2017 30,732 3.7 3.3 13.2 30,725 15.6 13.2
2016 31,951 3.8 3.4 13.2 31,944 15.7 13.2
2015 33,528 3.7 3.1 12.6 33,520 15.8 12.6
2014 35,083 3.4 2.8 12.8 35,081 16.3 12.8
2013 35,462 3.7 2.7 12.7 35,458 16.5 12.7
2012 36,189 3.6 3.1 13.1 36,177 15.9 13.1
2011 37,006 3.4 3.1 13.0 37,004 16.3 13.0
2010 0 * * * 0 * *
12 - 23 Months
2018 45,577 8.7 0.8 11.0 0 * *
2017 47,537 8.3 0.8 10.5 0 * *
2016 50,907 8.2 0.8 10.8 0 * *
2015 53,403 7.8 0.8 10.4 0 * *
2014 54,900 7.3 0.7 10.1 0 * *
2013 56,763 7.0 0.8 10.4 0 * *
2012 56,190 6.7 0.6 10.5 0 * *
2011 56,112 6.5 0.7 10.7 0 * *
2010 0 * * * 0 * *
(1) Reporting period is January 1 through December 31.(2) Analyses based on one record per child.(3) Excludes records with unknown data or errors.(4) Based on 2006 WHO growth chart percentiles for children under 2 years of age; short stature is defined as length-for-age <= 2.3rd percentile, underweight is defined as weight-for-length <= 2.3rd percentile, and high weight-for-length (labeled as "Obese") is defined as >= 97.7th percentile.(5) Based on 2000 CDC growth chart percentiles for children 2 years of age and older; short stature is defined as height-for-age < 5th percentile, underweight is defined as BMI-for-age < 5th percentile, overweight is defined as BMI-for-age >= 85th to < 95th percentile, and obesity is defined as >= 95th percentile.* Percentages are not calculated if < 100 records are available for analysis after exclusions
Children Aged < 5 Years
2018 Pediatric Nutrition Surveillance
Summary of Trends in Growth Indicators by Age
Table 20C (1)
Michigan
Run Date: 6/4/2019
(2)
WIC PNNS & PedNSS
Page : 25
Age Year Height and Weight (4,5)
ShortStature
Under-Weight
Obese > 2 YrsOverweight and Obese
Number % % % Number %Overweight
%Obese
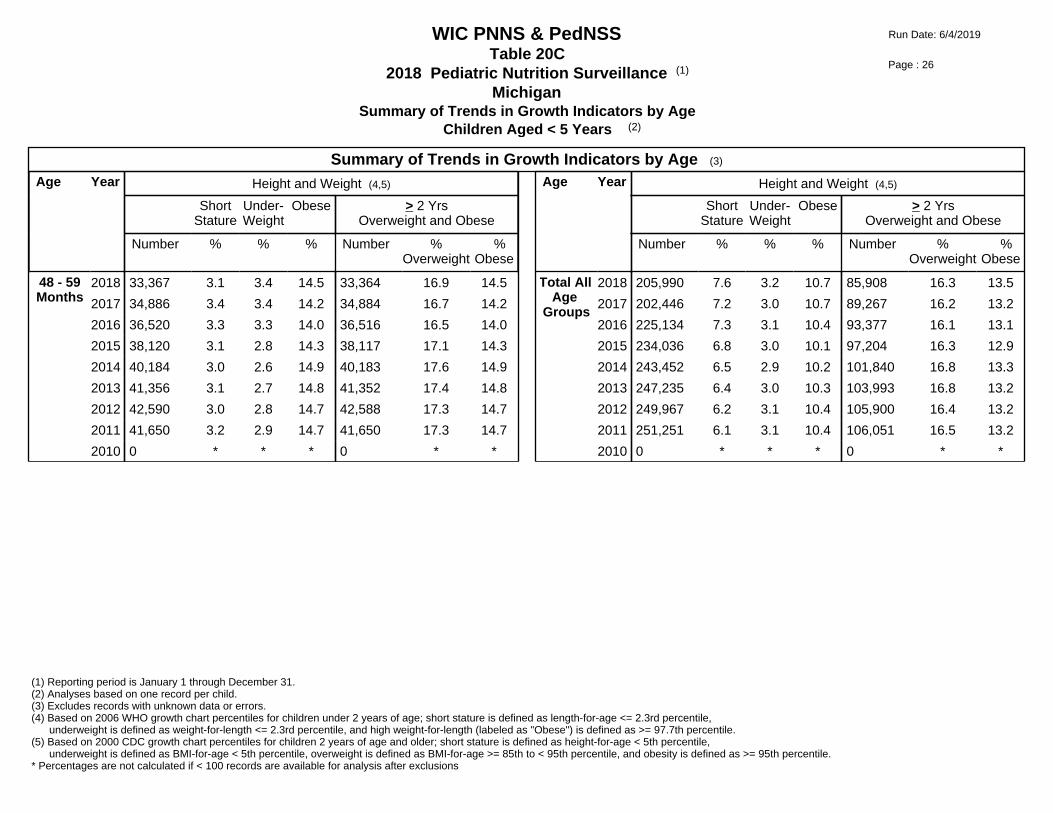
48 - 59 Months
2018 33,367 3.1 3.4 14.5 33,364 16.9 14.5
2017 34,886 3.4 3.4 14.2 34,884 16.7 14.2
2016 36,520 3.3 3.3 14.0 36,516 16.5 14.0
2015 38,120 3.1 2.8 14.3 38,117 17.1 14.3
2014 40,184 3.0 2.6 14.9 40,183 17.6 14.9
2013 41,356 3.1 2.7 14.8 41,352 17.4 14.8
2012 42,590 3.0 2.8 14.7 42,588 17.3 14.7
2011 41,650 3.2 2.9 14.7 41,650 17.3 14.7
2010 0 * * * 0 * *
Summary of Trends in Growth Indicators by Age (3)
Age Year Height and Weight (4,5)
ShortStature
Under-Weight
Obese > 2 YrsOverweight and Obese
Number % % % Number %Overweight
%Obese
Total All Age
Groups
2018 205,990 7.6 3.2 10.7 85,908 16.3 13.5
2017 202,446 7.2 3.0 10.7 89,267 16.2 13.2
2016 225,134 7.3 3.1 10.4 93,377 16.1 13.1
2015 234,036 6.8 3.0 10.1 97,204 16.3 12.9
2014 243,452 6.5 2.9 10.2 101,840 16.8 13.3
2013 247,235 6.4 3.0 10.3 103,993 16.8 13.2
2012 249,967 6.2 3.1 10.4 105,900 16.4 13.2
2011 251,251 6.1 3.1 10.4 106,051 16.5 13.2
2010 0 * * * 0 * *
(1) Reporting period is January 1 through December 31.(2) Analyses based on one record per child.(3) Excludes records with unknown data or errors.(4) Based on 2006 WHO growth chart percentiles for children under 2 years of age; short stature is defined as length-for-age <= 2.3rd percentile, underweight is defined as weight-for-length <= 2.3rd percentile, and high weight-for-length (labeled as "Obese") is defined as >= 97.7th percentile.(5) Based on 2000 CDC growth chart percentiles for children 2 years of age and older; short stature is defined as height-for-age < 5th percentile, underweight is defined as BMI-for-age < 5th percentile, overweight is defined as BMI-for-age >= 85th to < 95th percentile, and obesity is defined as >= 95th percentile.* Percentages are not calculated if < 100 records are available for analysis after exclusions
Children Aged < 5 Years
2018 Pediatric Nutrition Surveillance
Summary of Trends in Growth Indicators by Age
Table 20C (1)
Michigan
Run Date: 6/4/2019
(2)
WIC PNNS & PedNSS
Page : 26

Age Year AnemiaLow Hb/Hct
(4)
Number %
6 - 11 Months 2018 5,482 27.9
2017 5,591 25.6
2016 6,395 23.7
2015 6,044 23.2
2014 6,109 23.7
2013 5,563 22.2
2012 6,250 21.8
2011 6,120 20.2
Summary of Trends in Anemia by Age (3)
12 - 17 Months 2018 26,035 26.4
2017 26,896 26.8
2016 28,711 24.7
2015 29,986 22.6
2014 30,904 22.3
2013 31,997 22.7
2012 31,259 21.6
2011 30,406 19.8
Age Year AnemiaLow Hb/Hct
(4)
Number %
18 - 23 Months 2018 18,483 26.8
2017 19,582 26.2
2016 21,061 23.7
2015 22,073 22.3
2014 22,664 22.1
2013 22,735 22.4
2012 23,054 21.5
2011 23,223 19.6
24 - 35 Months 2018 31,365 25.3
2017 33,054 24.3
2016 34,974 22.6
2015 35,990 21.3
2014 38,199 20.8
2013 37,258 20.4
2012 37,748 19.5
2011 38,033 17.9
(1) Reporting period is January 1 through December 31.(2) Analyses based on one record per child.(3) Excludes records with unknown data or errors.(4) Based on 1998 CDC MMWR, "Recommendations to Prevent and Control Iron Deficiency in the United States", altitude adjusted, children 6 months of age and older included in the analysis.* Percentages are not calculated if < 100 records are available for analysis after exclusions
Children Aged < 5 Years
2018 Pediatric Nutrition Surveillance
Summary of Trends in Anemia by Age
Table 21C (1)
Michigan
Run Date: 6/4/2019
(2)
WIC PNNS & PedNSS
Page : 27

Age Year AnemiaLow Hb/Hct
(4)
Number %
36 - 59 Months 2018 55,543 19.3
2017 57,717 18.8
2016 60,489 17.5
2015 63,412 16.1
2014 67,284 15.3
2013 66,409 15.4
2012 68,897 13.9
2011 68,863 12.8
Summary of Trends in Anemia by Age (3)
All Other/Unknown 2018 0 *
2017 1 *
2016 0 *
2015 0 *
2014 0 *
2013 0 *
2012 2 *
2011 0 *
Age Year AnemiaLow Hb/Hct
(4)
Number %
Total All Age Groups 2018 136,909 23.4
2017 142,863 22.8
2016 151,630 21.2
2015 157,509 19.6
2014 165,162 19.1
2013 163,964 19.2
2012 167,210 17.9
2011 166,650 16.4
(1) Reporting period is January 1 through December 31.(2) Analyses based on one record per child.(3) Excludes records with unknown data or errors.(4) Based on 1998 CDC MMWR, "Recommendations to Prevent and Control Iron Deficiency in the United States", altitude adjusted, children 6 months of age and older included in the analysis.* Percentages are not calculated if < 100 records are available for analysis after exclusions
Children Aged < 5 Years
2018 Pediatric Nutrition Surveillance
Summary of Trends in Anemia by Age
Table 21C (1)
Michigan
Run Date: 6/4/2019
(2)
WIC PNNS & PedNSS
Page : 28