
Wi-Fi Location Fingerprinting Using an Intelligent ...
16
Wi-Fi Location Fingerprinting Using an Intelligent Checkpoint Sequence Guenther RETSCHER and Hannes HOFER Key words: Wi-Fi, location fingerprinting, training phase, intelligent checkpoints (iCPs), logical sequence SUMMARY For Wi-Fi positioning location fingerprinting is commonly employed. Fingerprinting, however, is very labour consuming as a database with RSS (Received Signal Strength) scans from all visible access points APs measured on a large number of known reference points has to be established. To overcome this drawback a novel approach is developed which uses a logical sequence of intelligent checkpoints iCPs instead of reference points RPs established in a regular grid throughout the area of interest. To navigate a user along the way from a start point A to a destination B certain iCPs have to be passed. Hence, iCPs are twofold intelligent because of the fact that they depend on the selection of the points for the RSS scans and because of their logical sequence in their correct order along the path. While navigating then always the following iCP is known due to a vector graph allocation in the fingerprinting database. Thus, only a small limited number of iCPs needs to be tested when matching the current RSS values. Therefore the required processing time is significantly reduced. From field tests it could be seen that the iCP approach achieves a higher success rate for correct matching of the RSS fingerprints than conventional approaches. In average correct matching results of 90.0% were achieved using a joint Wi-Fi database including training measurements of all employed smartphones. An even higher success rate is achieved if the same mobile device is used in both the training and positioning phase. ZUSAMMENFASSUNG Für die Positionierung mit WLAN (Wi-Fi) wird meistens das sog. Fingerprinting eingesetzt. Dieses Verfahren kann jedoch sehr zeitaufwendig sein, da auf einer Vielzahl von Referenz-punkten Signalstärkemessungen zu den sichtbaren Access Points APs in der Trainingsphase ausgeführt werden müssen. Der neue Ansatz versucht hier anzusetzen, in dem nur auf aus-gewählten Punkten, den sog. Intelligenten Checkpoints iCPs, Referenzmessungen vorgenom-men werden müssen. Für die Navigation eines Nutzers von einem Startpunkt A zum Ziel B müssen diese iCPs passiert werden. Sie sind daher zweifach intelligent, da sie von der Aus-wahl der Punkte für die Referenzmessungen abhängen und eine logische Reihenfolge entlang des Weges bilden. Daher ist bei der Navigation immer der nachfolgende iCP durch seine vektorielle Zuordnung in der Fingerprinting Datenbank bekannt. Es müssen dann nur mehr eine geringe Anzahl von Referenzpunkten erfasst werden. Dadurch werden die erforderlichen Berechnungszeiten signifikant reduziert. Testmessungen haben gezeigt, dass der neue Ansatz eine höhere Zuordnungsrate für die Signalstärkemessungen als konventionelle Methoden erzielt. Im Mittel liegt diese Rate bei 90%, wenn eine gemeinsame Datenbank für alle mobilen Endgeräte (Smartphones) verwendet wird. Eine noch höhere Zuordnungsrate wird erreicht, wenn das gleiche mobile Gerät in beiden Positionierungsphasen verwendet wird.
Transcript of Wi-Fi Location Fingerprinting Using an Intelligent ...

This is a Peer Reviewed Paper
FIG W
orking Week 2016
Wi-Fi Location Fingerprinting Using an Intelligent Checkpoint Sequence (7993)
Guenther Retscher and Hannes Hofer (Austria)
FIG Working Week 2016
Recovery from Disaster
Christchurch, New Zealand, May 2–6, 2016
Wi-Fi Location Fingerprinting Using an Intelligent Checkpoint Sequence
Guenther RETSCHER and Hannes HOFER
Key words: Wi-Fi, location fingerprinting, training phase, intelligent checkpoints (iCPs), logical sequence SUMMARY For Wi-Fi positioning location fingerprinting is commonly employed. Fingerprinting, however, is very labour consuming as a database with RSS (Received Signal Strength) scans from all visible access points APs measured on a large number of known reference points has to be established. To overcome this drawback a novel approach is developed which uses a logical sequence of intelligent checkpoints iCPs instead of reference points RPs established in a regular grid throughout the area of interest. To navigate a user along the way from a start point A to a destination B certain iCPs have to be passed. Hence, iCPs are twofold intelligent because of the fact that they depend on the selection of the points for the RSS scans and because of their logical sequence in their correct order along the path. While navigating then always the following iCP is known due to a vector graph allocation in the fingerprinting database. Thus, only a small limited number of iCPs needs to be tested when matching the current RSS values. Therefore the required processing time is significantly reduced. From field tests it could be seen that the iCP approach achieves a higher success rate for correct matching of the RSS fingerprints than conventional approaches. In average correct matching results of 90.0% were achieved using a joint Wi-Fi database including training measurements of all employed smartphones. An even higher success rate is achieved if the same mobile device is used in both the training and positioning phase. ZUSAMMENFASSUNG Für die Positionierung mit WLAN (Wi-Fi) wird meistens das sog. Fingerprinting eingesetzt. Dieses Verfahren kann jedoch sehr zeitaufwendig sein, da auf einer Vielzahl von Referenz-punkten Signalstärkemessungen zu den sichtbaren Access Points APs in der Trainingsphase ausgeführt werden müssen. Der neue Ansatz versucht hier anzusetzen, in dem nur auf aus-gewählten Punkten, den sog. Intelligenten Checkpoints iCPs, Referenzmessungen vorgenom-men werden müssen. Für die Navigation eines Nutzers von einem Startpunkt A zum Ziel B müssen diese iCPs passiert werden. Sie sind daher zweifach intelligent, da sie von der Aus-wahl der Punkte für die Referenzmessungen abhängen und eine logische Reihenfolge entlang des Weges bilden. Daher ist bei der Navigation immer der nachfolgende iCP durch seine vektorielle Zuordnung in der Fingerprinting Datenbank bekannt. Es müssen dann nur mehr eine geringe Anzahl von Referenzpunkten erfasst werden. Dadurch werden die erforderlichen Berechnungszeiten signifikant reduziert. Testmessungen haben gezeigt, dass der neue Ansatz eine höhere Zuordnungsrate für die Signalstärkemessungen als konventionelle Methoden erzielt. Im Mittel liegt diese Rate bei 90%, wenn eine gemeinsame Datenbank für alle mobilen Endgeräte (Smartphones) verwendet wird. Eine noch höhere Zuordnungsrate wird erreicht, wenn das gleiche mobile Gerät in beiden Positionierungsphasen verwendet wird.

Wi-Fi Location Fingerprinting Using an Intelligent Checkpoint Sequence
Guenther RETSCHER and Hannes HOFER
1. INTRODUCTION AND MOTIVATION
Modern smartphones offer a number of components which are usable for positioning. The Wi-Fi
module is commonly used for so-called location fingerprinting where the received signal strengths
RSS values are measured from several ‘visible’ Wi-Fi access points APs and assigned to their
location. Besides Wi-Fi the measurements of motion sensors such as the accelerometer or magnetic
field sensor and barometer can be used to obtain changes in position. The acceleration sensor and
the digital compass may be employed to count the steps of the user and their direction. At the
beginning of this study the question arose how positioning by means of GNSS, Wi-Fi fingerprinting
and motion sensors on a typical smartphone can be achieved and how sensors can be combined
meaningfully. Thus, an idea for continuous navigation and positioning developed in which certain
checkpoints and the position changes between them are used. These checkpoints shall be recognized
by means of Wi-Fi fingerprinting and the change of the user’s position obtained with the help of the
motion sensors. Thereby an absolute positioning with Wi-Fi is essential as the drift rates of the
motion sensors accumulate resulting in low positioning accuracies. In this paper the focus is led on
localization using Wi-Fi on these checkpoints.
The RSS of the Wi-Fi signals can be easily accessed via the Application Programming Interface
(API) in a standard Wi-Fi device. A mobile device, such as a smartphone or tablet, can obtain the
RSS observables via a passive scanning because the APs emit periodically beacon frames which
include the RSS information of the corresponding AP (Chen et al., 2012). Hence, there is no need to
establish a data communication with the wireless network but only the RSS to the surrounding
‘visible’ APs are measured on the mobile device. The most commonly employed Wi-Fi positioning
method is location fingerprinting which involves a training and a positioning phase. For the
establishment of a fingerprinting database known reference points RPs are usually distributed in a
regular grid throughout the area of interest. To achieve acceptable results for localization
determination with positioning accuracies on the few meter level or at least to locate the user in the
correct room in a building the grid has to be rather dense (Chen et al., 2013; Retscher and Hofer,
2015). This is the main disadvantage of location fingerprinting as it is very labour consuming to
establish this database. Thus, a novel approach for fingerprinting is developed in this study.
The paper is organized as follows: In section 2 the novel approach for Wi-Fi fingerprinting is
introduced followed by a description of the outdoor field test site and test arrangement in section 3.
In section 4 major results of the experiments are presented. A discussion of the results and final
remarks in section 5 conclude the paper.
Wi-Fi Location Fingerprinting Using an Intelligent Checkpoint Sequence (7993)
Guenther Retscher and Hannes Hofer (Austria)
FIG Working Week 2016
Recovery from Disaster
Christchurch, New Zealand, May 2–6, 2016

2. NOVEL APPROACH FOR Wi-Fi FINGERPRINTING
For Wi-Fi fingerprinting RSS are measured in two phases, i.e, in an off-line or training and an on-
line or positioning phase. During the training phase, a receiver periodically scans its environment to
discover networks and record the RSS of APs. For that purpose the RSS scans are measured on
known reference points (RPs) distributed throughout the area of interest. The RSS measured at RPs
in the area of interest are defining an RSS fingerprint for that particular location. Once the training
phase is completed the data is processed to build a radio-map and stored in a fingerprinting database
DB. During the positioning phase, the RSS of APs at the receiver location is recorded in real-time
and then the position of the receiver is determined through comparison of the readings from APs
with the data stored in the radio-map or DB (Chang et al., 2010). In the fingerprinting DB each AP
is represented by its RSS and MAC (Media Access Control) address. In the positioning phase RSS
scans are performed to locate a mobile user and matched with the DB values. Usually the Euclidean
distance is used for the calculation of the minimum distance between the current user’s location and
the DB RSS values. Other distances, such as Manhattan, Chebyshev, Canberra, Cosine, Sorensen,
Helinger, Chi-square and Jeffrey, have been investigated by Moghtadaiee and Dempster (2015).
The obtained results are very similar if these other distances are used and in most cases the
Euclidean distance achieved the best results if the nearest neighbour (NN) fingerprinting approach
is employed. Thus, in this study we have concentrated on the Euclidean distance. The
measurements in the training phase, however, are very labour consuming as it is required to have a
high density of reference points RPs to achieve acceptable results, for instance, to determine in
which a room a user is currently located. Therefore the new approach aims at a significant reduction
of required RPs. Due to the dependence of RPs along the way a logical sequence can be derived
when navigating from a start point A to a destination B. To be able to use this logical sequence, it is
necessary, to recognize certain interchanges or nodes along the way. It is the idea that not – as usual
– RSS scans are performed in a grid of RPs in the training phase but in an intelligent manner on
points chosen especially for them. These so-called intelligent checkpoints iCPs are located on well
distinguishable nodes along the way. Thereby their selection depends on a meaningful choice from
the large number of possible RPs in the area of interest. When navigating in a multi-storey building
to a certain room, for instance, certain waypoints have to be passed. Coming from outdoors, first an
entrance has to be chosen and then one will enter a foyer or similar area. To reach the next floor,
either the stairs or an elevator must be used. Before one can reach the designated room one has to
walk along a corridor. Hence, the route can be divided into waypoints which are dependent on each
other. They have to be passed following a logical sequence to reach the designated destination.
Doors, stairways and corridors can be considered as points or nodes along the way which define the
possible path. Obviously these waypoints have to be recognized and their logical connections
between them in the process of navigation to the desired destination. To analyze whether this novel
approach can be realized the following research questions are examined:
How the iCPs must be chosen that they are well distinguishable?
Can it be recognized, when and whether an iCP is passed?
How the trajectory can be continuously determined between these points?
Wi-Fi Location Fingerprinting Using an Intelligent Checkpoint Sequence (7993)
Guenther Retscher and Hannes Hofer (Austria)
FIG Working Week 2016
Recovery from Disaster
Christchurch, New Zealand, May 2–6, 2016

The study at hand deals with these three research questions. A system which achieves these aims is
developed (Hofer, 2015). The implementation is realized with an Android App for the data
acquisition and an evaluation tool in MATLAB. From measured RSS scans on RPs established in a
rather high density throughout the area of interest iCPs are selected from the field tests which can
be identified and revealed very well. In contrast to common fingerprinting approaches where the
RPs are often distributed in a regular grid the iCPs are chosen in an intelligent manner on important
and well distinguishable decision points such as crossings, entrances, and other important
waypoints. Besides this, they are these locations which must be passed and lead to new distinctive
areas. For the identification in indoor environments the multi-storey building is differentiated into
different sections. For example, the entrances to the building, stairs and elevators can define
different sections. On the other hand, if someone walks outdoors, for instance, he uses a sidewalk
and at a crossing he has to decide which way he chooses. In combination with maps of the
environment then a logical sequence can be derived due to the interdependence of the iCPs along
the way (Hofer, 2015). For such connections a vector graph allocation offers a suitable data
structure. Then always the following iCP is known due to the vector graph allocation in the
fingerprinting DB. In the following the test site is presented and the analyses of extensive field
experiments are discussed in detail.
3. OUTDOOR FIELD EXPERIMENT SITE AND TEST ARRANGEMENT
In this study different in- and outdoor test sites are selected. In this paper only outdoor field
experiments are presented. These tests were performed around a residential block shown in
Figure 1. In total 23 RPs were selected as candidates for the iCPs in this area. The iCPs are
represented as yellow dots in the Figure. The circles around the iCPs indicate their influence and are
used as test distances ranging from around 4.0 to 5.5 m. The points marked with a green star are
used to define the trajectory for the tests. The iCPs at crossings are not directly located at the
building corner but close by to be able to distinguish them more easily. iCP 3 and 5 at the corner,
for instance, are selected in a way that visible APs are different. For the construction of the RSS
fingerprinting DB RSS scans were performed on these points repeatedly in four different
orientations as shown in Figure 1 with two different smartphones. In the whole test area more than
200 different APs of private networks could be scanned at all locations.
Figure 1: Outdoor field test site around a residential block
Wi-Fi Location Fingerprinting Using an Intelligent Checkpoint Sequence (7993)
Guenther Retscher and Hannes Hofer (Austria)
FIG Working Week 2016
Recovery from Disaster
Christchurch, New Zealand, May 2–6, 2016

As a preliminary work RSS scans were measured for the establishment of the fingerprinting DB in
the training phase throughout the test site to be able to choose representative iCPs. As it is also
possible to determine a user’s heading with a smartphone with the in-built magnetometer this
observation can be used additionally. Thus, we tested whether it leads to better results if the heading
is considered and then only the RSS scan in this orientation is used. Besides comes along that the
selected consecutive iCPs can only be passed in certain directions according to the heading of the
user.
4. MAJOR RESULTS FROM THE FIELD EXPERIMENTS
In this section selected results of the field experiments are presented and analysed. Firstly, the
prerequisites for the evaluation are defined in section 4.1 followed by a description of the obtained
results of different calculation variants. Section 4.2 compares the results in the cases where the
heading of the user is either not or is considered. Then in section 4.3 the differences for two varying
calculation algorithms are analysed. Finally, the matching rates MRs for consecutive iCPs is
discussed in section 4.4 and the MRs for different DBs in section 4.5.
4.1 Evaluation Premises and Definitions
The success of the fingerprinting matching approach using the nearest neighbour (NN) algorithm in
the positioning phase is termed as correct matching rate MR in the paper. It is as follows:
number of correctly assigned RSS scans to RPsmatching rate MR =
total number of all RSS scans in positioning phase. (1)
Rather than the positioning accuracies defined in metric units in the paper the MR defined in
equation (1) is used to indicate the performance of the different calculation approaches. In this study
only static observations on the RPs and iCPs have been considered and no kinematic measurements.
Thus it is justified to indicate the performance of the fingerprinting approach using the MR on the
static observed points instead of giving the positioning accuracy. If in the positioning phase an RSS
scan on a certain location is correctly matched to the respective iCP then the matching algorithm
could find the correct location of the user.
In the NN algorithm the Euclidean distance D is calculated for each AP in the positioning phase
from the DB values. The distance can be described by the following mathematical relationship:
22
11 ,..., APnAPnAPAP SiSmSiSmD (2)
where APnAPAP SmSmSm ,...,, 21 describes the measured RSS vector for the positioning and
APnAPAP SiSiSi ,...,, 21 the reference for location i in the used fingerprinting DB. This calculation has
to be done for all possible locations. Figure 2 shows a diagram of the principle idea for the
definition of the distance relationship between the DB of the training phase and the positioning
phase. In the simplified case shown here two test locations TP 1 and 2 are in the DB where the
allocation of the positioning scans with the DB is specified regarding to their corresponding
Wi-Fi Location Fingerprinting Using an Intelligent Checkpoint Sequence (7993)
Guenther Retscher and Hannes Hofer (Austria)
FIG Working Week 2016
Recovery from Disaster
Christchurch, New Zealand, May 2–6, 2016

minimum distance. We used the Euclidean distance as matching strategy. In the shown case then
the scan is allocated to TP 1.
Figure 2: Allocation of positioning scans to training fingerprinting DB
In the evaluation of the experiments first of all it is investigated if whether the arithmetic mean or
median is more suitable for averaging the RSS scans measured in the training phase on a certain RP.
Furthermore, it is examined how the RSS measurements on a particular RP to a certain AP should
be considered in the DB if not in every scan epoch a RSS value is obtained during the whole
duration of the measurements in the training phase on that point. This effect is mainly caused due to
high spatial and temporal fluctuation and variation of the RSS values. Hence, either a minimum
value of -101 dBm is assigned for a certain RSS scan or it is ignored and no value is stored in the
DB. The second case is referred to with the term ‘Not a Number’ (NaN) following the respective
MATLAB function. Equation (3) shows the relationship for the first case where an RSS value of -
101 dBm is assigned for APs where no RSS is obtained in a certain epoch:
1,...,99,10011,...,1,1Scan1 021 APxAPnAPAP SSSS (3)
with
RSS APx in dBm if RSS value to APx is obtained1
-101 dBm if RSS value to APx not obtained APxS
where n is the number of APs given in the vector APx = [AP1, AP2, ... , APn] in the test area.
The second case is described with Equations (4):
NaN1,...,99,10022,...,2,2Scan2 021 APxAPnAPAP SSSS (4)
with
RSS APx in dBm if RSS value to APx is obtained2
NaN if RSS value to APx is not obtained APxS
.
Wi-Fi Location Fingerprinting Using an Intelligent Checkpoint Sequence (7993)
Guenther Retscher and Hannes Hofer (Austria)
FIG Working Week 2016
Recovery from Disaster
Christchurch, New Zealand, May 2–6, 2016

Due to this definition the vectors Scan1 and Scan2 have the same dimension. The APs are distinct
able by their BSSID (Basic Service Set Identification) number which either corresponds to the
MAC address of the Wi-Fi network or which is randomly generated as a substitute. If for a certain
AP no RSS value is obtained in a certain epoch only the available measurements in the vector
Scan2 (with NaN) are used for the calculations (see equation (4)). While using the vector with the
minimum value of -101 dBm all RSS values are assigned this value for not available scans in a
certain epoch. This procedure can also be seen as a weighting of the observations as in the case
where RSS values to an AP cannot be measured in most epochs, the rather the average value will
reach the minimum value of -101 dBm. For instance, if for a certain AP only once a RSS value of -
91 dBm out of ten scans is measured then the arithmetic mean would result in -100 dBm when
using the vector Scan1, whereas when ignoring the other nine scan values and using the vector
Scan2 the arithmetic mean would result in -91 dBm. With such a differentiation of the calculation
methods the effects of fluctuations and temporal variations of the RSS scans can be efficiently
considered. As the arithmetic mean and the median can be calculated following these two methods
four different fingerprinting databases DBs are formed, i.e., the mean DB (-101 dBm), mean DB
(NaN), median DB (-101 dBm) and median DB (NaN).
As an alternative to the calculation of the mean RSS values two algorithms are investigated which
are using the Euclidean distances D to all recorded RSS vectors. For these methods all RSS vectors
are used in the DB. Then the vector Wi-Fi Scans given in equation (5) includes the respective
positions to the RSS scans:
.1 1, 1 1,
1
. , 1 ,
1 1
Wi-Fi Scans all Scans DB
1 1
Scan No AP APn
Scan
Scan No W W AP W APn
P S S
P S S
(5)
where [1, ... , W] is the number No. of all Wi-Fi Scans and all Scans DBScan1 is the DB containing
all scans S11,AP1 to S1W,APn.
Then the calculation of the Euclidean distance D leads to a distance vector with the dimension
1 W . The vector is sorted ascending with the respective MATLAB function sort (). For the
selection of the position k minimum distances Dk are used to find a single position:
1 2min min min, , ,
kkD d d d (6)
with
1 2min min minPoint , , ,
k kSD ID ID ID ID . (7)
In the first algorithm called most frequent values MFV the MATLAB function mode () is applied to
vector Point IDs. Using this approach the ID is selected which exits most frequently in the vector:
Wi-Fi Location Fingerprinting Using an Intelligent Checkpoint Sequence (7993)
Guenther Retscher and Hannes Hofer (Austria)
FIG Working Week 2016
Recovery from Disaster
Christchurch, New Zealand, May 2–6, 2016

mode ( Point )kselected SID D ID . (8)
If two Point IDs exist in the vector the first one is selected which has the minimum Euclidean
distance Dk.
In the second investigated algorithm the probability pj for each distance value is calculated
additionally. This approach is referred to as likelihood algorithm. The total probability pID for a
certain position results from all probabilities pi for this position in the form:
1
min
1
min
1
j
j k
i
i
dp
d
(9)
where Point
1
k
ID i
i
p p
for all Point IDs in the vector PointkSD ID exist.
Because the likelihood is higher the smaller the distance value is, these are inverted. As can be seen
in equation (10) Dk is the sum of the inverted distance values k:
1 :
1k
k
i i PosID
DD
. (10)
Then the values in the sorted Euclidean distance vector are inverted and divided by Dk. Therefore
the vector with all probabilities contains the likelihoods of the RSS vectors. Their sum equals to 1.
The assumption is made that at least one RSS vector represents the matching position as the
positions can be several times represented in the vector. Thus, the single likelihoods which belong
to the same position have to be subsumed. Then the probability for the position Point ID is
calculated as Point
1
k
ID i
i
p p
and for every position in the vector a likelihood is been calculated.
This likelihood depends on the number of hits and their distance values. The more hits for a position
exist and the more less the Euclidean distances are the higher likelihood becomes the value for this
position. The position with the highest likelihood value is then chosen. To receive no distorted
likelihoods, all positions with the same number should be represented in the RSS vector in the
fingerprinting DB. For the analyses the likelihood algorithm is calculated using the respective
MATLAB function likelihood ().
In section 4.3 selected results using the calculation variants MFV and likelihood are presented and
discussed. In the following section 4.2 results are described for use cases where the heading of the
user is either not or is considered.
Wi-Fi Location Fingerprinting Using an Intelligent Checkpoint Sequence (7993)
Guenther Retscher and Hannes Hofer (Austria)
FIG Working Week 2016
Recovery from Disaster
Christchurch, New Zealand, May 2–6, 2016

4.2 Results of Calculation Variants Without and With Consideration of the User’s Heading
Table 1 summarizes the results for the average MRs of all tested calculation variants using different
DBs and all directions of the measured four orientations. Note that RSS scans in four orientations
are commonly performed to encounter the influence of the human body of the mobile user in the
training phase (compare e.g. Li et al., 2007). In total eight combinations are formed and included in
the results summarized in Table 1. Two test DBs are formed in the same manner like the two
vectors Scan1 and Scan2, i.e., DB1 with a minimum value of -101 dBm and DB2 with
NaN. They are used to indicate test cases where one RSSI scan is assigned differently to a certain
value in the DB. In the most commonly employed NN matching algorithm (Bahl and Padmanabhan,
2000) the Euclidean distance for all test RSS scans is calculated in the positioning phase from the
DB values (see equation (4)). As mentioned in section 4.1 two calculation methods are examined,
i.e., either the calculation of the arithmetic mean or median. This resulted in eight calculation
variants as shown in the columns in Table 1 whereby test scans with a DB with a minimum value of
-101 dBm are highlighted in blue and the ones with the ignored measurements (NaN) in green.
Furthermore the difference in the results is analysed if either a joint DB including RSS scans of all
mobile devices or two DBs containing only the scans of a particular smartphone are used. In the
first two rows the results for smartphone SM1 (SM1 DB) and SM2 (SM2 DB) respectively are
given whereas in the third row the results for the joint DB. The best results for the matching rate are
highlighted in bold. Finally, the fourth row summarizes the mean MRs.
Table 1: Matching rates MRs with consideration of all four orientations
scenarios
Test DB1 (-101dBm) Test DB2 (NaN)
mean
MR
mean DB median DB mean DB median DB
-
101dbm NaN
-
101dbm NaN -101dbm NaN
-
101dbm NaN
SM1 DB 94,1% 67,5% 90,2% 66,8% 91,6% 92,0% 90,2% 92,3% 85,59%
SM2 SB 95,7% 86,2% 92,6% 85,5% 92,9% 96,1% 90,4% 96,1% 91,94%
joint DB 95,8% 59,7% 94,2% 55,8% 91,4% 88,2% 90,7% 88,6% 83,05%
mean MR 95,2% 71,1% 92,3% 69,4% 92,0% 92,1% 90,4% 92,3% 86,85%
Table 2: Matching rates MRs with consideration of the heading of the user
scenarios
Test DB1 (-101dBm) Test DB2 (NaN)
mean
MR
mean DB median DB mean DB median DB
-
101dbm NaN
-
101dbm NaN -101dbm NaN
-
101dbm NaN
SM1 DB 92,7% 86,7% 90,9% 90,9% 88,1% 93,4% 84,6% 93,7% 90,1%
SM2 SB 96,1% 92,6% 95,4% 95,4% 92,9% 94,3% 92,9% 94,3% 94,2%
joint DB 95,2% 79,6% 94,5% 94,5% 91,2% 90,5% 89,4% 90,0% 90,6%
mean MR 94,7% 86,3% 93,6% 93,6% 90,7% 92,7% 89,0% 92,7% 91,7%
Wi-Fi Location Fingerprinting Using an Intelligent Checkpoint Sequence (7993)
Guenther Retscher and Hannes Hofer (Austria)
FIG Working Week 2016
Recovery from Disaster
Christchurch, New Zealand, May 2–6, 2016

As can be seen from Table 1 the highest MRs were achieved with the mean DB (-101 dBm) and
Test DB1. As mentioned above, the averaging of the RSS vectors can also be seen as weighting.
This weighting favours more stable APs with less temporal variations which is usually the case in
public spaces. The difference for this can also be seen when comparing Test DB1 and 2. Improved
results can be achieved if the RSS scans to the only available APs are used for the calculation. It
must be taken into account that some of the examined iCPs are not located very far from each other.
These are two pairs of iCPs around the corners, i.e., point 3 and 5 as well as 9 and 10 (compare
Figure 1). To what extent it is possible to distinguish these points, was one of the intention for these
tests.
In comparison Table 2 shows the MRs if the heading of the user measured from the magnetometer
is considered additionally. As can be seen the MRs are in average 4.9% higher over all scenarios
and calculation variants than using all four orientations (compare Table 1). Thereby the smallest
improvements can be seen for the calculation variants where already high MRs were achieved
before. This means that only a few RSS vectors are not assigned correctly if an additional
consideration of the user’s heading is taken into account. In general, it can be said that the average
MRs of the different scenarios can be improved. A further advantage of consideration of the
heading is the reduction of the number of RSS scans to be tested in the positioning phase. This
number is reduced by a factor of 4. Moreover, RSS scans in the training phase must only be
measured in the possible movement orientations instead of in all four orientations. Thus, the
required data acquisition time in the training phase is further reduced.
4.3 Difference between MVF and Likelihood Algorithm
Tables 3 and 4 show the difference in the results when using either the MVF or likelihood
algorithm. If one compares Table 3 with Table 1 it can be seen that the best MRs differ at most by
around 1.1%. The method which uses all RSS scans in the vectors, besides, leads to slightly lower
MRs. Nevertheless, the MR for the combined DB falls short of only by 0.2%. When comparing the
MRs in the different Tables where the heading of the user is either not or is considered no
significant differences in the results can be seen. The reason for this is presumably due to the fact
that the orientation is considered in the algorithms indirectly already. Since by the sorting of the
RSS scan vectors after the Euclidean distance values, those RSS vectors with the same orientation
will result in a bit smaller values (compare Figure 2). Therefore the RSS vectors with the same
orientation are found rather in the beginning within the sorting vector. Even if these algorithms
cannot achieve higher MRs one main advantage is that the number of operations to be carried out
are reduced by around three quarter.
Wi-Fi Location Fingerprinting Using an Intelligent Checkpoint Sequence (7993)
Guenther Retscher and Hannes Hofer (Austria)
FIG Working Week 2016
Recovery from Disaster
Christchurch, New Zealand, May 2–6, 2016

Table 3: Comparison of MRs for MFV and likelihood algorithm
with consideration of all four orientations
scenarios
MFV algorithm Likelihood algorithm mean
MR DB1(-
101dBm) DB2(NaN)
DB1(-
101dBm) DB2(NaN)
SM1 DB 93,0% 91,3% 92,7% 93,0% 92,50%
SM2 SB 95,4% 95,4% 95,7% 95,4% 95,48%
joint DB 95,4% 92,6% 95,6% 93,1% 94,18%
mean MR 94,6% 93,1% 94,7% 93,8% 94,05%
Table 4: Comparison of MRs for MFV and likelihood algorithm
with consideration of the heading of the user
scenarios
MFV algorithm Likelihood algorithm mean
MR DB1(-
101dBm) DB2(NaN)
DB1(-
101dBm) DB2(NaN)
SM1 DB 91,6% 90,6% 92,0% 90,9% 91,3%
SM2 SB 96,5% 94,0% 96,5% 94,3% 95,3%
joint DB 94,7% 91,7% 94,7% 91,9% 93,3%
mean MR 94,3% 92,1% 94,4% 92,4% 93,3%
To summarize it can be said that with the examined MFV and likelihood algorithm usually no better
MRs can be achieved. The given MRs are achieved with an optimum value for k, however, k is not
known for real applications. From experimental testing it could be seen that 5 is a good value for k.
Besides the not better MRs, the required computation time speaks against the use of all RSS scan
vectors. For example, one must calculate around 920 times the Euclidean distance from the whole
DB values if one wants to search all scans on 23 iCPs in the selected area of interest. If one
calculates an average RSS vector for all 23 locations then only 23 calculations are necessary.
4.4 MR for Consecutive iCPs
Table 5 shows in detail the MRs of those tested iCPs which were not assigned correctly. It concerns
the calculation variant Test DB1 / mean DB (-101 dBm) for the combined DB of both smartphones.
The column mismatched IDs indicates how often a location ID was incorrectly assigned to another
location. From the detailed results it can be recognized that closely located iCPs around building
corners are correctly matched, i.e., iCP 3 and 5 or 9 and 10 (for their location see Figure 1). These
points are not included in the Table. Only the iCP 16 is mismatched twice as iCP 1. The reason for
this is that iCP 16 is located right at the edge of the building and therefore not so well
distinguishable than the points on either side of a corner. Mismatches can occur, however, for iCPs
which lie further apart. An example is iCP 12 which is twice incorrectly assigned with iCP 20 who
are lying approximately 30 m apart from each other and five times with point 13 which lies around
Wi-Fi Location Fingerprinting Using an Intelligent Checkpoint Sequence (7993)
Guenther Retscher and Hannes Hofer (Austria)
FIG Working Week 2016
Recovery from Disaster
Christchurch, New Zealand, May 2–6, 2016

39 m away. The RSS measurements on this iCP can be clearly identified as outliers. Nevertheless,
iCP 3 and 5 or 9 and 10, for instance, are correctly assigned although the lie approximately 10 m or
14 m apart from each other. These results confirm that better MRs can be achieved if iCPs are
selected at certain meaningful locations in the surrounding buildings of a residential block. Then the
RSS scans to the visible APs in the surrounding environment can be distinguished well.
Table 5: MRs for combined DB showing the frequency of incorrect assigned iCPs
iCP with MR <100% for joint DB
iCP ID MR
correct /
total
mismatched
IDs
12 94.4% 34 / 36 2 x 20
13 79.2% 19 / 24 5 x 12
16 91.7% 11 / 12 1 x 2
17 91.7% 22 / 24 1 x 16; 1 x 3
21 95.8% 23 / 24 1 x 11
22 95.8% 23 / 24 1 x 21
24 91.7% 22 / 24 2 x 1
4.5 MR for Different DBs
Figure 3 shows the averaged MRs for two different DBs in all four measured orientations for the
joint DB for both smartphones as a bar graph. The behaviour of the MRs is compared for Test DB1
and DB2. Furthermore, the resulting MRs for the arithmetic mean or median are graphically
represented. As can be seen from the graph the highest MRs are achieved if Test DB1 is combined
with the mean DB (-101 dBm). This is the calculation variant where the minimum values for the
fingerprinting DB and the test DB are used. Then the RSS values of the visible APs which cannot
be measured in most scans approach the minimum value. The use of the minimum value in Test
DB2 means that RSS values cannot be measured in the positioning but in the training phase. They
influence the calculation of the Euclidean distances. The Figure also shows that the combination
with Test DB1 containing the minimum values with the fingerprinting DB leads to good results.
Nevertheless, the Test DB2 can be combined with the fingerprinting DB without that the MRs get
substantially worse. Hence, this calculation variant has in average the best MRs since the average
MRs became 89.7% with Test DB2 and 76.4% with Test DB1.
Wi-Fi Location Fingerprinting Using an Intelligent Checkpoint Sequence (7993)
Guenther Retscher and Hannes Hofer (Austria)
FIG Working Week 2016
Recovery from Disaster
Christchurch, New Zealand, May 2–6, 2016
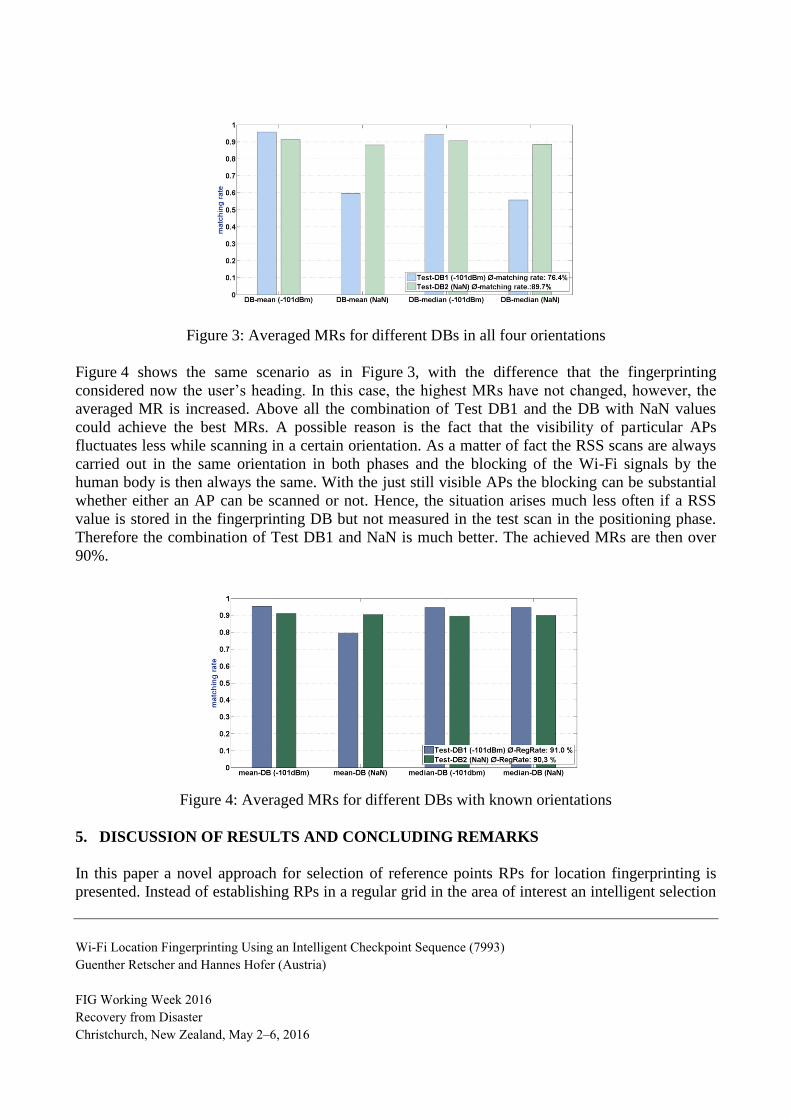
Figure 3: Averaged MRs for different DBs in all four orientations
Figure 4 shows the same scenario as in Figure 3, with the difference that the fingerprinting
considered now the user’s heading. In this case, the highest MRs have not changed, however, the
averaged MR is increased. Above all the combination of Test DB1 and the DB with NaN values
could achieve the best MRs. A possible reason is the fact that the visibility of particular APs
fluctuates less while scanning in a certain orientation. As a matter of fact the RSS scans are always
carried out in the same orientation in both phases and the blocking of the Wi-Fi signals by the
human body is then always the same. With the just still visible APs the blocking can be substantial
whether either an AP can be scanned or not. Hence, the situation arises much less often if a RSS
value is stored in the fingerprinting DB but not measured in the test scan in the positioning phase.
Therefore the combination of Test DB1 and NaN is much better. The achieved MRs are then over
90%.
Figure 4: Averaged MRs for different DBs with known orientations
5. DISCUSSION OF RESULTS AND CONCLUDING REMARKS
In this paper a novel approach for selection of reference points RPs for location fingerprinting is
presented. Instead of establishing RPs in a regular grid in the area of interest an intelligent selection
Wi-Fi Location Fingerprinting Using an Intelligent Checkpoint Sequence (7993)
Guenther Retscher and Hannes Hofer (Austria)
FIG Working Week 2016
Recovery from Disaster
Christchurch, New Zealand, May 2–6, 2016

following a logical sequence is performed. These meaningfully selected RPs are called intelligent
checkpoints iCPs. To prove the concept field experiments have been carried out in out- as well as
indoor environments and different calculation variants are analyzed. An App for data acquisition
and an extensive MATLAB tool for elevation of the experiments is developed. In this contribution
only results of the outdoor tests are presented. For a report of the results of the indoor tests the
interested reader is referred to the paper of Retscher and Hofer (2015).
To match the RSS scans to its location the matching algorithm based on the NN approach is utilized
where the minimum Euclidean distance is calculated for the assignment of the positions. It was
analyzed with which MRs selected iCPs are recognized. Different DBs have been created from the
RSS scans in the training phase. For several test cases either the arithmetic mean or the median is
calculated. Between these two calculation variants no large differences can be seen. Nevertheless,
the arithmetic mean led in all tests to slightly better MRs and it can therefore be recommended for
the further analysis. The use of a minimum RSS value leads in the outdoor experiments to better
results. In general, better results are obtained if all measured RSS scans are used for fingerprinting.
The drawback, however, is that a higher computational load is required than for the case where only
one RSS vector for each location is considered. Furthermore, the results are better if a single DB for
a certain mobile device (smartphone or tablet) is employed than a joint DB of all devices. It could
also be shown that for the individual terms of the sum of the RSS values the MR of the Euclidean
distances can be improved if a weighting vector is applied. High MRs could be achieved if the
locations of the iCPs are selected in an intelligent manner, e.g. in the outdoor environment not to
close to each other around building corners. If the magnetometer of the smartphone is used
additionally to determine the correct heading of the user similar results can be achieved. The main
advantage is the reduction of the required number and duration of the calculations if the user’s
heading is considered. The number of calculations is then reduced by three quarter without
deterioration of the achieved MR. Furthermore, it was investigated whether the MR can be
improved if the logical sequence between the iCPs is followed. The trajectory can be divided into
sections which describe decision points along the way. So far only for the indoor tests the division
in section has been analyzed. It could be seen that the applied logical sequence of sections is a
simple attempt to reduce the number of possible user locations which have to be tested in the
matching algorithm. Then the average MRs in each building section resulted to 90.4%. This value
could be further improved to 92.9% if a site specific weighting vector for each section is applied
(Retscher and Hofer, 2015). For more complex environments an advanced vector graph allocation
can be applied and implemented. Further investigation and developments regarding such an
approach are on the way.
From the extensive analysis it can be seen that MRs over 90% can be achieved. The next challenge
is to recognize iCPs while the user is moving. For that purpose an integration of the observations of
the motion sensors in the mobile device is required. In the test runs it could be seen that it is then
even easier to recognize the correct iCP along the way to the destination due to a continuous
determination of the user’s trajectory. Hence, only a certain number of iCPs come into
consideration following their logical sequence along the way to the destination. Then only
representative RSS scans along the way are needed from the continuous scans. The representative
Wi-Fi Location Fingerprinting Using an Intelligent Checkpoint Sequence (7993)
Guenther Retscher and Hannes Hofer (Austria)
FIG Working Week 2016
Recovery from Disaster
Christchurch, New Zealand, May 2–6, 2016

RSS scans of the possible iCPs have to be compared with the current scans to find the moment in
time where the Eucledian distance shows a minimum. Exemplarily, the absolute differences of the
RSSI vector in dependence of the time along a walked trajectory for a certain iCP are shown in
Figure 5. The minimum value of the difference in the curves corresponds to the reference time
obtained from manual recording when the iCP is passed along the way. In the experiments it could
be seen that it is possible to find the iCPs with a divergence of less than three steps compared to the
calculated steps using the accelerometer. Thus the iCP detection can be employed for absolute
positioning to update the inertial navigation system, i.e., the motion sensors in the smartphone, and
to reduce its drift rates. Further data acquisition and their analyses concerning the integration of the
motion sensors with the iCP approach are currently on the way. In addition, indoor tests in a multi-
storey building were conducted in this study. They show similar results. These test results were
presented in Hofer (2015) and Retscher and Hofer (2015).
Figure 5: Euclidean distances of a certain iCP calculated from continuous RSS scans
while walking along a trajectory
REFERENCES
Bahl P, Padmanabhan V N (2000) RADAR: An In-building RF-based User Location and Tracking
System. In Proceedings of the 19th Annual Joint Conference of the IEEE Computer and
Communications Societies. Tel-Aviv, Israel, Mar 26-30, Vol. 2, 775-784
Chang N, Rashidzadeh R, Ahmadi M (2010) Robust Indoor Positioning Using Differential Wi-Fi
Access Points. IEEE Transactions on Consumer Electronics. 56:3, 1860-1867
Chen R, Pei L, Liu J, Leppäkoski H (2012) WLAN and Bluetooth Positioning in Smart Phones. In
Chen R. (ed.): Ubiquitous Positioning and Mobile Location-Based Services in Smart Phones.
IGI Global, Hershey PA, USA, 44-68
Wi-Fi Location Fingerprinting Using an Intelligent Checkpoint Sequence (7993)
Guenther Retscher and Hannes Hofer (Austria)
FIG Working Week 2016
Recovery from Disaster
Christchurch, New Zealand, May 2–6, 2016

Chen L, Li B, Zhao K, Rizos C, Zheng Z (2013) An Improved Algorithm to Generate a Wi-Fi
Fingerprint Database for Indoor Positioning. Sensors 13:8, 11085–11096
Hofer H (2015) Kombinierte Indoor/Outdoor Positionierung mit Smartphones. Master thesis,
Faculty of Informatics, TU Wien, Austria (German)
Li B, Kam J, Lui J, Dempster AG (2007) Use of Directional Information in Wireless LAN Based
Indoor Positioning. In Proceedings of the International Global Navigation Satellite Systems
Society IGNSS Symposium, Sydney, Australia, December 4-6, 11 pgs
Moghtadaiee V, Dempster AG (2015) Vector Distance Measure Comparison in Indoor Location
Fingerprinting. In Proceedings of the IGNSS 2015 Conference, Surfers Paradise, Gold Coast,
Australia, July 14-16, 16 pgs
Retscher G, Hofer H (2015) A Novel Approach for Wi-Fi Fingerprinting Using Logical Sequences
of Intelligent Checkpoints. In Proceedings of the IGNSS 2015 Conference, Surfers Paradise,
Gold Coast, Australia, July 14-16, 15 pgs
BIOGRAPHICAL NOTES
Guenther Retscher is Associate Professor at the Department of Geodesy and Geoinformation of the
TU Vienna, Austria. He received his Venia Docendi in the field of Applied Geodesy from the same
university in 2009 and his Ph.D. in 1995. His main research and teaching interests are in the fields
of engineering geodesy, satellite positioning and navigation, indoor and pedestrian positioning as
well as application of multi-sensor systems in geodesy and navigation.
Hannes Hofer is a master student at the TU Vienna, Austria. In his study of Informatics his main
research interests are in the fields of heuristic optimization of NP-hard problems. Furthermore, he
has specialised in App software development and programming as well as indoor and pedestrian
navigation.
CONTACTS
Dr. Guenther Retscher
Department of Geodesy and Geoinformation
TU Wien - Vienna University of Technology
Gusshausstrasse 27-29 E120/5
1040 Vienna, AUSTRIA
Tel. +43 1 58801 12847
Fax +43 1 58801 12894
Email: [email protected]
Web site: http://info.tuwien.ac.at/ingeo/
Wi-Fi Location Fingerprinting Using an Intelligent Checkpoint Sequence (7993)
Guenther Retscher and Hannes Hofer (Austria)
FIG Working Week 2016
Recovery from Disaster
Christchurch, New Zealand, May 2–6, 2016