
Why Understand Economics? Big Three U.S. Automakers, and the Strong Dollar of 1986 1986: $1 ===> 240...
48
Why Understand Economics? Big Three U.S. Automakers, and the Strong Dollar of 1986 1986: $1 ===> 240 yen 1988: $1 ===> 120 yen 1994: $1 ===> 113.58 yen 1995: $1 ===> 104.08 yen 1996: $1 ===> 108.83 yen 1997: $1 ===> 121.05 yen
-
Upload
arnold-lawrence -
Category
Documents
-
view
218 -
download
0
Transcript of Why Understand Economics? Big Three U.S. Automakers, and the Strong Dollar of 1986 1986: $1 ===> 240...
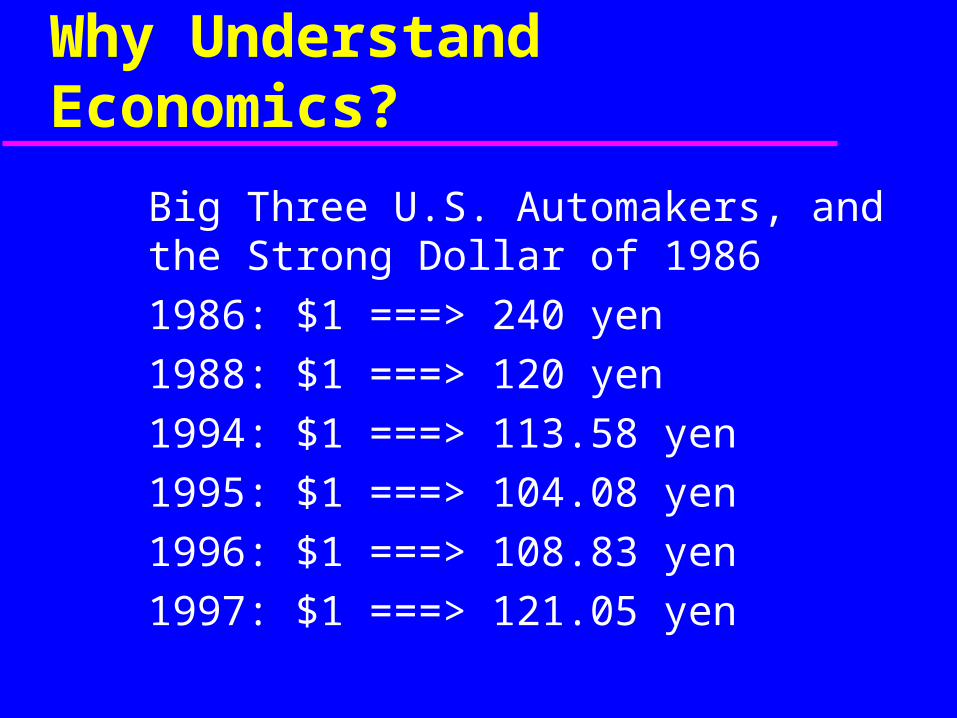
Why Understand Economics?
Big Three U.S. Automakers, and the Strong Dollar of 1986
1986: $1 ===> 240 yen
1988: $1 ===> 120 yen
1994: $1 ===> 113.58 yen
1995: $1 ===> 104.08 yen
1996: $1 ===> 108.83 yen
1997: $1 ===> 121.05 yen
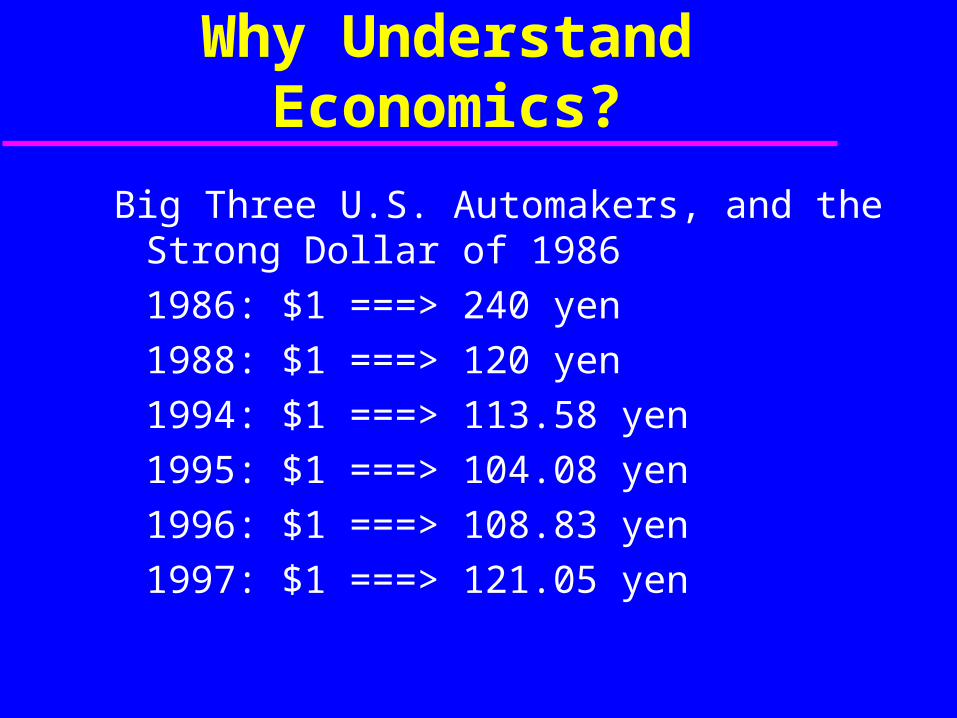
Why Understand Economics?
Big Three U.S. Automakers, and the Strong Dollar of 1986
1986: $1 ===> 240 yen
1988: $1 ===> 120 yen
1994: $1 ===> 113.58 yen
1995: $1 ===> 104.08 yen
1996: $1 ===> 108.83 yen
1997: $1 ===> 121.05 yen

More Recent Currency Exchange Rates
http://www.cals.ncsu.edu/course/are012/currency.pdf
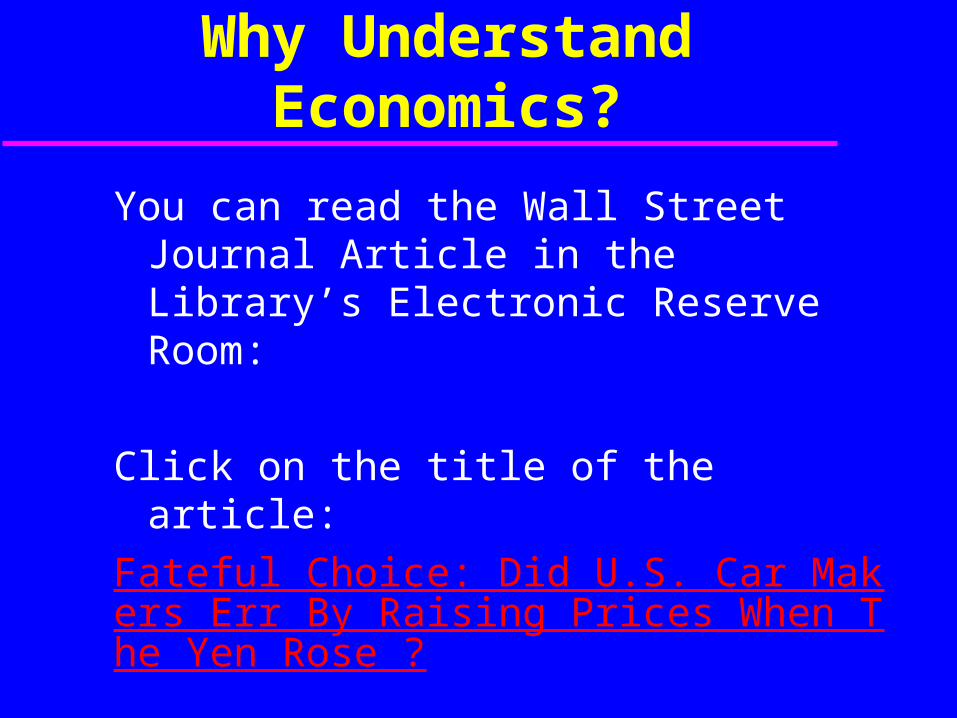
Why Understand Economics?
You can read the Wall Street Journal Article in the Library’s Electronic Reserve Room:
Click on the title of the article:
Fateful Choice: Did U.S. Car Makers Err By Raising Prices When The Yen Rose ?

Why Understand Economics?
~26.5% of the U.S. Population was Born Between 1946 to 1964
“Baby Boomers”
2008: 44 to 62 years old
How will this aging of our population affect our economy in the future?

A 1993 Study by Prof. Ayers of Northwestern University
165 Automobile Dealers in Chicago Area
Average Vehicle Profit
White Men $362
African-American Men $504
White Women $783
African-American Women $1237
Does this represent racial and sexual discrimination, or ?

A 1993 Study by Prof. Ayers of Northwestern University
165 Automobile Dealers in Chicago Area
Average Vehicle Profit
White Men $362
African-American Men $504
White Women $783
African-American Women $1237
Does this represent racial and sexual discrimination, or ?

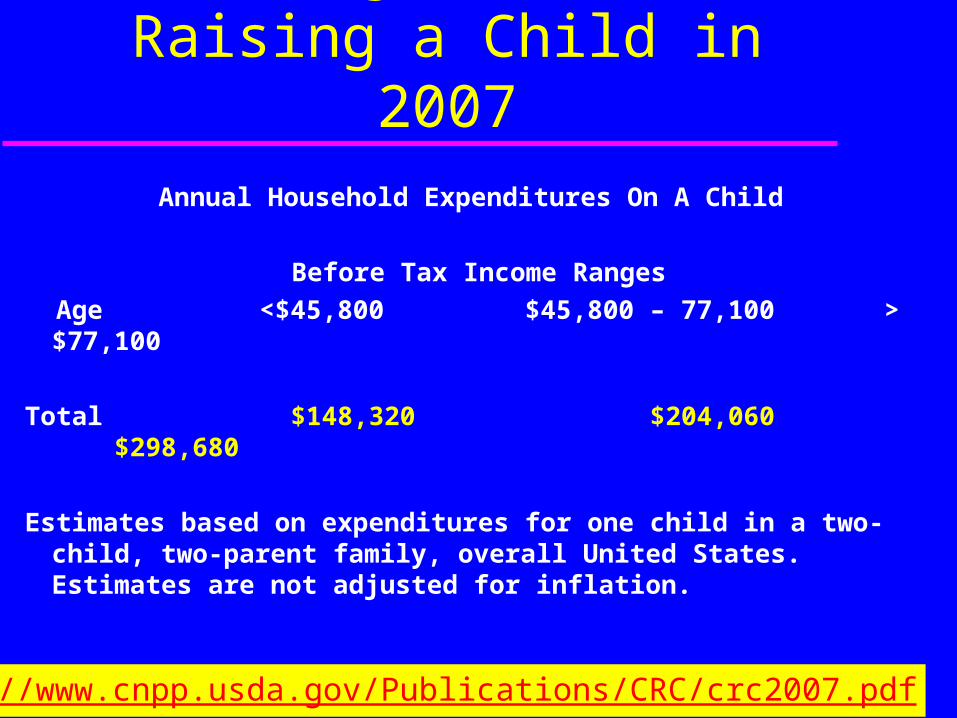
Average Cost of Raising a Child in 2007
Annual Household Expenditures On A Child
Before Tax Income Ranges
Age <$45,800 $45,800 – 77,100 > $77,100
0-2 $7,830 $10,960 $16,290
3-5 8,020 11,280 16,670
6-8 8,000 11,130 16,310
9-11 7,950 10,930 15,980
12-14 8,830 11,690 16,810
15-17 8,810 12,030 17,500
http://www.cnpp.usda.gov/Publications/CRC/crc2007.pdf
Average Cost of Raising a Child in 2007
Annual Household Expenditures On A Child
Before Tax Income Ranges
Age <$45,800 $45,800 – 77,100 > $77,100
Total $148,320 $204,060 $298,680
Estimates based on expenditures for one child in a two-child, two-parent family, overall United States. Estimates are not adjusted for inflation.
http://www.cnpp.usda.gov/Publications/CRC/crc2007.pdf
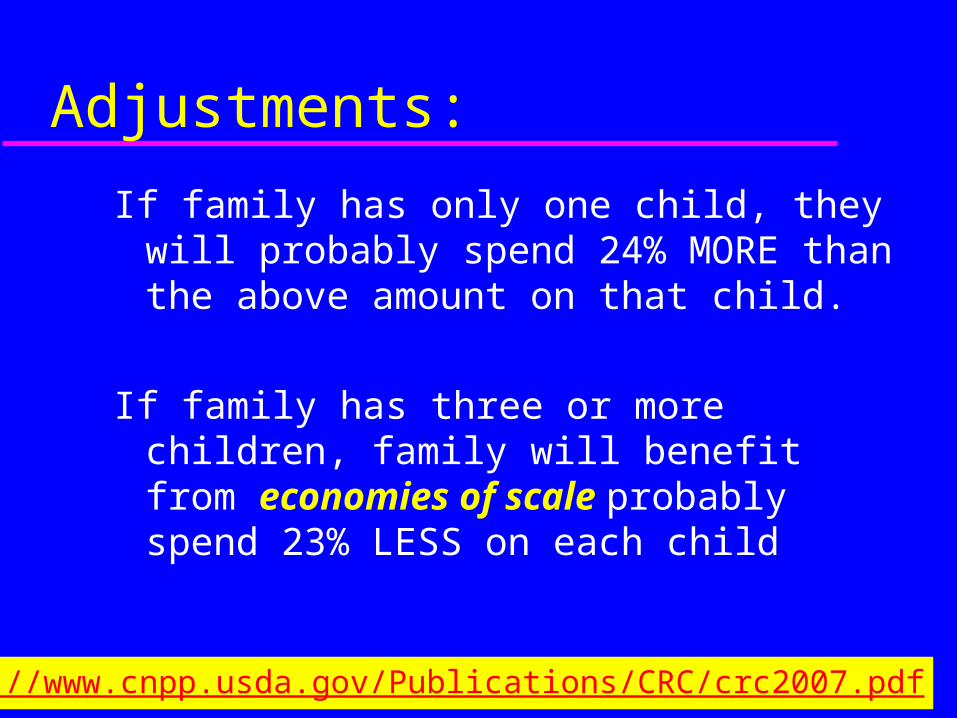
Adjustments:
If family has only one child, they will probably spend 24% MORE than the above amount on that child.
If family has three or more children, family will benefit from economies of scale probably spend 23% LESS on each child
http://www.cnpp.usda.gov/Publications/CRC/crc2007.pdf
Adjustments:
If you are a single parent, your monetary costs will be pretty close to those of two-parent families.
http://www.cnpp.usda.gov/Publications/CRC/crc2007.pdf

Percentage of Your Income
High Income families usually spend more on a child,
BUT if you’re in a low income group, you probably spend a much higher percentage of your income on a child than wealthier families
http://www.cnpp.usda.gov/Publications/CRC/crc2007.pdf
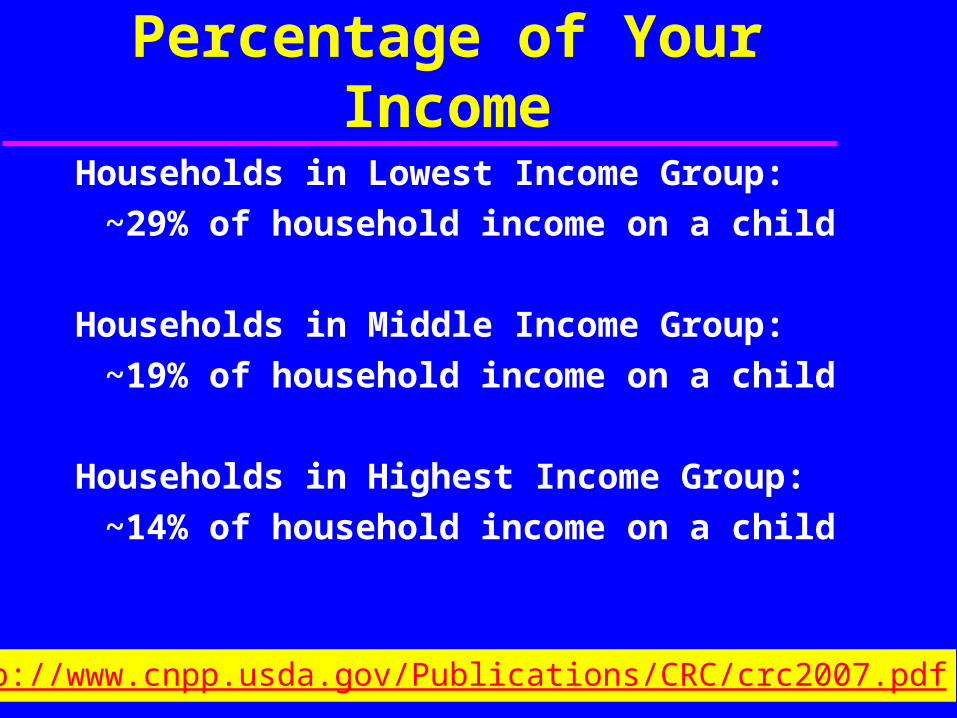
Percentage of Your IncomeHouseholds in Lowest Income Group:
~29% of household income on a child
Households in Middle Income Group:
~19% of household income on a child
Households in Highest Income Group:
~14% of household income on a child
http://www.cnpp.usda.gov/Publications/CRC/crc2007.pdf

What About INFLATION?
Based on an annual inflation rate of 3.1%, – Average from 1987 to 2006
Lower Income Parents will pay $196,010
Middle Income Parents will pay $269,040
Higher Income Parents will pay $393,230
by the time the child reaches 18 years old.
http://www.cnpp.usda.gov/Publications/CRC/crc2007.pdf

N.C. Child Support Formula Example for 2007:
If have two children and earn $40,200/year gross income
~ $790/month in child support
~ $4,740 per child per year
~ $85,320 per child over 18 years

N.C. Court System
assumes your support to be 50% of the total support,
Therefore, the state of N.C. estimates that the total cost of raising a child from 0 to 18 years in 2007 to be about:
$85,320 / .5 = $170,640
Moral of this Story
How expensive can an irresponsible sexual interlude be ?
If you play, eventually you have to pay!
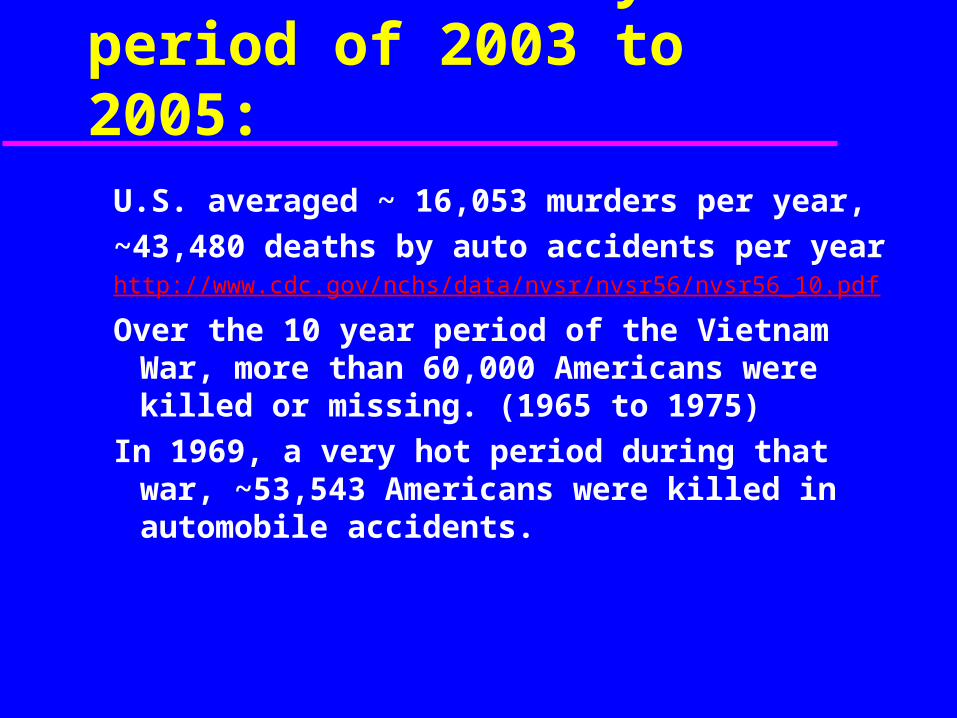
Over the three year period of 2003 to 2005:
U.S. averaged ~ 16,053 murders per year,
~43,480 deaths by auto accidents per yearhttp://www.cdc.gov/nchs/data/nvsr/nvsr56/nvsr56_10.pdf
Over the 10 year period of the Vietnam War, more than 60,000 Americans were killed or missing. (1965 to 1975)
In 1969, a very hot period during that war, ~53,543 Americans were killed in automobile accidents.
Over the three year period of 2003 to 2005:
Of those Americans involved in automobile accidents that are not killed, how many are left disabled?

In the First Persian Gulf War:
35 deaths from “friendly fire”
(24% of all battle casualties)
148 battle deaths
145 “other” deaths
How long did the Gulf War last?

In the First Persian Gulf War:
Bombing began 3:00 A.M., January 16, 1991 Iraqi time.
Operation Desert Storm began February 24, 1991 and ended 100 hours later
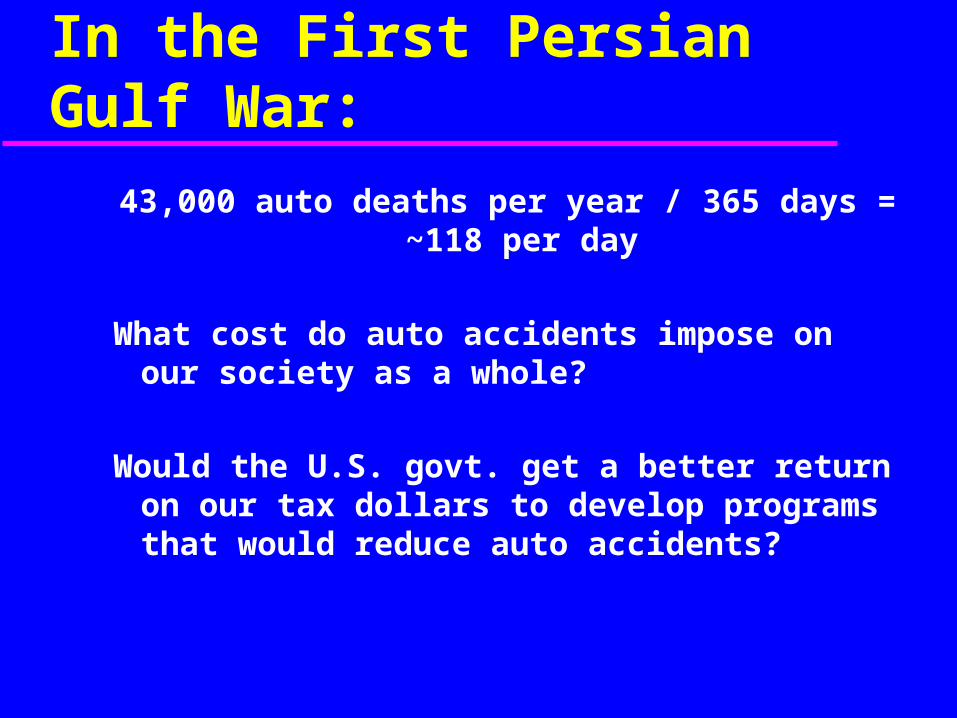
In the First Persian Gulf War:
43,000 auto deaths per year / 365 days = ~118 per day
What cost do auto accidents impose on our society as a whole?
Would the U.S. govt. get a better return on our tax dollars to develop programs that would reduce auto accidents?
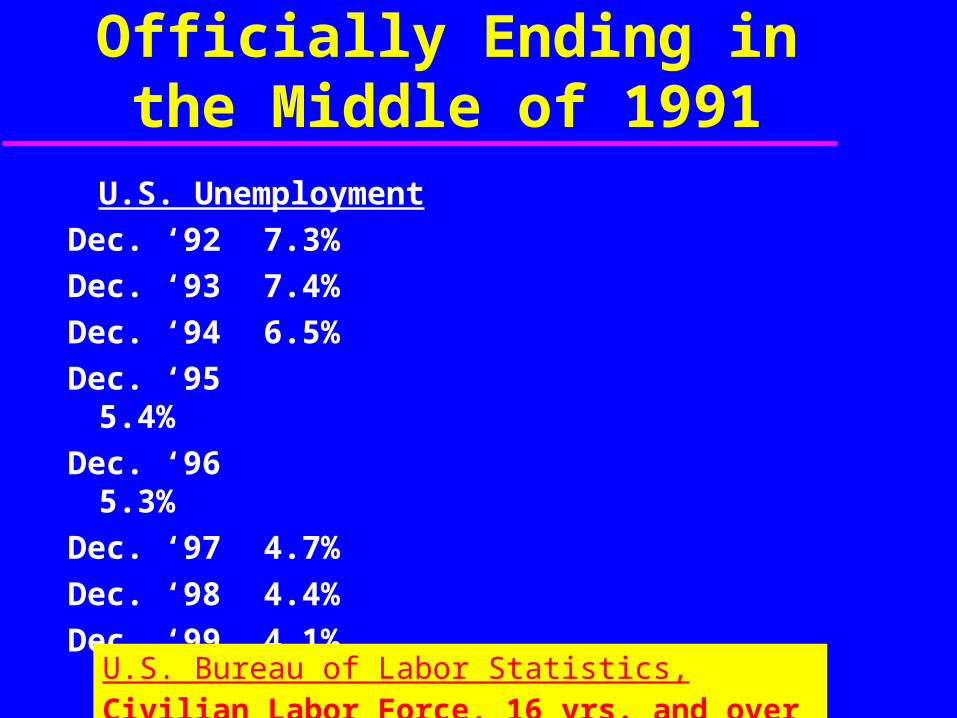
The Recession Officially Ending in the Middle of 1991
U.S. Unemployment
Dec. ‘92 7.3%
Dec. ‘93 7.4%
Dec. ‘94 6.5%
Dec. ‘95 5.4%
Dec. ‘96 5.3%
Dec. ‘97 4.7%
Dec. ‘98 4.4%
Dec. ‘99 4.1%U.S. Bureau of Labor Statistics,Civilian Labor Force, 16 yrs. and over
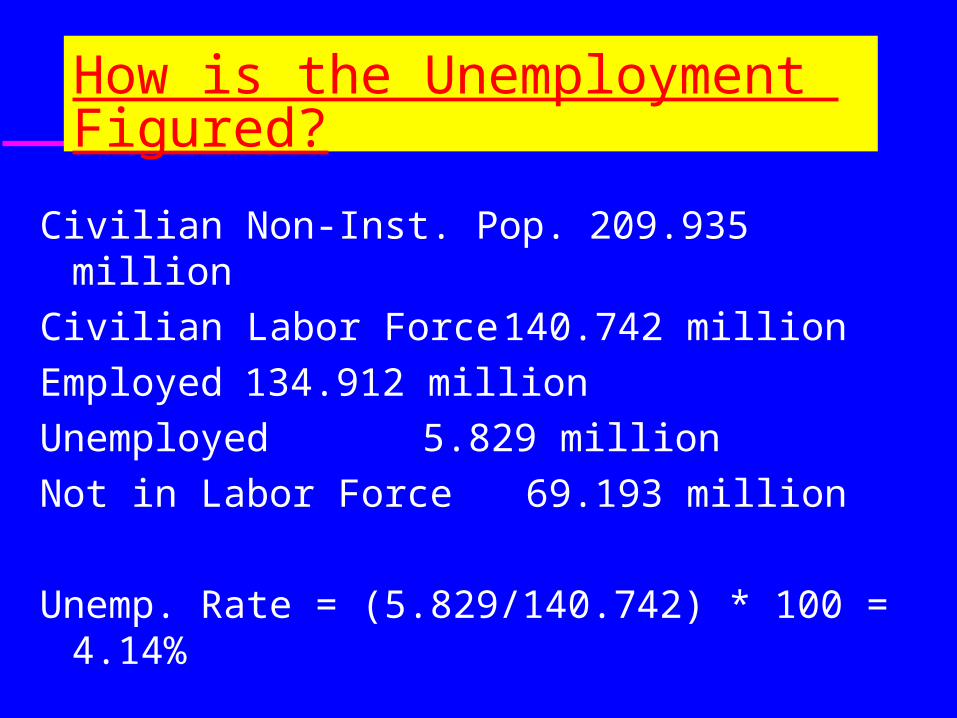
How is the Unemployment Figured?
Civilian Non-Inst. Pop. 209.935 million
Civilian Labor Force 140.742 million
Employed 134.912 million
Unemployed 5.829 million
Not in Labor Force 69.193 million
Unemp. Rate = (5.829/140.742) * 100 = 4.14%
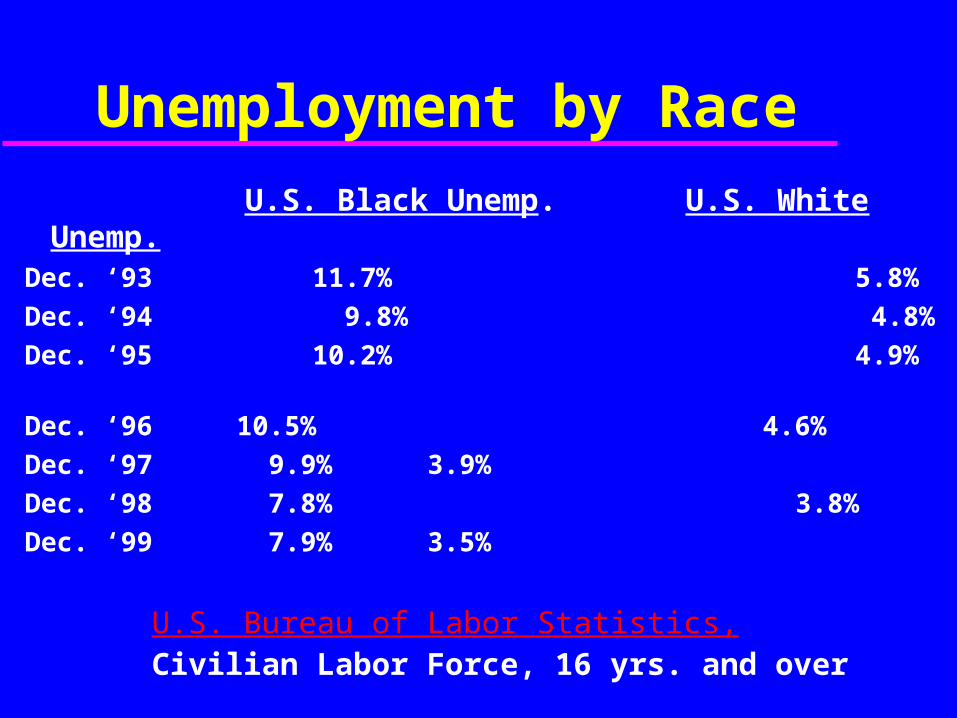
Unemployment by Race
U.S. Black Unemp. U.S. White Unemp.Dec. ‘93 11.7% 5.8%
Dec. ‘94 9.8% 4.8%
Dec. ‘95 10.2% 4.9%
Dec. ‘96 10.5% 4.6%
Dec. ‘97 9.9% 3.9%
Dec. ‘98 7.8% 3.8%
Dec. ‘99 7.9% 3.5%U.S. Bureau of Labor Statistics,Civilian Labor Force, 16 yrs. and over
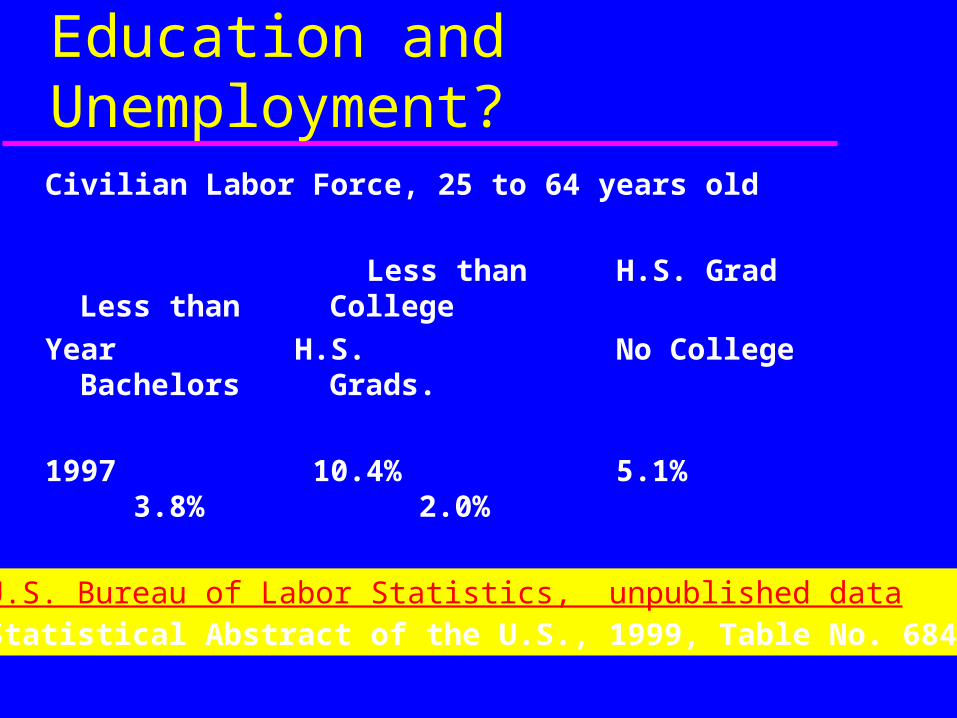
Education and Unemployment?Civilian Labor Force, 25 to 64 years old
Less than H.S. Grad Less than College
Year H.S. No College Bachelors Grads.
1997 10.4% 5.1% 3.8% 2.0%
1998 8.5% 4.8% 3.6% 1.8%
U.S. Bureau of Labor Statistics, unpublished dataStatistical Abstract of the U.S., 1999, Table No. 684
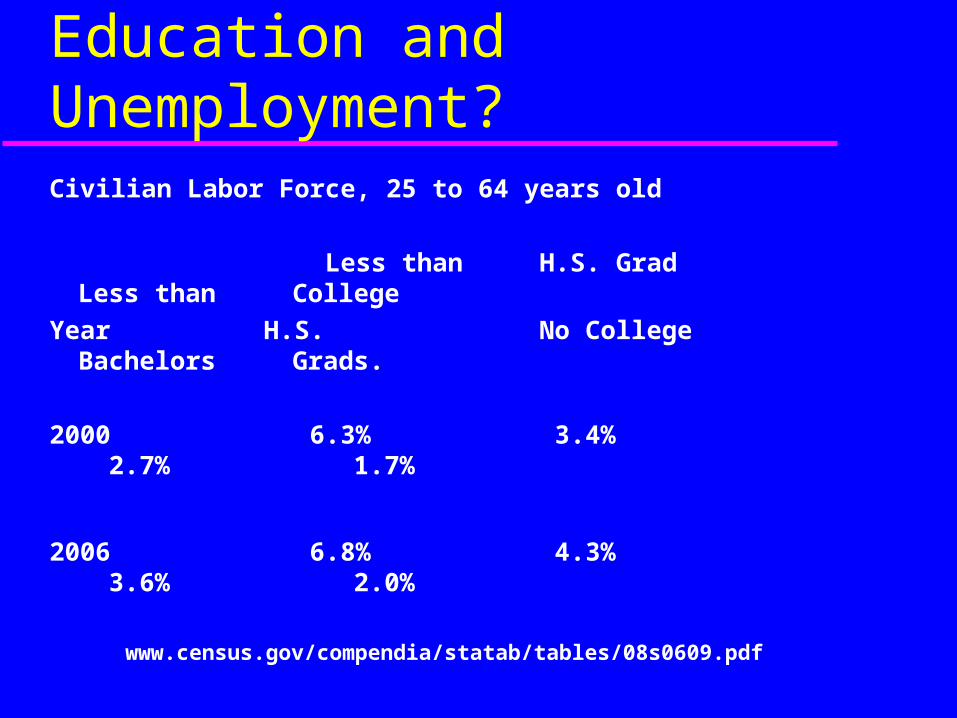
Education and Unemployment?Civilian Labor Force, 25 to 64 years old
Less than H.S. Grad Less than College
Year H.S. No College Bachelors Grads.
2000 6.3% 3.4% 2.7% 1.7%
2006 6.8% 4.3% 3.6% 2.0%
www.census.gov/compendia/statab/tables/08s0609.pdf

Education and Unemployment?
White Civilian Labor Force, 25 to 64 years old
Less than H.S. Grad Less than College
Year H.S. No College Bachelors Grads.
1997 9.4% 4.6% 3.4% 1.8%
1998 7.5% 4.2% 3.2% 1.7%
U.S. Bureau of Labor Statistics, unpublished dataStatistical Abstract of the U.S., 1999, Table No. 684

Education and Unemployment?
White Civilian Labor Force, 25 to 64 years old
Less than H.S. Grad Less than College
Year H.S. No College Bachelors Grads.
2000 5.6% 2.9% 2.4% 1.6%
2006 5.9% 3.7% 3.2% 2.0%
www.census.gov/compendia/statab/tables/08s0609.pdf

Education and Unemployment?
Black Civilian Labor Force, 25 to 64 years old
Less than H.S. Grad Less than College
Year H.S. No College Bachelors Grads.
1997 16.6% 8.2% 6.1% 4.4%
1998 13.4% 8.4% 6.4% 2.1%
U.S. Bureau of Labor Statistics, unpublished dataStatistical Abstract of the U.S., 1999, Table No. 684
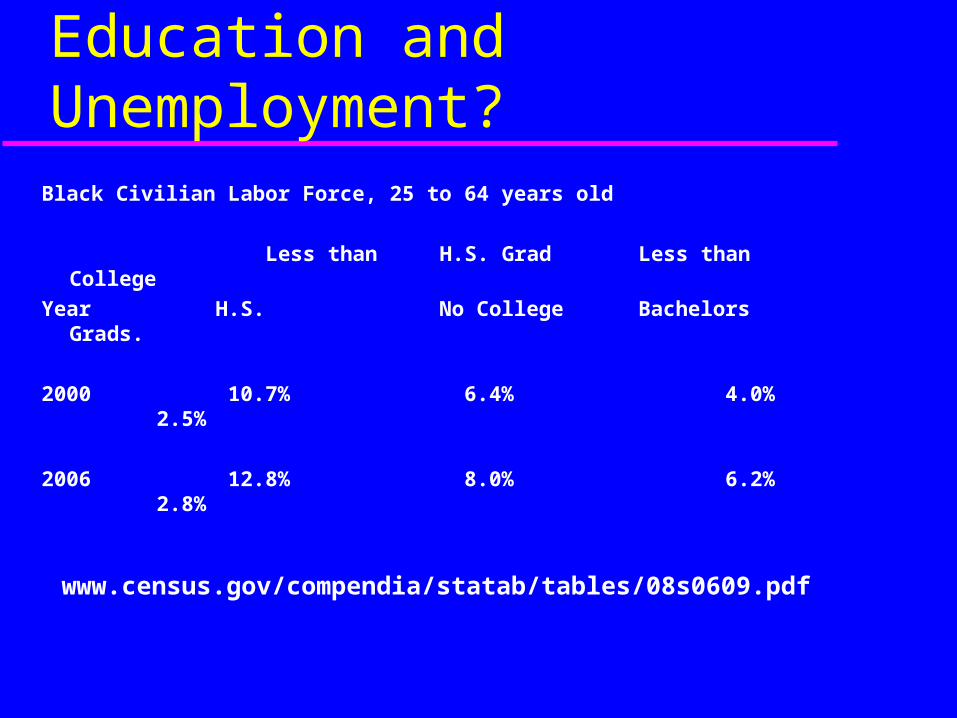
Education and Unemployment?Black Civilian Labor Force, 25 to 64 years old
Less than H.S. Grad Less than College
Year H.S. No College Bachelors Grads.
2000 10.7% 6.4% 4.0% 2.5%
2006 12.8% 8.0% 6.2% 2.8%
www.census.gov/compendia/statab/tables/08s0609.pdf

Theory and Models
Economics is a social science that makes use of similar methodology used by the “hard” sciences (biology, physics, etc.)
The “hard” sciences refer to this method as the “scientific method”, in economics we will refer to this method as the “economic method”
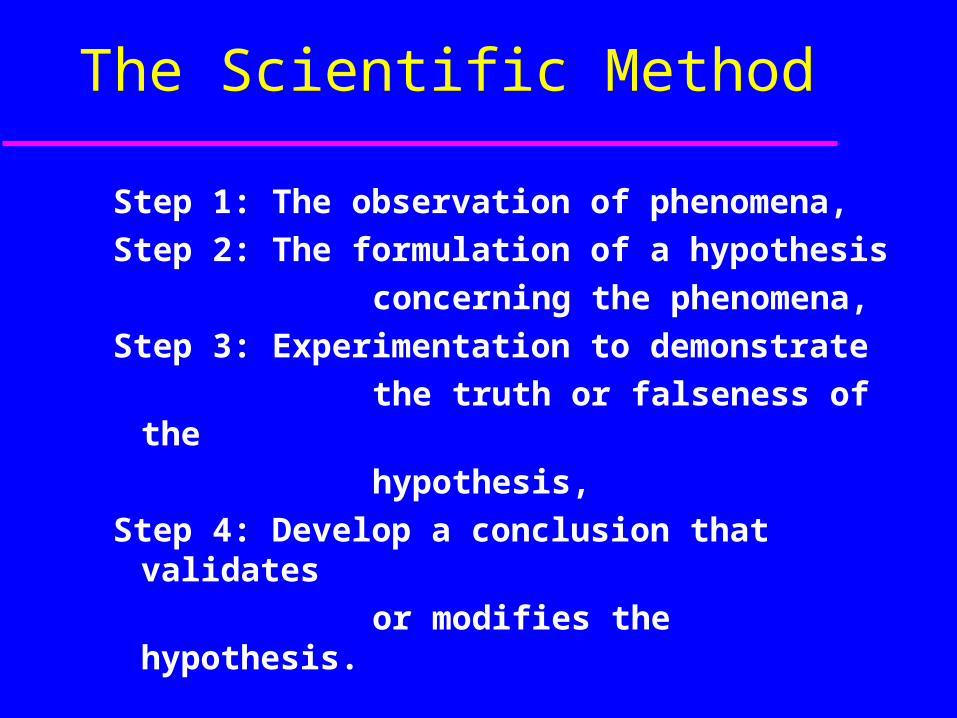
The Scientific Method
Step 1: The observation of phenomena,
Step 2: The formulation of a hypothesis
concerning the phenomena,
Step 3: Experimentation to demonstrate
the truth or falseness of the
hypothesis,
Step 4: Develop a conclusion that validates
or modifies the hypothesis.

The Economic Method1
Step 1: Identify and state the problem
Step 2: Apply the relevant economic model
Step 3: Identify the solutions
Step 4: Evaluate the solutions
Step 5: Select and implement a solution
1Adaped from Mabry and Ulbrich, “Introduction to EconomicPrinciples, 1989.

Theory and Models
Models:
Simplified representations of the “real world” that we use to help us understand, explain, and predict economic events in the real world.
Theory and Models
No model captures every little detail and inter-relationship that exists
Models are abstractions from reality

Theory and Models
A Good Model should capture only the essential relationships that are sufficient to analyze a particular problem, or answer a particular question.
A Model is the guideline we follow to analyze economic problems and predict outcomes.

Theory and Models
Questions:
How do consumers respond when the price of a commodity changes?
What choices do they have?
What choices do they make?
Theory and Models
Dove season opens soon, and we want some shotgun shells.
How we will respond to a price of $10.00 per box of 25 shells?
There are probably thousands of determinants affecting how each consumer will respond to this high price.

Theory and Models
Many of these determinants were left out of the model we used to answer the questions above.
Our class model probably included: The price of the specific commodity The income of the consumer The price of substitutes for the
commodity

Theory and Models
These 3 determinants do a good job of explaining the behavior of consumers with respect to a price change. Later we will learn that there are in excess of 10 determinants that affect consumer demand.
Theory and Models
An economic model is nothing more than a set of definitions, assumptions, and hypotheses that are put together in a manner that expresses the relationships of certain observed events in a meaningful way.
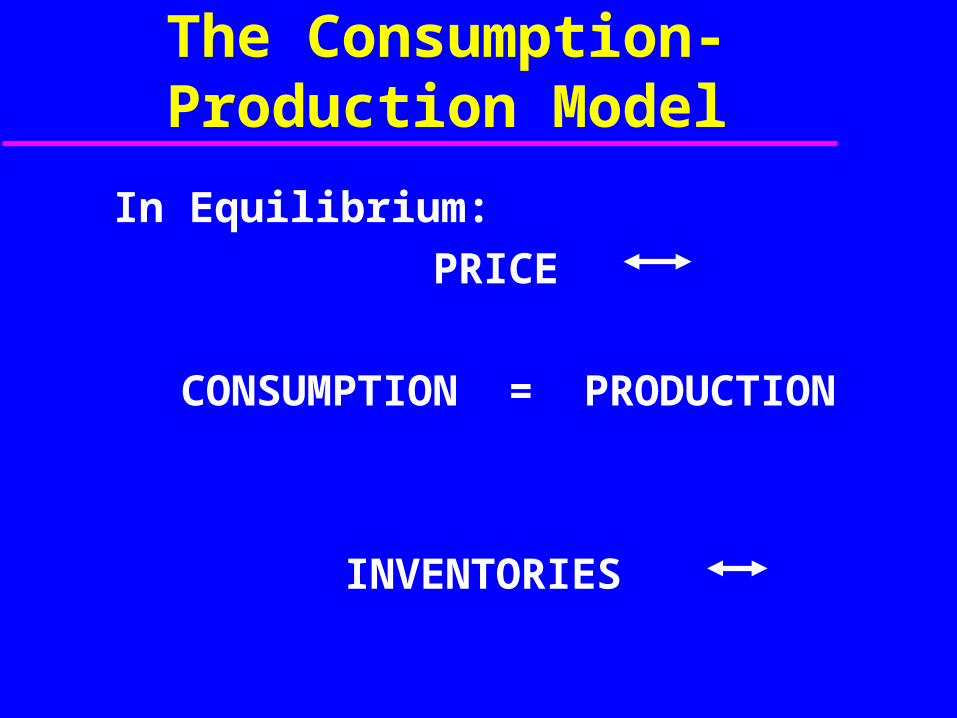
The Consumption-Production Model
In Equilibrium:
PRICE
CONSUMPTION = PRODUCTION
INVENTORIES
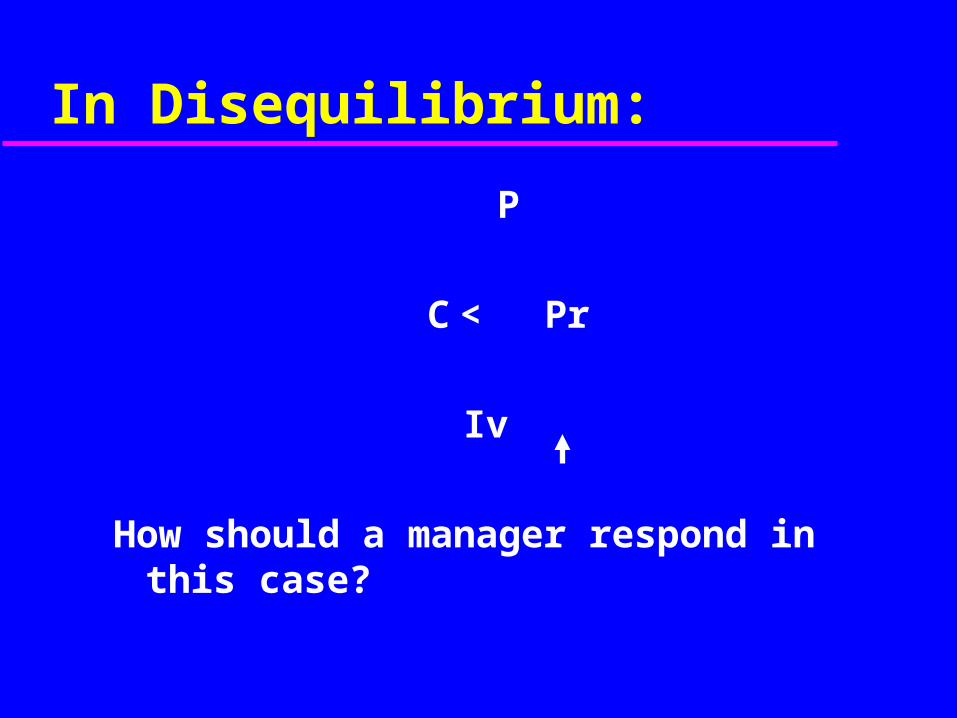
In Disequilibrium:
P
C < Pr
Iv
How should a manager respond in this case?
In Disequilibrium:
What if production process is at full capacity?
What if production process is at less than full capacity?
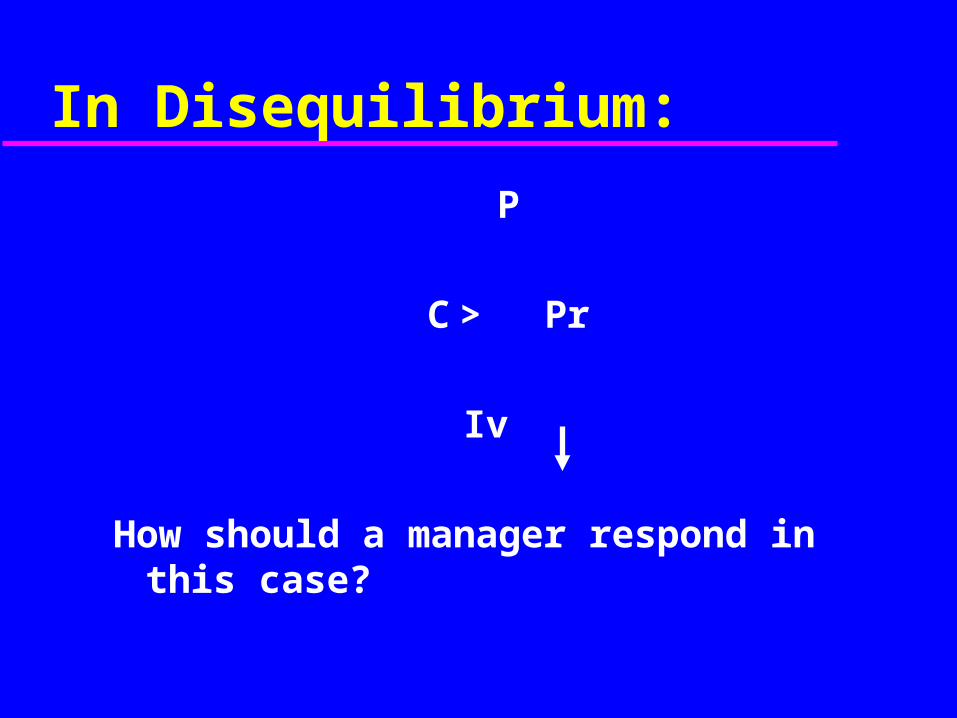
In Disequilibrium:
P
C > Pr
Iv
How should a manager respond in this case?
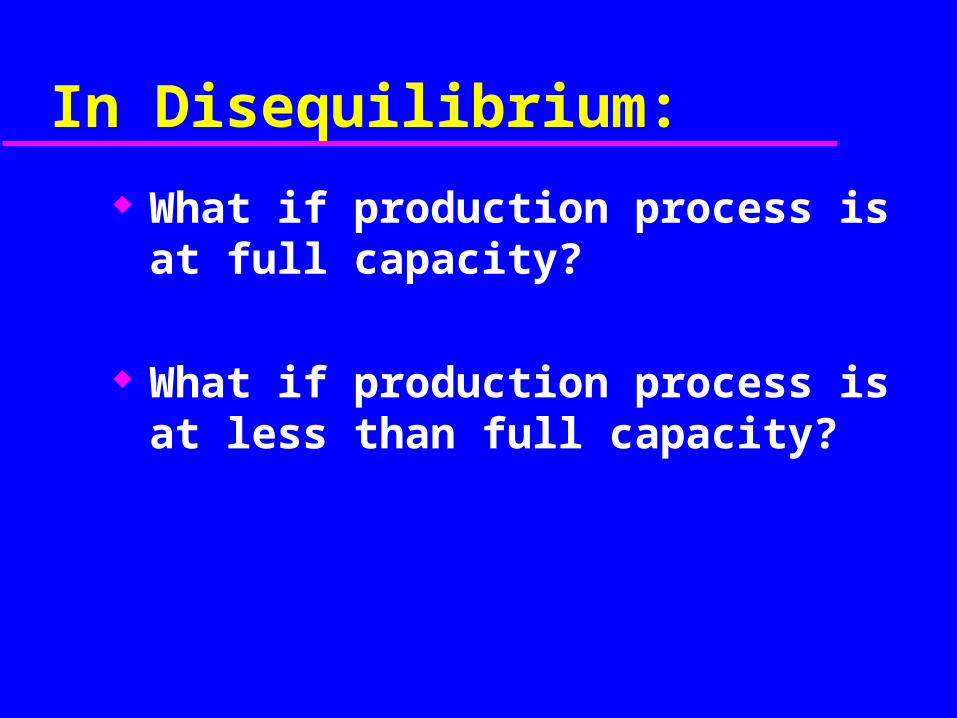
In Disequilibrium:
What if production process is at full capacity?
What if production process is at less than full capacity?
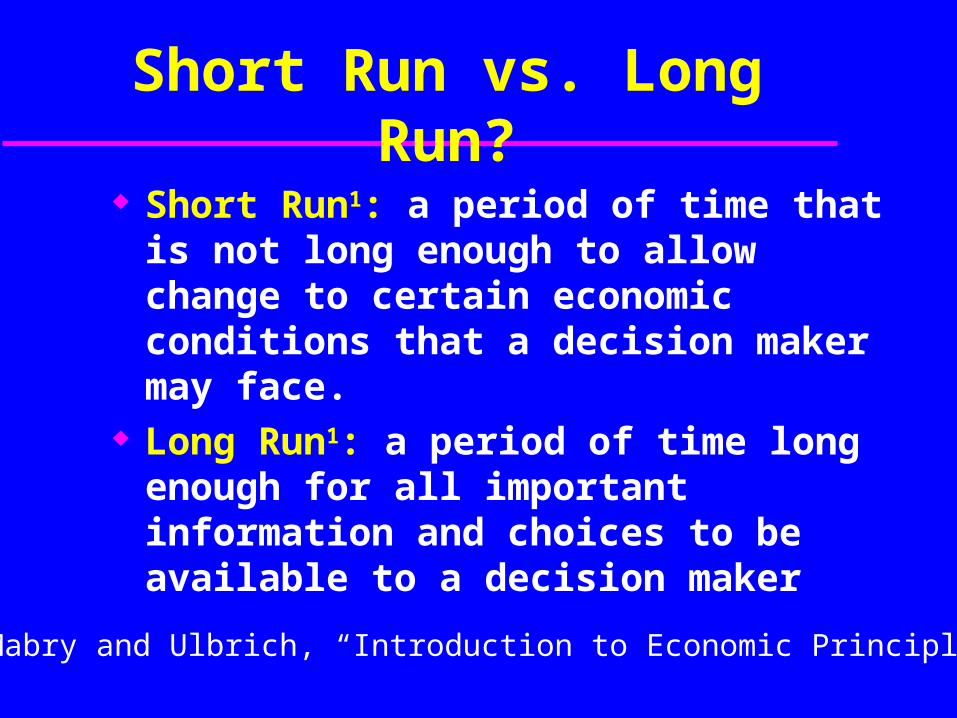
Short Run vs. Long Run?
Short Run1: a period of time that is not long enough to allow change to certain economic conditions that a decision maker may face.
Long Run1: a period of time long enough for all important information and choices to be available to a decision maker
1Mabry and Ulbrich, “Introduction to Economic Principles, 1989