Why Private Labels Show Long-Term Market Share Evolutionalm3/papers/private label trends.pdf · 2...
33
Why Private Labels Show Long-Term Market Share Evolution Stephen J. Hoch Alan L. Montgomery Young-Hoon Park October 2002 Stephen J. Hoch is John J. Pomerantz Professor of Marketing at the Wharton School, University of Pennsylvania, Alan L. Montgomery is Associate Professor of Industrial Administration at GSIA, Carnegie-Mellon University, and Young-Hoon Park is an Assistant Professor of Marketing at Johnson Graduate School of Management, Cornell University.
Transcript of Why Private Labels Show Long-Term Market Share Evolutionalm3/papers/private label trends.pdf · 2...

Why Private Labels Show Long-Term Market Share Evolution
Stephen J. Hoch Alan L. Montgomery
Young-Hoon Park
October 2002
Stephen J. Hoch is John J. Pomerantz Professor of Marketing at the Wharton School, University of Pennsylvania, Alan L. Montgomery is Associate Professor of Industrial Administration at GSIA, Carnegie-Mellon University, and Young-Hoon Park is an Assistant Professor of Marketing at Johnson Graduate School of Management, Cornell University.

2
Why Private Labels Show Long-Term Market Share Evolution
Abstract
Previous research has shown that most consumer packaged goods markets are in long-run
competitive equilibrium. In most categories, a given brand’s market share is stationary, showing
remarkable stability over long time horizons (10 years). This empirical generalization has been
attributed to consumer inertia and to competitive reaction elasticities that lead to offsetting
marketing spending which nullify attempts by one brand to take unilateral action to increase
share. We find a clear exception to this rule — during the period 1987-94 the retailer’s private
label consistently showed positive market share evolution. In 225 consumer packaged goods
categories, private labels trended upward 86% of the time. The trend persisted even after
controlling for marketing spending by both national and store brands. We consider the viability
of alternative explanations including changes in consumer and national brand behavior and find
that none of them can adequately account for the trend in private label share. We offer an
analytical explanation and empirical support for why private labels can grow even though
national brands shares are relatively stable. We argue that the retailer is in the best position to
opportunistically appropriate different sources of category growth because not only does it
control it own marketing spending, it also exerts some influence over the ultimate marketplace
spending of their national brand competitors.

Why Private Labels Show Long-Term Market Share Evolution A manager observes flat unit sales but a 2% decrease in market share for the quarter. Was
it seasonality, bad luck, problems with a leading retailer, an aggressive competitor, or a systemic
downward trend? An academic looks at the same numbers and then asks to see the prior seven
quarters which show market share point changes of +2%, -0.5%, +0.5%, +1%, -1%, +0.5%, and -
0.5% . The academic concludes that there is substantial noise in the system and that the market is
stationary. The manager sees that share was up 3% in the prior year but down 3% over the last 12
months and opts for quick and decisive marketing action to reverse the negative trend.
It is not clear who is right. Small share changes may be nothing more than random error
with no systematic drift, but 1-2% of a big number demands managerial attention and action. If
nothing else, it is difficult to defend doing nothing, especially if competitors are spending more
on promotion or lowering prices. We argue that both academic and manager are partially right
but not looking at the problem in the same way. It may be because the manager reacts so quickly
to small changes in performance that many consumer product goods (CPG) markets display the
stationarity documented by all studies of long-term market share (Bass and Pilon 1980;
Ehrenberg 1988; Lal and Padmanabhan 1995). The purpose of this paper, however, is neither to
demonstrate once again that market shares are remarkably stable nor to provide evidence that the
stability is due to consumer inertia and rapid competitive reactions. We find the nullifying
competitive reaction story compelling. Instead, we show that while most brands in a category do
show market share stationarity, there is one brand that does not, at least during the period of time
we study. And it is the retailer’s own brand, the private label.
We find that in 86% of 225 CPG categories the private label trended upward, on average
about 1% per year during the period 1987-1994. The popular business press repeatedly noted the

2 rise of private labels in the early 90's, but previous academic studies have reported significantly
smaller increases in private label shares — aggregate data from IRI and Nielsen indicated an
increase of less than two market share points over the same time period (Hoch 1996). The trends
we find are robust, persisting even after controlling for marketing spending by national brands
(NB’s) and the retailer. Cross-category analysis indicates that the uptrends are greater for health
and beauty aids (HBC) categories and also greater in categories where the private label is of
higher quality and is more extensively distributed. Private labels trends are independent of
category growth rates or size. Although improved consumer attitudes towards private labels
undoubtedly contributed to the PL uptrend, an improving economy during the time period casts
doubt on a budget constraint explanation.
We argue that the anomalous behavior of the private label largely occurs because it is the
only brand that controls not only its own marketing mix decisions, but also exerts a substantial
measure of control over many of the marketing mix decisions made by its competitors. By virtue
of making decisions after all the NB’s have committed to a course of action, the retailer, if they
so choose, is in a better position to blunt NB competitive reactions. We offer an analytic model
and empirical support for how the retailer can use their private label to opportunistically
appropriate many sources of category growth. We show how the retailer can unexpectedly turn
demand generating of the NB’s (e.g., price promotions) to their own advantage, essentially free-
riding on marketing spending by NB competitors.
Consumer and Institutional Inertia
A number of theoretical and empirical analyses suggest that a majority of CPG markets
are more or less mature and long-run brand shares are approximately stationary. For example,
Ehrenberg and colleagues (1988; Ehrenberg, Goodhardt, and Barwise 1990; Goodhardt,

3 Ehrenberg, and Chatfield 1984) have demonstrated the remarkable fit of the Dirichlet model to
consumer repeat purchase data. Strictly, the model applies to markets that are stationary (no
trends short or long run), not segmented (no homogeneous subgroups of consumers or brands),
and where purchase behavior is zero-order (no learning or purchase feedback). On the surface
these assumptions appear heroic, but in practice discrepancies from Dirichlet model predictions
are not common (cf. Fader and Schmittlein 1993; Kahn, Kalwani, and Morrison 1986).
Although brand specific idiosyncracies exist and changes in marketing mix decisions cause
short-term perturbations in performance, apparently they wash out in the long-run as market
shares generally attain a long-run equilibrium (Bass and Pilon 1980). Dikempe and Hanssens
(1995) in a meta-analysis of 400 prior analyses find that unit sales and marketing spending
usually (68% of the time) evolve (i.e., move in one direction or another). In contrast, a similar
analysis of market shares showed that 78% of the time series were stationary. Lal and
Padmanabhan (1995) found that less than 1/3 of all brand level time series showed a statistically
significant trend.
Although consumer inertia may explain some of the stationarity that characterizes
consumer packaged goods markets, there is plenty of evidence that consumer tastes change over
time and new brands and entirely new product categories that better satisfy consumer needs hit
the market every year. And so it seems likely that some other forces are operating. Specifically,
besides a healthy dose of consumer inertia, there is also plenty of institutional inertia. Let us go
back to the brand manager mentioned earlier. He knows that when he increases promotional
spending that his brand gets a significant short-term lift in sales performance. He probably
believes that own-price elasticities are substantial. Chances are that he also believes that sales of
competitive brands are influenced by his promotional spending. And the story suggests that he

4 believes that his brand has been adversely affected by competitive promotions, i.e., cross-price
elasticities also are substantial. With these beliefs, what does he do? He reacts to the
competition and his competitors react to his actions. Therefore, reaction elasticities also are
substantial. If he and/or his competitors overestimate own and cross elasticities, then what may
result is marketplace inertia due to aggressive reactions to competitors that essentially cancel
each other out. This is the conjecture of Bass et al. (1984) — offsetting promotional activities
contribute to the long-run equilibrium of market share.
Institutional inertia is probably of greater magnitude than consumer inertia since the firms
have so much to lose if they get forced out of the market. The natural tendency is to do whatever
it takes to ensure survival. Some firms may be willing to spend more than others but willingness
to spend has to be closely linked to current market share since market share is a surrogate for
what the firm potentially might lose by not matching. In support of this view, Lal and
Padmanabhan (1995) found no trend in relative promotional expenditures over time. Even in
categories that displayed non-stationary market shares, firms reacted quickly to changes in the
promotional spending of their competitors. In essence these matching reactions nullify short-
term changes in performance that might accompany a change in promotional spending by the
competition. The result is long-term stationarity in shares.
The Study
We analyze trends in the market share performance of private labels and compare them
with trends observed for national brands. We also analyze which national brands are most likely
to lose out to the private label. We show that even after controlling for changes in marketing
spending by national and store brands, the trends in private labels persist. We are left concluding
that it is the retailer who plays a dominant role in the evolution of private label market shares.

5 Data Description
The data come from the Marketing Factbook published annually by Information
Resources, Inc., a syndicated data provider to the CPG industry. The database contains most of
the categories sold by U.S. supermarkets during 1987-19941. The data represent an aggregation
of the purchases of about 35,000 individual households, from 26 markets shopping in 180
different food stores. IRI states that the sample has demonstrated itself to be representative of
national buyer behavior and overall consumer purchasing dynamics. The categories range from
dry grocery (both food and non-food), frozen and refrigerated foods, health and beauty aids, and
some general merchandise. There were 300 categories for which we had complete data for all 8
years. In 225 of these categories, there was a private label alternative available.2
At the category level, IRI provides the 13 variables in the Marketing Factbook as shown
in Table 1 along with total volume expressed in units appropriate to the category (ounces, rolls,
tablets). The same variables are reported for a number of manufacturers, brands, and the private
label. Private label totals represent an aggregation across all retailers’ store brand alternatives.
Disaggregate brand detail varies greatly from category to category. To maintain consistency
across categories, we aggregated up to the manufacturer level and formed five brand level
aggregates: the leading national brand (NB1), the second largest national brand (NB2), the third
largest national brand (NB3), the private label (PL), and all the rest of the brands (Other).
National brand market share status was determined by a manufacturer’s rank in 1987.
1 Although the Factbook goes back to 1982, we elected not to use the earlier years due to potential problems that could arise from a change in the sampling frame. During the first 5 years, the sample was largely composed of the small-town BehaviorScan markets, whereas in later years the data includes major metropolitan supermarket chains. 2 This dataset is available through the Wharton Research Data Services. For more information see http://wrds.wharton.upenn.edu.

6 Table 1: Description of the Database
Variable Description
Category Volume Percent of total category volume in units
% Households Buying Percent of households who made at least one purchase during the year
Volume/Purchase Average volume of the item bought on a single shopping trip
Purchases/Buyer Average number of times the item was purchased by buyers during the year
Purchase Cycle (Days) Average number of days between consecutive purchases among repeat buyers of the item
Price/Volume Average price paid per equivalent category-specific volume
Any Trade Deal Percent of volume sold with any form of promotion
Print Ad Feature Percent of volume sold with any newspaper or store flyer advertising
In-Store Display Percent of volume sold with any off-shelf display
Shelf Price Reduction Percent of volume sold with any short-term reduction in price of 5%
Store Coupon Percent of volume sold with a coupon issued by the store. All coupons for private labels are store coupons.
Manufacturer Coupon Percent of volume sold with a manufacturer’s coupon
% Off Deal Prices Average percent discounts on price deals
National Brand Stationarity and Private Label Evolution
We estimated a simple linear time trend by regressing market share onto time for each of
the five brand aggregates (NB1-NB3, PL and Other). A logistic transformation of the market
share data produced identical results. We also conducted two nonparametric tests: a standard run
test and the so-called r test. The r test compares the sum of squared deviations of successive
observations to the sample variance; a trend is present when this quantity is small. The run test
and the r test are omnibus tests that can detect more than simple linear trends; however, the

7 omnibus properties of these tests also result in lower statistical power against simple linear trends,
and therefore provide more conservative criteria for declaring a trend.
The results are summarized in Tables 2a-2b. Across the five brand aggregates, 57% of the
series displayed a significant trend, half positive and half negative.
Table 2a: Overall Trends and Regression of Market Shares onto Time
Overall Trends Significant Trends (p<.05)
Brand Positive Negative
Average Market Share Change/Year
Average Estimated Slope (S.E.) Positive Negative
PL 86% 5% +1.12 + .92 (.08) 68% 5%
NB1 40 60 -.36 -.02 (.01) 20 37
NB2 41 59 -.12 -.01 (.02) 17 32
NB3 48 52 -.10 -.03 (.03) 28 24
Other 28 72 -.54 -.13 (.04) 14 43
Table 2b: r Test and Run Test for Randomness
r Test (p<.05) Run Test (p<.05)
Brand Positive Negative Positive Negative
PL 61% 4% 44% 3%
NB1 17 32 12 24
NB2 16 26 9 20
NB3 23 22 14 19
Other 12 39 10 24
Using the same data source but a different time frame (1983-92) and brand aggregation scheme,
Lal and Padmanabhan (1995) found that 33% of the categories showed significant trends (p<.05).3
3 Lal and Padmanabhan do not report whether they included private labels in their analysis.

8 The most striking feature of the data is the overwhelming tendency for positive (86%) and
statistically significant (68%) trends in private label shares. The average annual change in private
label share is +1.12 share points. The average β coefficient of +0.92 for the time variable implies
an estimated increase in private label share of 6.44 share points over the 1987-94 period. This
does not strike us as evidence for stationarity. Instead store brands systematically gain ground at
the expense of all NB competitors. For the four NB aggregates, about half of the time series
display significant trends, somewhat more negative (34%) than positive (20%). There is more
noise in the national brand trend data , however, as only the trends for NB1 and Other are different
from chance.
Proportional Draw Analysis. The previous analysis provides clear evidence that private
labels are gaining share. The generally negative trends for each of the NBs in the category
suggest that private label is gaining some share from all of its competitors. A more penetrating
question, however, is whether the store brand is gaining at the expense of some brands more than
others. To address this issue, we compare the empirically observed share loses to a proportional
draw model which is consistent with a logit choice model formulation. Specifically, in the first
year of the time series (1987), for each of the four brand aggregates (NB1, NB2, NB3, Other) we
calculated each brand’s share of the market exclusive of the private label. For example, let us say
that the private label had 20% market share and NB1 had 30%. Moreover, let us say that the PL
gained 10 share points and rose to 30% market share in 1994. Then NB1's expected share lose
would be calculated as NB1/(100%-PL)=30/80=37.5% x (10% PL share gain)=-3.75%.
Table 3 displays the results of the proportional draw analysis. Private labels gain some
share from all their competitors, though they gain disproportionate market share from the smaller
brands in a category. Share losses for the top three brands all are less than predicted by a

9proportional draw. Only the Other category loses more than expected given its starting market
position. There are a number of possible reasons for this. Consumers may perceive private labels
as more similar to these smaller share brands. And as retailers make attempts to reduce supply
chain costs through assortment reductions, they may be more likely to eliminate smaller regional
brands who have less clout and with whom the retailer has a more limited relationship.
Table 3: Loss of Share Analysis: Observed vs Expected Under Proportional Draw
1987-1994 Market Share Loss Observed-Predicted
Brand Observed Proportional Draw t-test
NB1 2.52 3.34 <-1
NB2 .84 1.38 <-1
NB3 .70 1.28 -1.50
Other 3.78 1.85 3.53
The Impact of NB and PL Marketing Spending. The previous analyses showed robust
uptrends in PL market shares and weaker downward trends for the NB’s. Private labels gain
some market share from all of competitors, though the smallest brands in each category (Other)
lose more than their fair share. In the next analysis we take advantage of both the time series and
cross-sectional character of our data to better understand how the market mix decisions of both
the national brands and the retailer influence trends in private label share. The basic structure of
the analysis is as follows. First, the market shares were logit transformed to ensure that the
dependent variable ranges over real values and avoids truncation effects of the untransformed
values. Second, since we are interested in understanding trends in share across categories, the
share data were mean-centered separately by category, equivalent to including category
intercepts. We then estimated the following model:
10 stics)Characteri Buying(Category Decisions)Mix Marketing PL and (NB,[ 1)1(1)1(1 −+−++ ∆+∆= tttt PLfPL . (1)
We regress the logit transformed market shares onto the lagged market shares and changes in the
marketing mix decisions of both the national brands in aggregate and the private label while
controlling for contemporaneous changes in the buying characteristics of the category. 4
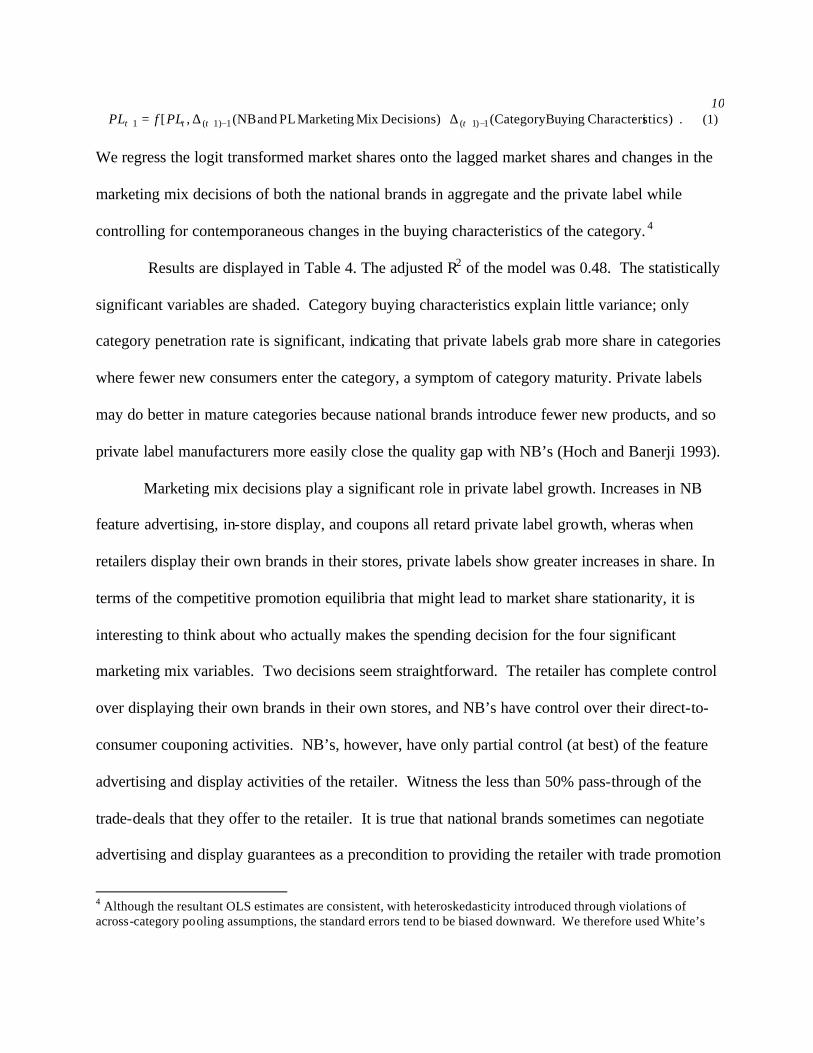
Results are displayed in Table 4. The adjusted R2 of the model was 0.48. The statistically
significant variables are shaded. Category buying characteristics explain little variance; only
category penetration rate is significant, indicating that private labels grab more share in categories
where fewer new consumers enter the category, a symptom of category maturity. Private labels
may do better in mature categories because national brands introduce fewer new products, and so
private label manufacturers more easily close the quality gap with NB’s (Hoch and Banerji 1993).
Marketing mix decisions play a significant role in private label growth. Increases in NB
feature advertising, in-store display, and coupons all retard private label growth, wheras when
retailers display their own brands in their stores, private labels show greater increases in share. In
terms of the competitive promotion equilibria that might lead to market share stationarity, it is
interesting to think about who actually makes the spending decision for the four significant
marketing mix variables. Two decisions seem straightforward. The retailer has complete control
over displaying their own brands in their own stores, and NB’s have control over their direct-to-
consumer couponing activities. NB’s, however, have only partial control (at best) of the feature
advertising and display activities of the retailer. Witness the less than 50% pass-through of the
trade-deals that they offer to the retailer. It is true that national brands sometimes can negotiate
advertising and display guarantees as a precondition to providing the retailer with trade promotion
4 Although the resultant OLS estimates are consistent, with heteroskedasticity introduced through violations of across-category pooling assumptions, the standard errors tend to be biased downward. We therefore used White’s

11monies. But the retailer still has the final say and so can blunt the competitive reactions of the
national brands to the performance and promotional spending for their own private labels.
Table 4: Determinants of Trends in Private Label Market Share
Asymptotic Covariance procedure to recompute corrected standard errors which are asymptotically consistent under these types of specifications.
Variable
Parameter Estimate
Standard Error t-statistic p value
PLt .6352 .0356 17.83 0.000
∆(Category Volume)? 3.57x10⁻⁶ 3.70x10⁻⁶ 0.96 0.336
∆(Category Penetration Rate) -.0093 .0046 -1.99 0.047
∆?Volume/Purchase) .0001 .0167 0.08 0.937
∆(Category Purchase Cycle) .0022 .0020 1.12 0.261
∆(NB Price) .0429 .0523 0.82 0.412
∆(NB Trade Deals) .0007 .0020 0.36 0.723
∆(NB Print Ad Feature) -.0073 .0034 -2.15 0.032
∆(NB In-Store Display) -.0082 .0027 -3.00 0.003
∆(NB Coupons) -.0091 0.0019 -4.69 0.000
∆(PL Price) -.0465 .0353 -1.32 0.188
∆(PL Trade Deals) .0006 .0018 0.31 0.757
∆(PL Print Ad Feature) .0033 .0024 1.38 0.167
∆(PL In-Store Display) .0058 .0022 2.61 0.009
∆(PL Coupons) .0089 .0106 0.84 0.404

12 Although changes in NB and PL marketing spending influences private label market
shares, the large coefficient for the lagged PL share variable suggests a substantial upward trend
even after controlling for marketing spending. We re-estimated the model in Eq. 1 without
including the lagged PL share term and saved the residuals. We then re-estimated the time trends
by regressing the residuals for each category onto the time variable. From this analysis we can
determine whether the long-term trends persist even after controlling for NB and PL marketing
spending. This analysis showed that 50% of the residual trends were positive and significant and
8% were negative and significant versus the 68% positive and 5% negative shown in Table 2a.
Private label trends persist even after controlling for marketing spending. In the next section we
evaluate the viability of some alternative explanations.
Determinants of Private Label Trends
In light of all the prior research documenting long-term stationarity in CPG brand shares,
we find the systematic uptrend in private label market shares noteworthy. Moreover, previous
time series analyses have reported smaller changes in private label share (Hoch 1996). The more
interesting issue, however, is why private labels have trended upward while other brands have
displayed stationarity. In this section we consider a number of alternative factors that might
contribute to the systematic trends in the private label during 1987-94.
Changes in Consumer Attitudes. One reason for the uptrend in store brands could be
systematic changes in consumer attitudes and knowledge. Consumers could have become more
sophisticated about NB-PL brand equivalence or become more value-conscious during the period
of the study. In Table 5 we reproduce data from DDB Needham’s annual Life Style Study that
address attitudes toward store vs national brands and price consciousness.

13Table 5: Consumer Attitudes Toward NB’s and Private Labels
Year (1985-1995)
Statement 85 86 87 88 89 90 91 92 93 94 95 Trend
When I have a favorite brand I buy it-no matter what else is on sale. 59 60 59 61 58 58 59 58 54 56 59
-.33*
A national advertised brand is usually a better buy than a generic brand. 31 36 34 34 31 36 36 28 31 27 34 -.34
I try to stick to well-known brand names. 63 67 63 64 61 64 63 58 61 57 59 -.69*
A store’s own brand is usually a better buy than a nationally advertised brand. 55 53 48 49 53 46 51 52 53 54 55 .20
I always check prices even on small items. 67 66 68 65 67 63 63 63 66 65 64 -.30
* Denotes an estimate that is significant at the 5% level.
As can be seen, the evidence is mixed. During the relevant time period, consumers become less
convinced of the superiority of national brands (the first 3 items), but there is no trend for either of
the questions concerning whether the store brand is a better buy or consumers are more price
consciousness. Previous research (Wells 1970) has shown that public opinion is remarkably stable
even over long time horizons. Consumer attitudes may have become more favorable towards
private labels, but it is difficult to believe that the relatively small changes could completely
account for the sizable trends in private label market share that we observed, especially given the
limits to attitudes predicting actual behavior.
Budget Constraints. Most practitioners and academics believe that private labels are
income inferior goods due to their lower perceived quality. This implies that as income increases,
consumers will shift consumption away from private labels towards higher quality national brands,
whereas declines in income would result in gains for private labels. Previous research (Hoch and
Banerji 1993) has shown that changes in private label share are inversely related to changes in
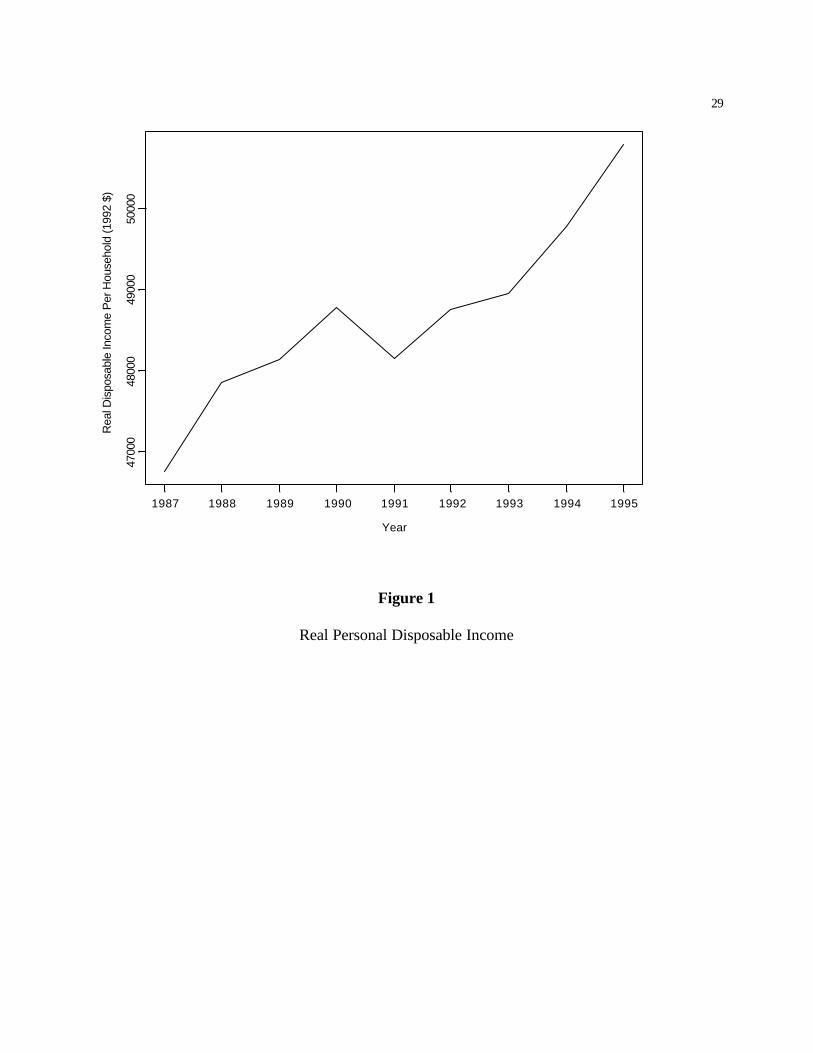
personal disposable income. However, this conjecture conflicts with the steady observed growth
14in both private label sales and real disposable income over the period of analysis. Real disposable
income is plotted in Figure 1, the only decline occurred during the 1991 recession. If private labels
are income inferior then their sales should have moved inversely with income. Budget constraints
do not explain the uptrend in private label shares.
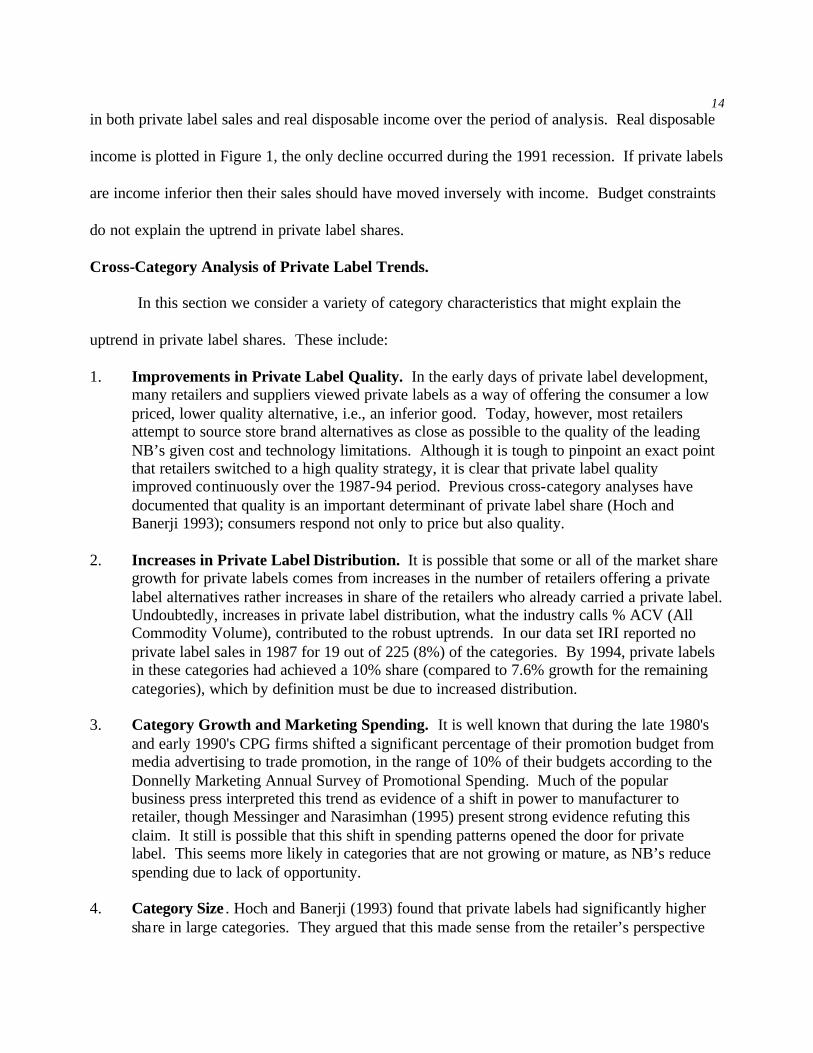
Cross-Category Analysis of Private Label Trends.
In this section we consider a variety of category characteristics that might explain the
uptrend in private label shares. These include:
1. Improvements in Private Label Quality. In the early days of private label development, many retailers and suppliers viewed private labels as a way of offering the consumer a low priced, lower quality alternative, i.e., an inferior good. Today, however, most retailers attempt to source store brand alternatives as close as possible to the quality of the leading NB’s given cost and technology limitations. Although it is tough to pinpoint an exact point that retailers switched to a high quality strategy, it is clear that private label quality improved continuously over the 1987-94 period. Previous cross-category analyses have documented that quality is an important determinant of private label share (Hoch and Banerji 1993); consumers respond not only to price but also quality.
2. Increases in Private Label Distribution. It is possible that some or all of the market share
growth for private labels comes from increases in the number of retailers offering a private label alternatives rather increases in share of the retailers who already carried a private label. Undoubtedly, increases in private label distribution, what the industry calls % ACV (All Commodity Volume), contributed to the robust uptrends. In our data set IRI reported no private label sales in 1987 for 19 out of 225 (8%) of the categories. By 1994, private labels in these categories had achieved a 10% share (compared to 7.6% growth for the remaining categories), which by definition must be due to increased distribution.
3. Category Growth and Marketing Spending. It is well known that during the late 1980's
and early 1990's CPG firms shifted a significant percentage of their promotion budget from media advertising to trade promotion, in the range of 10% of their budgets according to the Donnelly Marketing Annual Survey of Promotional Spending. Much of the popular business press interpreted this trend as evidence of a shift in power to manufacturer to retailer, though Messinger and Narasimhan (1995) present strong evidence refuting this claim. It still is possible that this shift in spending patterns opened the door for private label. This seems more likely in categories that are not growing or mature, as NB’s reduce spending due to lack of opportunity.
4. Category Size . Hoch and Banerji (1993) found that private labels had significantly higher
share in large categories. They argued that this made sense from the retailer’s perspective

15since an investment in gaining share in a large category would bring larger rewards than in smaller categories. This suggests that there may be greater opportunity for private label growth in smaller categories where store brands are less developed.
We conducted a cross-category analysis of the private label trends to understand the
influence of each of the factors just mentioned. The dependent variable was the change in share of
the private label between 1987-94.5 Each category was classified into one of four types: food,
non-food, HBC, and refrigerated/frozen. As a surrogate for private label quality, we utilized the
quality rating scores from Hoch and Banerji (1993) who surveyed 25 quality assurance experts in
the late 1980's. In addition we used Hoch and Banerji’s estimates of extent of distribution for the
private label. For our measure of category growth, we estimated growth rates by regressing overall
category unit volume onto time. The 225 categories were then divided into growing (coded +1) or
declining (-1) categories depending on whether the trend coefficient was statistically significant
(p<.05), or flat otherwise (0). Category volume was obtained by multiplying unit volume times
average unit price for the year 1987.
Results. Table 6 provides the results of this analysis. Three different models were
estimated. Model 1 includes only category type indicator variables, with the refrigerated/frozen
type serving as the base case. Significant differences in private label growth rates emerged;
private labels grew much faster in HBC categories (13.1 share points) whereas refrigerated/frozen
categories grew the slowest (4.5 share points). This improvement in HBC private labels is not
totally unexpected and is probably at least partly driven by the strong push by supermakets to
develop the drug and pharmacy side of the business during this period. Model 2 includes only the
category characteristics. Only the quality variable is significant.
5An analysis using the estimated trend coefficients as the dependent variable yielded similar results.

16 Model 3 contains all the variables. The HBC indicator variable is still significant as is
quality and extent of distribution. Private labels grew more in categories where they started off at
a higher quality level, reinforcing the importance to consumers of high quality (Hoch and Banerji
1993). We had expected a negative quality coefficient might if across the board uptrends in
private label were due predominately to improvements in quality, our rationale being that
improvements in private label quality were more likely for categories that started off with lower
quality and had more room to improve. Possibly lower quality categories faced technological
barriers to improvements in quality which higher quality categories could (continue to) overcome.
Higher levels of distribution also were associated with larger private label trends. Our thinking
was that the coefficient for this variable would be negative if the uptrends in private labels were
due more to increases in the number of retailers carrying a private label rather than increases in
share within retailers already carrying private labels. The positive coefficient argues against that
conjecture and suggests that higher levels of distribution were a necessary condition for future
growth. Neither category growth nor category volume were statistically significant.
Table 6: Cross Category Analysis of Private Label Trends
Variable Model 1 Model 2 Model 3
Constant 4.5
(3.7) -7.7 (-.8)
-29.8 (-3.0)
Non-Food 2.5
(1.4) -- 3.1
(1.7)
HBC 8.6
(5.1) -- 10.9 (5.9)
Food 1.1
(0.7) -- 1.0
(0.8)
Category Growth -- 0.35 (0.5)
1.1 (1.5)

17
Category Volume -- -9.3
(-1.7) -8.2
(-1.6)
Extent of Distribution --
-5.7 (-1.4)
9.7 (2.1)
Quality -- 4.4
(2.0) 5.7
(2.7)
R2 .14 .05 .21 T-values of the estimates are provided in parentheses below the estimate.
These cross-category analyses show that private labels grew faster in some categories
(HBC) than others. Moreover, private labels grew faster in categories with higher quality
alternatives that were more widely distributed. We are by no means trying to suggest that across-
the-board improvements in private label quality and distribution intensity did not contribute to the
overall uptrend in private label share. We think it likely that private label quality and distribution
continued to slowly improve during the time of the study. At the same time, this cross-category
analysis suggests that additional forces were operating. Consumer attitudes toward private labels
improved slightly over the relevant time period but hardly enough to explain the trends in share
that we found, especially considering that attitudes usually are weak predictors of actual behavior.
Budget constraints seem an unlikely factor since the economy generally trended upward during the
relevant time frame. Although it has been well-documented that CPG firms shifted their marketing
investments from advertising to trade promotion, we found that PL uptrends occurred independent
of category growth, 7.6 share points in growing categories vs 6.6 and 6.9 share points in flat and
declining categories. This casts doubt on the idea that the PL’s benefited solely in cases where
category maturity or decline led to decreased investment by NB’s.

18 And so if these various explanations cannot adequately account for the private label, what
does explain the fact that private labels have shown consistent long-term growth while national
brands have been relatively stable? In the next section we sketch an analytic framework for the
role of the retailer and provide some data consistent with the model.
An Analytic Framework to Understand Private Label Growth
The average annual change in share for the top three national brands is -0.20%. In contrast,
the average annual change for private labels is +1.12%. To illustrate the distribution of these
changes we construct probability density estimates of the annual percentage changes for the
national brands and private labels across the 225 product categories as shown in Figure 2. Notice
that there is substantial variation in annual growth rate for all brands, but the distribution for
private labels is shifted to the right which indicates an average tendency for private labels to grow
at the expense of the national brands.
We offer a simple analytic framework to account for this pattern. We do not claim that it is
the only explanation, but the model is simple, robust, and consistent with the data. It offers insight
into why private labels may grow while other brands decline at a very slow rate. The key
assumption is that retailers target private labels at the most successful brand(s) in a category
(Sayman, Hoch, and Raju 2001). We presume that the targeted brand(s) is growing in relative
and/or absolute terms; it is difficult to imagine a retailer allocating scarce resources toward
targeting national brands with contracting shares. By selectively targeting pockets of category
growth, the retailer can opportunistically appropriate some fraction of national brand growth for
their own private label even if the overall marketplace is stagnant.
Private Label Targeting of National Brands: We take a broad view of private label
targeting of national brands. The most direct way that private labels target national brands is

19 developing private labels that have similar product attributes and packaging. At the same time,
there are less drastic and expensive ways that retailers can re-target that still may allow the retailer
to appropriate some of the chosen national brand’s growth. First, the retailer can change the shelf
placement of the private label or alter the target of “compare and save” signage. Second, the
retailer may introduce more than one private label. Sayman and Raju (2000) showed that in
categories with two leading national brands (e.g., Miracle Whip and Hellman’s Mayonnaise), a
retailer is more likely to maintain multiple store brands. Premium store brands like President’s
Choice or Safeway Select are one way to accomplish this. Finally, there are numerous ways that
the retailer can piggy-back onto the short-term demand generating activities of the fastest growing
national brands. When NB’s spend trade promotion dollars to secure in-store display space,
retailers can display their store brands in close proximity. The retailer can use national brand
advertising (both retailer- initiated feature advertising and national brand’s own direct-to-consumer
advertising) to build store traffic and then re-route that traffic toward its own brand once customers
are inside the store. Some retailers engage in a practice called price shielding; whenever a leading
national brand engages in a price promotion, the store brand also goes on deal in order to maintain
its price advantage. Price shielding is not a game that NB’s can play against each othe r. Retailers
can also select which promotional offers to accept or reject (Hess and Armstrong 1997), giving
them control over price levels and price variation.
Private Label Growth in a Stagnant Market: Suppose that a retailer sells two national
brands and the absolute change in sales growth for each brand is denoted by ∆qi, where the
subscript i=1 or 2 denotes the index of the corresponding national brand and 3 corresponds with
the private label. For simplicity let us assume that the ∆qi’s are independently and identically

20 distributed normal variates, ∆qi~N(0,σ2) for i=1, 2. In other words the national brand market is
stable, i.e., E [∆qi]=0. We assume that the retailer targets the national brand whose share is
increasing the fastest and will attract g percent of the new market created by this leading national
brand, ∆q3=g*max (∆q1,∆q2). The expected value 6 of private label growth is:
0/2)],[max(][ 2213 >⋅=∆∆⋅=∆ πσgqqEgqE (2)
The key insight is that private labels grow faster as variability (σ2) in the growth rates of the NB’s
increases. Notice that private labels are expected to grow even though the individual brands have
no expected growth. To illustrate this point we plot the probability density of the growth in Figure
3. Notice the qualitative similarities between Figure 2 and 3, namely the private labels have
positive growth and show less variance than the national brands.
We realize that this framework is simplistic, but it is consistent with our findings, our
intuition about how retailers operate, and represents a parsimonious argument about why private
labels may exhibit growth while national brands are relatively stable. Moreover, this framework is
robust, and does not require normality or specific distributional assumptions as we have used in
our illustration. The only critical assumption is that the sales of the private label depends upon the
sales of a targeted national brand. As long as a retailer has a better than average chance of
targeting the leading national brand in its market, then private labels can exhibit positive growth.
Changes to our assumptions may lessen the growth of the private label, but what we find most
interesting is that the private label growth can occur in a stagnant market.
In essence PL targeting provides a means for the retailer to free-ride on any demand
generating activity by an NB, long or short-term in nature, and there are limits on the actions that
6 If X and Y follow a bivariate normal distribution (E[X]=:X, E[Y]=:Y, Var[X]=FX
2, Var[X]=FY2, and Corr[X,Y]=D),

21 the NB can take to prevent it. Consider the specific case of price promotion by NB’s7. Using the
usual linear demand model, where qi and pi denoting the movement and price of brand i
(1,2=NB’s, 3=PL),
),0(~ , 2332211 iiiiiioii Npppq σεεββββ ++++= (3)
Suppose that the retailer engages in price shielding and sets the price of the private label to always
fall below the current national brand price by some small discount:
δ−= ),min( 213 ppp (4)
For simplicity we assume that the prices of the two national brands are identically and
independently distributed normal variates, ),(N~ 2_
νppi . The expected movement of the PL can be
shown to be:
( )pqE 33231333033 ][ βββπ
νββ +
−= (5)
If demand is downward sloping, i.e, β33<0, it follows that δE[q3]/δυ>0. In other words when there
is more variability in the price of NB’s (<2), the PL can grow faster if the retailer targets the price
promotion. We are not arguing that price shielding is necessarily profit maximizing, but when the
retailer engages in such a practice, the model suggests that greater NB promotion can perversely
increase PL sales, not decrease sales as would happen to other national brands. Intuitively retailers
can enjoy the increased traffic drawn to the category and store by the national brand promotions
without the promotional costs incurred by the national brands.
Empirical Support for Opportunistic Targeting of National Brand Growth
Clark (1961) showed that E[max(X ,Y)]=:XM()/L)+:YM(-)/L)+LN()/L), where )=:X-:Y and L2=FX
2+FY2-2DFXFY.
7 We use price only as an example to illustrate how retailers can target other brands. This model can easily be extended to incorporate other marketing mix variables like feature advertising, in-store display, packaging, and placement. If these other effects enter linearly then price can be reinterpreted in our model as a combination of these

22 Although we do not have data for a direct test of our analytic model, there is one
implication which is testable. Specifically, our opportunistic targeting model implies that private
labels should display greater market shares gains when there is greater variability in growth rates
of the national brands. This is because higher variability implies that the growth rate of the fastest
growing national brand (the extreme value) will be larger.
To test this proposition we used three years of retailer level data for 43 product categories
to examine whether there is a systematic relation between within category variability in na tional
brand growth rates and trends in private label market shares. The 1993-1995 data come AC
Nielsen and have previously been analyzed by Dhar and Hoch (1997). For the top 120 U.S.
supermarket retailers, we utilize yearly sales data for food categories ranging from coffee and
cereal to dairy products. For each retailer, we identified the top three national brands and the
retailer’s private label. To compute a standardized measure of variability in national brand growth,
for each year we first computed unit market share of the top national brands out of the top three.
For example, market share of NB1=NB1/(NB1+NB2+NB3). We utilize shares rather than unit
sales to control for differences in sales volumes across retailers. Then we compute changes in
shares for the three NB’s from year 1 to year 2 and year 2 to year 3. Our measure of variability is
simply the sum of these squared changes in shares. We also compute changes in private label
shares from year 1 to year 2 and year 2 to year 3. Notice that because the NB shares are computed
holding out the private label, there is no necessary mathematical relationship between NB
variability and changes in private label share.
We then computed the correlation between NB variability and private label market share
growth for each of the 43 categories. As predicted the correlation was positive, an average
variables.

23 correlation of 0.20, indicating that private labels tend to trend upward at a greater rate when there
is greater variability in the growth rates of the top three national brands. Out the 43 correlations,
38 were positive and for 26 categories the correlation was statistically significant at p<.05. This
demonstration lends support to the notion that there is significant option value that accrues to the
retailer through opportunistically targeting the fastest growing national brands. Moreover, the
benefits to the private label systematically increase with increases in the variability (and the
extreme value) of these national brand growth rates. We should point out that because these
results rely on a within-category across-retailer analysis they cannot be explained by secular forces
such as changes in consumer attitudes, private label quality, the economy, or increases in
distribution.
Discussion
Exogenous events may disturb the stability that characterizes most CPG markets. A
product recall or health scare may lead to a shift in market power, e.g. the Tylenol tampering
episode. And genuinely new product ideas can shake up an established category. For example, in
1984 when P&G introduced gel technology into its disposable diapers, Pampers gained 12 share
points in one year (though because the technology was not patent protected competitors
reformulated their products and regained much of the lost share within a couple of years).
What else might perturb the institutional inertia that keeps any one competitor in check?
Any one brand controls its own spending but has little if any control over what its competitors do.
In essence each firm is one player in an n-firm prisoner’s dilemma where tit- for-tat rules the day.
Every brand that is except for one–the retailer’s own private label brand. This brand is much like
any other brand to the consumer. It faces downward sloping demand with respect to price and
upward sloping demand with respect to quality. But unlike other firms, the private label occupies

24 a special role because the firm that owns it and stands the most to gain and lose from its
performance is the very same firm (the retailer) that ultimately has some measure of control over a
variety of marketing mix decisions that get made for other brands in the category. For example,
although the wholesale prices and trade promotion spending of the national brands have an
undeniable influence on the ultimate price and promotion decisions made by the retailer, the
retailer still has the final say and more control over the competition, at least relative to the control
exerted by one national brand over another.
Therefore, unlike the national brand case, the substantial reaction elasticities that may keep
NB shares relatively constant over time may not exert as strong an influence over the market share
performance of private labels. Consider the case of price competition in a product category
without a substantial private label presence. Generally when one national brand (NB) lowers its
wholesale price, other national brand competitors follow suit quickly and the retailer passes those
price changes onto the consumer. In contrast, when the retailer has a private label in the category,
it is not clear how they will react to the NB’s price decrease. Before passing the price decrease
onto the consumer, the retailer must decide whether this is in their best interests (Hoch and Lodish
1998). Not only must they anticipate the change in demand for the NB, but also the secondary
impact of this price change on their own private label. In the end they may decide to pocket the
national brand’s lower price in the form of higher margins and the NB has little recourse.
In a high percentage of categories private labels have exhibited substantial long-term
positive growth trends. This contrasts with NB’s who have grown in far fewer categories and also
show negative growth in many other categories. To the best of our knowledge our data-set is the
most extensive that has been brought to bear on this problem in terms of the number of categories

25 analyzed and length of time considered. These results indicate private labels exhibit unique
growth characteristics.
The private labels analyzed in this paper are not those of a single retailer, but aggregates of
private labels across all retailers. We know that local markets are heterogeneous with big
differences in the performance of store brands both across retailers (Dhar and Hoch 1997) and
across categories (Hoch and Banerji 1993). The leading national brand is not the same across all
geographic markets or even within the same market. Over the 3 year period 1993-95, the leading
national brand in the coffee category was Folgers, but across chains Folgers was the top brand in
only 65% of chains and the fastest growing brand in only 20% of the chains. If each retailer targets
the leading national brand in its chain, the consumer segments reached by private labels may be
quite different. The importance of this heterogeneity is that national brands are not competing
against a single private label, but a family of private labels each of whom pursue idiosyncratic
local policies. Therefore defensive marketing strategies for national brands against encroachment
by private labels cannot be narrowly targeted at a single consumer segment, and hence traditional
strategies used to compete against other national brands may prove very ineffective. We hope the
findings of this paper will encourage other researchers to continue empirical and theoretical
research into the unique behavior of private labels at both the micro and macro-levels.

26 References
Bass, Frank M. and Thomas Pilon (1980), “A Stochastic Brand Choice Framework for
Econometric Modeling of Time Series Market Share Behavior,” Journal of Marketing Research,
17 (November), 486-97.
Bass, Frank M., Moshe Givon, Manohar U. Kalwani, David J. Reibstein, and Gordon P. Wright
(1984), “An Investigation into the Order of the Brand Choice Process,” Marketing Science, 3
(Fall), 267-87.
Blattberg, Robert C and Kenneth J. Wisniewski (1989), “Price-Induced Patterns of Competition,”
Marketing Science, 8 (Fall), 291-309.
Clark, Charles E. (1961), “The Greatest of a Finite Set of Random Variables”, Operations
Research, March-April, pp. 145-162.
Dekimpe, Marnik G. and Dominique M. Hanssens (1995), “Empirical Generalizations about
Market Evolution and Stationarity,” Marketing Science, 14 (Summer, Part 2 of 2), G109-21.
Dhar, Sanjay K and Stephen J. Hoch (1997), “Why Store Brand Penetration Varies by Retailer,”
Marketing Science, 16 (3), 208-27.
Ehrenberg, Andrew S.C. (1988), Repeat Buying: Facts, Theory, and Applications, London:
Charles Griffin and Co.; New York: Oxford University Press.
Ehrenberg, Andrew S. C., Gerald J. Goodhardt, and T. Patrick Barwise (1990), “Double Jeopardy
Revisited,” Journal of Marketing, 54 (July), 82-91.
Fader, Peter S. and David C. Schmittlein (1993), “Excess Behavioral Loyalty for High-Share
Brands: Deviations from the Dirichlet Model for Repeat Purchasing,” Journal of Marketing
Research, 30 (November), 478-93.
FMI Category Management Guide #1 (1995), Food Marketing Institute, Washington, DC.

27 Goodhardt, Gerald J., Andrew S. C. Ehrenberg, and Christopher Chatfield (1984), “The Dirichlet:
A Comprehensive Model of Buying Behavior,” Journal of the Royal Statistical Society, 147, 621-
55.
Hess, James D. and Marcia K. Armstrong (1997), “To Deal or Not to Deal: Trade Dealing with
Opportunistic Retailers”, Marketing Science Conference, Unive rsity of California, Berkeley.
Hoch, Stephen J. (1996), “How should National Brands Think about Private Labels,” Sloan
Management Review, 37 (Winter), 89-102.
Hoch, Stephen J. and Shumeet Banerji (1993), “When Do Private Labels Succeed?,” Sloan
Management Review, 34 (Summer), 57-67.
Hoch, Stephen J. and Leonard M. Lodish (1998), "Store Brands and Category Management,”
Working Paper, The Wharton School, University of Pennsylvania, PA.
Johnson, Norman L., Samuel Kotz, and N. Balakrishnan (1994), Continuous Univariate
Distributions, 2nd edition, John Wiley & Sons, New York.
Kahn, Barbara E., Manohar U. Kalwani, and Donald G. Morrison (1986), “Measuring Variety-
Seeking and Reinforcement Behaviors Using Panel Data,” Journal of Marketing Research, 23
(May), 89-100.
Lal, Rajiv and V. Padmanabhan (1995), “Competitive Response and Equilibria,” Marketing
Science, 14(Summer, Part 2 of 2), G101-8.
Lindgren, Bernard W. (1968), Statistical Theory, Macmillan, New York.
Messinger and Narasimhan, Chakravarti (1995), “Has Power Shifted in the Grocery Channel,”
Marketing Science, 14 (2), 189-223.
28 Sayman, Serdar, and Jagmohan Raju (2000), “How Category Characteristics Affect the Number of
Store Brands Offered by the Retailer: A Model and Empirical Analysis,” Working Paper, Wharton
School, University of Pennsylvania.
Sayman, Serdar, Stephen J. Hoch, and Jagmohan Raju (2001), “Positioning of the Store Brand,”
Working Paper, The Wharton School, University of Pennsylvania, PA.
29
Figure 1
Real Personal Disposable Income
Year
Rea
l Dis
posa
ble
Inco
me
Per
Hou
seho
ld (1
992
$)
1987 1988 1989 1990 1991 1992 1993 1994 1995
4700
048
000
4900
050
000

30
Quantile
Pro
babi
lity
-10 -5 0 5 10
0.0
0.05
0.10
0.15
0.20
National BrandsPrivate Labels
Figure 2
Empirical distribution of change in annual market share for the national brands and private label.

31
Quantile Figure 3:
Distribution of national brand growth (when growth follows a standard normal distribution) and the corresponding leading national brand (i.e. the maximum from a bivariate normal distribution).
-3 -2 -1 1 2 3
0.1
0.2
0.3
0.4
0.5
National brand
LeadingNational brand