
Why Oil Prices Can’t Bounce Very High; Expect Deflation ...€¦ · Why Oil Prices Can’t...
15
Why Oil Prices Can’t Bounce Very High; Expect Deflation Instead Posted on September 6, 2017 by Gail Tverberg Economists have given us a model of how prices and quantities of goods are supposed to interact. Figure 1. From Wikipedia: The price P of a product is determined by a balance between production at each price (supply S) and the desires of those with purchasing power at each price (demand D). The diagram shows a positive shift in demand from D1 to D2, resulting in an increase in price (P) and quantity sold (Q) of the product. Unfortunately, this model is woefully inadequate. It sort of works, until it doesn’t. If there is too little of a product, higher prices and substitutions are supposed to fix the problem. If there is too much, prices are supposed to fall, causing the higher-priced producers to drop out of the system. This model doesn’t work with oil. If prices drop, as they have done since mid-2014, businesses don’t drop out. They often try to pump more. The plan is to try to make up for inadequate prices by increasing the volume of extraction. Of course, this doesn’t fix the problem. The hidden assumption is, of course, that eventually oil prices will again rise. When this happens, the expectation is that oil businesses will be able to make adequate Our Finite World Exploring how oil limits affect the economy
Transcript of Why Oil Prices Can’t Bounce Very High; Expect Deflation ...€¦ · Why Oil Prices Can’t...
Why Oil Prices Can’t Bounce Very High; Expect Deflation InsteadPosted on September 6, 2017 by Gail Tverberg
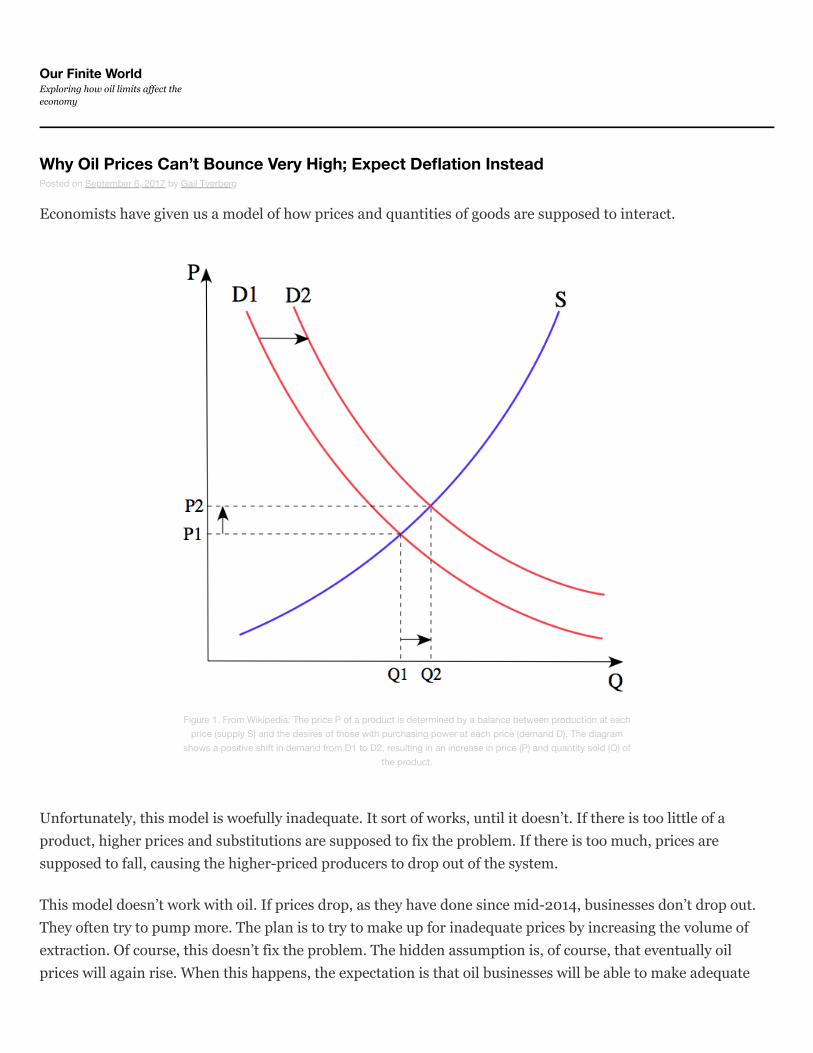
Economists have given us a model of how prices and quantities of goods are supposed to interact.
Figure 1. From Wikipedia: The price P of a product is determined by a balance between production at eachprice (supply S) and the desires of those with purchasing power at each price (demand D). The diagram
shows a positive shift in demand from D1 to D2, resulting in an increase in price (P) and quantity sold (Q) ofthe product.
Unfortunately, this model is woefully inadequate. It sort of works, until it doesn’t. If there is too little of aproduct, higher prices and substitutions are supposed to fix the problem. If there is too much, prices aresupposed to fall, causing the higher-priced producers to drop out of the system.
This model doesn’t work with oil. If prices drop, as they have done since mid-2014, businesses don’t drop out.They often try to pump more. The plan is to try to make up for inadequate prices by increasing the volume ofextraction. Of course, this doesn’t fix the problem. The hidden assumption is, of course, that eventually oilprices will again rise. When this happens, the expectation is that oil businesses will be able to make adequate
Our Finite WorldExploring how oil limits affect theeconomy
https://ourfiniteworld.com/2017/09/06/why-oil-prices-cant-bounce-very-high-expect-deflation-instead/

profits. It is hoped that the system can again continue as in the past, perhaps at a lower volume of oil extraction,but with higher oil prices.
I doubt that this is what really will happen. Let me explain some of the issues involved.
[1] The economy is really a much more interlinked system than Figure 1 makes it appear.
Supply and demand for oil, and for many other products, are interlinked. If there is too little oil, the theory isthat oil prices should rise, to encourage more production. But if there is too little oil, some would-be workerswill be without jobs. For example, truck drivers may be without jobs if there is no fuel for the vehicles they drive.Furthermore, some goods will not be delivered to their desired locations, leading to a loss of even more jobs(both at the manufacturing end of the goods, and at the sales end).
Ultimately, a lack of oil can be expected to reduce the availability of jobs that pay well. Digging in the groundwith a stick to grow food is a job that is always around, with or without supplemental energy, but it doesn’t paywell!
Thus, the lack of oil really has a two-way pull:
(a) Higher prices, because of the shortage of oil and the desired products it produces.
(b) Lower prices, because of a shortage of jobs that pay adequate wages and the “demand” (really affordability)that these jobs produce.
[2] There are other ways that the two-way pull on prices can be seen:
(a) Prices need to be high enough for oil producers, or they will eventually stop extracting and refining the oil,and,
(b) Prices cannot be too high for consumers, or they will stop buying products made with oil.
If we think about it, the prices of basic commodities, such as food and fuel, cannot rise too high relative to thewages of ordinary (also called “non-elite”) workers, or the system will grind to a halt. For example, if non-eliteworkers are at one point spending half of their income on food, the price of food cannot double. If it does, theseworkers will have no money left to pay for housing, or for clothing and taxes.
[3] The upward pull on oil prices comes from a combination of three factors.
(a) Rising cost of production, because the cheapest-to-produce oil tends to be extracted first, leaving themore expensive-to-extract oil for later. (This pattern is also true for other types of resources.)
(b) If workers are becoming more productive, this growing productivity of workers is often reflected in higherwages for the workers. With these higher wages, workers can afford more goods made with oil, and that useoil in their operation. Thus, these higher wages lead to higher “demand” (really affordability) for oil.

Recently, worker productivity has not been growing. One reason this is not surprising is because energyconsumption per capita hit a peak in 2013. With less energy consumption per capita, it is likely that, on average,workers are not being given bigger and better “tools” (such as trucks, earth-moving equipment, and othermachines) with which to leverage their labor. Such tools require the use of energy products, both when they aremanufactured and when they are operated.
Figure 2. World Daily Per Capita Energy Consumption, based on primary energy consumption from BP StatisticalReview of World Energy and 2017 United Nations population estimates.
(c) Another “pull” on demand comes from increased investment. This investment can be debt-basedor can reflect equity investment. It is these financial assets that allow new mines to be opened, and new factoriesto be built. Thus, wages of non-elite workers can grow. McKinsey Global Institute reports that growth in total“financial assets” has slowed since 2007.
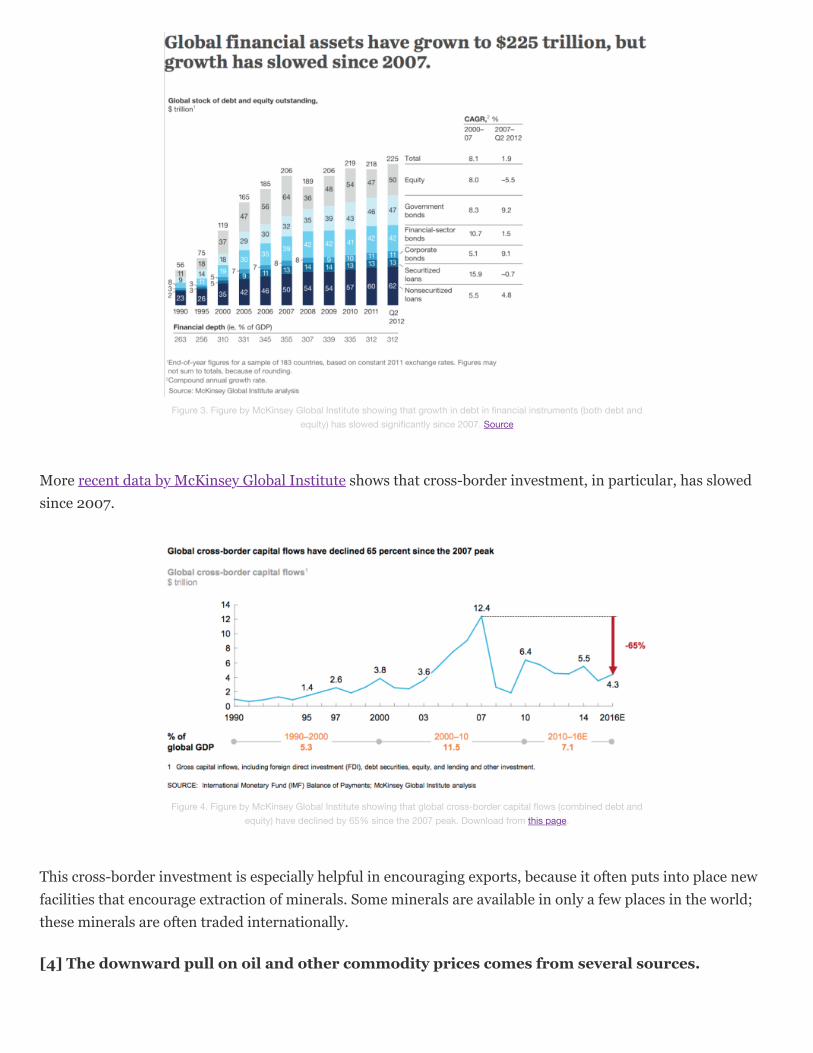
Figure 3. Figure by McKinsey Global Institute showing that growth in debt in financial instruments (both debt andequity) has slowed significantly since 2007. Source
More recent data by McKinsey Global Institute shows that cross-border investment, in particular, has slowedsince 2007.
Figure 4. Figure by McKinsey Global Institute showing that global cross-border capital flows (combined debt andequity) have declined by 65% since the 2007 peak. Download from this page.
This cross-border investment is especially helpful in encouraging exports, because it often puts into place newfacilities that encourage extraction of minerals. Some minerals are available in only a few places in the world;these minerals are often traded internationally.
[4] The downward pull on oil and other commodity prices comes from several sources.

(a) Oil exports are often essential to the countries where they are extracted because of the tax revenue and jobsthat they produce. The actual cost of extraction may be quite low, making extraction feasible, even at very lowprices. Because of the need for tax revenue and jobs, governments will often encourage production regardless ofprice, so that the country can maintain its place in the world export market until prices again rise.
(b) Everyone “knows” that oil and other commodities will be needed in the years ahead. Because of this, there isno point in stopping production altogether. In fact, the cost of production is likely to keep rising, putting anupward push on commodity prices. This belief encourages businesses to stay in the market, regardless of theeconomics.
(c) There is a long lead-time for developing new extraction capabilities. Decisions made today may affectextraction ten years from now. No one knows what the oil price will be when the new production is broughtonline. At the same time, new production is coming on-line today, based on analyses when prices were muchhigher than they are today. Furthermore, once all of the development costs have been put in place, there is nopoint in simply walking away from the investment.
(d) Storage capacity is limited. Production and needed supply must balance exactly. If there is more than atiny amount of oversupply, prices tend to plunge.
(e) The necessary price varies greatly, depending where geographically the extraction is being done, anddepending on what is included in the calculation. Costs are much lower if the calculation is done excludinginvestment to date, or excluding taxes paid to governments, or excluding necessary investments needed forpollution control. It is often easy to justify accepting a low price, because there is usually some cost basis uponwhich such a low price is acceptable.
(f) Over time, there really are efficiency gains, but it is difficult to measure how well they are working. Do these“efficiency gains” simply speed up production a bit, or do they allow more oil in total to be extracted? Also, costcuts by contractors tend to look like efficiency gains. In fact, they may simply be temporary prices cuts,reflecting the desire of suppliers to maintain some market share in a time when prices are too low for everyone.
(g) Literally, every economy in the world wants to grow. If every economy tries to grow at the same time and themarket is already saturated (given the spending power of non-elite workers), a very likely outcome is plungingprices.
[5] As we look around the world, the prices of many commodities, including oil, have fallen inrecent years.
Figures 3 and 4 show that investment spending spiked in 2007. Oil prices spiked not long after that–in the firsthalf of 2008.

Figure 5. Monthly Brent oil prices with dates of US beginning and ending QE.
Quantitative Easing (QE) is a way of encouraging investment through artificially low interest rates. US QEbegan right about when oil prices were lowest. We can see that the big 2008 spike and drop in pricescorresponds roughly to the rise and drop in investment in Figures 3 and 4, above, as well.
If we look at commodities other than oil, we often see a major downslide in prices in recent years. The timing ofthis downslide varies. In the US, natural gas prices fell as soon as gas from fracking became available, and therestarted to be a gas oversupply problem.
I expect that at least part of gas’s low price problem also comes from subsidized prices for wind and solar. Thesesubsidies lead to artificially low prices for wholesale electricity. Since electricity is a major use for natural gas,low wholesale prices for electricity indirectly tend to pull natural gas prices down.
Figure 6. Natural gas prices in the US and Canada, indexed to the 2008 price, based on annual price data provided inBP Statistical Review of World Energy, 2017.

Many people assume that fracking can be done so inexpensively that the type of downslide in prices shown inFigure 6 makes sense. In fact, the low prices available for natural gas are part of what have been pushing NorthAmerican “oil and gas” companies toward bankruptcy.
For a while, it looked like high natural gas prices in Europe and Asia might allow the US to export natural gas asLNG, and end its oversupply problem. Unfortunately, overseas prices of natural gas have slid since 2013,making the profitability of such exports doubtful (Figure 7).
Figure 7. Prices of natural gas imports to Europe and Asia, indexed to 2008 levels, based on annual average pricesprovided by BP Statistical Review of World Energy, 2017.
Coal prices have followed a downward slope of a different shape since 2008. Note that the 2016 prices rangefrom 32% to 59% below the 2008 level. They are even lower, relative to 2011 prices.
Figure 8. Prices of several types of coal, indexed to 2008 levels, based on annual average prices provided by BPStatistical Review of World Energy, 2017.

Figure 9 shows the price path for several metals and minerals. These seem to follow a downward path as well. Idid not find a price index for rare earth minerals that went back to 2008. Recent data suggested that the pricesof these minerals have been falling as well.
Figure 9. Prices of various metals and minerals, indexed to 2008, based on USGS analyses found using this link:https://minerals.usgs.gov/minerals/pubs/mcs/
Figure 9 shows that several major metals are down between 24% and 35% since 2008. The drop is even greater,relative to 2011 price levels.
Internationally traded foods have also fallen in price since 2008.
Figure 10. Food prices, indexed to 2008 levels, based on data from the United Nations’ Food and AgriculturalOrganization.

In Item [4] above, I listed several factors that would tend to make oil prices fall. These same issues could beexpected to cause the prices of these other commodities to drop. In addition, energy products are used in theproduction of metals and minerals and of foods. A drop in the price of energy products would tend to flowthrough to lower extraction prices for minerals, and lower costs for growing agricultural products and bringingproducts to market.
One surprising place where prices are dropping is in the auction prices for the output of onshore wind turbines.This is a chart shown by Roger Andrews, in a recent article on Energy Matters. The cost of making wind turbinesdoesn’t seem to be dropping dramatically, except from the fall in the prices of commodities used to make theturbines. Yet auction prices seem to be dropping by 20% or more per year.
Figure 11. Figure by Roger Andrews, showing trend in auction prices of onshore wind energy from Energy Matters.
Thus, wind energy purchased through auctions seems to be succumbing to the same deflationary market forcesas oil, natural gas, coal, many metals, and food.
[6] It is very hard to see how oil prices can rise significantly, without the prices of many othercommodities also rising.
What seems to be happening is a basic mismatch between (a) the amount of goods and services countries wantto sell, and (b) the amount of goods and services that are truly affordable by consumers, especially those whoare non-elite workers. Somehow, we need to fix this supply/demand (affordability) imbalance.
One way of raising demand is through productivity growth. As mentioned previously, such a rise in productivitygrowth hasn’t been happening in recent years. Given the falling energy per capita amounts in Figure 2, it seemsunlikely that productivity will be growing in the near future, because the adoption of improved technologyrequires energy consumption.
Another way of raising demand is through wage increases, over and above what would be indicated byproductivity growth. With globalization, the trend has been to lower and less stable wages, especially for less

educated workers. This is precisely the opposite direction of the change we need, if demand for goods andservices is to rise high enough to prevent deflation in commodity prices. There are very many of these non-eliteworkers. If their wages are low, this tends to reduce demand for homes, cars, motorcycles, and the many othergoods that depend on wages of workers in the world. It is the manufacturing and use of these goods thatinfluences demand for commodities.
Another way of increasing demand is through rising investment. This can eventually filter back to higher wages,as well. But this isn’t happening either. In fact, Figures 3 and 4 show that the last big surge in investment was in2007. Furthermore, the amount of debt growth required to increase GDP by one percentage point has increaseddramatically in recent years, both in the United States and China, making this approach to economic growthincreasingly less effective. Recent discussions seem to be in the direction of stabilizing or lowering debt levels,rather than raising them. Such changes would tend to lower new investment, not raise it.
[7] In many countries, falling export revenue is adversely affecting demand for imported goodsand services.
It is not too surprising that the export revenue of Saudi Arabia has fallen, with the drop in oil prices.
Figure 12. Saudi Arabia exports and imports of goods and services based on World Bank data.
Because of the drop in exports, Saudi Arabia is now buying fewer imported goods and services. A person wouldexpect other oil exporters also to be making cutbacks on their purchases of imported goods and services.(Exports in current US$ means exports measured year-by-year in US$, without any inflation adjustment.)
It is somewhat more surprising that China’s exports and imports are falling, as measured in US$. Figure 13shows that, in US dollar terms, China’s exports of goods and services fell in both 2015 and 2016. The importsthat China bought also fell, in both of these years.

Figure 13. China’s exports and imports of goods and services on a current US$ basis, based on World Bank data.
Similarly, both the exports and imports of India are down as well. In fact, India’s imports have fallen more thanits exports, and for a longer period–since 2012.
Figure 14. India’s exports and imports of goods and services in current dollars, based on World Bank data.
The imports of goods and services for the United States also fell in 2015 and 2016. The US is both an exporter ofcommodities (particularly food and refined petroleum products) and an importer of crude oil, so this is notsurprising.

Figure 15. US exports and imports of goods and services in US dollars, based on World Bank data.
In fact, on a world basis, exports and imports of goods and services both fell, in 2015 and 2016 as measured inUS dollars.
Figure 16. World exports and imports in current US dollars, based on World Bank data.
[8] Once export (and import) revenues are down, it becomes increasingly difficult to raise pricesagain.
If a country is not selling much of its own exports, it becomes very difficult to buy much of anyone else’s exports.This impetus, by itself, tends to keep prices of commodities, including oil, down.
Furthermore, it becomes more difficult to repay debt, especially debt that is in a currency that has appreciated.This means that borrowing additional debt becomes less and less feasible, as well. Thus, new investmentbecomes more difficult. This further tends to keep prices down. In fact, it tends to make prices fall, since new

investment is needed to keep prices level.
[9] World financial leaders in developed countries do not understand what is happening,because they have written off commodities as “unimportant” and “something that lesser-developed countries deal with.”
In the US, few consumers are concerned about the price of corn. Instead, they are interested in the price of a boxof corn flakes, or the price of corn tortillas in a restaurant.
The US, Europe and Japan specialize in high “value added” goods and services. For example, in the case of a boxof corn flakes, manufacturers are involved in many steps such as (a) making corn flakes from corn, (b) boxingcorn flakes in attractive boxes, (c) delivering those boxes to grocers’ shelves, and (d) advertising those cornflakes to prospective consumers. These costs generally do not decrease, as commodity prices decrease. Onearticle from 2009 says, “With the record seven-dollar corn this summer, the cost of the corn in an 18-ounce boxof corn flakes was only 14 cents.”
Because of the small role that commodity prices seem to play in producing the goods and services of developedcountries, it is easy for financial leaders to overlook price indications at the commodity level. (Data is availableat this level of detail; the question is how closely it is examined by decision-makers.)
Figure 17. Various indices within US CPI Urban, displayed on a basis similar to that used in Figure 7 through 11. Inother words, index values for later periods are compared to the average 2008 index value. CPI statistics are from US
Bureau of Labor Statistics.
Figure 17 shows some components of the Consumer Price Index (CPI) on a basis similar to the trends incommodity prices shown in Figures 7 through 11. The category “Household furnishings and operations” waschosen because it has furniture in it, and I know that furniture prices have fallen because of the growing use ofcheap imported furniture from China. This category shows a slight downslope in prices. The other categories allshow small increases over time. If commodity prices had not decreased, prices of the other categories wouldlikely have increased to a greater extent than they did during the period shown.

[10] Conclusion. We are likely kidding ourselves, if we think that oil prices can rise in the future,for very long, by a very large amount.
It is quite possible that oil prices will bounce back up to $80 or even $100 per barrel, for a short time. But if theyrise very high, for very long, there will be adverse impacts on other segments of the economy. We can’t expectthat wages will go up at the same time, so increases in oil prices are likely to lead to a decrease in the purchase ofdiscretionary products such as meals eaten in restaurants, charitable contributions, and vacation travel. Thesecutbacks, in turn, can be expected to lead to layoffs in discretionary sectors. Laid off workers are likely to havedifficulty repaying their loans. As a result, we are likely to head back into a recession.
As we have seen above, it is not only oil prices that need to rise; it is many other prices that need to rise as well.Making a change of this magnitude is almost certainly impossible, without “crashing” the economy.
Economists put together a simplified view of how they thought supply and demand works. This simple modelseems to work, at least reasonably well, when we are away from limits. What economists did not realize is thatthe limits we are facing are really affordability limits, and that growing affordability depends upon productivitygrowth. Productivity growth in turn depends on a growing quantity of cheap-to-produce energy supplies. Theterm “demand,” and the two-dimensional supply-demand model, hide these issues.
The whole issue of limits has not been well understood. Peak Oil enthusiasts assumed that we were “runningout” of an essential energy product. When this view was combined with the economist’s view of supply anddemand, the conclusion was, “Of course, oil prices will rise, to fix the situation.”
Few stopped to realize that there is a second way of viewing the situation. What is falling is the resources thatpeople need to have in order to have jobs that pay well. When this happens, we should expect prices to fall,rather than to rise, because workers are increasingly unable to buy the output of the economy.
If we look back at what happened historically, there have been many situations in which economieshave collapsed. In fact, this is probably what we should expect as we approach limits, rather than expectinghigh oil prices. If collapse should take place, we should expect widespread debt defaults and major problemswith the financial system. Governments are likely to have trouble collecting enough taxes, and may ultimatelyfail. Non-elite workers have historically come out badly in collapses. With low wages and high taxes, they haveoften succumbed to epidemics. We have our own epidemic now–the opioid epidemic.
Share this:
Email Print Press This Reddit Facebook 189 Twitter LinkedIn Google
Reblog Like
11 bloggers like this.

About Gail TverbergMy name is Gail Tverberg. I am an actuary interested in finite world issues - oil depletion, natural gas depletion, watershortages, and climate change. Oil limits look very different from what most expect, with high prices leading to recession, andlow prices leading to financial problems for oil producers and for oil exporting countries. We are really dealing with a physicsproblem that affects many parts of the economy at once, including wages and the financial system. I try to look at the overallproblem.View all posts by Gail Tverberg →
This entry was posted in Financial Implications and tagged collapse, exports, imports, low oil prices, peak oil, supply and demand. Bookmark the permalink.
2,280 Responses to Why Oil Prices Can’t Bounce Very High; Expect Deflation Instead
Related
Why "supply and demand" doesn't work foroil
Why oil under $30 per barrel is a majorproblem
Oil Price Slide - No Good Way Out
In "Financial Implications" In "Financial Implications"In "Financial Implications"
Fast Eddy says:September 26, 2017 at 1:32 am
Why Mr Trump can’t raise American prosperity
https://surplusenergyeconomics.wordpress.com/2017/09/05/104-why-mr-trump-cant-raise-american-prosperity/
Greg Hunter says:September 26, 2017 at 10:08 am
Excellent analysis…..I sent it to all the Wyoming Legislature along with some ideas….I was asked to remove themfrom being emailed….they were galled a citizen used the emails provided by to them for correspondence to be used toinform them of some unpleasant facts. We are screwed.
Cliffhanger says:September 26, 2017 at 1:59 am
Tax payers are footing the bill for glorification of death and destruction. Little Johnny loves Tom Brady, Tom Brady loves hiscountry and little Johnny does too. Little Johnny gets blown in half by an IED half way around the world, But atleast he gotto see THE PATRIOTS win the super bowl. Maybe they can pay Tom Brady to be a grenade launcher. Touchdown!
psile says:September 26, 2017 at 8:58 am
Too bad Puerto Rico, you’re fired!
Puerto Rico Pleads for Storm Relief; Trump Cites Debt Troubles
Puerto Rico needs immediate aid from Congress to avoid a “humanitarian crisis” after Hurricane Maria to prevent“thousands if not millions” of residents from flocking to the U.S. mainland, Governor Ricardo Rossello said Tuesday.