Why do Pharmaceutical Glass Containers Break: The ... Example: Manufacturing or Processing Root...
5
88 INTERNATIONAL PHARMACEUTICAL INDUSTRY Spring 2016 Volume 8 Issue 1 Packaging Why do Pharmaceutical Glass Containers Break: The Underestimated Power of Strength Testing and Fractography Most times in our life we use products with little understanding of how and why the packaging was selected. We usually don’t think about the design specifications of the container and its crucial role in delivering the contents safely. It is only when a problem occurs that we dig deeper into the selection criteria and science that were used to specify the packaging system. In the pharmaceutical industry, glass is by far the dominant material used for the packaging of liquid and lyophilised drugs due to its impermeability and chemical inertness for drug product stability, transparency for ease of inspection, thermal stability for flexible use and processing, low extractables and leachables, and cost. Nevertheless, glass is not considered as the perfect container because of bias versus other materials (i.e. plastic, metals) with respect to breakage resistance (strength). We all know from our personal lives that glass fails and breaks more easily than plastic, but it is very hard to quantify these properties which give us a nagging sense of uneasiness when handling glass products. Most people have had the experience of replacing a glass incandescent light bulb, gingerly unscrewing the old bulb and screwing in the new bulb with some worries about breaking the bulb. While most people never experience a bulb breakage during proper replacement, that fear is always in the back of the mind from some other unrelated glass breakage event like cracking a wine glass from a drop or impact. For applications where glass is used, unless there is some overwhelming applied force (e.g. a baseball through a window) or extensive pre-damage (e.g. scratches, chips, cracks), glass breakage resistance is significantly higher than what is required in normal use. Despite sporadic breakage events which keep alive the bias, glass packaging is still the predominant primary container for liquid or lyophilised drug products. Investigations into the root cause of glass breakage typically prove human error (i.e. too high applied force, poor processing equipment generating surface defects, manufacturing defects, improper handling) and not inherent material limitation. Glass Breakage an Industry-wide Annoyance Although glass breakage events occur at every pharmaceutical company, the methods of strength or reliability testing and fracture analysis (fractography) remain relatively unknown and severely under-utilised to determine the root cause of failure and, more importantly, make the necessary changes to reduce future occurrences. Preventing future occurrences is a focus of pharmaceutical companies and regulatory agencies like the FDA. Breakages in the field are reportable events that require clear root cause and corrective actions. Fractography is the science of analysing the macroscopic (i.e. run of cracks) and microscopic (characteristic fracture surface markings) fracture patterns (Figure 1) of cracked or broken objects, to qualitatively and semi-quantitatively determine the root cause of failure. This requires three important components: 1. an experienced and trained investigator, 2. proper equipment, and 3. patience with attention to detail. Training is usually done through a combination of coursework 1,2 , textbooks 3-6 , and steady practice. The equipment required for fractography is a capable stereomicroscope (enabling magnifications between approximately 5x to 150x), different types of illumination sources (reflecting, transmitting), sample dissection equipment like designated cutting tools, sample fixing equipment like putty or tape, specimen holder like a cup stage, tweezers or fine gripping tools, camera for documentation, and access to analytical tools like SEM-EDX for higher magnifications and, in case of foreign material or residue, identification of foreign material found in the vicinity of the fracture origins. Attention to detail and patience are crucial when dealing with samples that may contain many fragments that have to be individually examined and pieced back together, one at a time, to be able to find the root cause. The fractographic steps for determining the root cause of a breakage failure are: 1. collect as much information as possible regarding the history of the container, 2. observe, document, and interpret the macroscopic fracture patterns, 3. observe, document, and interpret the microscopic fracture patterns, 4. propose a consistent conclusion and 5. ensure the conclusion is consistent with all the data available. The success of root cause investigations depends strongly on the amount of information available to the investigator. Especially important for breakage of glass containers is: a. where was the container found, b. was the container inspected previous to this point and found to be okay, c. what materials were in contact with the container up to the point of breakage, d. what are the container manufacturing specifications (i.e. drawing, non- conformity allowances, etc.), e. is the breakage event limited to one sample or are other samples available? Figure 1: Syringe with a damage in the flange section; macroscopic (top) and microscopic (bottom) view onto the fracture surface.
Transcript of Why do Pharmaceutical Glass Containers Break: The ... Example: Manufacturing or Processing Root...

88 INTERNATIONAL PHARMACEUTICAL INDUSTRY Spring 2016 Volume 8 Issue 1
Packaging
Why do Pharmaceutical Glass Containers Break: The Underestimated Power of Strength Testing and FractographyMost times in our life we use products with little understanding of how and why the packaging was selected. We usually don’t think about the design specifications of the container and its crucial role in delivering the contents safely. It is only when a problem occurs that we dig deeper into the selection criteria and science that were used to specify the packaging system. In the pharmaceutical industry, glass is by far the dominant material used for the packaging of liquid and lyophilised drugs due to its impermeability and chemical inertness for drug product stability, transparency for ease of inspection, thermal stability for flexible use and processing, low extractables and leachables, and cost.
Nevertheless, glass is not considered as the perfect container because of bias versus other materials (i.e. plastic, metals) with respect to breakage resistance (strength). We all know from our personal lives that glass fails and breaks more easily than plastic, but it is very hard to quantify these properties which give us a nagging sense of uneasiness when handling glass products. Most people have had the experience of replacing a glass incandescent light bulb, gingerly unscrewing the old bulb and screwing in the new bulb with some worries about breaking the bulb. While most people never experience a bulb breakage during proper replacement, that fear is always in the back of the mind from some other unrelated glass breakage event like cracking a wine glass from a drop or impact. For applications where glass is used, unless there is some overwhelming applied force (e.g. a baseball through a window) or extensive pre-damage (e.g. scratches, chips, cracks), glass breakage resistance is significantly higher than what is required in normal use. Despite sporadic breakage events which keep alive the bias, glass packaging is still the predominant primary container for liquid or lyophilised drug products. Investigations into the root cause of glass breakage typically prove human error (i.e. too high applied force, poor processing equipment generating surface defects, manufacturing defects, improper handling) and not inherent material limitation.
Glass Breakage an Industry-wide AnnoyanceAlthough glass breakage events occur at every pharmaceutical company, the methods of strength or reliability testing and fracture analysis (fractography) remain relatively unknown and severely under-utilised to determine the root cause of failure and, more importantly, make the necessary changes to reduce future occurrences. Preventing future occurrences is a focus of pharmaceutical companies and regulatory agencies like the FDA. Breakages in the field are reportable events that require clear root cause and corrective actions. Fractography is the science of analysing the macroscopic (i.e. run of cracks) and microscopic (characteristic fracture surface markings) fracture patterns (Figure 1) of cracked or broken objects, to qualitatively and semi-quantitatively determine the root cause of failure. This requires three important components:
1. an experienced and trained investigator,
2. proper equipment, and 3. patience with attention to detail.
Training is usually done through a combination of coursework1,2, textbooks3-6, and steady practice. The equipment required for fractography is a capable stereomicroscope (enabling magnifications between approximately 5x to 150x), different types of illumination sources (reflecting, transmitting), sample dissection equipment like designated cutting tools, sample fixing equipment like putty or tape, specimen holder like a cup stage, tweezers or fine gripping tools, camera for documentation, and access to analytical tools like SEM-EDX for higher magnifications and, in case of foreign material or residue, identification of foreign material found in the vicinity of the fracture origins. Attention to detail and patience are crucial when dealing with samples that may contain many fragments that have to be individually examined and pieced back together, one at a time, to be able to find the root cause.
The fractographic steps for determining the root cause of a breakage failure are:
1. collect as much information as possible regarding the history of the container,
2. observe, document, and interpret the macroscopic fracture patterns,
3. observe, document, and interpret the microscopic fracture patterns,
4. propose a consistent conclusion and 5. ensure the conclusion is consistent
with all the data available.
The success of root cause investigations depends strongly on the amount of information available to the investigator. Especially important for breakage of glass containers is:
a. where was the container found, b. was the container inspected previous
to this point and found to be okay, c. what materials were in contact with
the container up to the point of breakage,
d. what are the container manufacturing specifications (i.e. drawing, non-conformity allowances, etc.),
e. is the breakage event limited to one sample or are other samples available?
Figure 1: Syringe with a damage in the flange section; macroscopic (top) and microscopic (bottom) view onto the fracture surface.
IPI_March2016.indd 88 19/04/2016 19:39:26

INTERNATIONAL PHARMACEUTICAL INDUSTRY 89www.ipimedia.com
Packaging
M a c r o s c o p i c fracture patterns (Figure 2) are the crack and crack branching patterns, visible by eye or with low magnification, which develop due to the momentary mechanical stress state (e.g. due to flexural loading, vertical loading, torsional loading, internal pressure, thermal stress).
Microscopic fracture patterns (Figure 1, bottom) are characteristic surface markings left behind on the fracture surface from the breakage event that confirm location(s) of breakage initiation, direction of breakage (e.g. outer to inner surface, vice versa), instantaneous or delayed breakage (crack propagation interrupted or stepwise), approximate applied mechanical load (only possible if particular fracture surface markings are well-developed), blunt or sharp geometry of impacting object, and slow, subcritical crack growth that leads to time-delayed catastrophic failure.
Fractography Example: Manufacturing or Processing Root CauseThe power of fractography is best shown by example. SCHOTT pharma services was contracted by a glass converter to identify the root cause of failure for a cracked cartridge that was found after filling with drug product at a pharmaceutical company. The pharmaceutical company had filed a complaint with the glass converter for compensation for delivered pieces. The cartridge is shown in Figure 3, with cracking observed near the shoulder of the cartridge. Figure 4 displays the macroscopic run of the crack. The fracture origin was determined to be
located on the inner surface along with a contamination trace, as can be seen in Figure 5. The identification of the fracture origin on the inner surface along with an observed contamination trace, combined with information from the
glass manufacturer and pharmaceutical company on contact materials to that inner surface region, resulted in the determination and confirmation that the root cause was due to contact with a washing, siliconisation or filling needle during processing at the pharmaceutical company. Thus, fractography helped to objectively prove the true circumstances for failure of the cartridge and resulted in the pharmaceutical company withdrawing the complaint. A second example came from a customer faced with odd appearance of cracks with no apparent beginning, in the barrel section of many glass syringes from a syringe lot at two repeatable positions on the
syringe (Figure 6). Upon microscopic examination, the fracture origin could not be definitively found, having been blurred or made indistinct (Figure 7). Due to the repeatable positions of the cracks,
their odd appearance, no evidence for impact, Wallner lines3,4 indicating a general direction for the fracture origin but not being able to observe it and knowledge of the syringe manufacturing process, the root cause was determined and confirmed to be due to fused cracks formed from thermal stress during the manufacturing of the syringe flange and cone regions. The result was a justified complaint and a replacement of the syringes by the container manufacturer.
Glass Strength: Misperceptions and FactsTo understand the breakage behaviour of glass, it is essential to understand some basic concepts of brittle failure: every disturbance of the three-dimensional structure of the glass (e.g. pores, inclusions, cracks or any kind of surface defects) can appear as a concentrator for mechanical loads that may occur or are applied to the glass container (e.g. mechanical loads generated by an impact during glass-to-glass contact, bending,
Figure 2: M a c r o s c o p i c crack branching pattern on a tubular glass vial.
Figure 3: Glass cartridge with cracked tip/shoulder section.
Figure 4: Macroscopic fracture pattern of a cracked cartridge; red arrows indicate the breakage propagation directions.
Figure 5: Close-up view onto the fracture origin vicinity of the cracked cartridge from Figures 3 and 4; the position of the fracture origin coincides with a contamination trace on the inner surface of the cartridge; red arrows indicate the approximate breakage propagation directions.
Figure 6: Macroscopic fracture patterns at two locations on a glass syringe; top: close to the syringe cone/shoulder section; bottom: close to the syringe flange section.
IPI_March2016.indd 89 19/04/2016 19:39:29

90 INTERNATIONAL PHARMACEUTICAL INDUSTRY Spring 2016 Volume 8 Issue 1
Packaging
thermal shock, internal or external pressure, vertical load during capping). The magnitude of this load multiplication significantly depends on the position, size and the shape of the disturbance, as well as on the magnitude of the mechanical load. There may be disturbances which act as weak multiplier of applied stresses. Such disturbances can be considered as rather uncritical. On the other hand, there may be also disturbances which act as strong multipliers, which then have to be considered as critical. Now, if the combination of applied mechanical load and criticality of the disturbance reaches or exceeds a particular limit, glass breakage will occur originating from this location. This limit is a material constant and can be thought of as a measure of the “toughness” against breakage (it is actually called “fracture toughness”7). Thus glass breakage can be expressed as the simple equation:
GLASS BREAKAGE OCCURS WHEN LOAD x CRITICALITY ≥ TOUGHNESS
If none or only one of the two conditions are present (i.e. existence of a critical disturbance but no mechanical load, or mechanical load at positions without disturbances), glass will not break. As a consequence of this fundamental equation of brittle failure, the strength property of glass is not constant, but rather a
projection of its surface quality defined by the criticality of disturbances within its structure. It is then easy to understand that a high surface quality results in a high strength because, according to the equation above, a low criticality allows a high amount of applied mechanical loads until the load multiplication reaches the toughness limit. On the other hand, a low surface quality (equal to flaws or defects of high criticality) results in a low strength because a high criticality allows only a low amount of applied mechanical loads, until the load multiplication reaches the toughness limit. In this context, it has to be admitted that every glass surface contains flaws. Or, in other words, a perfect glass surface without any flaws does not exist. Each handling or processing step may introduce further surface flaws or may enlarge pre-existing ones, which can result in a reduction of the overall strength of the glass. Furthermore, as each individual glass object exhibits a unique surface flaw structure, its resulting strength is also represented by an individual value. As a consequence, a collection of strength values results in a statistical distribution. It is the shape of this statistical distribution which finally can be considered as a representative quantification of the strength of a collection of tested samples. So, as another important fact,
“THE STRENGTH OF A POPULATION OF GLASS CONTAINERS CAN BE CONSIDERED AS A PROJECTION OF ITS SURFACE QUALITY AND WHICH HAS TO BE DESCRIBED BY A STATISTICAL DISTRIBUTION.”
Such a strength distribution cannot be regarded as being stable, as there are numerous incidences during the lifetime of glass containers which can affect the surface quality of the glass. For instance, for a running production of pharmaceutical products, many process steps are conducted which lower the strength of the primary packaging material due to known or unknown and uncontrolled damages. Typical candidates are static glass-to-glass contacts in accumulation tables, dynamic glass-to-glass contacts due to sudden stops (impacts) at the end of conveying belts, glass-to-metal contacts with parts unintentionally protruding into the conveying path of containers. Without any knowledge of the strength, batches of low quality might enter the field, and complaints about broken containers
may arise, resulting in undesirable consequences such as quarantine of batches, production line shutdown, root cause and corrective action reporting to the FDA. It is an undeniable fact that glass containers normally have much more than sufficient strength for pharmaceutical packaging applications. This is proven billions of time per year, yet while the de-risking mantra of requiring zero container breakage is a worthy goal, the fracture statistics can help to reduce the gap to reality. A good risk management strategy thus would be to regularly test these strength distributions to determine the risk of breakage for each production batch, to keep the risk as low as possible of low-strength containers reaching the market. The determination of the statistical strength distribution of a particular batch of glass containers is the main purpose of such strength investigations. There are myriad challenges confronting pharmaceutical companies when they need to investigate glass strength as part of a breakage investigation. They quickly find out glass container strength is not normally part of the specification, glass strength data per manufactured lot is not provided by the glass manufacturer, and the strength specification for processing, transportation and usage is not known by the pharmaceutical company or contract filler. Adding to the challenge is the variety of strength testing methods available (and needed) to appropriately determine the strength of a given lot of glass.
An important factor for the right test method is to mimic the mechanical stress under the application conditions as realistically as possible. Burst pressure testing is appropriate for assessing container strength during lyophilisation and as a general smart method to find the weakest point on the interior or exterior surface of a container. Axial compression testing is appropriate for assessing container strength during stoppering, shipping, and storage. Side compression testing is appropriate for assessing container strength during processing. Bending testing is appropriate for assessing the syringe cone during needle attachment, tip cap removal, and injection. Impact testing is appropriate for assessing container resistance to impact damage. All these destructive tests are designed to determine the location of the fracture origin (i.e. the “weakest” point of the container for a particular load situation). Therefore, strength testing with
Figure 7: Microscopic fracture patterns of two cracked glass syringes (cf. Figure 6).
IPI_March2016.indd 90 19/04/2016 19:39:32
INTERNATIONAL PHARMACEUTICAL INDUSTRY 91www.ipimedia.com
Packaging
subsequent fractographic investigation to determine the location of the fracture origin is a very powerful combination to determine the strength of a given sample set, the location of the fracture origin, and assess if the observed strength is “normal” or lowered due to a discontinuity or non-conformity. While some industrial standards are established for testing the strength of glass containers (primarily coming from the food/beverage industries)8-10, a few ISO standards have recently been released for prefilled glass syringes11, but none are in force from the major pharmacopeia regulatory bodies (USP12, EP13, JP14).
Due to these complexities and the low overall incident rate of glass breakage, the strategy of the pharmaceutical industry today is to forgo strength testing and to assess the criticality of surface flaws/non-conformities (i.e. risk of glass breakage) by using optical/visual inspection with defect manuals. Industry standard defect manuals are available, for instance, from the PDA15, Edito Cantor Verlag16, and the glass manufacturers17. There are numerous non-conformities (scuffs, bruises, checks, cracks, etc.) which classify the criticality with respect to strength and integrity by their visual appearance, mostly by the largest lateral dimension (length, diameter). The danger in this approach is that defect manuals are designed for cosmetic assessment of containers, and the categorisation of non-conformities (disturbances) just by their lateral dimensions cannot provide an assessment to the criticality with respect to container strength, because optical and visual inspection cannot provide the full information required to assess the criticality of a disturbance in terms of strength (e.g. depth, shape, three-dimensional geometry). So judging the criticality of disturbances in terms of strength solely from their optical appearance can lead to misinterpretation, with disastrous consequences: Disturbances of small lateral dimensions might get classified as uncritical, but due to their shape they can turn out to be critical and might lead to breakage in the field. On the other hand, disturbances of large lateral dimensions might get classified as critical, but because of their shape are uncritical. Such batches might then erroneously get rejected or even be destroyed unnecessarily. Appropriate strength testing strategies routinely implemented into production processes can help to lower the risk of
both incidences. The following examples show the usefulness of strength testing to determine the strength of glass containers and answer a variety of questions.
SCHOTT pharma services was contracted by a client who was filling a product for clinical trial into vials and during post-fill inspection found approximately 20% of the lot had chatter marks / “scuffs” of varying size which were detected by visual inspection after processing. According to the PDA TR #43 cosmetic defect manual15, a scuff defect is “Minor” or “N/A”. The pharmaceutical company was concerned about risk of breakage at the clinic and contracted strength testing to be done to assess the strength criticality of the scuffs and whether or not the scuffed containers could be safely used or if new material would have to be made. Burst pressure testing was done on 100 samples featuring scuffs, 92 samples without scuffs, and 43 control samples (vials processed but taken out after depyrogenisation). As shown in Figure 8, a graph of breaking pressure on the y-axis versus the number of samples broken on the x-axis showed quite similar distributions, with even a little higher strength for the vials featuring scuffs compared to vials without scuffs. This difference in strength
was mathematically determined to be statistically significant. Additionally, a fractographic examination on every broken sample from the rejected lot revealed that not a single fracture origin coincided with a scuff. This means that while scuffs indeed represent a cosmetic defect, in this particular case they were proven not to decrease the container strength compared to containers without scuffs. The higher strength of the rejected containers was supposed to result from normal variations of the container hot
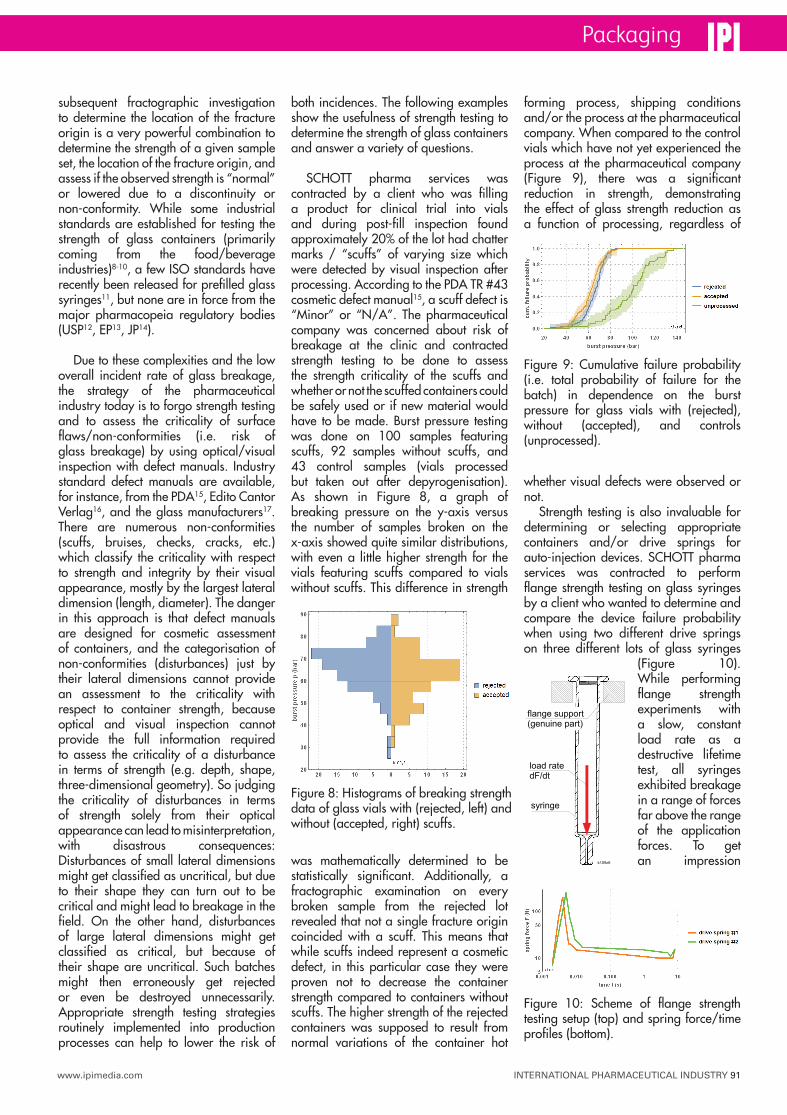
forming process, shipping conditions and/or the process at the pharmaceutical company. When compared to the control vials which have not yet experienced the process at the pharmaceutical company (Figure 9), there was a significant reduction in strength, demonstrating the effect of glass strength reduction as a function of processing, regardless of
whether visual defects were observed or not.
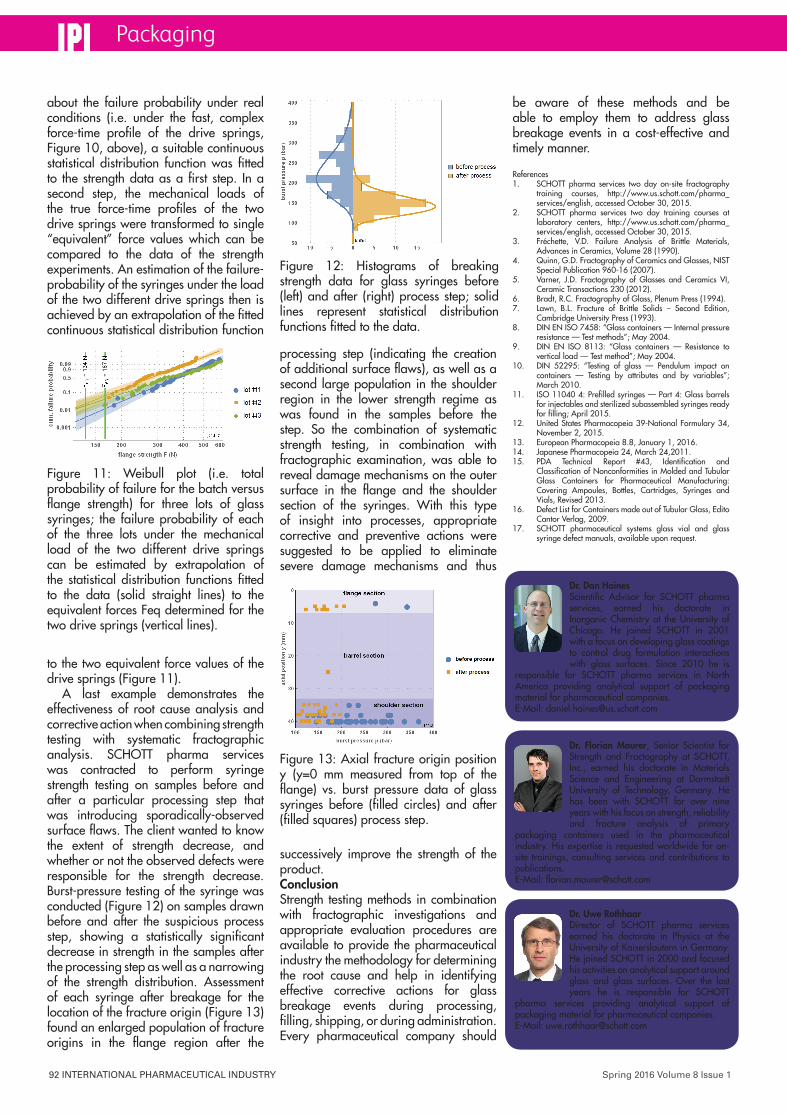
Strength testing is also invaluable for determining or selecting appropriate containers and/or drive springs for auto-injection devices. SCHOTT pharma services was contracted to perform flange strength testing on glass syringes by a client who wanted to determine and compare the device failure probability when using two different drive springs on three different lots of glass syringes
(Figure 10). While performing flange strength experiments with a slow, constant load rate as a destructive lifetime test, all syringes exhibited breakage in a range of forces far above the range of the application forces. To get an impression
Figure 8: Histograms of breaking strength data of glass vials with (rejected, left) and without (accepted, right) scuffs.
Figure 9: Cumulative failure probability (i.e. total probability of failure for the batch) in dependence on the burst pressure for glass vials with (rejected), without (accepted), and controls (unprocessed).
k109z6
load ratedF/dt
flange support(genuine part)
syringe
Figure 10: Scheme of flange strength testing setup (top) and spring force/time profiles (bottom).
IPI_March2016.indd 91 19/04/2016 19:39:35
92 INTERNATIONAL PHARMACEUTICAL INDUSTRY Spring 2016 Volume 8 Issue 1
Packaging
about the failure probability under real conditions (i.e. under the fast, complex force-time profile of the drive springs, Figure 10, above), a suitable continuous statistical distribution function was fitted to the strength data as a first step. In a second step, the mechanical loads of the true force-time profiles of the two drive springs were transformed to single “equivalent” force values which can be compared to the data of the strength experiments. An estimation of the failure-probability of the syringes under the load of the two different drive springs then is achieved by an extrapolation of the fitted continuous statistical distribution function
to the two equivalent force values of the drive springs (Figure 11).
A last example demonstrates the effectiveness of root cause analysis and corrective action when combining strength testing with systematic fractographic analysis. SCHOTT pharma services was contracted to perform syringe strength testing on samples before and after a particular processing step that was introducing sporadically-observed surface flaws. The client wanted to know the extent of strength decrease, and whether or not the observed defects were responsible for the strength decrease. Burst-pressure testing of the syringe was conducted (Figure 12) on samples drawn before and after the suspicious process step, showing a statistically significant decrease in strength in the samples after the processing step as well as a narrowing of the strength distribution. Assessment of each syringe after breakage for the location of the fracture origin (Figure 13) found an enlarged population of fracture origins in the flange region after the
processing step (indicating the creation of additional surface flaws), as well as a second large population in the shoulder region in the lower strength regime as was found in the samples before the step. So the combination of systematic strength testing, in combination with fractographic examination, was able to reveal damage mechanisms on the outer surface in the flange and the shoulder section of the syringes. With this type of insight into processes, appropriate corrective and preventive actions were suggested to be applied to eliminate severe damage mechanisms and thus
successively improve the strength of the product.ConclusionStrength testing methods in combination with fractographic investigations and appropriate evaluation procedures are available to provide the pharmaceutical industry the methodology for determining the root cause and help in identifying effective corrective actions for glass breakage events during processing, filling, shipping, or during administration. Every pharmaceutical company should
be aware of these methods and be able to employ them to address glass breakage events in a cost-effective and timely manner.
References1. SCHOTT pharma services two day on-site fractography
training courses, http://www.us.schott.com/pharma_services/english, accessed October 30, 2015.
2. SCHOTT pharma services two day training courses at laboratory centers, http://www.us.schott.com/pharma_services/english, accessed October 30, 2015.
3. Fréchette, V.D. Failure Analysis of Brittle Materials, Advances in Ceramics, Volume 28 (1990).
4. Quinn, G.D. Fractography of Ceramics and Glasses, NIST Special Publication 960-16 (2007).
5. Varner, J.D. Fractography of Glasses and Ceramics VI, Ceramic Transactions 230 (2012).
6. Bradt, R.C. Fractography of Glass, Plenum Press (1994).7. Lawn, B.L. Fracture of Brittle Solids – Second Edition,
Cambridge University Press (1993).8. DIN EN ISO 7458: “Glass containers — Internal pressure
resistance — Test methods”; May 2004.9. DIN EN ISO 8113: “Glass containers — Resistance to
vertical load — Test method”; May 2004.10. DIN 52295: “Testing of glass — Pendulum impact on
containers — Testing by attributes and by variables”; March 2010.
11. ISO 11040 4: Prefilled syringes — Part 4: Glass barrels for injectables and sterilized subassembled syringes ready for filling; April 2015.
12. United States Pharmacopeia 39-National Formulary 34, November 2, 2015.
13. European Pharmacopeia 8.8, January 1, 2016.14. Japanese Pharmacopeia 24, March 24,2011.15. PDA Technical Report #43, Identification and
Classification of Nonconformities in Molded and Tubular Glass Containers for Pharmaceutical Manufacturing: Covering Ampoules, Bottles, Cartridges, Syringes and Vials, Revised 2013.
16. Defect List for Containers made out of Tubular Glass, Edito Cantor Verlag, 2009.
17. SCHOTT pharmaceutical systems glass vial and glass syringe defect manuals, available upon request.
Figure 11: Weibull plot (i.e. total probability of failure for the batch versus flange strength) for three lots of glass syringes; the failure probability of each of the three lots under the mechanical load of the two different drive springs can be estimated by extrapolation of the statistical distribution functions fitted to the data (solid straight lines) to the equivalent forces Feq determined for the two drive springs (vertical lines).
Figure 12: Histograms of breaking strength data for glass syringes before (left) and after (right) process step; solid lines represent statistical distribution functions fitted to the data.
Figure 13: Axial fracture origin position y (y=0 mm measured from top of the flange) vs. burst pressure data of glass syringes before (filled circles) and after (filled squares) process step.
Dr. Florian Maurer, Senior Scientist for Strength and Fractography at SCHOTT, Inc., earned his doctorate in Materials Science and Engineering at Darmstadt University of Technology, Germany. He has been with SCHOTT for over nine years with his focus on strength, reliability and fracture analysis of primary
packaging containers used in the pharmaceutical industry. His expertise is requested worldwide for on-site trainings, consulting services and contributions to publications. E-Mail: [email protected]
Dr. Dan Haines Scientific Advisor for SCHOTT pharma services, earned his doctorate in Inorganic Chemistry at the University of Chicago. He joined SCHOTT in 2001 with a focus on developing glass coatings to control drug formulation interactions with glass surfaces. Since 2010 he is
responsible for SCHOTT pharma services in North America providing analytical support of packaging material for pharmaceutical companies. E-Mail: [email protected]
Dr. Uwe Rothhaar Director of SCHOTT pharma services earned his doctorate in Physics at the University of Kaiserslautern in Germany. He joined SCHOTT in 2000 and focused his activities on analytical support around glass and glass surfaces. Over the last years he is responsible for SCHOTT
pharma services providing analytical support of packaging material for pharmaceutical companies. E-Mail: [email protected]
IPI_March2016.indd 92 19/04/2016 19:39:38