
Why Checkins: Exploring User Motivation on Location Based...
19
Why Checkins: Exploring User Motivation on Location Based Social Networks Fengjiao Wang 1 Guan Wang 1 Philip S. Yu 1,2 1 Department of Computer Science, University of Illinois at Chicago 2 Computer Science Department , King Abdulaziz University
Transcript of Why Checkins: Exploring User Motivation on Location Based...

Why Checkins: Exploring User Motivation on Location Based Social Networks
FengjiaoWang1GuanWang1PhilipS.Yu1,21DepartmentofComputerScience,UniversityofIllinoisatChicago
2ComputerScienceDepartment,KingAbdulazizUniversity
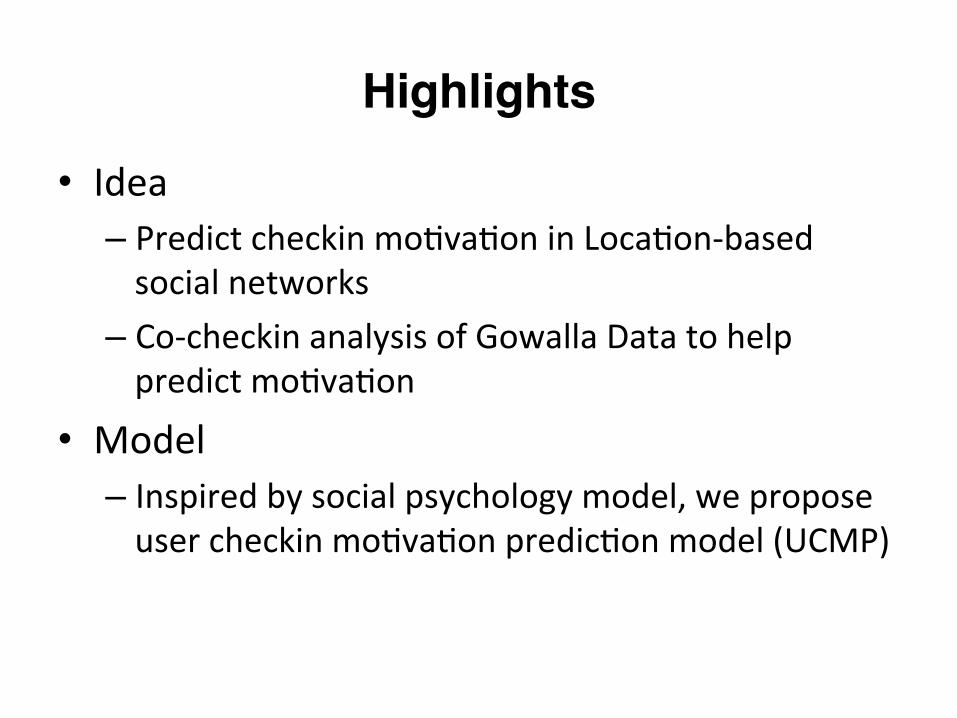
Highlights
• Idea– PredictcheckinmoIvaIoninLocaIon-basedsocialnetworks
– Co-checkinanalysisofGowallaDatatohelppredictmoIvaIon
• Model– Inspiredbysocialpsychologymodel,weproposeusercheckinmoIvaIonpredicIonmodel(UCMP)

Outline
• MoIvaIon• Co-checkinanalysisofgowalladata• Model• Experiment• Conclusion

Location-based social network

Location predictionphone company for billing purpose, recording the user in acell when he uses his phone. From the combination of theempirically measured entropy and the Fano’s inequality, theauthors conclude the human mobility can be predicted witha probability of success of 93% on average.
3. Extended Mobility Markov Chain
In this section, we briefly review the concept of mobilityMarkov chains that consider only the current location topredict the next one before extending this concept to takeinto account the n previous locations visited (for n � 1). Wecoin this extended mobility Markov chain as a n-MMC. Wealso describe an algorithm for learning a n-MMC, which isa variant of the algorithm described in [5], to which somememory has been added to learn the previous n locationsvisited.
3.1 Mobility Markov Chain
A Mobility Markov Chain (MMC) [5] models the mobilitybehavior of an individual as a discrete stochastic processin which the probability of moving to a state (i.e, POI)depends only on the previous visited state and the probabilitydistribution of the transitions between states. More precisely,a MMC is composed of:
• A set of states P = {p1, . . . pk}, in which each state cor-responds to a frequent POI (ranked by decreasing orderof importance). These states generally have an intrinsicsemantic meaning and therefore semantic labels such as“home” or “work” can often be attached to them. Thesemantics of some states can sometimes be deduced au-tomatically from the structure of the MMC.
• A set of transitions, such as ti,j
, which represents theprobability of moving from state p
i
to state pj
. A transi-tion from one state to itself can occur if the individual hasa probability of moving from one state to an occasionallocation before coming back to this state. For instance,an individual can leave his “home” to go to the pharmacybefore coming back to “home”.
A MMC can be represented either as graph (see Figure 1)or a transition matrix. In the graph representation, nodes rep-resent POIs while arrows symbolize the transitions betweenPOIs along with the associated probability of performingthis transition. In the matrix representation, the row corre-sponds to the POI of origin and the column the destinationPOI. The value stored in the cell is the probability of theassociated transition.
Standard MMCs are memoryless in the sense that the pre-diction of the future location depends only on the currentlocation. However, this limitation in which the MMC “for-gets” the previous locations visited before reaching the cur-rent state can impact negatively the accuracy of the predic-tion. To address this issue, we introduce the concept of an-MMC, which is a MMC in which the states do not corre-
Figure 1. Example of a n-MMC with n = 1.
spond only to a single POI, but rather represent the sequenceof the n previous visited POIs.
3.2 Learning a n-MMC
Thereafter, we describe an algorithm for learning a n-MMCout of the trail of mobility traces of an individual, which isdecomposed in two steps. During the first step, a clusteringalgorithm called Density-Joinable cluster (DJ-Cluster) [16]is used to discover the POIs (Algorithm 1). Afterwards,during the second step, the transitions between those POIsare computed. DJ-Cluster takes as input three parameters:MinPts the minimal number of points necessary to forma cluster, ✏ the maximum radius of the cluster and d
mer
amerging distance for clusters.
DJ-Cluster is itself decomposed into three phases. Dur-ing the first phase (preprocessing) only the “static” mobilitytraces (i.e., traces whose speed �, for � a small predefinedpositive constant) are kept by deleting all traces in move-ment (i.e., with speed > �), and then consequently redun-dant traces are also removed. The second phase (clustering)consists in processing all remaining traces in order to con-struct clusters containing at least MinPts points within aradius ✏ of their centers. Once these clusters are computed,during the third and last phase (merging), the algorithmmerges the clusters sharing at least a common trace, whichcan lead to the creation of clusters of arbitrary shape. Forexample, given two clusters C1 = {m1,m3,m7,m9} andC2 = {m9,m11,m12}, we first verify that their intersectionis not null, which is the case here as C1\C2 = {m9}. Theseclusters are then merged into a single cluster composed oftheir union C1 [ C2 = {m1,m3,m7,m9,m11,m12}. Fi-nally, the resulting clusters whose centroids are within d
mer
distance are also merged.

Location-based advertisement

Gowalla Dataset
• 196,591users• 950,327friendlinks• 6,442,890checkins(fromFeb2009toOct2010)
• 30367locaIoninformaIon

Co-checkin analysis of Gowalla Dataset
• Co-checkin– UserandhisfriendcheckinatthesamelocaIonwithinashortperiod
0 0.2 0.4 0.6 0.8 10
1
2
3
4
5
6
7
x 104
Fraction of co−checkin
Use
r n
um
be
rs
(a) statistics of co-checkin information0 50 100 150 200 250 300 350 400 450 500 1000 1500 2000 2500
0
0.1
0.2
0.3
0.4
0.5
0.6
0.7
0.8
Number of checkins
Use
r pro
port
ion
Users’ total co−checkins larger than 100
(b) total co-checkin larger than 100
0 50 100 150 200 250 300 350 400 450 500 1000 1500 2000 25000
0.01
0.02
0.03
0.04
0.05
0.06
Number of checkins
Use
r pro
port
ion
Users’ proportion of co−checkins larger than 60%
(c) co-checkin percentage larger than 60%
50 100 150 200 250 300 350 400 450 500 1000 1500 2000 25000
0.5
1
1.5
2x 10
4
Number of checkins
Num
ber
of users
Zero co−checkin distribution
(d) zero co-checkin distribution
0 50 100 150 200 250 300 350 400 450 500 1000 1500 2000 25000
0.2
0.4
0.6
0.8
1
Number of checkins
Use
r pro
port
ion
Users’ total co−checkins smaller than 50
(e) total co-checkin smaller than 50
0 50 100 150 200 250 300 350 400 450 500 1000 1500 2000 25000
0.1
0.2
0.3
0.4
0.5
0.6
0.7
0.8
Number of checkins
Use
r pro
port
ion
Users’ proportion of co−checkins smaller than 10%
(f) co-checkin percentage smaller than 10%
Fig. 1: Co-checkin analysis
Attitudes
Subjective norms
Desires
PerceivedBehaviorControl
Intentions Behaviour
Fig. 2: Simplified model of goal-directed behavior
the set of |U | = M users, F ⇢ U ⇥ U is the set of linksrepresenting friend relationship between users, L is the set of|L| = N locations, and C ⇢ U ⇥ L ⇥ T ⇥ M is the setof check-in tuples. Each check-in tuple ci is represented asci = (uj , lk, t,mi), which means user uj check in at locationlk at time t with motivation mi. The motivation prediction taskis to use the information in the location-based social networkG to predict each check-in ci’s motivation mi.
B. Model of goal-directed behavior and its interpretation
Behavior modeling problem has been studied for a longtime in social psychology field. MGB model is a model ofpurposive behavior which introduce desires (motivation) as anew variable, because desires are shown to play an importantrole in decision-making. The MGB model suggest that: desiresare the proximal causes of intentions; desires also transform themotivational content to act embedded in behavioral attitudes(BA), subjective norms (SN) and perceived behavior control(PBC) (Figure 2). It provides us a structure that links differentsocial psychology concepts, and can be utilized to predictmotivation. However, the model can’t be directly utilized incheckin scenario because it was used to handle very smalldataset (e.g. survey data). Therefore, we want to design acomputational model which contains such a structure and alsoapplicable to large scale dataset. Before we go to details of thecomputational model, we need to map the social psychologyconcepts to checkin scenario firstly.
Definition 3.1 (Behavioral Attitudes (BA)): Anindividual’s positive or negative evaluation of self-performanceof the particular behavior is called behavioral attitude.
In one word, behavior attitude means an individual’s atti-tude toward the particular behavior. In the checkin scenario, it
means that whether the user like to check in the place or not.We assume that there are two motivations (social motivationand individual motivation) with regards to checkin behavior.In the MGB model, motivation transform the motivationalcontent embedded in BA, SN, PBS to act. Since there aretwo motivations, we extract two set of motivational contentsfrom all predictors (BA, SN, PBC). For the social motivation,behavior attitude (denoted by ↵0
uj) means that whether the user
(uj) like checking in places for the purpose of interacting withhis friends. For the individual motivation, behavior attitude(denoted by ↵1
uj) means that whether the user (uj) like
checking in places attracted by the location.
Definition 3.2 (Subjective Norm (SN)): An individual’sperception of social normative pressures, or relevant others’beliefs that he or she should or should not perform suchbehavior is called subjective norm.
Subjective Norm means the pressure that the individualreceived from his/her friends. In our cases, subjective norm(denoted by �lk
uj) means that whether user (uj) feel external
pressures or receive influences from his friends to check in theplace (lk).
Definition 3.3 (Perceived Behavioral control (PBC)): Anindividual’s perceived ease or difficulty of performing theparticular behavior is called perceived behavior control.
Perceived behavior control is the feeling of individual aboutthe difficulty of performing the particular behavior. There canbe many different difficulties, for example difficulty of em-ploying a particular app, networking issue, cost and restrictionof location. For the checkin information, the restriction oflocation is the one we can measure. Perceived behavior controlin our scenario means that whether the place is suitable for usercheck in with different purposes. It also contains two factors:for social motivation we use perceived behavior control (�0
lk)
to indicate whether the place (lk) is suitable for social purposecheckin; for individual motivation, we use perceived behaviorcontrol (�1
lk) to indicate whether the place (lk) is suitable for
individual purpose checkin.
Definition 3.4 (Desires): An individual’s reason for per-forming the particular action is called Desires. Desires (de-

Co-checkin analysis of Gowalla Dataset
0 0.2 0.4 0.6 0.8 10
1
2
3
4
5
6
7
x 104
Fraction of co−checkin
User
num
bers
(a) statistics of co-checkin information0 50 100 150 200 250 300 350 400 450 500 1000 1500 2000 2500
0
0.1
0.2
0.3
0.4
0.5
0.6
0.7
0.8
Number of checkinsU
ser
pro
port
ion
Users’ total co−checkins larger than 100
(b) total co-checkin larger than 100
0 50 100 150 200 250 300 350 400 450 500 1000 1500 2000 25000
0.01
0.02
0.03
0.04
0.05
0.06
Number of checkins
Use
r p
rop
ort
ion
Users’ proportion of co−checkins larger than 60%
(c) co-checkin percentage larger than 60%
50 100 150 200 250 300 350 400 450 500 1000 1500 2000 25000
0.5
1
1.5
2x 10
4
Number of checkins
Num
ber
of users
Zero co−checkin distribution
(d) zero co-checkin distribution
0 50 100 150 200 250 300 350 400 450 500 1000 1500 2000 25000
0.2
0.4
0.6
0.8
1
Number of checkins
Use
r pro
port
ion
Users’ total co−checkins smaller than 50
(e) total co-checkin smaller than 50
0 50 100 150 200 250 300 350 400 450 500 1000 1500 2000 25000
0.1
0.2
0.3
0.4
0.5
0.6
0.7
0.8
Number of checkins
Use
r p
rop
ort
ion
Users’ proportion of co−checkins smaller than 10%
(f) co-checkin percentage smaller than 10%
Fig. 1: Co-checkin analysis
Attitudes
Subjective norms
Desires
PerceivedBehaviorControl
Intentions Behaviour
Fig. 2: Simplified model of goal-directed behavior
the set of |U | = M users, F ⇢ U ⇥ U is the set of linksrepresenting friend relationship between users, L is the set of|L| = N locations, and C ⇢ U ⇥ L ⇥ T ⇥ M is the setof check-in tuples. Each check-in tuple ci is represented asci = (uj , lk, t,mi), which means user uj check in at locationlk at time t with motivation mi. The motivation prediction taskis to use the information in the location-based social networkG to predict each check-in ci’s motivation mi.
B. Model of goal-directed behavior and its interpretation
Behavior modeling problem has been studied for a longtime in social psychology field. MGB model is a model ofpurposive behavior which introduce desires (motivation) as anew variable, because desires are shown to play an importantrole in decision-making. The MGB model suggest that: desiresare the proximal causes of intentions; desires also transform themotivational content to act embedded in behavioral attitudes(BA), subjective norms (SN) and perceived behavior control(PBC) (Figure 2). It provides us a structure that links differentsocial psychology concepts, and can be utilized to predictmotivation. However, the model can’t be directly utilized incheckin scenario because it was used to handle very smalldataset (e.g. survey data). Therefore, we want to design acomputational model which contains such a structure and alsoapplicable to large scale dataset. Before we go to details of thecomputational model, we need to map the social psychologyconcepts to checkin scenario firstly.
Definition 3.1 (Behavioral Attitudes (BA)): Anindividual’s positive or negative evaluation of self-performanceof the particular behavior is called behavioral attitude.
In one word, behavior attitude means an individual’s atti-tude toward the particular behavior. In the checkin scenario, it
means that whether the user like to check in the place or not.We assume that there are two motivations (social motivationand individual motivation) with regards to checkin behavior.In the MGB model, motivation transform the motivationalcontent embedded in BA, SN, PBS to act. Since there aretwo motivations, we extract two set of motivational contentsfrom all predictors (BA, SN, PBC). For the social motivation,behavior attitude (denoted by ↵0
uj) means that whether the user
(uj) like checking in places for the purpose of interacting withhis friends. For the individual motivation, behavior attitude(denoted by ↵1
uj) means that whether the user (uj) like
checking in places attracted by the location.
Definition 3.2 (Subjective Norm (SN)): An individual’sperception of social normative pressures, or relevant others’beliefs that he or she should or should not perform suchbehavior is called subjective norm.
Subjective Norm means the pressure that the individualreceived from his/her friends. In our cases, subjective norm(denoted by �lk
uj) means that whether user (uj) feel external
pressures or receive influences from his friends to check in theplace (lk).
Definition 3.3 (Perceived Behavioral control (PBC)): Anindividual’s perceived ease or difficulty of performing theparticular behavior is called perceived behavior control.
Perceived behavior control is the feeling of individual aboutthe difficulty of performing the particular behavior. There canbe many different difficulties, for example difficulty of em-ploying a particular app, networking issue, cost and restrictionof location. For the checkin information, the restriction oflocation is the one we can measure. Perceived behavior controlin our scenario means that whether the place is suitable for usercheck in with different purposes. It also contains two factors:for social motivation we use perceived behavior control (�0
lk)
to indicate whether the place (lk) is suitable for social purposecheckin; for individual motivation, we use perceived behaviorcontrol (�1
lk) to indicate whether the place (lk) is suitable for
individual purpose checkin.
Definition 3.4 (Desires): An individual’s reason for per-forming the particular action is called Desires. Desires (de-

Co-checkin analysis of Gowalla Dataset
0 0.2 0.4 0.6 0.8 10
1
2
3
4
5
6
7
x 104
Fraction of co−checkin
Use
r n
um
be
rs
(a) statistics of co-checkin information0 50 100 150 200 250 300 350 400 450 500 1000 1500 2000 2500
0
0.1
0.2
0.3
0.4
0.5
0.6
0.7
0.8
Number of checkins
Use
r p
rop
ort
ion
Users’ total co−checkins larger than 100
(b) total co-checkin larger than 100
0 50 100 150 200 250 300 350 400 450 500 1000 1500 2000 25000
0.01
0.02
0.03
0.04
0.05
0.06
Number of checkins
Use
r p
rop
ort
ion
Users’ proportion of co−checkins larger than 60%
(c) co-checkin percentage larger than 60%
50 100 150 200 250 300 350 400 450 500 1000 1500 2000 25000
0.5
1
1.5
2x 10
4
Number of checkins
Nu
mb
er
of
use
rs
Zero co−checkin distribution
(d) zero co-checkin distribution
0 50 100 150 200 250 300 350 400 450 500 1000 1500 2000 25000
0.2
0.4
0.6
0.8
1
Number of checkins
Use
r p
rop
ort
ion
Users’ total co−checkins smaller than 50
(e) total co-checkin smaller than 50
0 50 100 150 200 250 300 350 400 450 500 1000 1500 2000 25000
0.1
0.2
0.3
0.4
0.5
0.6
0.7
0.8
Number of checkins
Use
r p
rop
ort
ion
Users’ proportion of co−checkins smaller than 10%
(f) co-checkin percentage smaller than 10%
Fig. 1: Co-checkin analysis
Attitudes
Subjective norms
Desires
PerceivedBehaviorControl
Intentions Behaviour
Fig. 2: Simplified model of goal-directed behavior
the set of |U | = M users, F ⇢ U ⇥ U is the set of linksrepresenting friend relationship between users, L is the set of|L| = N locations, and C ⇢ U ⇥ L ⇥ T ⇥ M is the setof check-in tuples. Each check-in tuple ci is represented asci = (uj , lk, t,mi), which means user uj check in at locationlk at time t with motivation mi. The motivation prediction taskis to use the information in the location-based social networkG to predict each check-in ci’s motivation mi.
B. Model of goal-directed behavior and its interpretation
Behavior modeling problem has been studied for a longtime in social psychology field. MGB model is a model ofpurposive behavior which introduce desires (motivation) as anew variable, because desires are shown to play an importantrole in decision-making. The MGB model suggest that: desiresare the proximal causes of intentions; desires also transform themotivational content to act embedded in behavioral attitudes(BA), subjective norms (SN) and perceived behavior control(PBC) (Figure 2). It provides us a structure that links differentsocial psychology concepts, and can be utilized to predictmotivation. However, the model can’t be directly utilized incheckin scenario because it was used to handle very smalldataset (e.g. survey data). Therefore, we want to design acomputational model which contains such a structure and alsoapplicable to large scale dataset. Before we go to details of thecomputational model, we need to map the social psychologyconcepts to checkin scenario firstly.
Definition 3.1 (Behavioral Attitudes (BA)): Anindividual’s positive or negative evaluation of self-performanceof the particular behavior is called behavioral attitude.
In one word, behavior attitude means an individual’s atti-tude toward the particular behavior. In the checkin scenario, it
means that whether the user like to check in the place or not.We assume that there are two motivations (social motivationand individual motivation) with regards to checkin behavior.In the MGB model, motivation transform the motivationalcontent embedded in BA, SN, PBS to act. Since there aretwo motivations, we extract two set of motivational contentsfrom all predictors (BA, SN, PBC). For the social motivation,behavior attitude (denoted by ↵0
uj) means that whether the user
(uj) like checking in places for the purpose of interacting withhis friends. For the individual motivation, behavior attitude(denoted by ↵1
uj) means that whether the user (uj) like
checking in places attracted by the location.
Definition 3.2 (Subjective Norm (SN)): An individual’sperception of social normative pressures, or relevant others’beliefs that he or she should or should not perform suchbehavior is called subjective norm.
Subjective Norm means the pressure that the individualreceived from his/her friends. In our cases, subjective norm(denoted by �lk
uj) means that whether user (uj) feel external
pressures or receive influences from his friends to check in theplace (lk).
Definition 3.3 (Perceived Behavioral control (PBC)): Anindividual’s perceived ease or difficulty of performing theparticular behavior is called perceived behavior control.
Perceived behavior control is the feeling of individual aboutthe difficulty of performing the particular behavior. There canbe many different difficulties, for example difficulty of em-ploying a particular app, networking issue, cost and restrictionof location. For the checkin information, the restriction oflocation is the one we can measure. Perceived behavior controlin our scenario means that whether the place is suitable for usercheck in with different purposes. It also contains two factors:for social motivation we use perceived behavior control (�0
lk)
to indicate whether the place (lk) is suitable for social purposecheckin; for individual motivation, we use perceived behaviorcontrol (�1
lk) to indicate whether the place (lk) is suitable for
individual purpose checkin.
Definition 3.4 (Desires): An individual’s reason for per-forming the particular action is called Desires. Desires (de-

Social psychology model
0 0.2 0.4 0.6 0.8 10
1
2
3
4
5
6
7
x 104
Fraction of co−checkin
Use
r n
um
be
rs
(a) statistics of co-checkin information0 50 100 150 200 250 300 350 400 450 500 1000 1500 2000 2500
0
0.1
0.2
0.3
0.4
0.5
0.6
0.7
0.8
Number of checkins
Use
r p
rop
ort
ion
Users’ total co−checkins larger than 100
(b) total co-checkin larger than 100
0 50 100 150 200 250 300 350 400 450 500 1000 1500 2000 25000
0.01
0.02
0.03
0.04
0.05
0.06
Number of checkins
Use
r pro
port
ion
Users’ proportion of co−checkins larger than 60%
(c) co-checkin percentage larger than 60%
50 100 150 200 250 300 350 400 450 500 1000 1500 2000 25000
0.5
1
1.5
2x 10
4
Number of checkins
Nu
mb
er
of
use
rs
Zero co−checkin distribution
(d) zero co-checkin distribution
0 50 100 150 200 250 300 350 400 450 500 1000 1500 2000 25000
0.2
0.4
0.6
0.8
1
Number of checkins
Use
r p
rop
ort
ion
Users’ total co−checkins smaller than 50
(e) total co-checkin smaller than 50
0 50 100 150 200 250 300 350 400 450 500 1000 1500 2000 25000
0.1
0.2
0.3
0.4
0.5
0.6
0.7
0.8
Number of checkins
Use
r pro
port
ion
Users’ proportion of co−checkins smaller than 10%
(f) co-checkin percentage smaller than 10%
Fig. 1: Co-checkin analysis
Attitudes
Subjective norms
Desires
PerceivedBehaviorControl
Intentions Behaviour
Fig. 2: Simplified model of goal-directed behavior
the set of |U | = M users, F ⇢ U ⇥ U is the set of linksrepresenting friend relationship between users, L is the set of|L| = N locations, and C ⇢ U ⇥ L ⇥ T ⇥ M is the setof check-in tuples. Each check-in tuple ci is represented asci = (uj , lk, t,mi), which means user uj check in at locationlk at time t with motivation mi. The motivation prediction taskis to use the information in the location-based social networkG to predict each check-in ci’s motivation mi.
B. Model of goal-directed behavior and its interpretation
Behavior modeling problem has been studied for a longtime in social psychology field. MGB model is a model ofpurposive behavior which introduce desires (motivation) as anew variable, because desires are shown to play an importantrole in decision-making. The MGB model suggest that: desiresare the proximal causes of intentions; desires also transform themotivational content to act embedded in behavioral attitudes(BA), subjective norms (SN) and perceived behavior control(PBC) (Figure 2). It provides us a structure that links differentsocial psychology concepts, and can be utilized to predictmotivation. However, the model can’t be directly utilized incheckin scenario because it was used to handle very smalldataset (e.g. survey data). Therefore, we want to design acomputational model which contains such a structure and alsoapplicable to large scale dataset. Before we go to details of thecomputational model, we need to map the social psychologyconcepts to checkin scenario firstly.
Definition 3.1 (Behavioral Attitudes (BA)): Anindividual’s positive or negative evaluation of self-performanceof the particular behavior is called behavioral attitude.
In one word, behavior attitude means an individual’s atti-tude toward the particular behavior. In the checkin scenario, it
means that whether the user like to check in the place or not.We assume that there are two motivations (social motivationand individual motivation) with regards to checkin behavior.In the MGB model, motivation transform the motivationalcontent embedded in BA, SN, PBS to act. Since there aretwo motivations, we extract two set of motivational contentsfrom all predictors (BA, SN, PBC). For the social motivation,behavior attitude (denoted by ↵0
uj) means that whether the user
(uj) like checking in places for the purpose of interacting withhis friends. For the individual motivation, behavior attitude(denoted by ↵1
uj) means that whether the user (uj) like
checking in places attracted by the location.
Definition 3.2 (Subjective Norm (SN)): An individual’sperception of social normative pressures, or relevant others’beliefs that he or she should or should not perform suchbehavior is called subjective norm.
Subjective Norm means the pressure that the individualreceived from his/her friends. In our cases, subjective norm(denoted by �lk
uj) means that whether user (uj) feel external
pressures or receive influences from his friends to check in theplace (lk).
Definition 3.3 (Perceived Behavioral control (PBC)): Anindividual’s perceived ease or difficulty of performing theparticular behavior is called perceived behavior control.
Perceived behavior control is the feeling of individual aboutthe difficulty of performing the particular behavior. There canbe many different difficulties, for example difficulty of em-ploying a particular app, networking issue, cost and restrictionof location. For the checkin information, the restriction oflocation is the one we can measure. Perceived behavior controlin our scenario means that whether the place is suitable for usercheck in with different purposes. It also contains two factors:for social motivation we use perceived behavior control (�0
lk)
to indicate whether the place (lk) is suitable for social purposecheckin; for individual motivation, we use perceived behaviorcontrol (�1
lk) to indicate whether the place (lk) is suitable for
individual purpose checkin.
Definition 3.4 (Desires): An individual’s reason for per-forming the particular action is called Desires. Desires (de-

User checkin motivation prediction model
BA SN PBC
Desires
Intentions
Behavior
Individual Phenomenon
Social Phenomenon
Fig. 3: Prototype of UCMP model
noted by mi) are modeled as two types of motivations (socialmotivation and location motivation) that drive the checkinbehavior.
Definition 3.5 (Intentions): An indication of an individ-ual’s readiness to perform a given behavior is called intention.In our cases, it (denoted by ni) measures how likely thatdesires stimulate the behavior of check-in. In other words,intention means the possibility of user performing the checkinaction stimulated by desires (motivations).
Definition 3.6 ( Behavior): An individual’s observable re-sponse in a given situation with respect to a given target iscalled behavior. In our cases, behavior (denoted by bi) is userperformed checkin action.
Definition 3.7 (Individual Phenomenon): It testswhether the checkin is unique checkin, which means the placeis not checked by his friends and himself earlier.
Definition 3.8 (Social Phenomenon): It tests whether thecheckin is co-checkin, which means his friends checked intothe same place within one week.
Besides mapping the variables represented in the simplifiedMGB model (Figure 2), we introduce two phenomenons tobetter predict the check-in motivation. Specifically, it containswhether the checkin is unique checkin and whether the checkinis co-checkin. The Figure 3 explains all the variables utilizedto capture the internal relations and predict user motivations.
C. User Motivation Model
The motivations we want to predict correspond to thedesires in MGB model. In order to predict motivations, weneed to utilize all the predictors (behavior attitude, subjectivenorm and perceived behavior control) which determine themotivations. In addition to that, we need the observations(behavior, individual phenomenon and social phenomenon)which are determined by motivations (Figure 3) to formthe optimization problem. The objective of the optimizationproblem is to minimize the difference between the estimatedbehavior and the actual behavior. By solving the optimizationproblem we can get the predicted motivations.
Firstly, we give the notations of the variables explained inlast section in Table 1.
Secondly, we explain how to calculate the features. Beforewe describe the details of explaining the variables, we firstintroduce several useful notations of this part.
Variable Factor NotationBehavior Attitude UT1 ↵0
uj
UT2 ↵1uj
Subjective Norm �lkuj
Perceived Behavior Control LT1 �0lk
LT2 �1lk
Desires motivation mi
Intention ni
Behavior biIndividual Phenomenon unique check-in p0iSocial Phenomenon co-checkin p1i
TABLE I: Notations of Prediction variables
Notation DefinitionCuj user uj’s total checkinsClk location lk’s total checkinsc0i check-in ci is co-checkinc1i check-in ci is unique check-inC0
ujthe set contains user uj’s total co-checkin
C1uj
the set contains user uj’s total unique check-inC0
lkthe set contains location lk’s total co-checkin
C1lk
the set contains location lk’s total unique check-inFuj the set contains all the friends of user uj
F lkuj the set user uj’s friends who have checked
in location lk
The factors belong to the variable on behavior attitudeexplains the user’s attitude towards check-in behavior. We pushour study further, instead of studying the user’s attitudes towardcheck-in behavior, we study the user’s attitudes towards check-in for social motivation or location motivation. We claim thatthe attitude of checkins drived by the two types of motivationsare totally different. For example, some people may just use theLBSN as a location recorder. They post check-in informationbecause they want to record where they have been to and markthe interesting places. They don’t use it for social interactionsor maybe they dislike it. In this case, the user’s attitudestoward check-in for location motivation is highly positive, butthe attitudes toward check-in for social motivation is negative.Distinguish the two attitudes can help us better predict checkinmotivations.
The definition for the first factor ↵0uj
is user uj’s attitudestoward check-in for social motivation. Specifically, the higherpercentage of user’s co-checkin the attitude towards social
motivation check-in is more positive. ↵0uj
=#C0
uj
#Cuj, where C0
uj
denotes user uj’s total co-checkin and Cuj denotes user uj’s
total checkins. Accordingly, ↵1uj
is defined as, ↵1uj
=#C1
uj
#Cuj,
where C1uj
denotes user uj’s total unique checkins and Cuj
denotes user uj’s total checkins.
The second factor is the user’s friends influence to hischeck-in at the location. We use a simple assumption here,which is each time the user’s friend post a check-in informa-tion, the user can see this information on his own page. Theassumption is true for LBSNs such as Gowalla, Foursquare.More of his friends check-in at the same place, the largerinfluence the user can receive from his friends. We justconsider the positive influence. The friend influence is defined
as, �lkuj
=#F
lkuj
#Fujwhere F lk
ujdenotes user uj’s total number of
friends who have checked in at location lk and Fuj denotes

Experiment – Case study 1
Fig. 4: User and his friends’ checkin motivation
1) Case Study: Now, we introduce two case studies todemonstrate the effectiveness of the proposed approach. Thetwo case studies are respectively targeting at social usersand social locations. Figure 4 displays an example from theexperiment. It represents a portion of the checkins of a socialuser and his friends. The user has 225 checkins, among thetotal 225 checkins 196 of them are socially motivated. Thepercentage of social motivation checkins of this user is 87%.Red circles in Figure 4 denote the user’s checkins. Blue squarescorrespond to friend 1’s checkins, and green triangles areassociated with checkins of friend 2. Each horizontal ordinatedenote one unique location, with mark indicate the time stamp.Each shape located above one horizontal ordinate and betweentwo marks means the checkin performed at that location andbetween those two time stamps. For example, if friend 1checked in at location 1 on 2/15/2010, there will be oneblue square above the first horizontal ordinate before the timestamp 3/1/2010. In Figure 4, all checkins of this social userare predicted to social motivation checkin. These checkins canbe categorized into two types: the user performed checkin inthe same location at the same day with his friend; the userperformed checkin again after he and his friend checked inthe same location at the same day. For example, the userperforms checkins at location 1 on 6/13/2010; location 2on 5/11/2010; and location 3 on 6/13/2010 and 8/24/2010belong to the type 1. The user performs checkins at location2 on 6/10/2010 and location 5 on 7/14/2010 belong to type2. For the first type of checkins, the user and his friend checkin at the same place on the same day which indicates that theuser and his friend may visit this place together. In addition,the user and his friend may visit some other places together.This type of checkins facilitate social connection, so they aresocially motivated. For the second type of checkins, the usercheck in the place soon after he and his friend check in thisplace together. It indicates that either the user is influenced byhis friend or he wants to connect with his friend by checkingin this place. Whether checking in places is for the purpose ofsocial contact or is the result of social influence, the checkinis socially motivated. Social user is the user who has manycheckins which are socially motivated. Since 87% percent ofthe user’s checkins are predicted as social motivation checkins,we categorize the user as social user. The reason why the useris social users is that he checks in different places togetherwith his different friends many times. If he and his friendcheckin together one time, it is an occasional case, which can’tconclude that the user is always socially motivated. However,if the user checkin together with his different friends manytimes, the user probably is a social user. The first case studydemonstrate that social motivation checkin and social user are
Fig. 5: Case Study - Location
predicted correctly.
The second case study shows a small portion of locations.By utilizing the location information contained in the secondGOWALLA dataset, we draw several locations in GoogleMap in Figure 5. Each pin represents a location, with redpin denoted social location and blue pin denoted non-sociallocation. Locations A,B,C,D,E are five Apple Stores; locationF is Starbucks Coffee; location G is Target; and location His John Adams Building. Since starbucks Coffee is the placewhere people may hangout together, it is a social location.Target is a department store where people buy what theyneed, so it is not a social location. John Adams Buildingis an office building, which is not a social location. Besidesclearly differentiating the social places for different types oflocations, the algorithm is able to distinguish the same type ofplaces at different locations. The three Apple Stores locatedin Manhattan have the higher percentage of social motivationcheckins than the other two. The Apple store in Paramus hasno social motivation checkins. It is likely due to that peoplelive in a suburb like Paramus are couples with kids, while alot of people live in Soho or NY city are young professionalswho are still singles or married without kids, and hence aremore likely to hangout at Apple stores. Apple store may notbe the place that people live in Paramus would like to hangout,as they may prefer other entertainment. For the three Applestores located in Manhattan, the percentage are also different.Apple store in Soho has the highest percentage. The secondcase study demonstrates that the algorithm is able to discoversocial locations.
Fig. 6: Experiment Result
2) Motivation Prediction Task: Based on the UCMP model(Section 3), we formalize the motivation prediction problemas an optimization problem. The algorithm predicts the mo-tivation of each checkin on GOWALLA dataset. 11.4% ofcheckins are predicted as social motivated, while the other

Experiment – Case study 2
Fig. 4: User and his friends’ checkin motivation
1) Case Study: Now, we introduce two case studies todemonstrate the effectiveness of the proposed approach. Thetwo case studies are respectively targeting at social usersand social locations. Figure 4 displays an example from theexperiment. It represents a portion of the checkins of a socialuser and his friends. The user has 225 checkins, among thetotal 225 checkins 196 of them are socially motivated. Thepercentage of social motivation checkins of this user is 87%.Red circles in Figure 4 denote the user’s checkins. Blue squarescorrespond to friend 1’s checkins, and green triangles areassociated with checkins of friend 2. Each horizontal ordinatedenote one unique location, with mark indicate the time stamp.Each shape located above one horizontal ordinate and betweentwo marks means the checkin performed at that location andbetween those two time stamps. For example, if friend 1checked in at location 1 on 2/15/2010, there will be oneblue square above the first horizontal ordinate before the timestamp 3/1/2010. In Figure 4, all checkins of this social userare predicted to social motivation checkin. These checkins canbe categorized into two types: the user performed checkin inthe same location at the same day with his friend; the userperformed checkin again after he and his friend checked inthe same location at the same day. For example, the userperforms checkins at location 1 on 6/13/2010; location 2on 5/11/2010; and location 3 on 6/13/2010 and 8/24/2010belong to the type 1. The user performs checkins at location2 on 6/10/2010 and location 5 on 7/14/2010 belong to type2. For the first type of checkins, the user and his friend checkin at the same place on the same day which indicates that theuser and his friend may visit this place together. In addition,the user and his friend may visit some other places together.This type of checkins facilitate social connection, so they aresocially motivated. For the second type of checkins, the usercheck in the place soon after he and his friend check in thisplace together. It indicates that either the user is influenced byhis friend or he wants to connect with his friend by checkingin this place. Whether checking in places is for the purpose ofsocial contact or is the result of social influence, the checkinis socially motivated. Social user is the user who has manycheckins which are socially motivated. Since 87% percent ofthe user’s checkins are predicted as social motivation checkins,we categorize the user as social user. The reason why the useris social users is that he checks in different places togetherwith his different friends many times. If he and his friendcheckin together one time, it is an occasional case, which can’tconclude that the user is always socially motivated. However,if the user checkin together with his different friends manytimes, the user probably is a social user. The first case studydemonstrate that social motivation checkin and social user are
Fig. 5: Case Study - Location
predicted correctly.
The second case study shows a small portion of locations.By utilizing the location information contained in the secondGOWALLA dataset, we draw several locations in GoogleMap in Figure 5. Each pin represents a location, with redpin denoted social location and blue pin denoted non-sociallocation. Locations A,B,C,D,E are five Apple Stores; locationF is Starbucks Coffee; location G is Target; and location His John Adams Building. Since starbucks Coffee is the placewhere people may hangout together, it is a social location.Target is a department store where people buy what theyneed, so it is not a social location. John Adams Buildingis an office building, which is not a social location. Besidesclearly differentiating the social places for different types oflocations, the algorithm is able to distinguish the same type ofplaces at different locations. The three Apple Stores locatedin Manhattan have the higher percentage of social motivationcheckins than the other two. The Apple store in Paramus hasno social motivation checkins. It is likely due to that peoplelive in a suburb like Paramus are couples with kids, while alot of people live in Soho or NY city are young professionalswho are still singles or married without kids, and hence aremore likely to hangout at Apple stores. Apple store may notbe the place that people live in Paramus would like to hangout,as they may prefer other entertainment. For the three Applestores located in Manhattan, the percentage are also different.Apple store in Soho has the highest percentage. The secondcase study demonstrates that the algorithm is able to discoversocial locations.
Fig. 6: Experiment Result
2) Motivation Prediction Task: Based on the UCMP model(Section 3), we formalize the motivation prediction problemas an optimization problem. The algorithm predicts the mo-tivation of each checkin on GOWALLA dataset. 11.4% ofcheckins are predicted as social motivated, while the other

Experiment – Motivation prediction
Fig. 4: User and his friends’ checkin motivation
1) Case Study: Now, we introduce two case studies todemonstrate the effectiveness of the proposed approach. Thetwo case studies are respectively targeting at social usersand social locations. Figure 4 displays an example from theexperiment. It represents a portion of the checkins of a socialuser and his friends. The user has 225 checkins, among thetotal 225 checkins 196 of them are socially motivated. Thepercentage of social motivation checkins of this user is 87%.Red circles in Figure 4 denote the user’s checkins. Blue squarescorrespond to friend 1’s checkins, and green triangles areassociated with checkins of friend 2. Each horizontal ordinatedenote one unique location, with mark indicate the time stamp.Each shape located above one horizontal ordinate and betweentwo marks means the checkin performed at that location andbetween those two time stamps. For example, if friend 1checked in at location 1 on 2/15/2010, there will be oneblue square above the first horizontal ordinate before the timestamp 3/1/2010. In Figure 4, all checkins of this social userare predicted to social motivation checkin. These checkins canbe categorized into two types: the user performed checkin inthe same location at the same day with his friend; the userperformed checkin again after he and his friend checked inthe same location at the same day. For example, the userperforms checkins at location 1 on 6/13/2010; location 2on 5/11/2010; and location 3 on 6/13/2010 and 8/24/2010belong to the type 1. The user performs checkins at location2 on 6/10/2010 and location 5 on 7/14/2010 belong to type2. For the first type of checkins, the user and his friend checkin at the same place on the same day which indicates that theuser and his friend may visit this place together. In addition,the user and his friend may visit some other places together.This type of checkins facilitate social connection, so they aresocially motivated. For the second type of checkins, the usercheck in the place soon after he and his friend check in thisplace together. It indicates that either the user is influenced byhis friend or he wants to connect with his friend by checkingin this place. Whether checking in places is for the purpose ofsocial contact or is the result of social influence, the checkinis socially motivated. Social user is the user who has manycheckins which are socially motivated. Since 87% percent ofthe user’s checkins are predicted as social motivation checkins,we categorize the user as social user. The reason why the useris social users is that he checks in different places togetherwith his different friends many times. If he and his friendcheckin together one time, it is an occasional case, which can’tconclude that the user is always socially motivated. However,if the user checkin together with his different friends manytimes, the user probably is a social user. The first case studydemonstrate that social motivation checkin and social user are
Fig. 5: Case Study - Location
predicted correctly.
The second case study shows a small portion of locations.By utilizing the location information contained in the secondGOWALLA dataset, we draw several locations in GoogleMap in Figure 5. Each pin represents a location, with redpin denoted social location and blue pin denoted non-sociallocation. Locations A,B,C,D,E are five Apple Stores; locationF is Starbucks Coffee; location G is Target; and location His John Adams Building. Since starbucks Coffee is the placewhere people may hangout together, it is a social location.Target is a department store where people buy what theyneed, so it is not a social location. John Adams Buildingis an office building, which is not a social location. Besidesclearly differentiating the social places for different types oflocations, the algorithm is able to distinguish the same type ofplaces at different locations. The three Apple Stores locatedin Manhattan have the higher percentage of social motivationcheckins than the other two. The Apple store in Paramus hasno social motivation checkins. It is likely due to that peoplelive in a suburb like Paramus are couples with kids, while alot of people live in Soho or NY city are young professionalswho are still singles or married without kids, and hence aremore likely to hangout at Apple stores. Apple store may notbe the place that people live in Paramus would like to hangout,as they may prefer other entertainment. For the three Applestores located in Manhattan, the percentage are also different.Apple store in Soho has the highest percentage. The secondcase study demonstrates that the algorithm is able to discoversocial locations.
Fig. 6: Experiment Result
2) Motivation Prediction Task: Based on the UCMP model(Section 3), we formalize the motivation prediction problemas an optimization problem. The algorithm predicts the mo-tivation of each checkin on GOWALLA dataset. 11.4% ofcheckins are predicted as social motivated, while the other

Experiment – Observation
Fig. 7: user’s and location’s distribution over percent of socialmotivation
88.6% of checkins are predicted as individually motivated. Werandomly pick 236 checkins, and invite the human to label themotivation of each checkin. Figure 6 shows the comparisonresult of the proposed method and the baseline Co-Checkin.Baseline Co-Checkin considers only the co-checkins as so-cially motivated and others are individually motivated. For boththe social and individual motivations, the proposed algorithmUCMP performs better than the baseline. Baseline Co-Checkinconsiders only the checkins which are co-checkins. However,the previous case study shows that the checkins which are theconsequence of social influenc also should be considered associally motivated checkin. Therefore, the proposed methodperforms better than the baseline.
3) Observation: Each checkin is performed by one userat one location. Knowing the motivations of all checkins canfacilitate the study of user’s general checkin motivation andlocation’s general checkin motivation. It can aid many practicalapplications, such as checkin prediction, advertisement recom-mendation and other applications. Figure 7 shows the factionof users/locations fall into different categories according tosocial motivation threshold. User’s social motivation valueis the percentage of user’s social motivation checkins. Forexample, when the social motivation threshold equals to 0.3,Figure 7 calculates fraction of users/locations whose socialmotivation value larger or equal to 0.3. 18% of users whosesocial motivation values are larger than 10%, and 6% oflocations whose social motivation value are larger than 10%.The fraction of users is higher than the fraction of locationswith social motivation value larger or equal to 10%. It is likelydue to the fact that the average number of users’ checkins ismuch smaller than the average number of locations’ checkins,so users are easier to have large percentage of social motivationcheckins. In addition, The locations’ checkin motivation canbe very diversified, so it is hard to find some locations whosepercent of social motivation checkins are very high. There areusers and locations have high percentage of social motivationcheckins, but also users and locations have low percentage ofsocial motivation checkins. It means users and locations havedifferent types with respect to social motivation checkins.
The Figure 7 reflects that users have different types.However, it is not clear that what kind of users are socialusers and what kind of locations are social locations. Onecharacteristic of social users is they have more checkins inthe same places. The average number of checkins per locationof social users is 1.97, while for all the other users is 1.50.It means that for social users they at least check in the sameplace twice in average. The same thing happens for sociallocations. The average number of checkins per user of sociallocations is 2.36, while for all the other locations is 1.67. More
Fig. 8: prediction accuracy of user’s future checkin
interestingly, the motivation data shows that social users aremore likely to checkin social locations. We randomly pick asocial user, among all the locations the user checked in theaverage percentage of social motivation checkins is 26%. It isa high number compared with 11%, which is the percentage ofsocial motivation checkins among all users. We also randomlypick a social location, almost all of the users checked in at thislocation have higher percentage of social motivation checkins.
B. Future Checkin Prediction
In the case study section’s examples, when a user hangsout with his friends in some places, he checks in this locationlater by himself. The motivation of the user’s later checkinis social motivation, because the user may also wants to co-checkin with his friends or he is influenced by his friends.He may also hang out with his other friends in this place orinfluence his other friends to visit this place. It gives us a hintthat the user’s future checkin may be related to user’s previouscheckin motivations.
1) Whether the user checkin in the future or not: We useGOWALLA dataset to perform the prediction task. There are20 month checkin information in this dataset. We use previous19 month checkins to predict the checkins of the last month.There are certain amount of new checkins (checkins performedby users who did not check in before) each month. It’s hardto predict users who did not check in before, since we donot have any information of the users. We simply delete thelast month’s checkins. The prediction method utilizes threekind of information: user’s previous checkin, friends’ previouscheckin, and user’s social motivation value. The user’s socialmotivation value can help decide whether the user will checkin at this place given the user’s friends already checked atthis place. If the user’s friend checked in at this place beforeand also the user is very social (the user like to interact withtheir friends by checking in places), it is likely that user willcheck in at this place later. Therefore, we use social motivationvalue as threshold to predict the future checkin. For example,if user’s social motivation value is larger than threshold 0.3and also user’s friend check in at this place before, we predictthe user will check in this place in the future. The accuracyis the combined accuracy of checkin and non-checkin cases.The overall accuracy is 65%.
2) Whether future checkin is socially motivated or not: Weonly utilize the previous information to predict the motivationsof future checkins. The previous information contain user’sprevious checkins, friends’ previous checkins and user’s socialmotivation value. Figure 9 shows the prediction results byusing the results of motivation prediction part (section 3)

Experiment – Prediction Tasks(1)
Fig. 7: user’s and location’s distribution over percent of socialmotivation
88.6% of checkins are predicted as individually motivated. Werandomly pick 236 checkins, and invite the human to label themotivation of each checkin. Figure 6 shows the comparisonresult of the proposed method and the baseline Co-Checkin.Baseline Co-Checkin considers only the co-checkins as so-cially motivated and others are individually motivated. For boththe social and individual motivations, the proposed algorithmUCMP performs better than the baseline. Baseline Co-Checkinconsiders only the checkins which are co-checkins. However,the previous case study shows that the checkins which are theconsequence of social influenc also should be considered associally motivated checkin. Therefore, the proposed methodperforms better than the baseline.
3) Observation: Each checkin is performed by one userat one location. Knowing the motivations of all checkins canfacilitate the study of user’s general checkin motivation andlocation’s general checkin motivation. It can aid many practicalapplications, such as checkin prediction, advertisement recom-mendation and other applications. Figure 7 shows the factionof users/locations fall into different categories according tosocial motivation threshold. User’s social motivation valueis the percentage of user’s social motivation checkins. Forexample, when the social motivation threshold equals to 0.3,Figure 7 calculates fraction of users/locations whose socialmotivation value larger or equal to 0.3. 18% of users whosesocial motivation values are larger than 10%, and 6% oflocations whose social motivation value are larger than 10%.The fraction of users is higher than the fraction of locationswith social motivation value larger or equal to 10%. It is likelydue to the fact that the average number of users’ checkins ismuch smaller than the average number of locations’ checkins,so users are easier to have large percentage of social motivationcheckins. In addition, The locations’ checkin motivation canbe very diversified, so it is hard to find some locations whosepercent of social motivation checkins are very high. There areusers and locations have high percentage of social motivationcheckins, but also users and locations have low percentage ofsocial motivation checkins. It means users and locations havedifferent types with respect to social motivation checkins.
The Figure 7 reflects that users have different types.However, it is not clear that what kind of users are socialusers and what kind of locations are social locations. Onecharacteristic of social users is they have more checkins inthe same places. The average number of checkins per locationof social users is 1.97, while for all the other users is 1.50.It means that for social users they at least check in the sameplace twice in average. The same thing happens for sociallocations. The average number of checkins per user of sociallocations is 2.36, while for all the other locations is 1.67. More
Fig. 8: prediction accuracy of user’s future checkin
interestingly, the motivation data shows that social users aremore likely to checkin social locations. We randomly pick asocial user, among all the locations the user checked in theaverage percentage of social motivation checkins is 26%. It isa high number compared with 11%, which is the percentage ofsocial motivation checkins among all users. We also randomlypick a social location, almost all of the users checked in at thislocation have higher percentage of social motivation checkins.
B. Future Checkin Prediction
In the case study section’s examples, when a user hangsout with his friends in some places, he checks in this locationlater by himself. The motivation of the user’s later checkinis social motivation, because the user may also wants to co-checkin with his friends or he is influenced by his friends.He may also hang out with his other friends in this place orinfluence his other friends to visit this place. It gives us a hintthat the user’s future checkin may be related to user’s previouscheckin motivations.
1) Whether the user checkin in the future or not: We useGOWALLA dataset to perform the prediction task. There are20 month checkin information in this dataset. We use previous19 month checkins to predict the checkins of the last month.There are certain amount of new checkins (checkins performedby users who did not check in before) each month. It’s hardto predict users who did not check in before, since we donot have any information of the users. We simply delete thelast month’s checkins. The prediction method utilizes threekind of information: user’s previous checkin, friends’ previouscheckin, and user’s social motivation value. The user’s socialmotivation value can help decide whether the user will checkin at this place given the user’s friends already checked atthis place. If the user’s friend checked in at this place beforeand also the user is very social (the user like to interact withtheir friends by checking in places), it is likely that user willcheck in at this place later. Therefore, we use social motivationvalue as threshold to predict the future checkin. For example,if user’s social motivation value is larger than threshold 0.3and also user’s friend check in at this place before, we predictthe user will check in this place in the future. The accuracyis the combined accuracy of checkin and non-checkin cases.The overall accuracy is 65%.
2) Whether future checkin is socially motivated or not: Weonly utilize the previous information to predict the motivationsof future checkins. The previous information contain user’sprevious checkins, friends’ previous checkins and user’s socialmotivation value. Figure 9 shows the prediction results byusing the results of motivation prediction part (section 3)

Experiment – Prediction Tasks(2)
Fig. 9: precision, recall, F-score of future cocheckin prediction
as benchmark. The thinner green curve represents the recall;the thinker red curve denotes the precision. The F-score isrepresented as blue bar. The figure indicate that when thesocial motivation threshold is 0.9, the experiment gets the bestprediction result. It means that when predicting future checkinmotivations, using the large social motivation value will getthe best result.
V. RELATED WORK
A. User Intention Modeling
The relation between attitudes and behavior is a centraltheme in modern social psychology. The researchers distin-guish three generations of attitude-behavior relation. Amongmany models which explained how the attitude leads to be-havior, Fish-bein and Ajzen’s theory of reasoned action ([13])attracted most attentions. It stimulate many later studies notonly on the meta-analysis ([11]) but also the practical studies.Two advantage of the theory is its parsimony and applicableto many fields. Though it has two advantages, the model can’tbe applied to purposive behaviors. The model of goal-directedbehavior ([5]) studied the purposive behavior by adding moreprediction variance and introducing a new construct whichexplains the existing predictors. It is suitable for modelinggoal-directed behaviors. As checkin behavior is pervasive inlocation-based social networks, it can be viewed as a goal-directed behavior. To explore the place or interacting with theirfriends, the user choose to check in at this place. Exploringthe motivation behind check-in behavior is an interesting yetuntouched field.
B. Check-in behavior study
As location-based social networks ([14], [15], [16], [17],[18]) provide user check-in and online communication, moreand more users are attracted to location-based social networks.Users post where the places they are on the location-basedsocial networks and add photos, and tips to communicate withfriends online or win rewards or get discounts. Location-basedsocial networks provide unique data sets which contain bothoffline activities and online interactions. It is for this reason,researchers are able to study why users want to use location-based social networks ([19], [20]), and why users are happyto share their check-in information with friends.
VI. CONCLUSION
This paper gives the first try to tackle the motivationprediction problem in LBSNs. It is not only a significantproblem for user behavior analysis, but also a potential benefitfor some other applications. Inspired by the previous socialpsychology studies, we construct the behavior formation model
and formulate the motivation prediction problem as an op-timization problem. Possible future extensions include twodirections. On one hand, deeply understanding the diversifiedmotivations on a large scale data set will benefit the user behav-ior studies and also the social psychology community. On theother hand, extending the existing framework to improve theresults of potential applications such as targeting advertisingand recommendation also worth trying.
REFERENCES
[1] E. Cho, S. A. Myers, and J. Leskovec, “Friendship and mobility: Friend-ship and mobility: User movement in location-based social networks,”KDD, 2011.
[2] J. Chang and E. Sun, “Location3: How users share and respond tolocation-based data on social,” ICWSM, 2011.
[3] A. Noulas, S. Scellato, C. Mascolo, and M. Pontil, “An empirical studyof geographic user activity patterns in foursquare,” ICWSM, 2011.
[4] S. Scellato, A. Noulas, R. Lambiotte, and C. Mascolo, “Socio-spatialproperties of online location-based social networks,” ICWSM, 2011.
[5] M. Perugini and R. Bagozzi, “The role of desires and anticipatedemotions in goal-directed behaviours: Broadening and deepening thetheory of planned behavior,” British Journal of Social Psychology,vol. 40, no. 1, pp. 79–98, 2001.
[6] P.-R. Lei, T.-J. Shen, W.-C. Peng, and I.-J. Su, “Exploring spatial-temporal trajectory model for location prediction,” MDM, 2011.
[7] V. W. Zheng, Y. Zheng, X. Xie, and Q. Yang, “Collaborative locationand activity recommendations with gps history data,” WWW, 2010.
[8] H. Gao, J. Tang, and H. Liu, “gscorr: modeling geo-social correlationsfor new check-ins on location-based social networks,” CIKM, 2012.
[9] K. Farrahi and D. Gatica-Perez, “Discovering routines from large-scalehuman locations using probabilistic topic models,” ACM Trans. Intell.Syst. Technol., 2011.
[10] E. H.-C. Lu, C.-Y. Lin, and V. S. Tseng, “Trip-mine: An efficient tripplanning approach with travel time constraints,” MDM, 2011.
[11] B. H. Sheppard, J. Hartwick, and P. R. Warshaw, “The theory of rea-soned action: A meta-analysis of past research with recommendationsfor modifications and future research,” Journal of Consumer Research,vol. 15, 1988.
[12] D. Hedeker, B. R. Flay, and J. Petraitis, “Estimating individual influ-ences of behavioral intentions:an application of random-effects mod-eling to the theory of reasoned action,” Journal of Consulting andClinical, vol. 64, no. 1, pp. 109–12–, 1996.
[13] M. Fishbein and I. Ajzen, “Belief, attitude, intention, and behavior: Anintroduction to theory and research,” Book, 1975.
[14] Z. Cheng, J. Caverlee, K. Lee, and D. Z. Sui, “Exploring millions offootprints in location sharing services,” ICWSM, 2011.
[15] M. Kim and D. Kotz, “Extracting a mobility model from real usertraces,” INFOCOM, 2006.
[16] M. C. Gonzalez, C. A. Hidalgo, and A.-L. Barabasi, “Understandingindividual human mobility patterns,” Nature, 2008.
[17] B. Jiang, J. Yin, and S. Zhao, “Characterizing human mobility patternsin a large street network,” PHYSICAL REVIEW, 2009.
[18] K. Lee, S. Hong, S. J. Kim, I. Rhee, and S. Chong, “Slaw: A newmobility model for human walks,” INFOCOM, 2009.
[19] J. Lindqvist, J. Cranshaw, J. Wiese, J. Hong, and J. Zimmerman, “I’mthe mayor of my house: Examining why people use foursquare - asocial-driven location sharing application,” CHI, 2011.
[20] H. Cramer, M. Rost, and L. E. Holmquist, “Proceedings of the 13thinternational conference on human computer interaction with mobiledevices and services,” MobileHCI, 2011.

Conclusion
• DesigncomputaIonalmoIvaIonpredicIonmodeltopredictcheckinmoIvaIon.
• DifferenIatesociallymoIvatedandindividuallymoIvatedcheckintohelppredictfuturecheckinorincreasetheeffectoflocaIon-basedadverIsement
Thankyou!


![Di spe r si on: A Tr e ndse tti ng He ur i sti c · 2020-03-12 · link between perceived brand globalness (PBG), perceived brand localness (PBL), and favorable [consumer] intentions”](https://static.fdocuments.net/doc/165x107/5f339aa7fbb0a4366f0bb3a4/di-spe-r-si-on-a-tr-e-ndse-tti-ng-he-ur-i-sti-c-2020-03-12-link-between-perceived.jpg)


